Exhibit 99.1
Growing Downstream Value Bryan Milton President, Fuels and Lubricants Company, Exxon Mobil Corporation Scotia Howard Weil Conference New Orleans - March 25, 2019
CAUTIONARY STATEMENT Forward-Looking Statements. Outlooks, projections, estimates, goals, discussions of potential, descriptions of business plans, objectives and resource potential, market expectations and other statements of future events or conditions in this presentation are forward-looking statements. Actual future results, including future earnings, cash flows, returns, margins, asset sales and other areas of financial and operating performance; energy supply and demand growth and investment requirements; the amount and mix of capital expenditures; project plans, timing, costs, and outcomes; efficiency gains; integration benefits; and the impact of technology could differ materially due to a number of factors. These include changes in oil, gas, or petrochemical prices and other market conditions affecting the oil, gas, and petrochemical industries; reservoir performance and revisions; timely completion of exploration and development projects and new Downstream and Chemical capital investments; regional differences in product concentration and demand; regional price differentials, war and other political or security disturbances; changes in law, taxes or other government regulation, including environmental regulations, taxes, trade policy and political sanctions; the outcome of commercial negotiations; the actions of competitors and customers; unexpected technological developments; general economic conditions, including the occurrence and duration of economic recessions; unforeseen technical difficulties; and other factors discussed here and under the heading “Factors Affecting Future Results” in the Investors section of our website at www.exxonmobil.com. The forward-looking statements in this presentation are based on management’s good faith plans, objectives and analysis as of the February 2, 2018 date of the Outlook for Energy, the September 28, 2018 date of our Downstream Spotlight, and the March 6, 2019 date of our Analyst Meeting presentation. Each of these presentations is available separately on our website. All forward looking statements included in this presentation and the assumptions made in developing them speak only as of the date of their original presentation. Inclusion of such forward-looking statements in this material does not represent an update or confirmation of such statements or their underlying assumptions as of any later date. We have not independently verified third party forward-looking statements. We assume no duty to update these statements as of any future date and neither this presentation nor the continued availability of this material in archive form on our website should be deemed to constitute an update or re-affirmation of these figures as of any future date. Any future update of these figures will be provided only through a public disclosure indicating that fact. Important Additional References. See the Supplemental Information included at the end of this presentation for additional information, definitions and assumptions used to develop the forward-looking statements included herein, especially with regards to potential future earnings and return on capital employed (ROCE), as well as information required by Regulation G with respect to non-GAAP measures and definitions and additional information on other terms used including resources. 2
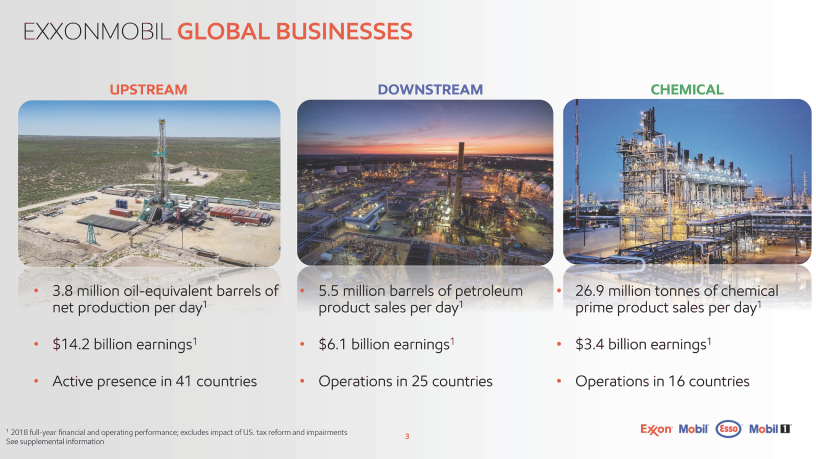
EXXONMOBIL GLOBAL BUSINESSES UPSTREAM DOWNSTREAM CHEMICAL 3.8 million oil-equivalent barrels of 5.5 million barrels of petroleum 26.9 million tonnes of chemical net production per day1 product sales per day1 prime product sales per day1 $14.2 billion earnings1 $6.1 billion earnings1 $3.4 billion earnings1 Active presence in 41 countries Operations in 25 countries Operations in 16 countries 1 2018 full-year financial and operating performance; excludes impact of US. tax reform and impairments 3 See supplemental information
Strong Downstream Portfolio leverage competitive advantages, capture market opportunities 4
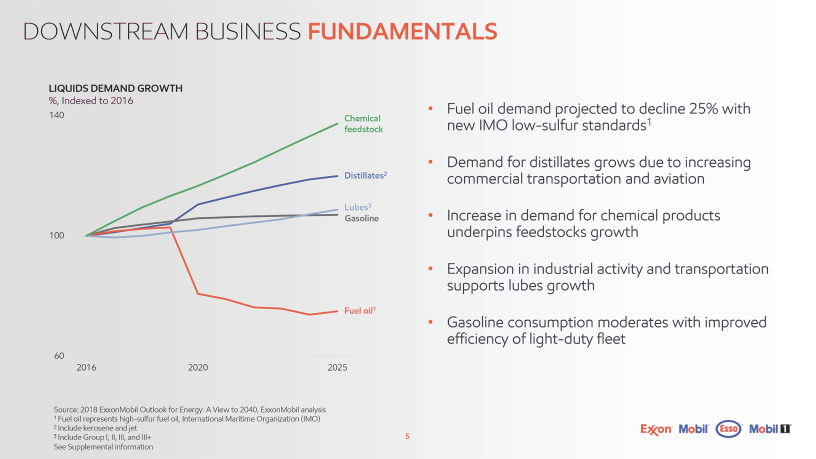
DOWNSTREAM BUSINESS FUNDAMENTALS LIQUIDS DEMAND GROWTH %, Indexed to 2016 Fuel oil demand projected to decline 25% with 140 Chemical new IMO low-sulfur standards1 feedstock Demand for distillates grows due to increasing Distillates2 commercial transportation and aviation Lubes3 Gasoline Increase in demand for chemical products 100 underpins feedstocks growth Expansion in industrial activity and transportation supports lubes growth Fuel oil1 Gasoline consumption moderates with improved efficiency of light-duty fleet 60 2016 2020 2025 Source: 2018 ExxonMobil Outlook for Energy: A View to 2040, ExxonMobil analysis 1 Fuel oil represents high-sulfur fuel oil, International Maritime Organization (IMO) 2 Include kerosene and jet 3 Include Group I, II, III, and III+ 5 See Supplemental information
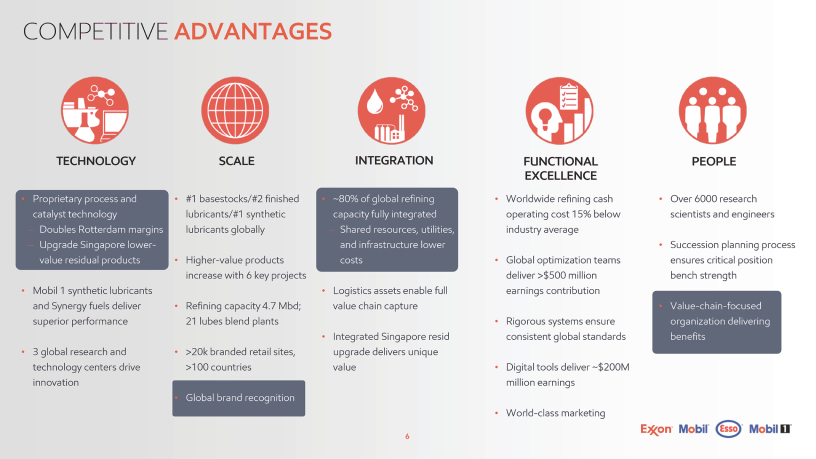
COMPETITIVE ADVANTAGES TECHNOLOGY Proprietary process and catalyst technology -Doubles Rotterdam margins -Upgrade Singapore lower- value residual products Mobil 1 synthetic lubricants and Synergy fuels deliver superior performance 3 global research and technology centers drive innovation SCALE #1 basestocks/#2 finished lubricants/#1 synthetic lubricants globally Higher-value products increase with 6 key projects Refining capacity 4.7 Mbd; 21 lubes blend plants >20k branded retail sites, >100 countries Global brand recognition INTEGRATION ~80% of global refining capacity fully integrated - Shared resources, utilities, and infrastructure lower costs Logistics assets enable full value chain capture Integrated Singapore resid upgrade delivers unique value FUNCTIONAL EXCELLENCE Worldwide refining cash operating cost 15% below industry average Global optimization teams deliver >$500 million earnings contribution Rigorous systems ensure consistent global standards Digital tools deliver ~$200M million earnings World-class marketing PEOPLE Over 6000 research scientists and engineers Succession planning process ensures critical position bench strength Value-chain-focused organization delivering benefits 6
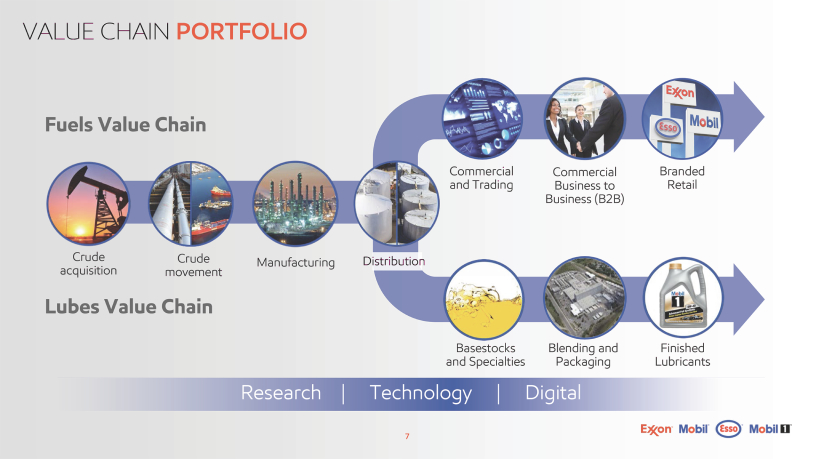
VALUE CHAIN PORTFOLIO Fuels Value Chain Commercial Commercial Branded and Trading Business to Retail Business (B2B) Crude Crude Manufacturing Distribution acquisition movement Lubes Value Chain Basestocks Blending and Finished and Specialties Packaging Lubricants Research | Technology | Digital 7
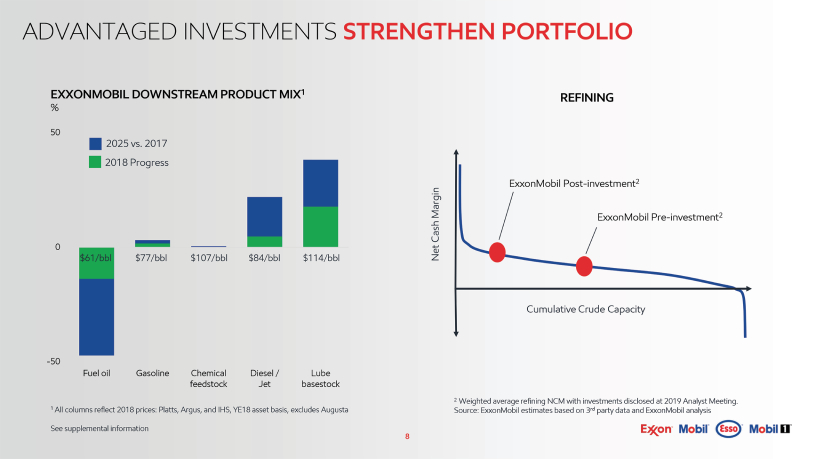
ADVANTAGED INVESTMENTS STRENGTHEN PORTFOLIO EXXONMOBIL DOWNSTREAM PRODUCT MIX1 % 50 2025 vs. 2017 2018 Progress 0 $61/bbl $77/bbl $107/bbl $84/bbl $114/bbl -50 Fuel oil Gasoline Chemical Diesel / Lube feedstock Jet basestock 1 All columns reflect 2018 prices: Platts, Argus, and IHS, YE18 asset basis, excludes Augusta See supplemental information REFINING ExxonMobilPost-investment2 MarginExxonMobil Pre-investment2 Cash Net Cumulative Crude Capacity 2 Weighted average refining NCM with investments disclosed at 2019 Analyst Meeting. Source: ExxonMobil estimates based on 3rd party data and ExxonMobil analysis 8
MAXIMIZING VALUE OF EXISTING ASSETS leading competition implementing differentiated confirmed by benchmarking technology solutions improving financial performance capturing opportunity with with advantaged projects industry-leading conversion maximizing refinery yields with continuous focus on improving global platform insights asset reliability 9
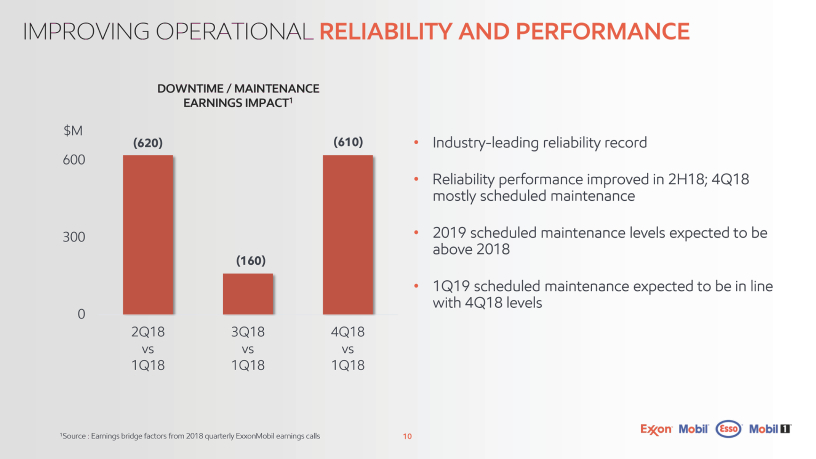
IMPROVING OPERATIONAL RELIABILITY AND PERFORMANCE DOWNTIME / MAINTENANCE EARNINGS IMPACT1 $M (620)(610) 600 300 (160) 0 2Q183Q184Q18 vsvsvs 1Q181Q181Q18 1Source : Earnings bridge factors from 2018 quarterly ExxonMobil earnings calls Industry-leading reliability record Reliability performance improved in 2H18; 4Q18 mostly scheduled maintenance 2019 scheduled maintenance levels expected to be above 2018 1Q19 scheduled maintenance expected to be in line with 4Q18 levels 10
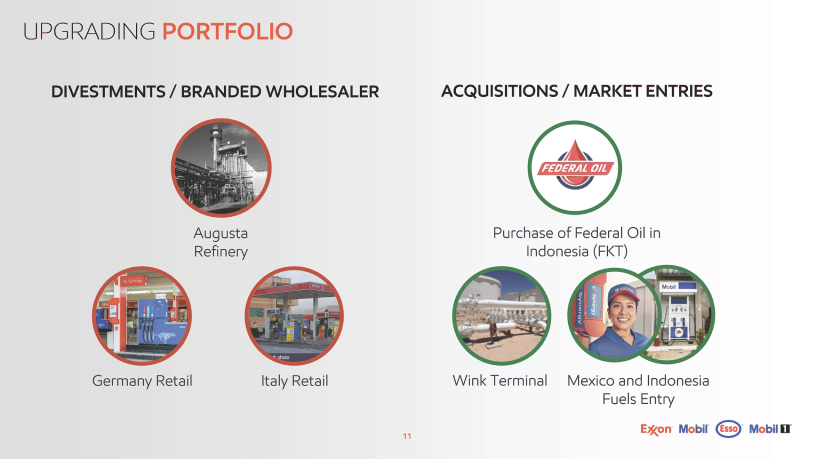
UPGRADING PORTFOLIO DIVESTMENTS / BRANDED WHOLESALER ACQUISITIONS / MARKET ENTRIES Augusta Purchase of Federal Oil in Refinery Indonesia (FKT) Germany Retail Italy Retail Wink Terminal Mexico and Indonesia Fuels Entry 11
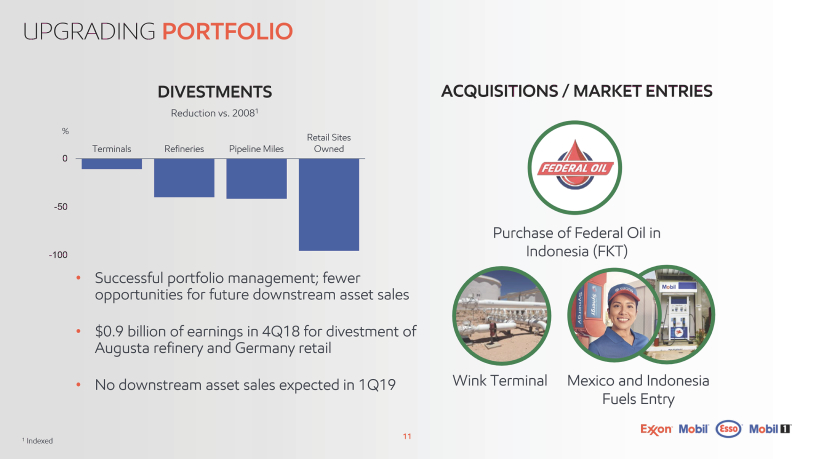
UPGRADING PORTFOLIO DIVESTMENTS Reduction vs. 20081 % Retail Sites TerminalsRefineriesPipeline MilesOwned 0 -50 -100 Successful portfolio management; fewer opportunities for future downstream asset sales $0.9 billion of earnings in 4Q18 for divestment of Augusta refinery and Germany retail No downstream asset sales expected in 1Q19 1 Indexed ACQUISITIONS / MARKET ENTRIES Purchase of Federal Oil in Indonesia (FKT) Wink Terminal Mexico and Indonesia Fuels Entry 11
Unique Value Growth product technology, brand strength, market entries 12
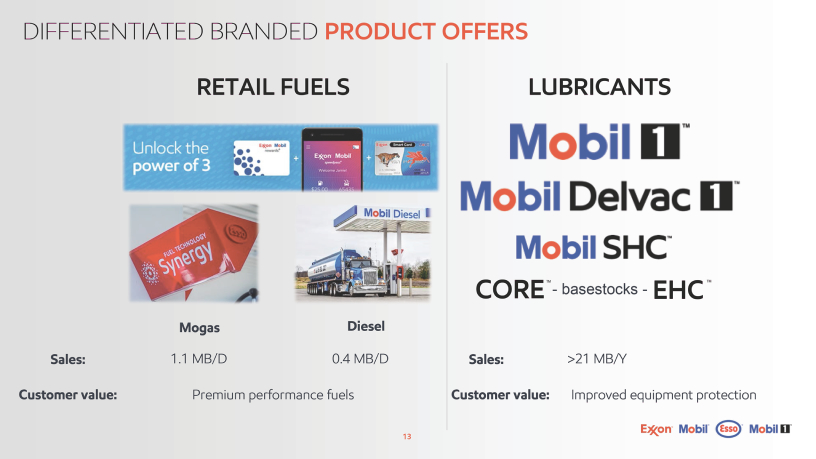
DIFFERENTIATED BRANDED PRODUCT OFFERS RETAIL FUELS LUBRICANTS CORETM - basestocks - EHCTM Mogas Diesel Sales: 1.1 MB/D 0.4 MB/D Sales: >21 MB/Y Customer value: Premium performance fuels Customer value: Improved equipment protection 13
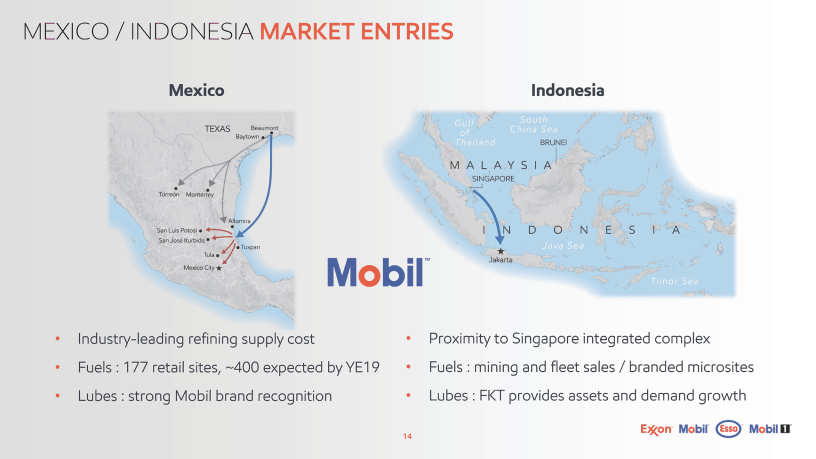
MEXICO / INDONESIA MARKET ENTRIES Mexico Industry-leading refining supply cost Fuels : 177 retail sites, ~400 expected by YE19 Lubes : strong Mobil brand recognition Indonesia Proximity to Singapore integrated complex Fuels : mining and fleet sales / branded microsites Lubes : FKT provides assets and demand growth 14
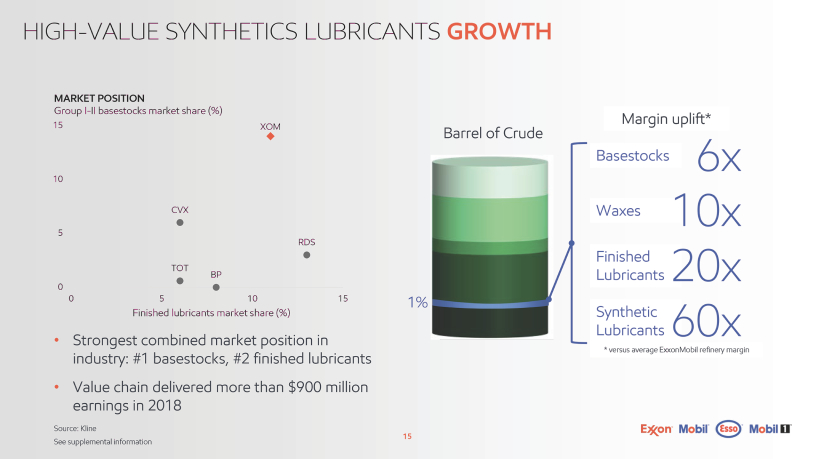
HIGH-VALUE SYNTHETICS LUBRICANTS GROWTH MARKET POSITION Group I-II basestocks market share (%) 15XOM 10 CVX 5 RDS TOT BP 0 051015 Finished lubricants market share (%) Strongest combined market position in industry: #1 basestocks, #2 finished lubricants Value chain delivered more than $900 million earnings in 2018 Source: Kline See supplemental information Margin uplift* Barrel of Crude Basestocks6x Waxes10x Finished Lubricants20x 1%Synthetic Lubricants60x * versus average ExxonMobil refinery margin 15
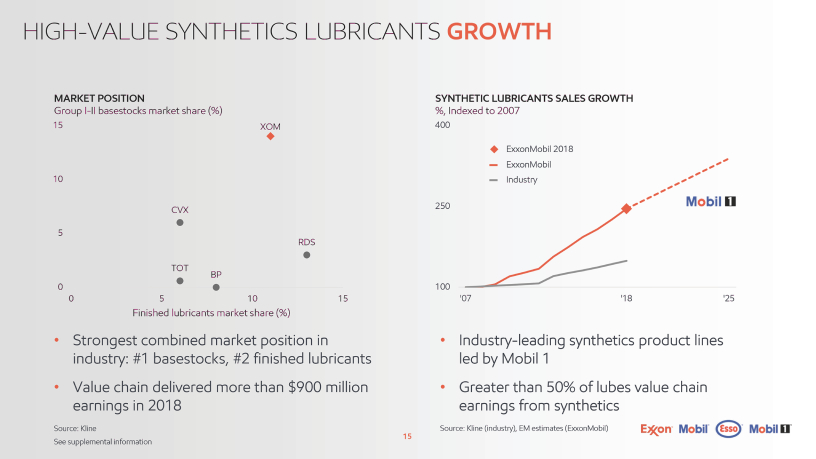
HIGH-VALUE SYNTHETICS LUBRICANTS GROWTH MARKET POSITION Group I-II basestocks market share (%) 15XOM 10 CVX 5 RDS TOT BP 0 051015 Finished lubricants market share (%) Strongest combined market position in industry: #1 basestocks, #2 finished lubricants Value chain delivered more than $900 million earnings in 2018 Source: Kline See supplemental information SYNTHETIC LUBRICANTS SALES GROWTH %, Indexed to 2007 400 ExxonMobil 2018 ExxonMobil Industry 250 100 ‘07’18’25 Industry-leading synthetics product lines led by Mobil 1 Greater than 50% of lubes value chain earnings from synthetics Source: Kline (industry), EM estimates (ExxonMobil) 15
Early Insight Capture market driven, advantaged investments, maximize returns 16
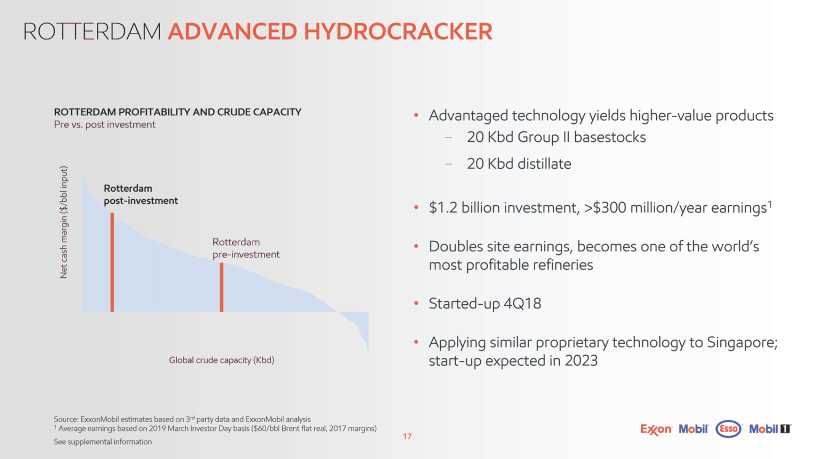
ROTTERDAM ADVANCED HYDROCRACKER ROTTERDAM PROFITABILITY AND CRUDE CAPACITY Pre vs. post investment input) Rotterdam /bbl post-investment ( $ margin Rotterdam cash pre-investment Net Global crude capacity (Kbd) Source: ExxonMobil estimates based on 3rd party data and ExxonMobil analysis 1 Average earnings based on 2019 March Investor Day basis ($60/bbl Brent flat real, 2017 margins) See supplemental information Advantaged technology yields higher-value products - 20 Kbd Group II basestocks - 20 Kbd distillate $1.2 billion investment, >$300 million/year earnings1 Doubles site earnings, becomes one of the world’s most profitable refineries Started-up 4Q18 Applying similar proprietary technology to Singapore; start-up expected in 2023 17
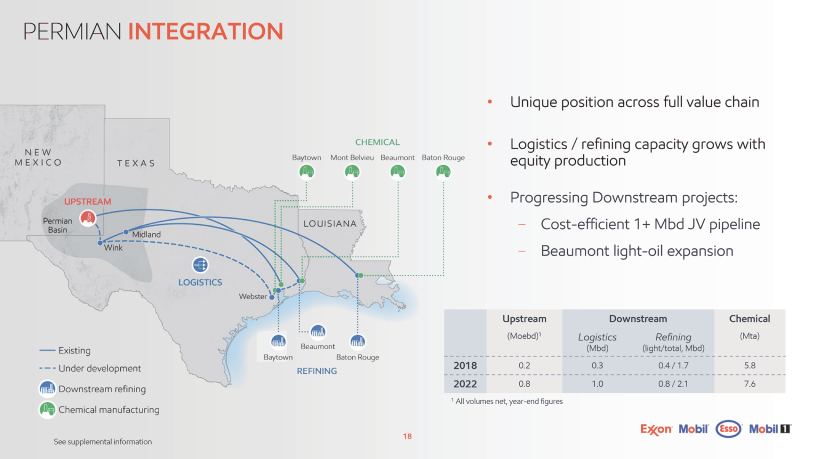
PERMIAN INTEGRATION See supplemental information Unique position across full value chain Logistics / refining capacity grows with equity production Progressing Downstream projects: - Cost-efficient 1+ Mbd JV pipeline - Beaumont light-oil expansion Upstream Downstream Chemical (Moebd)1LogisticsRefining(Mta) (Mbd)(light/total, Mbd) 0.20.30.4 / 1.75.8 0.81.00.8 / 2.17.6 1 All volumes net, year-end figures 18
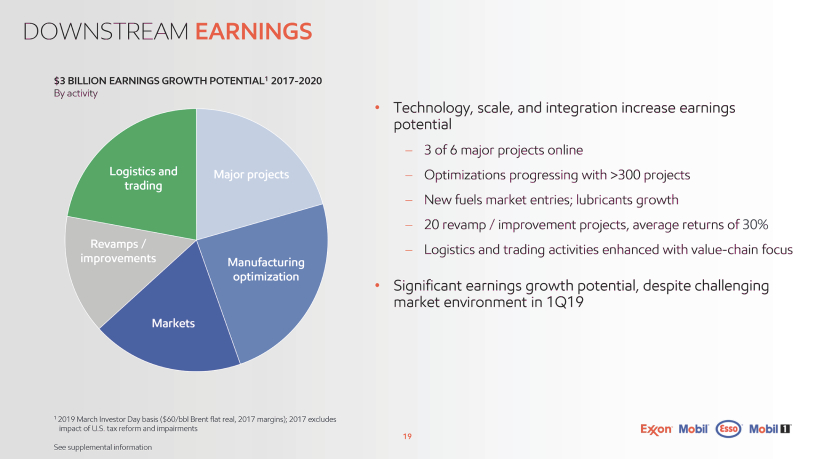
DOWNSTREAM EARNINGS $3 BILLION EARNINGS GROWTH POTENTIAL1 2017-2020 By activity Logistics and Major projects trading Revamps / improvements Manufacturing optimization Markets 1 2019 March Investor Day basis ($60/bbl Brent flat real, 2017 margins); 2017 excludes impact of U.S. tax reform and impairments See supplemental information Technology, scale, and integration increase earnings potential - 3 of 6 major projects online - Optimizations progressing with >300 projects - New fuels market entries; lubricants growth - 20 revamp / improvement projects, average returns of 30% - Logistics and trading activities enhanced with value-chain focus Significant earnings growth potential, despite challenging market environment in 1Q19 19
Market Conditions robust long-term / short-term swings 20
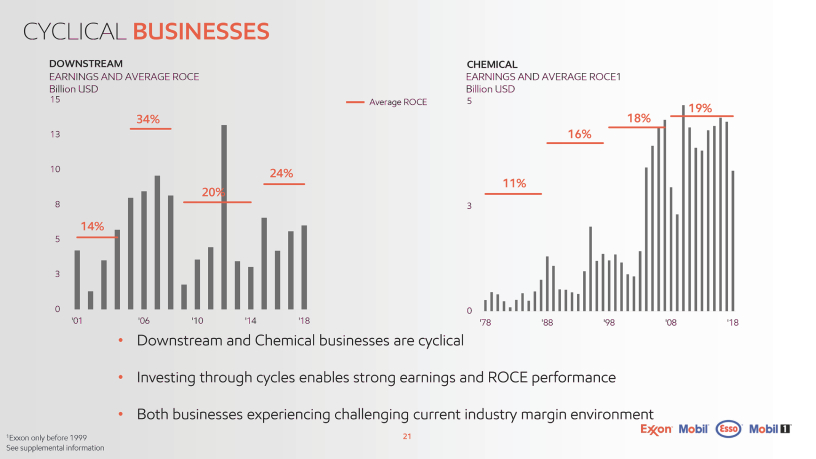
CYCLICAL BUSINESSES DOWNSTREAM EARNINGS AND AVERAGE ROCE Billion USD 15 34% 13 1024% 20% 8 14% 5 3 0 ‘01’06’10’14’18 Average ROCE CHEMICAL EARNINGS AND AVERAGE ROCE1 Billion USD 519% 18% 16% 11% 3 0 ‘78’88’98’08’18 Downstream and Chemical businesses are cyclical Investing through cycles enables strong earnings and ROCE performance Both businesses experiencing challenging current industry margin environment 1Exxon only before 1999 21 See supplemental information
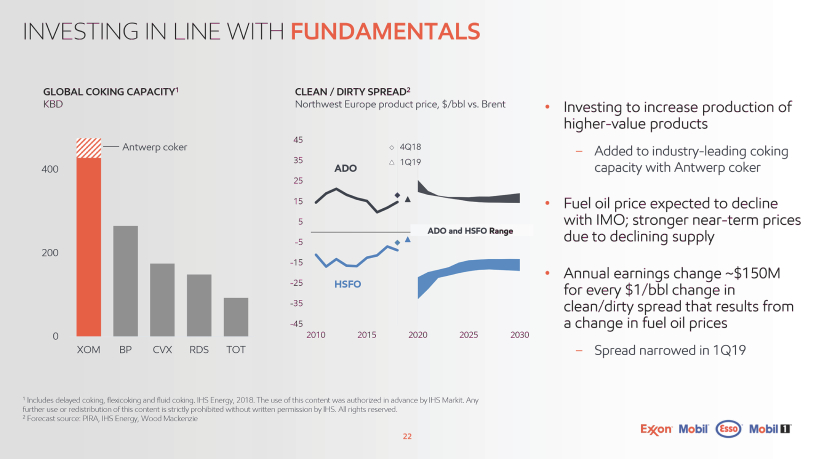
INVESTING IN LINE WITH FUNDAMENTALS GLOBAL COKING CAPACITY1 KBD Antwerp coker 400 200 0 XOM BP CVX RDS TOT 1 Includes delayed coking, flexicoking and fluid coking. IHS Energy, 2018. The use of this content was authorized in advance by IHS Markit. Any further use or redistribution of this content is strictly prohibited without written permission by IHS. All rights reserved. 2 Forecast source: PIRA, IHS Energy, Wood Mackenzie CLEAN / DIRTY SPREAD2 Northwest Europe product price, $/bbl vs. Brent 45 4Q18 351Q19 ADO 25 15 5 ADO and HSFO Range -5 -15 -25HSFO -35 -45 20102015202020252030 Investing to increase production of higher-value products - Added to industry-leading coking capacity with Antwerp coker Fuel oil price expected to decline with IMO; stronger near-term prices due to declining supply Annual earnings change ~$150M for every $1/bbl change in clean/dirty spread that results from a change in fuel oil prices - Spread narrowed in 1Q19 22
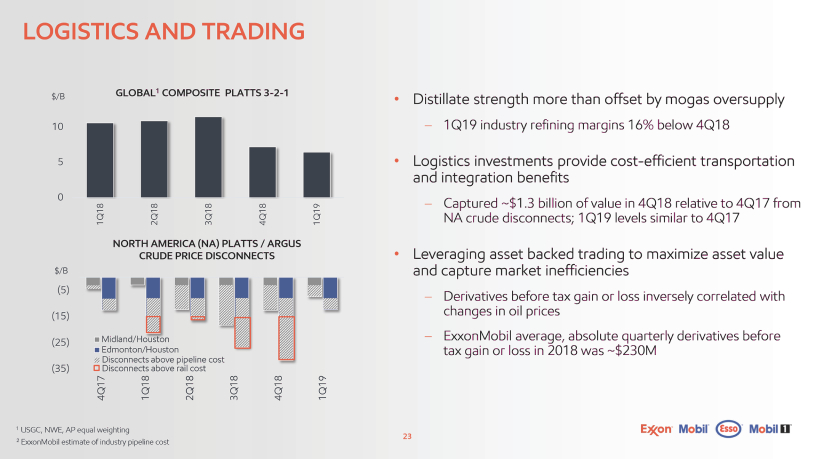
LOGISTICS AND TRADING $/B GLOBAL1 COMPOSITE PLATTS 3-2-1 10 5 0 1Q182Q183Q184Q181Q19 NORTH AMERICA (NA) PLATTS / ARGUS CRUDE PRICE DISCONNECTS $/B (5) (15) (25)Midland/Houston Edmonton/Houston Disconnects above pipeline cost (35)Disconnects above rail cost 4Q171Q182Q183Q184Q181Q19 1 USGC, NWE, AP equal weighting 2 ExxonMobil estimate of industry pipeline cost Distillate strength more than offset by mogas oversupply - 1Q19 industry refining margins 16% below 4Q18 Logistics investments provide cost-efficient transportation and integration benefits - Captured ~$1.3 billion of value in 4Q18 relative to 4Q17 from NA crude disconnects; 1Q19 levels similar to 4Q17 Leveraging asset backed trading to maximize asset value and capture market inefficiencies - Derivatives before tax gain or loss inversely correlated with changes in oil prices - ExxonMobil average, absolute quarterly derivatives before tax gain or loss in 2018 was ~$230M 23
DOWNSTREAM KEY MESSAGES Competitive advantages enable long-term value creation Growth in earnings potential driven by advantaged investments, technology, and operations Leveraging global brand recognition and marketing to increase sales of premium fuels and lubricants Integration with logistics and manufacturing combined with asset backed trading facilitate maximum benefit capture along value chain Business fundamentals underpin earnings growth plans - Short-term imbalances make near-term market environment challenging 24
Growing Downstream Value Bryan Milton President, Fuels and Lubricants Company, Exxon Mobil Corporation Scotia Howard Weil Conference New Orleans - March 25, 2019
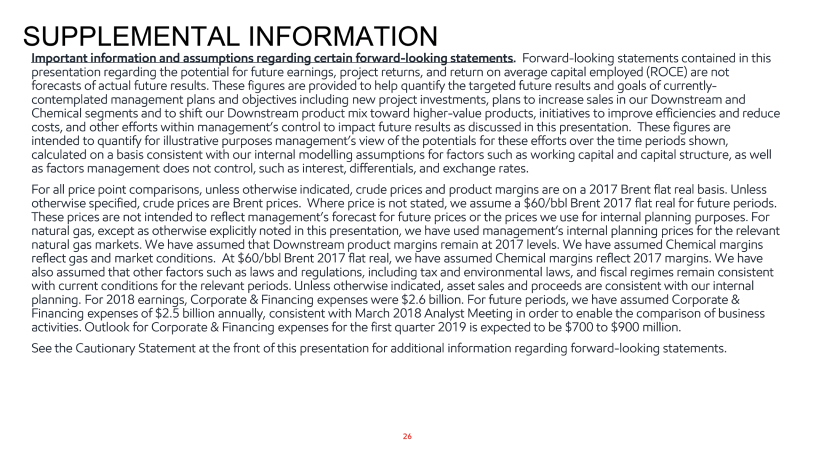
SUPPLEMENTAL INFORMATION Important information and assumptions regarding certain forward-looking statements. Forward-looking statements contained in this presentation regarding the potential for future earnings, project returns, and return on average capital employed (ROCE) are not forecasts of actual future results. These figures are provided to help quantify the targeted future results and goals of currently-contemplated management plans and objectives including new project investments, plans to increase sales in our Downstream and Chemical segments and to shift our Downstream product mix toward higher-value products, initiatives to improve efficiencies and reduce costs, and other efforts within management’s control to impact future results as discussed in this presentation. These figures are intended to quantify for illustrative purposes management’s view of the potentials for these efforts over the time periods shown, calculated on a basis consistent with our internal modelling assumptions for factors such as working capital and capital structure, as well as factors management does not control, such as interest, differentials, and exchange rates. For all price point comparisons, unless otherwise indicated, crude prices and product margins are on a 2017 Brent flat real basis. Unless otherwise specified, crude prices are Brent prices. Where price is not stated, we assume a $60/bbl Brent 2017 flat real for future periods. These prices are not intended to reflect management’s forecast for future prices or the prices we use for internal planning purposes. For natural gas, except as otherwise explicitly noted in this presentation, we have used management’s internal planning prices for the relevant natural gas markets. We have assumed that Downstream product margins remain at 2017 levels. We have assumed Chemical margins reflect gas and market conditions. At $60/bbl Brent 2017 flat real, we have assumed Chemical margins reflect 2017 margins. We have also assumed that other factors such as laws and regulations, including tax and environmental laws, and fiscal regimes remain consistent with current conditions for the relevant periods. Unless otherwise indicated, asset sales and proceeds are consistent with our internal planning. For 2018 earnings, Corporate & Financing expenses were $2.6 billion. For future periods, we have assumed Corporate & Financing expenses of $2.5 billion annually, consistent with March 2018 Analyst Meeting in order to enable the comparison of business activities. Outlook for Corporate & Financing expenses for the first quarter 2019 is expected to be $700 to $900 million. See the Cautionary Statement at the front of this presentation for additional information regarding forward-looking statements. 26
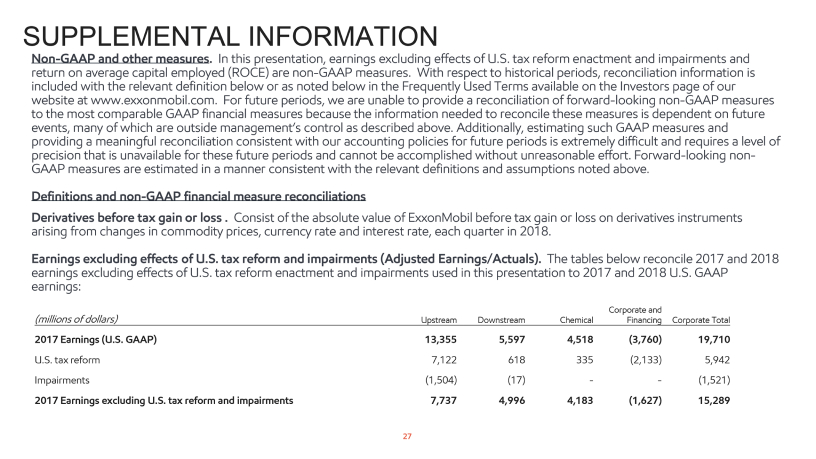
SUPPLEMENTAL INFORMATION Non-GAAP and other measures. In this presentation, earnings excluding effects of U.S. tax reform enactment and impairments and return on average capital employed (ROCE) are non-GAAP measures. With respect to historical periods, reconciliation information is included with the relevant definition below or as noted below in the Frequently Used Terms available on the Investors page of our website at www.exxonmobil.com. For future periods, we are unable to provide a reconciliation of forward-looking non-GAAP measures to the most comparable GAAP financial measures because the information needed to reconcile these measures is dependent on future events, many of which are outside management’s control as described above. Additionally, estimating such GAAP measures and providing a meaningful reconciliation consistent with our accounting policies for future periods is extremely difficult and requires a level of precision that is unavailable for these future periods and cannot be accomplished without unreasonable effort. Forward-looking non-GAAP measures are estimated in a manner consistent with the relevant definitions and assumptions noted above. Definitions and non-GAAP financial measure reconciliations Derivatives before tax gain or loss . Consist of the absolute value of ExxonMobil before tax gain or loss on derivatives instruments arising from changes in commodity prices, currency rate and interest rate, each quarter in 2018. Earnings excluding effects of U.S. tax reform and impairments (Adjusted Earnings/Actuals). The tables below reconcile 2017 and 2018 earnings excluding effects of U.S. tax reform enactment and impairments used in this presentation to 2017 and 2018 U.S. GAAP earnings: Corporate and (millions of dollars)UpstreamDownstreamChemicalFinancingCorporate Total 2017 Earnings (U.S. GAAP)13,3555,5974,518(3,760)19,710 U.S. tax reform7,122618335(2,133)5,942 Impairments(1,504)(17)--(1,521) 2017 Earnings excluding U.S. tax reform and impairments7,7374,9964,183(1,627)15,289 27
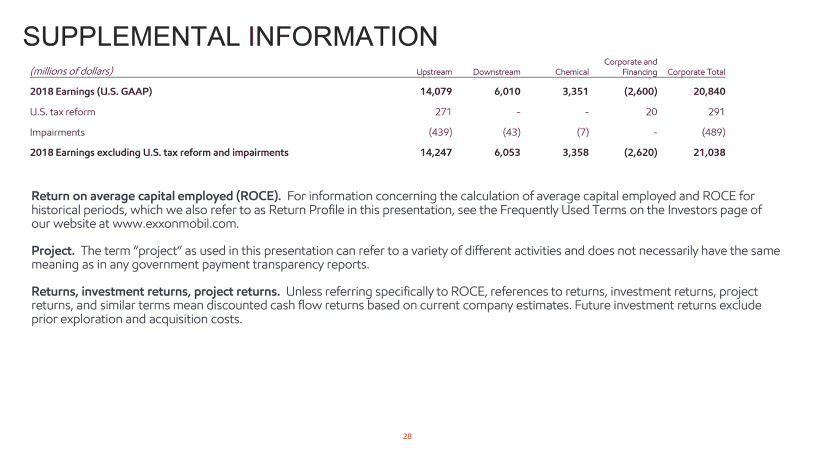
SUPPLEMENTAL INFORMATION Corporate and (millions of dollars)UpstreamDownstreamChemicalFinancingCorporate Total 2018 Earnings (U.S. GAAP)14,0796,0103,351(2,600)20,840 U.S. tax reform271--20291 Impairments(439)(43)(7)-(489) 2018 Earnings excluding U.S. tax reform and impairments14,2476,0533,358(2,620)21,038 Return on average capital employed (ROCE). For information concerning the calculation of average capital employed and ROCE for historical periods, which we also refer to as Return Profile in this presentation, see the Frequently Used Terms on the Investors page of our website at www.exxonmobil.com. Project. The term “project” as used in this presentation can refer to a variety of different activities and does not necessarily have the same meaning as in any government payment transparency reports. Returns, investment returns, project returns. Unless referring specifically to ROCE, references to returns, investment returns, project returns, and similar terms mean discounted cash flow returns based on current company estimates. Future investment returns exclude prior exploration and acquisition costs. 28
SUPPLEMENTAL INFORMATION Other information ExxonMobil has business relationships with thousands of customers, suppliers, governments, and others. For convenience and simplicity, words such as venture, joint venture, partnership, co-venturer, and partner are used to indicate business and other relationships involving common activities and interests, and those words may not indicate precise legal relationships. Competitor data is based on publicly available information and, where estimated or derived (e.g., ROCE), done so on a consistent basis with ExxonMobil data. Future competitor data, unless otherwise noted, is taken from publicly available statements or disclosures by that competitor and has not been independently verified by ExxonMobil or any third party. We note that certain competitors report financial information under accounting standards other than U.S. GAAP (i.e., IFRS). 29
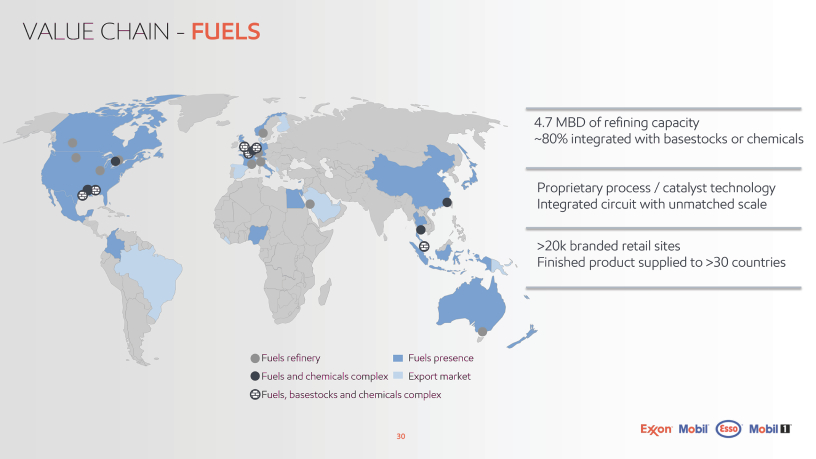
VALUE CHAIN - FUELS 4.7 MBD of refining capacity ~80% integrated with basestocks or chemicals Proprietary process / catalyst technology Integrated circuit with unmatched scale >20k branded retail sites Finished product supplied to >30 countries Fuels refinery Fuels presence Fuels and chemicals complex Export market Fuels, basestocks and chemicals complex 30
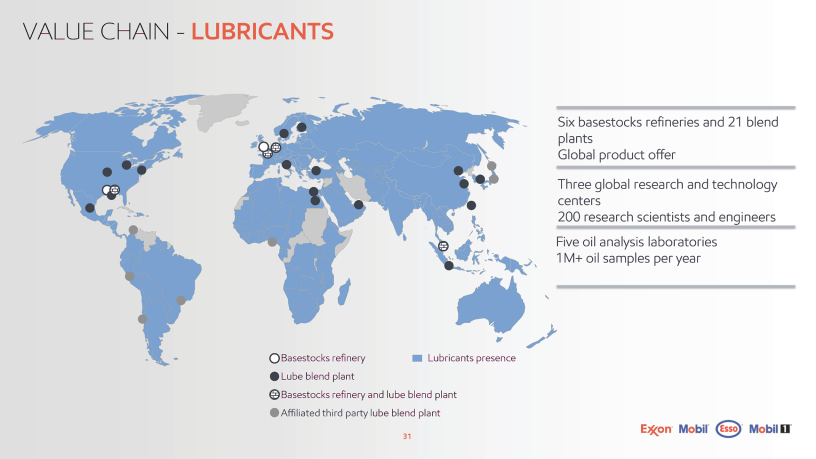
VALUE CHAIN - LUBRICANTS Six basestocks refineries and 21 blend plants Global product offer Three global research and technology centers 200 research scientists and engineers Five oil analysis laboratories 1M+ oil samples per year Basestocks refinery Lubricants presence Lube blend plant Basestocks refinery and lube blend plant Affiliated third party lube blend plant 31
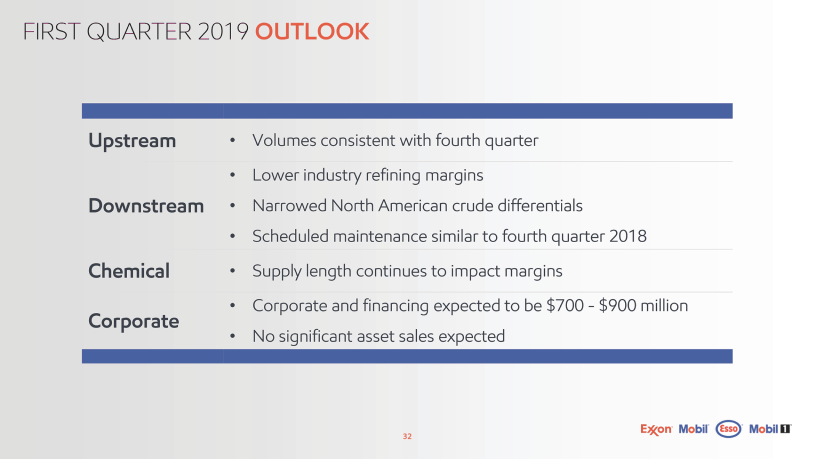
FIRST QUARTER 2019 OUTLOOK Upstream Volumes consistent with fourth quarter Lower industry refining margins Downstream Narrowed North American crude differentials Scheduled maintenance similar to fourth quarter 2018 Chemical Supply length continues to impact margins Corporate and financing expected to be $700 - $900 million Corporate No significant asset sales expected 32