Exhibit 99.2
| Exhibit 99.2
|
2017
Analyst meeting
New York Stock Exchange
March 1, 2017
ExxonMobil
|
|
Cautionary statement
Forward-looking statements
Outlooks, projections, estimates, targets, business plans, and other statements of future events or conditions in this presentation or the subsequent discussion period are forward-looking statements. Actual future results, including financial and operating performance; demand growth and energy mix; ExxonMobil’s production growth and mix; the amount and mix of capital expenditures; future distributions; reserve and resource additions and recoveries; project plans, timing, costs, and capacities; efficiency gains; cost savings; integration benefits; product sales and mix; production rates; and the impact of technology could differ materially due to a number of factors. These include changes in oil or gas prices or other market conditions affecting the oil, gas, and petrochemical industries; reservoir performance; timely completion of development projects; war and other political or security disturbances; changes in law or government regulation, including environmental regulations and political sanctions; the outcome of commercial negotiations; the actions of competitors and customers; unexpected technological developments; general economic conditions, including the occurrence and duration of economic recessions; unforeseen technical difficulties; and other factors discussed here and under the heading “Factors Affecting Future Results” in the Investors section of our website at exxonmobil.com.
See also Item 1A of ExxonMobil’s 2016 Form 10-K. Forward-looking statements are based on management’s knowledge and reasonable expectations on the date hereof, and we assume no duty to update these statements as of any future date.
Frequently used terms
References to resources, resource base, recoverable resources, and similar terms include quantities of oil and gas that are not yet classified as proved reserves but that we believe will likely be moved into the proved reserves category and produced in the future. “Proved reserves” in this presentation are presented using the SEC pricing basis in effect for the year presented, except that for years prior to 2009, proved reserves were determined using the price and cost assumptions we used in managing the business, not historical prices used in SEC definitions; oil sands and equity company reserves are included for all periods. For definitions of, and information regarding, reserves, return on average capital employed, cash flow from operations and asset sales, free cash flow, and other terms used in this presentation, including information required by SEC Regulation G, see the “Reference materials” included with this presentation and “Frequently Used Terms” posted on the Investors section of our website. The Financial and Operating Review on our website also shows ExxonMobil’s net interest in specific projects. As used in this presentation, “rate of return”, “cash flow returns”, and “return(s)” (unless referring to ROCE) mean discounted cash flow returns based on current company estimates.
The term “project” as used in this presentation can refer to a variety of different activities and does not necessarily have the same meaning as in any government payment transparency reports.
2 Welcome
|
|
9:45 Welcome
ExxonMobil investment case
Investment plans
Upstream: Maximizing portfolio value
Downstream & Chemical: Building on strength
Closing
11:00 Break
11:30 Q&A
12:30 Meeting concludes
Agenda
|
|
ExxonMobil investment case
|
|
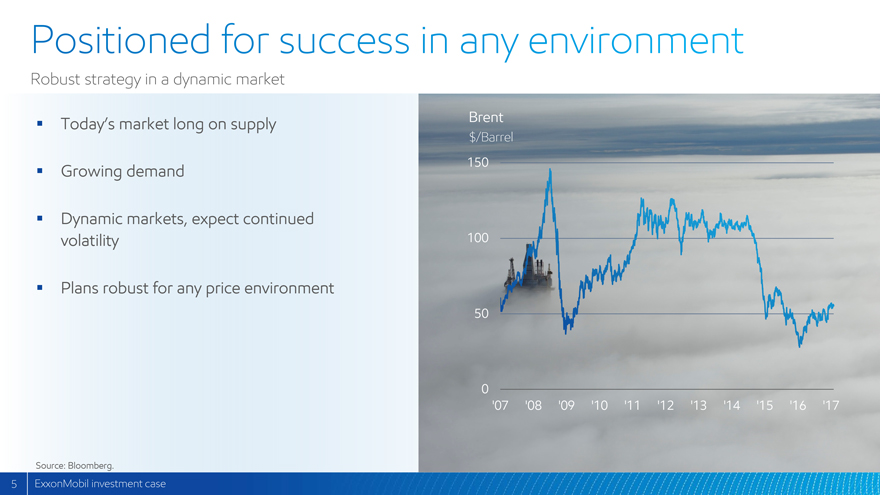
Positioned for success in any environment
Robust strategy in a dynamic market
Today’s market long on supply
Growing demand
Dynamic markets, expect continued volatility
Plans robust for any price environment
Brent
$/Barrel
150
100
50
0
‘07 ‘08 ‘09 ‘10 ‘11 ‘12 ‘13 ‘14 ‘15 ‘16 ‘17
Source: Bloomberg.
5 ExxonMobil investment case
|
|
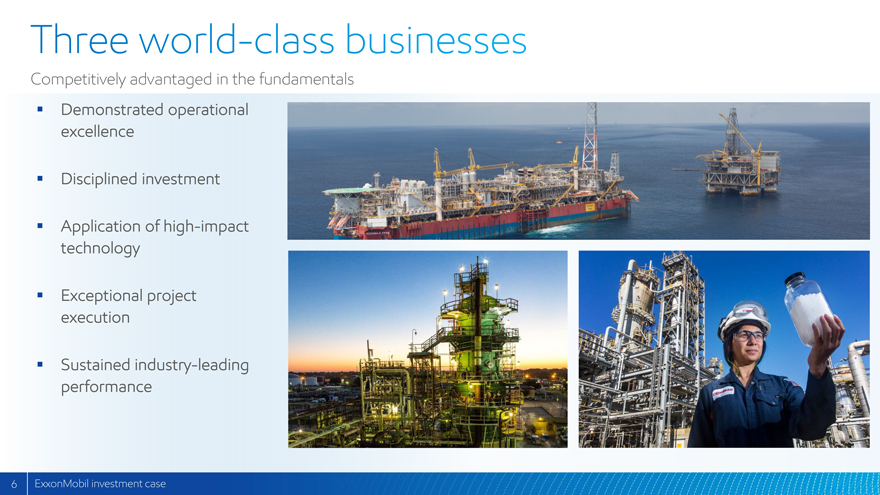
Three world-class business
Competitively advantaged in the fundamentals
Demonstrated operational excellence
Disciplined investment
Application of high-impact technology
Exceptional project execution
Sustained industry-leading performance
6 ExxonMobil investment case
|
|
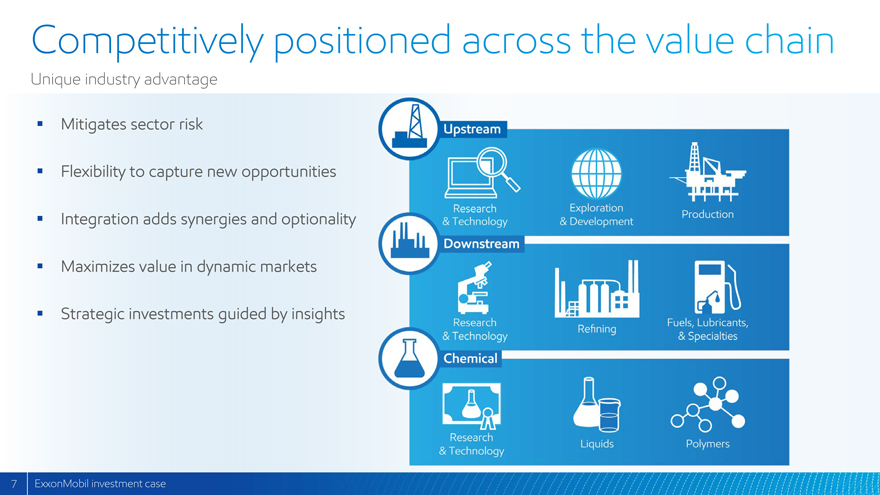
Competitively positioned across the value chain
Unique industry advantage
Mitigates sector risk
Flexibility to capture new opportunities
Integration adds synergies and optionality
Maximizes value in dynamic markets
Strategic investments guided by insights
Upstream
Research & Technology Exploration & Development Production
Downstream
Research & Technology Refining Fuels, Lubricants, & Specialties
Chemical
Research & Technology Liquids Polymers
7 ExxonMobil investment case
|
|
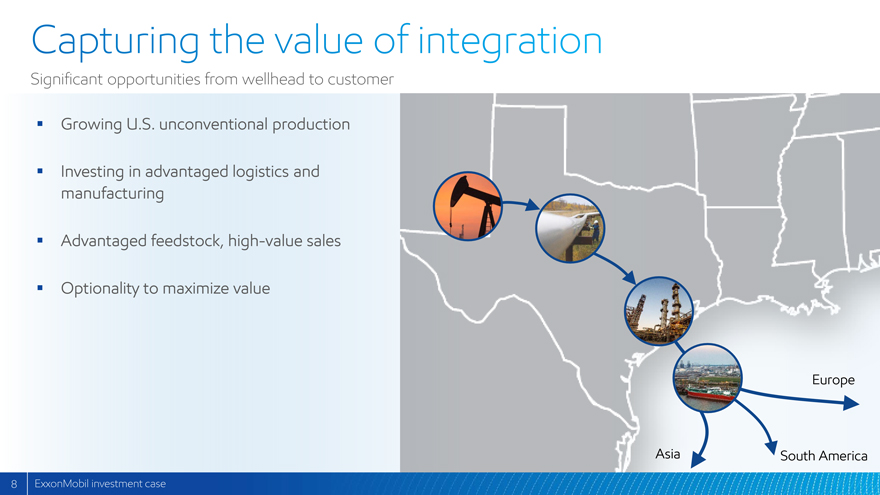
Capturing the value of integration
Significant opportunities from wellhead to customer
Growing U.S. unconventional production
Investing in advantaged logistics and manufacturing
Advantaged feedstock, high-value sales
Optionality to maximize value
Europe
Asia South America
8 ExxonMobil investment case
|
|
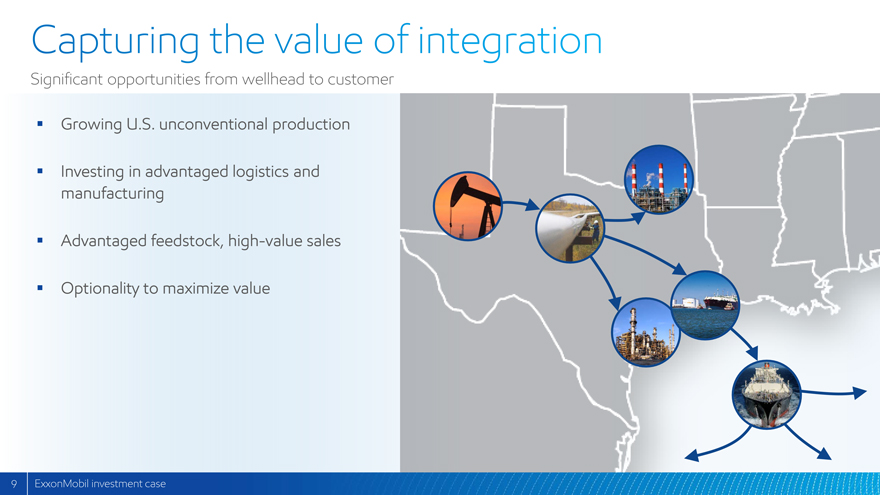
Capturing the value of integration
Significant opportunities from wellhead to customer
Growing U.S. unconventional production
Investing in advantaged logistics and manufacturing
Advantaged feedstock, high-value sales
Optionality to maximize value
9 ExxonMobil investment case
|
|
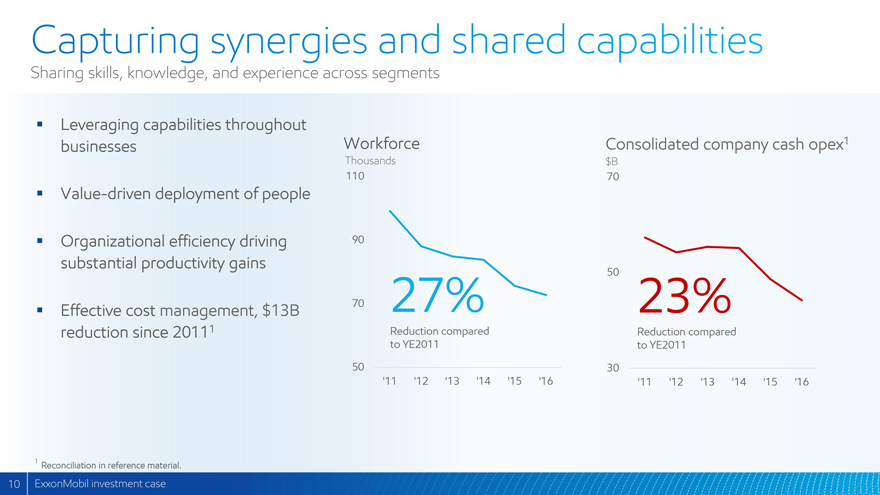
Capturing synergies and shared capabilities
Sharing skills, knowledge, and experience across segments
Leveraging capabilities throughout businesses
Value-driven deployment of people
Organizational efficiency driving substantial productivity gains
Effective cost management, $13B reduction since 20111
Workforce Consolidated company cash opex1
Thousands $B
110 70
90
50
70 27% 23%
Reduction compared to YE2011
Reduction compared to YE2011
50 30
‘11 ‘12 ‘13 ‘14 ‘15 ‘16 ‘11 ‘12 ‘13 ‘14 ‘15 ‘16
1 Reconciliation in reference material.
10 ExxonMobil investment case
|
|
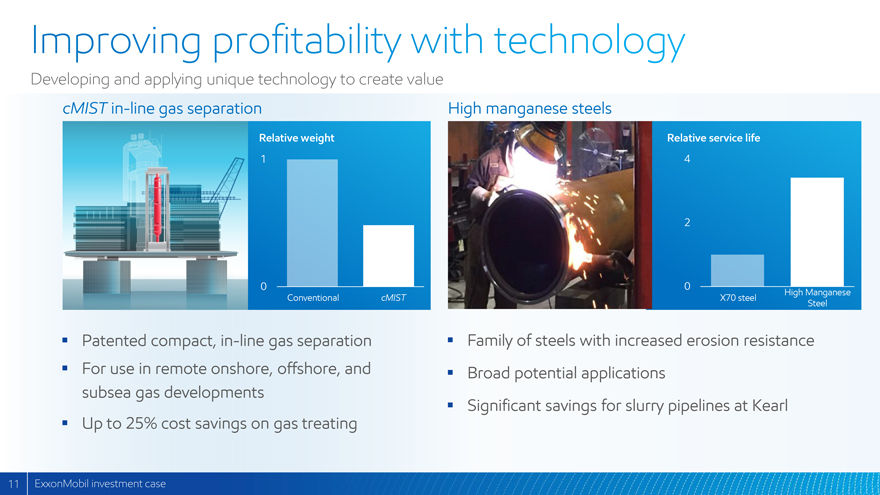
Improving profitability with technology
Developing and applying unique technology to create value
cMIST in-line gas separation
Relative weight
1
0
Conventional cMIST
Patented compact, in-line gas separation
For use in remote onshore, offshore, and subsea gas developments
Up to 25% cost savings on gas treating
High manganese steels
Relative service life
4
2
0
X70 steel High Manganese Steel
Family of steels with increased erosion resistance
Broad potential applications
Significant savings for slurry pipelines at Kearl
11 ExxonMobil investment case
|
|
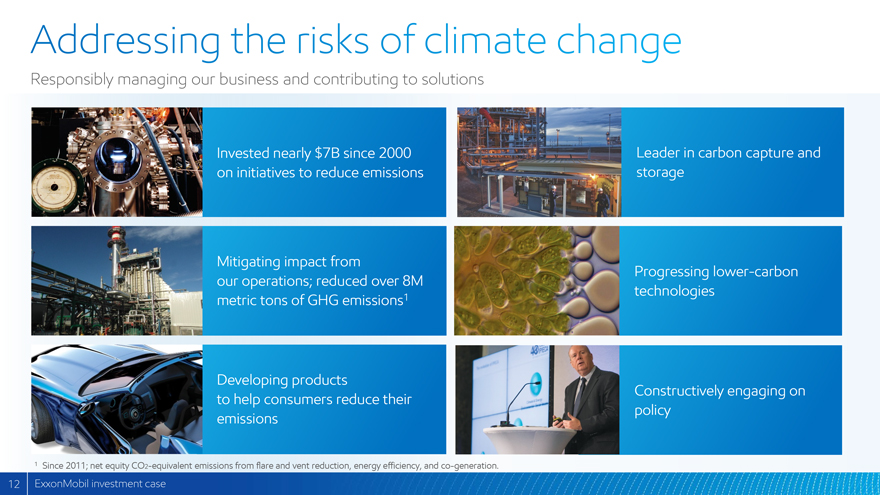
Addressing the risks of climate change
Responsibly managing our business and contributing to solutions
Invested nearly $7B since 2000 on initiatives to reduce emissions
Mitigating impact from our operations; reduced over 8M metric tons of GHG emissions1
Developing products to help consumers reduce their emissions
Leader in carbon capture and storage
Progressing lower-carbon technologies
Constructively engaging on policy
1 Since 2011; net equity CO2-equivalent emissions from flare and vent reduction, energy efficiency, and co-generation.
12 ExxonMobil investment case
|
|
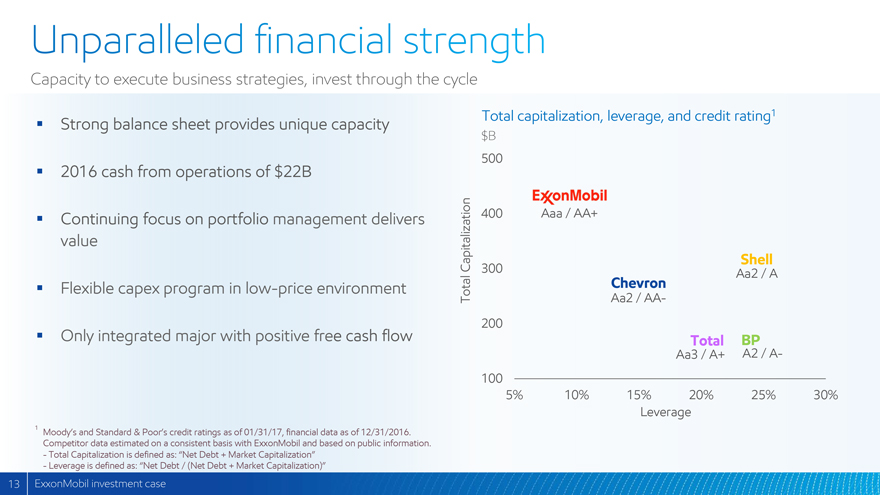
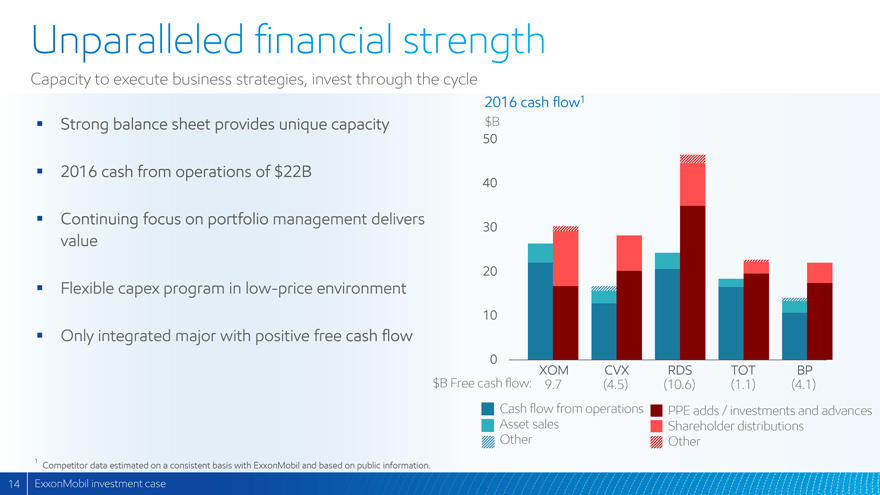
Unparalleled financial strength
Capacity to execute business strategies, invest through the cycle
Strong balance sheet provides unique capacity
2016 cash from operations of $22B
Continuing focus on portfolio management delivers value
Flexible capex program in low-price environment
Only integrated major with positive free cash flow
1 Moody’s and Standard & Poor’s credit ratings as of 01/31/17, financial data as of 12/31/2016. Competitor data estimated on a consistent basis with ExxonMobil and based on public information.
- Total Capitalization is defined as: “Net Debt + Market Capitalization”
- Leverage is defined as: “Net Debt / (Net Debt + Market Capitalization)”
Total capitalization, leverage, and credit rating1
$B
Total Capitalization
500
ExxonMobil
Aaa / AA+
400
300
Shell
Aa2 / A
Chevron
Aa2 / AA-
200
Total
Aa3 / A+
BP
A2 / A-
100
5% 10% 15% 20% 25% 30%
Leverage
13 ExxonMobil investment case
|
|
Unparalleled financial strength
Capacity to execute business strategies, invest through the cycle
Strong balance sheet provides unique capacity
2016 cash from operations of $22B
Continuing focus on portfolio management delivers value
Flexible capex program in low-price environment
Only integrated major with positive free cash flow
1 Competitor data estimated on a consistent basis with ExxonMobil and based on public information.
2016 cash flow1
$B
50
40
30
20
10
0
XOM
CVX
RDS
TOT
BP
$B Free cash flow:
9.7
(4.5)
(10.6)
(1.1)
(4.1)
Cash flow from operations
PPE adds / investments and advances
Asset sales
Shareholder distributions
Other
Other
14 ExxonMobil investment case
|
|
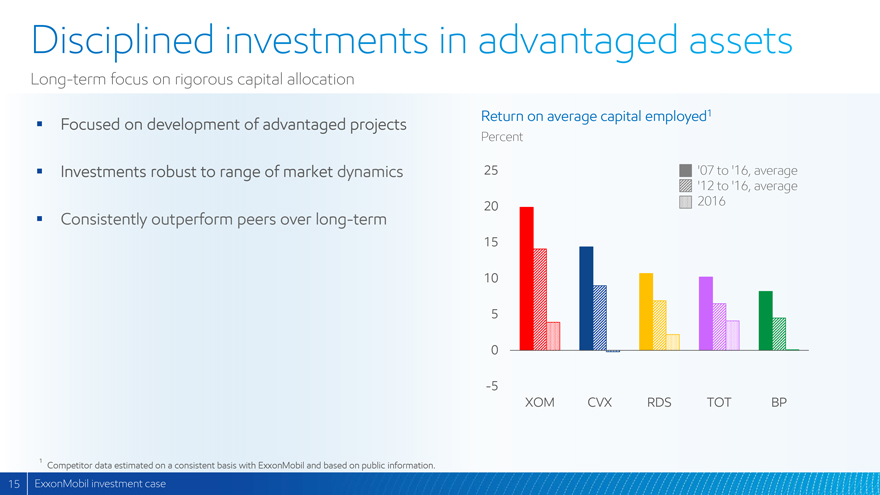
Disciplined investments in advantaged assets
Long-term focus on rigorous capital allocation
Focused on development of advantaged projects
Investments robust to range of market dynamics
Consistently outperform peers over long-term
| Return on average capital employed1 |
||
| Percent |
||
| 25 |
‘07 to ‘16, average | |
| ‘12 to ‘16, average | ||
| 20 |
2016 | |
| 15 |
||
| 10 |
||
| 5 |
||
| 0 |
||
| -5 |
||
| XOM CVX RDS TOT BP |
1 Competitor data estimated on a consistent basis with ExxonMobil and based on public information.
15 ExxonMobil investment case
|
|
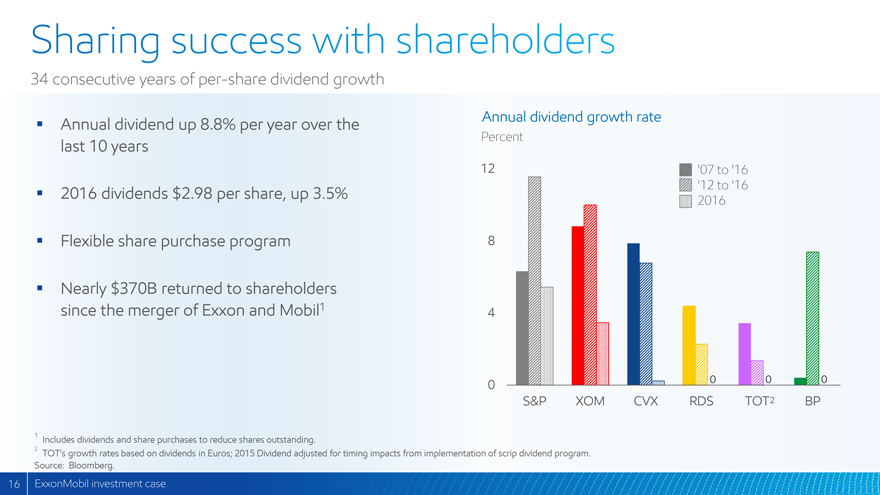
Sharing success with shareholders
34 consecutive years of per-share dividend growth
Annual dividend up 8.8% per year over the last 10 years
2016 dividends $2.98 per share, up 3.5%
Flexible share purchase program
Nearly $370B returned to shareholders since the merger of Exxon and Mobil1
| Annual dividend growth rate |
||
| Percent |
||
| 12 |
‘07 to‘16 | |
| ‘12 to‘16 | ||
| 2016 | ||
| 8 |
||
| 4 |
||
| 0 |
0 0 0 | |
| S&P |
XOM CVX RDS TOT2 BP |
1 Includes dividends and share purchases to reduce shares outstanding.
2 TOT’s growth rates based on dividends in Euros; 2015 Dividend adjusted for timing impacts from implementation of scrip dividend program.
Source: Bloomberg.
16 ExxonMobil investment case
|
|
Investment plans
Growing value through strategic choices
|
|
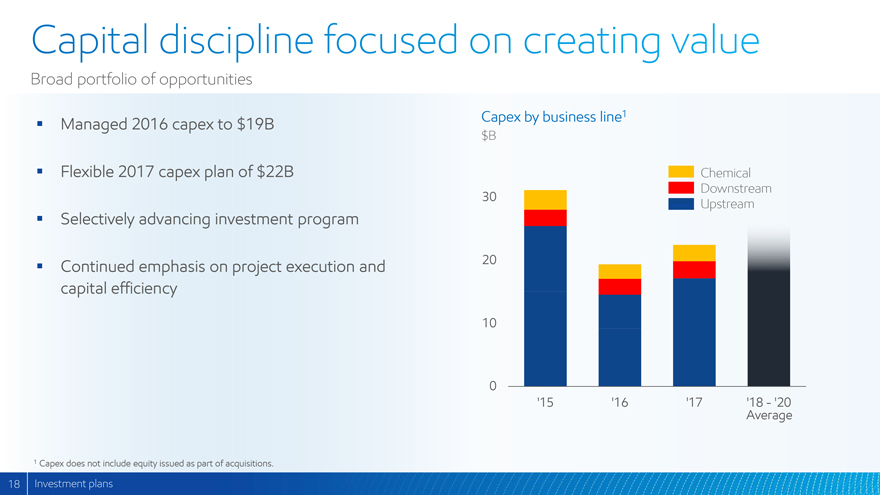
Capital discipline focused on creating value
Broad portfolio of opportunities
Managed 2016 capex to $19B
Flexible 2017 capex plan of $22B
Selectively advancing investment program
Continued emphasis on project execution and capital efficiency
| Capex by business line1 |
||
| $B |
||
| Chemical | ||
| Downstream | ||
| 30 |
Upstream | |
| 20 |
||
| 10 |
||
| 0 |
||
| ‘15 |
‘16 ‘17 ‘18 - ‘20 | |
| Average |
1 Capex does not include equity issued as part of acquisitions.
18 Investment plans
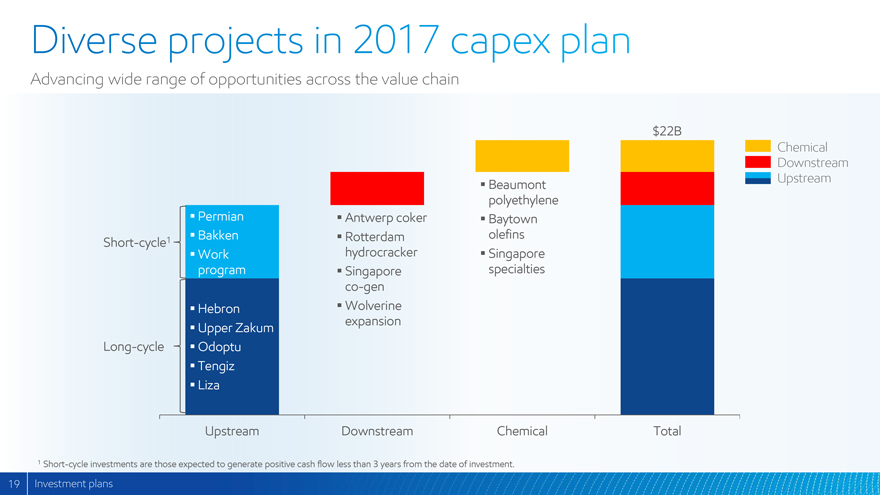
Diverse projects in 2017 capex plan
Advancing wide range of opportunities across the value chain
Short-cycle1
Permian
Bakken
Work program
Long-cycle
Hebron
Upper Zakum
Odoptu
Tengiz
Liza
Upstream
Antwerp coker
Rotterdam hydrocracker
Singapore co-gen
Wolverine expansion
Downstream
Beaumont polyethylene
Baytown olefins
Singapore specialties
Chemical
$22B
Total
Chemical
Downstream
Upstream
1 Short-cycle investments are those expected to generate positive cash flow less than 3 years from the date of investment.
19 Investment plans
Investment opportunities: 2018 – 2020
Committed to growing value through investments in attractive projects
Short-cycle
Permian
Bakken
Work program
Long-cycle
Tengiz
Liza
Guyana expansion
PNG expansion
Upstream
Rotterdam hydrocracker
Beaumont SCANfiner
Singapore basestock expansion
Other Gulf Coast
Downstream
Beaumont polyethylene
Other Gulf Coast
Asia
Chemical
$70B - $80B
Total
Chemical
Downstream
Upstream
20 Investment plans
|
|
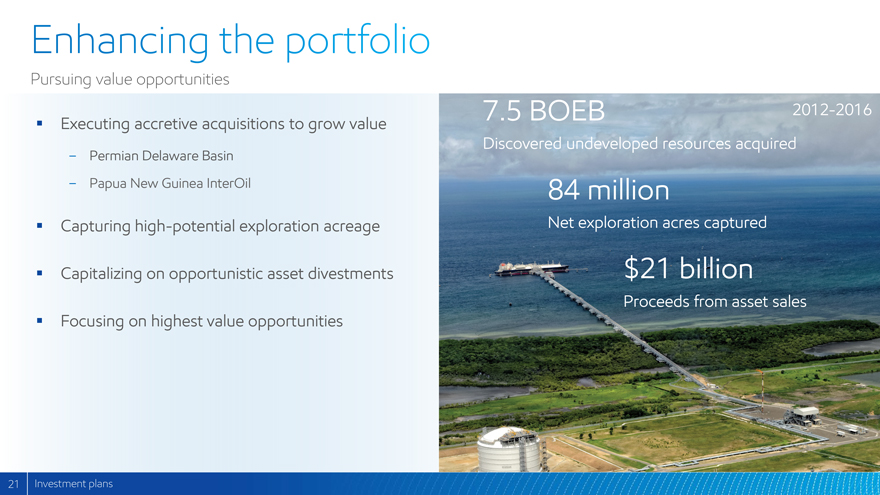
Enhancing the portfolio
Pursuing value opportunities
Executing accretive acquisitions to grow value
Permian Delaware Basin
Papua New Guinea InterOil
Capturing high-potential exploration acreage
Capitalizing on opportunistic asset divestments
Focusing on highest value opportunities
| 7.5 BOEB |
2012-2016 | |
| Discovered undeveloped resources acquired |
||
| 84 million |
||
| Net exploration acres captured |
||
| $21 billion |
||
| Proceeds from asset sales |
21 Investment plans
|
|
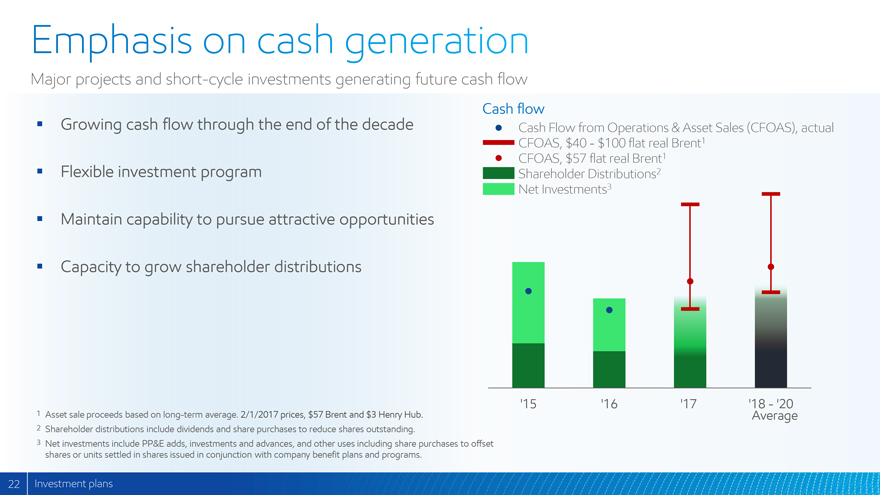
Emphasis on cash generation
Major projects and short-cycle investments generating future cash flow
Growing cash flow through the end of the decade
Flexible investment program
Maintain capability to pursue attractive opportunities
Capacity to grow shareholder distributions
| Cash flow |
| Cash Flow from Operations & Asset Sales (CFOAS), actual |
| CFOAS, $40 - $100 flat real Brent1 |
| CFOAS, $57 flat real Brent1 |
| Shareholder Distributions2 |
| Net Investments3 |
| ‘15 ‘16 ‘17 ‘18 - ‘20 |
| Average |
1 Asset sale proceeds based on long-term average. 2/1/2017 prices, $57 Brent and $3 Henry Hub.
2 Shareholder distributions include dividends and share purchases to reduce shares outstanding.
3 Net investments include PP&E adds, investments and advances, and other uses including share purchases to offset shares or units settled in shares issued in conjunction with company benefit plans and programs.
22 Investment plans
|
|
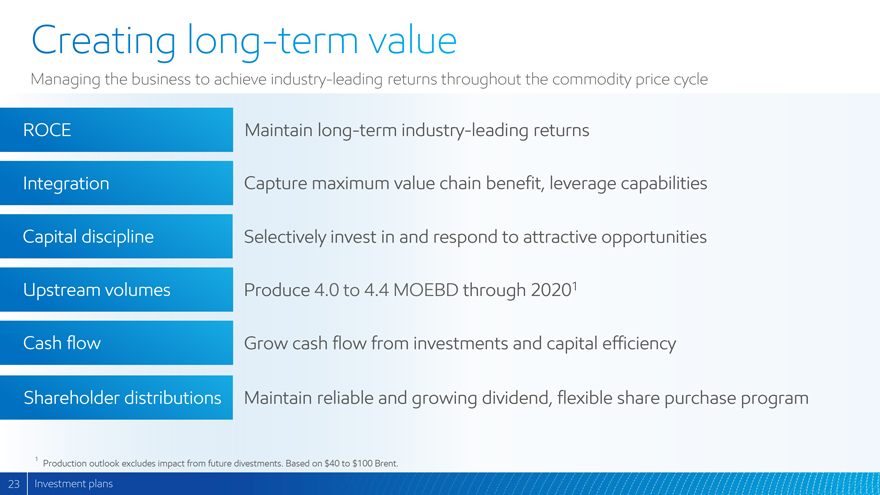
Creating long-term value
Managing the business to achieve industry-leading returns throughout the commodity price cycle
| ROCE |
Maintain long-term industry-leading returns | |
| Integration |
Capture maximum value chain benefit, leverage capabilities | |
| Capital discipline |
Selectively invest in and respond to attractive opportunities | |
| Upstream volumes |
Produce 4.0 to 4.4 MOEBD through 20201 | |
| Cash flow |
Grow cash flow from investments and capital efficiency | |
| Shareholder distributions |
Maintain reliable and growing dividend, flexible share purchase program |
1 Production outlook excludes impact from future divestments. Based on $40 to $100 Brent.
23 Investment plans
|
|
Upstream
Maximizing portfolio value
|
|
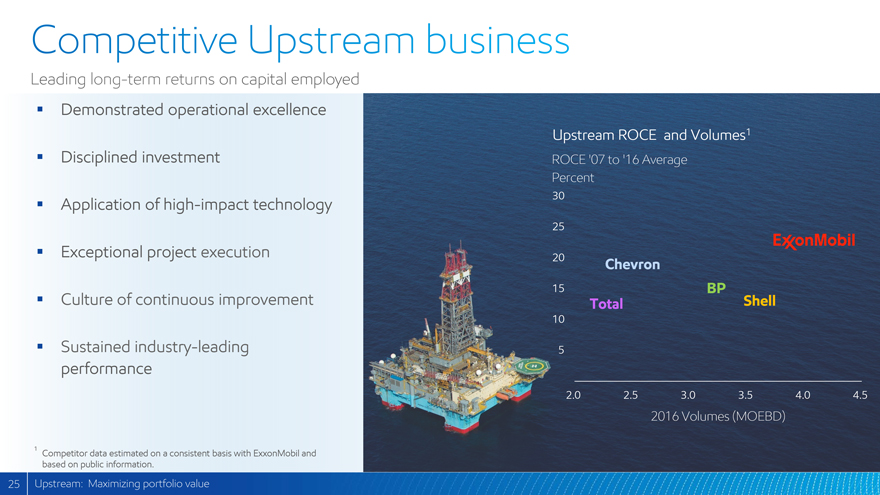
Competitive Upstream business
Leading long-term returns on capital employed
Demonstrated operational excellence
Disciplined investment
Application of high-impact technology
Exceptional project execution
Culture of continuous improvement
Sustained industry-leading performance
Upstream ROCE and Volumes1
ROCE ‘07 to ‘16 Average
Percent
30
25
20 Chevron ExxonMobil
15 BP
Total Shell
10
5
2.0 2.5 3.0 3.5 4.0 4.5
2016 Volumes (MOEBD)
1 Competitor data estimated on a consistent basis with ExxonMobil and based on public information.
25 Upstream: Maximizing portfolio value
|
|
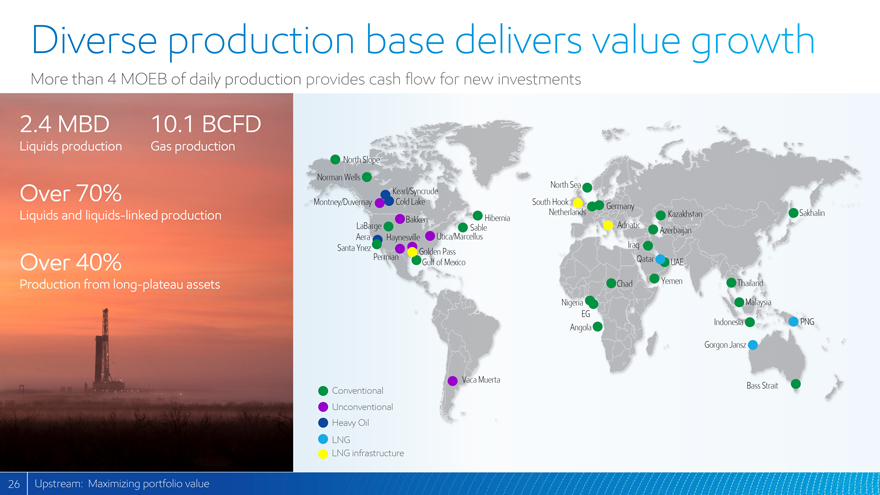
Diverse production base delivers value growth
More than 4 MOEB of daily production provides cash flow for new investments
2.4 MBD 10.1 BCFD
Liquids production Gas production
Over 70%
Liquids and liquids-linked production
Over 40%
Production from long-plateau assets
North Slope
Norman Wells
Kearl/Syncrude North Sea
Montney/Duvernay Cold Lake South Hook Germany
Bakken Hibernia Netherlands Kazakhstan Sakhalin
LaBarge Sable Adriatic Azerbaijan
Aera Haynesville Utica/Marcellus
Santa Ynez Iraq
Golden Pass
Permian Gulf of Mexico Qatar UAE
Chad Yemen Thailand
Nigeria Malaysia
EG
Angola Indonesia PNG
Gorgon Jansz
Vaca Muerta
Conventional Bass Strait
Unconventional
Heavy Oil
LNG
LNG infrastructure
26 Upstream: Maximizing portfolio value
|
|
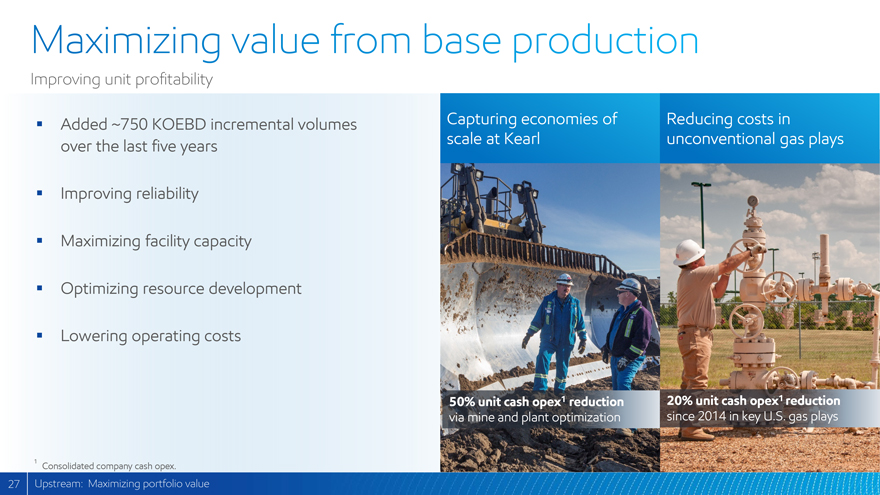
Maximizing value from base production
Improving unit profitability
Added ~750 KOEBD incremental volumes over the last five years
Improving reliability
Maximizing facility capacity
Optimizing resource development
Lowering operating costs
Capturing economies of scale at Kearl
Reducing costs in unconventional gas plays
50% unit cash opex1 reduction via mine and plant optimization
20% unit cash opex1 reduction since 2014 in key U.S. gas plays
1 Consolidated company cash opex.
27 Upstream: Maximizing portfolio value
|
|
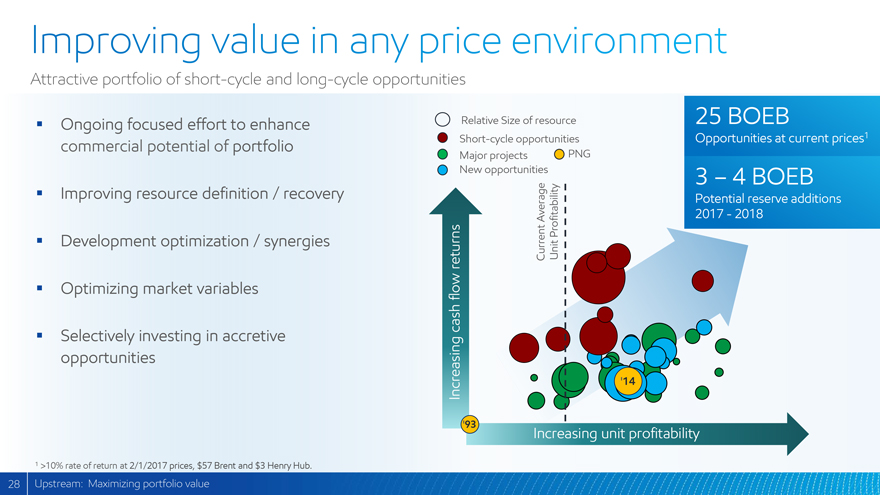
Improving value in any price environment
Attractive portfolio of short-cycle and long-cycle opportunities
Ongoing focused effort to enhance commercial potential of portfolio
Improving resource definition / recovery
Development optimization / synergies
Optimizing market variables
Selectively investing in accretive opportunities
Relative Size of resource
Short-cycle opportunities
Major projects PNG
New opportunities
25 BOEB
Opportunities at current prices1
3 – 4 BOEB
Potential reserve additions
2017 - 2018
Increasing cash flow returns
Current Average Unit Profitability
‘14
‘93
Increasing unit profitability
1 >10% rate of return at 2/1/2017 prices, $57 Brent and $3 Henry Hub.
28 Upstream: Maximizing portfolio value
|
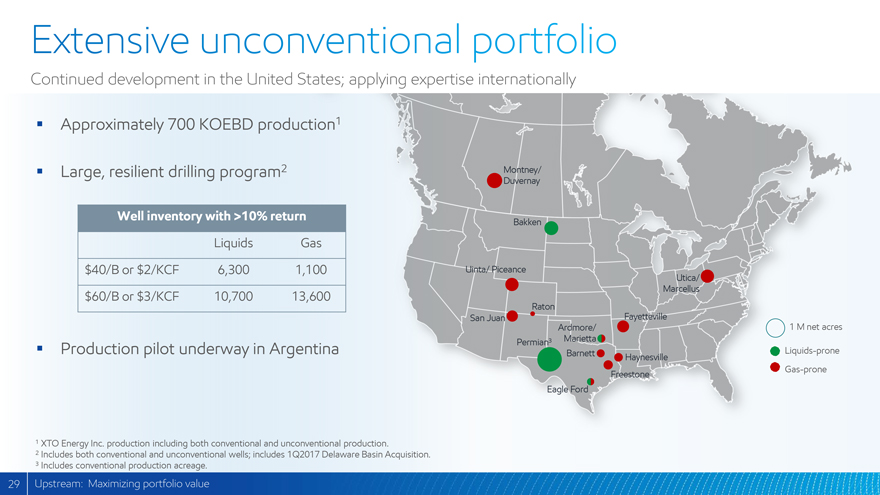
Extensive unconventional portfolio
Continued development in the United States; applying expertise internationally
Approximately 700 KOEBD production1
Large, resilient drilling program2
Well inventory with >10% return
Liquids Gas
$40/B or $2/KCF 6,300 1,100
$60/B or $3/KCF 10,700 13,600
Production pilot underway in Argentina
Montney/ Duvernay
Bakken
Uinta/ Piceance
Utica/ Marcellus
Raton
San Juan
Fayetteville
Ardmore/Marietta
1 M net acres
Permian3
Barnett
Haynesville
Liquids-prone
Freestone
Gas-prone
Eagle Ford
1 XTO Energy Inc. production including both conventional and unconventional production.
2 Includes both conventional and unconventional wells; includes 1Q2017 Delaware Basin Acquisition.
3 Includes conventional production acreage.
29 Upstream: Maximizing portfolio value
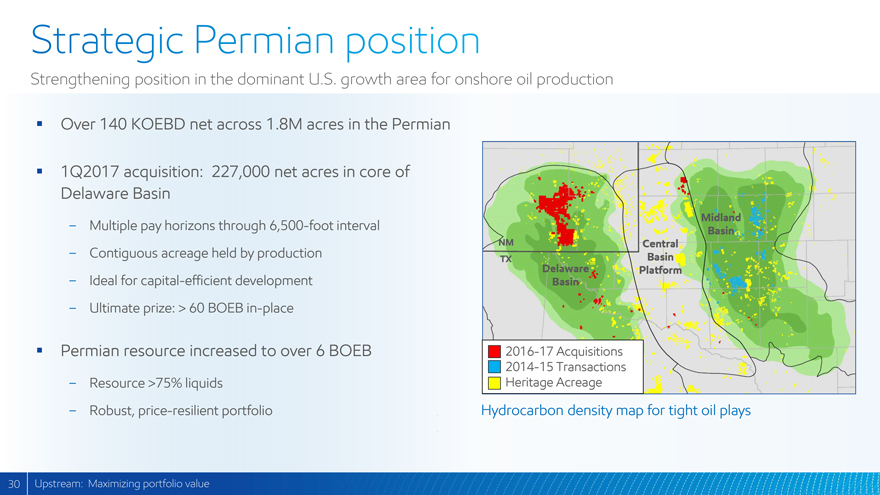
|
Strategic Permian position
Strengthening position in the dominant U.S. growth area for onshore oil production
Over 140 KOEBD net across 1.8M acres in the Permian
1Q2017 acquisition: 227,000 net acres in core of Delaware Basin
Multiple pay horizons through 6,500-foot interval
Contiguous acreage held by production
Ideal for capital-efficient development
Ultimate prize: > 60 BOEB in-place
Permian resource increased to over 6 BOEB
Resource >75% liquids
Robust, price-resilient portfolio
Midland
Basin
Central
Basin
Platform
NM
TX
Delaware
Basin
2016-17 Acquisitions
2014-15 Transactions
Heritage Acreage
Hydrocarbon density map for tight oil plays
30 Upstream: Maximizing portfolio value
|
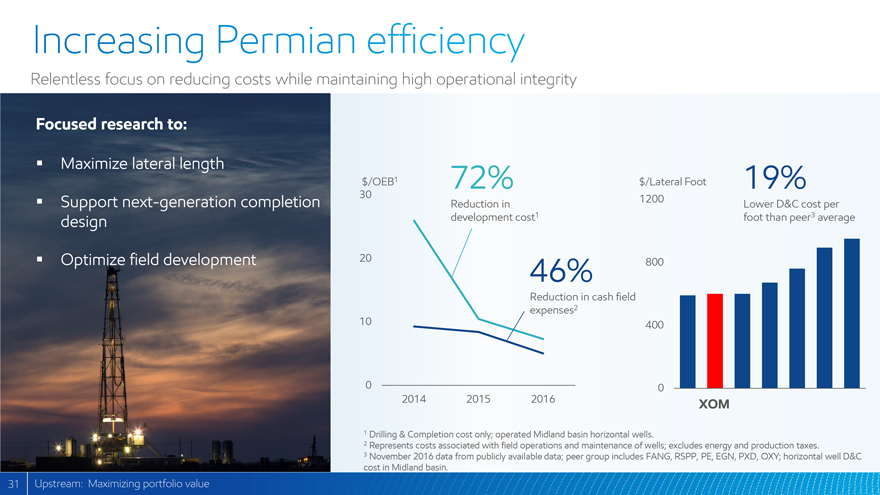
Increasing Permian efficiency
Relentless focus on reducing costs while maintaining high operational integrity
Focused research to:
Maximize lateral length
Support next-generation completion design
Optimize field development
$/OEB1 30
72% Reduction in development cost1
$/Lateral Foot 1200
19% Lower D&C cost per foot than peer3 average
20 10
46% Reduction in cash field expenses2
800 400
0
2014 2015 2016 0 XOM
1 Drilling & Completion cost only; operated Midland basin horizontal wells.
2 Represents costs associated with field operations and maintenance of wells; excludes energy and production taxes.
3 November 2016 data from publicly available data; peer group includes FANG, RSPP, PE, EGN, PXD, OXY; horizontal well D&C cost in Midland basin.
31 Upstream: Maximizing portfolio value
|
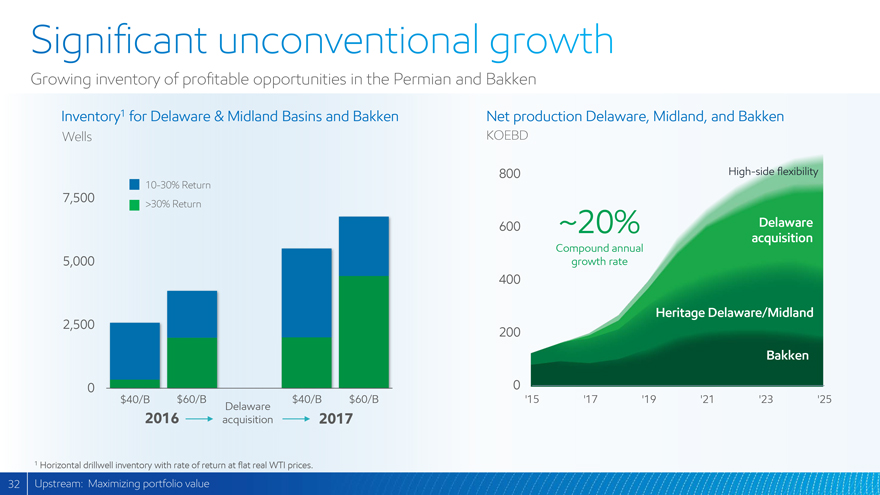
Significant unconventional growth
Growing inventory of profitable opportunities in the Permian and Bakken
Inventory1 for Delaware & Midland Basins and Bakken
Wells
7,500 10-30% Return >30% Return
5,000
2,500
0
$40/B $60/B $40/B $60/B
2016 Delaware acquisition 2017
Net production Delaware, Midland, and Bakken
KOEBD
800 600 ~20% High-side flexibility Delaware acquisition
Compound annual growth rate
400 Heritage Delaware/Midland
200
0 Bakken
‘15 ‘17 ‘19 ‘21 ‘23 ‘25
1 Horizontal drillwell inventory with rate of return at flat real WTI prices.
32 Upstream: Maximizing portfolio value
|
|
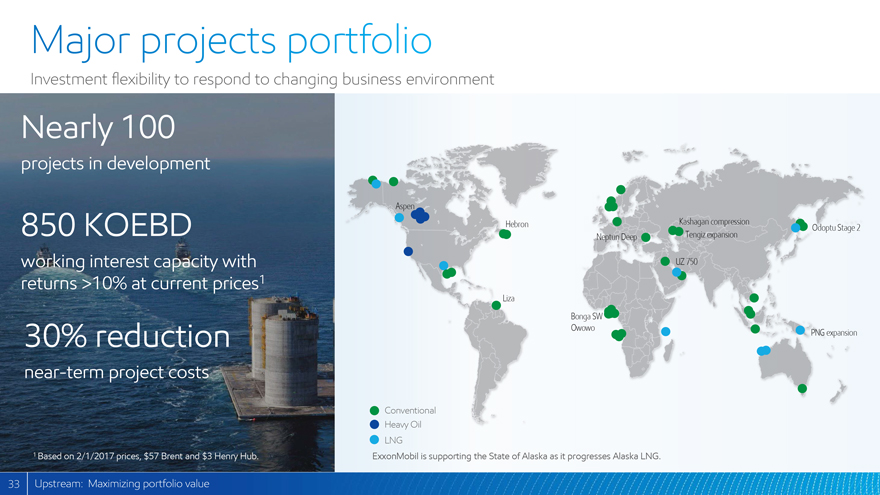
Major projects portfolio
Investment flexibility to respond to changing business environment
Nearly 100
projects in development
850 KOEBD
working interest capacity with
returns >10% at current prices1
30% reduction
near-term project costs
1 Based on 2/1/2017 prices, $57 Brent and $3 Henry Hub.
Aspen Hebron Liza Neptun Deep Bonga SW Owowo UZ 750 Kashagan compression Tengiz expansion Odoptu Stage 2 PNG expansion
Conventional
Heavy Oil
LNG
ExxonMobil is supporting the State of Alaska as it progresses Alaska LNG.
33 Upstream: Maximizing portfolio value
|
|
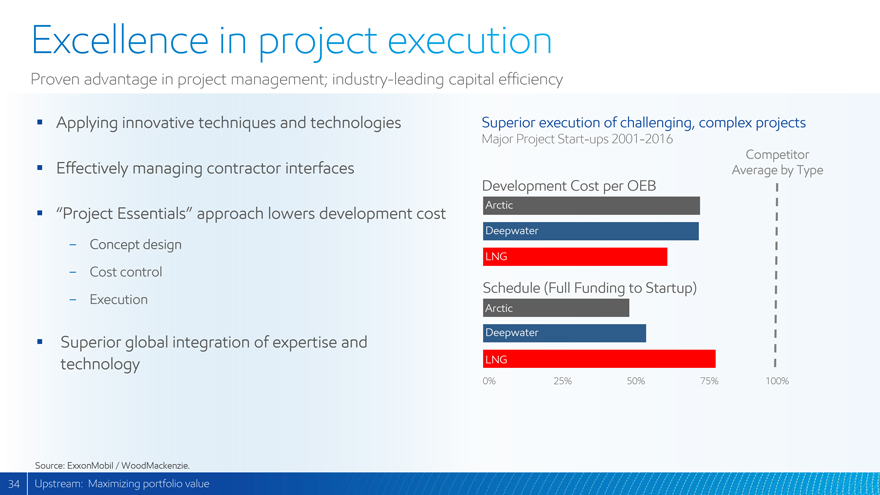
Excellence in project execution
Proven advantage in project management; industry-leading capital efficiency
Applying innovative techniques and technologies
Effectively managing contractor interfaces
“Project Essentials” approach lowers development cost
Concept design
Cost control
Execution
Superior global integration of expertise and technology
Superior execution of challenging, complex projects Major Project Start-ups 2001-2016 Development Cost per OEB Arctic Deepwater LNG Schedule (Full Funding to Startup) Arctic Deepwater LNG 0% 25% 50% 75% Competitor Average by Type 100%
Source: ExxonMobil / WoodMackenzie.
34 Upstream: Maximizing portfolio value
|
|
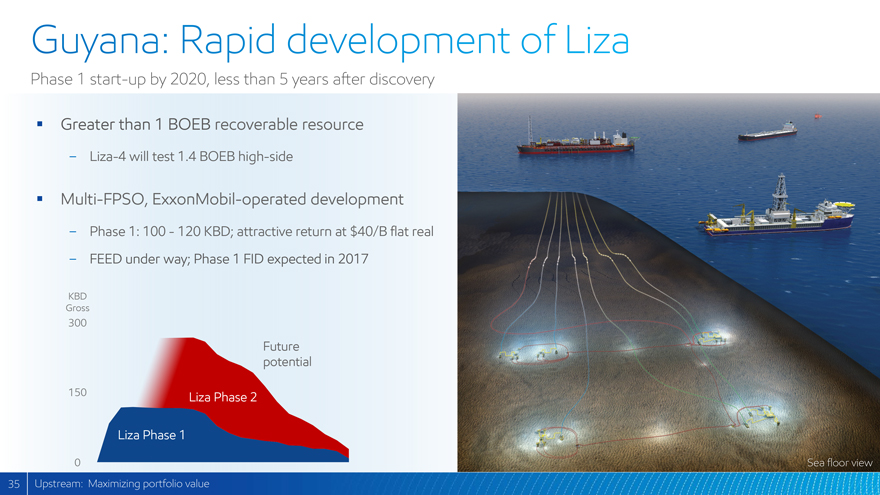
Guyana: Rapid development of Liza
Phase 1 start-up by 2020, less than 5 years after discovery
Greater than 1 BOEB recoverable resource
– Liza-4 will test 1.4 BOEB high-side
Multi-FPSO, ExxonMobil-operated development
– Phase 1: 100 -120 KBD; attractive return at $40/B flat real
–FEED under way; Phase 1 FID expected in 2017
KBD Gross 300 150 0 Liza Phase 1 Liza Phase 2 Future potential
Sea floor view
35 Upstream: Maximizing portfolio value
|
|
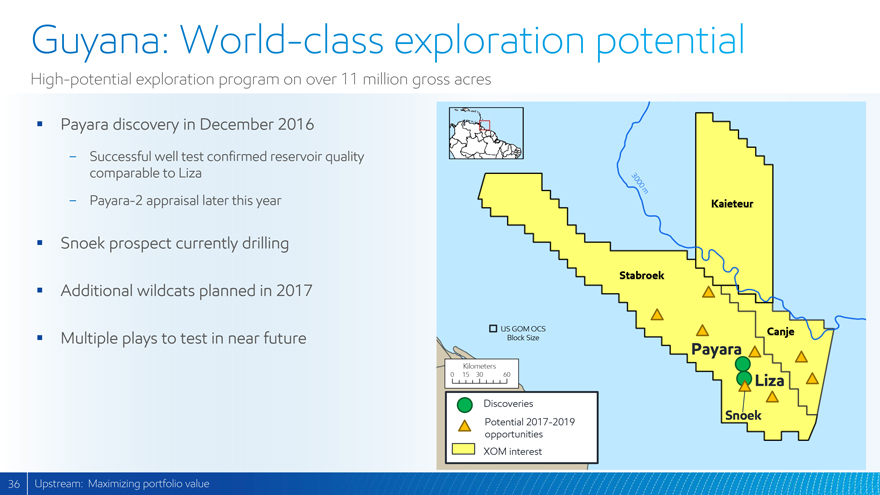
Guyana: World-class exploration potential
High-potential exploration program on over 11 million gross acres
Payara discovery in December 2016
Successful well test confirmed reservoir quality comparable to Liza
Payara-2 appraisal later this year
Snoek prospect currently drilling
Additional wildcats planned in 2017
Multiple plays to test in near future
0
Kilometers 15 30
US GOM OCS Block Size 60 Discoveries Potential 2017-2019 opportunities XOM interest
3000m Stabroek
Kaieteur Canje Payara Liza Snoek
36 Upstream: Maximizing portfolio value
|
|
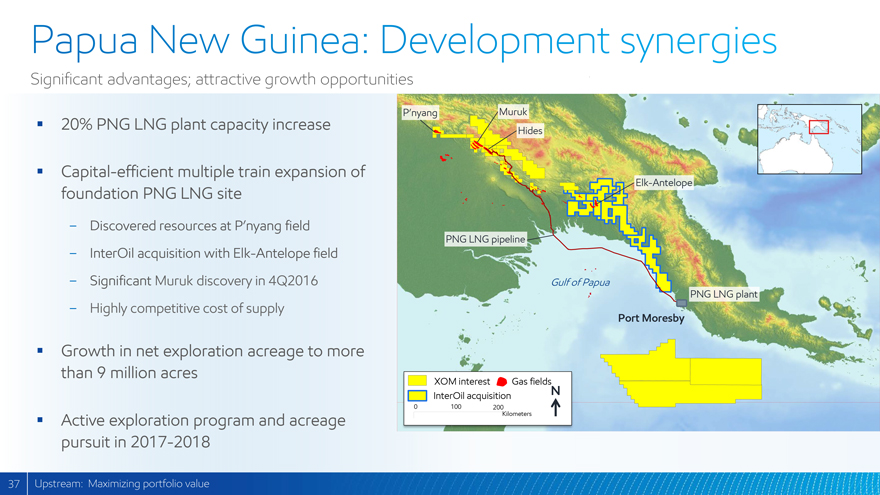
Papua New Guinea: Development synergies
Significant advantages; attractive growth opportunities
20% PNG LNG plant capacity increase
Capital-efficient multiple train expansion of foundation PNG LNG site
Discovered resources at P’nyang field
InterOil acquisition with Elk-Antelope field
Significant Muruk discovery in 4Q2016
Highly competitive cost of supply
Growth in net exploration acreage to more than 9 million acres
Active exploration program and acreage pursuit in 2017-2018
P’nyang XOM interest InterOil acquisition 0 PNG LNG pipeline Gas fields 100 Muruk 200 Kilometers Hides Gulf of Papua N Elk-Antelope PNG LNG plant Port Moresby
37 Upstream: Maximizing portfolio value
|
|
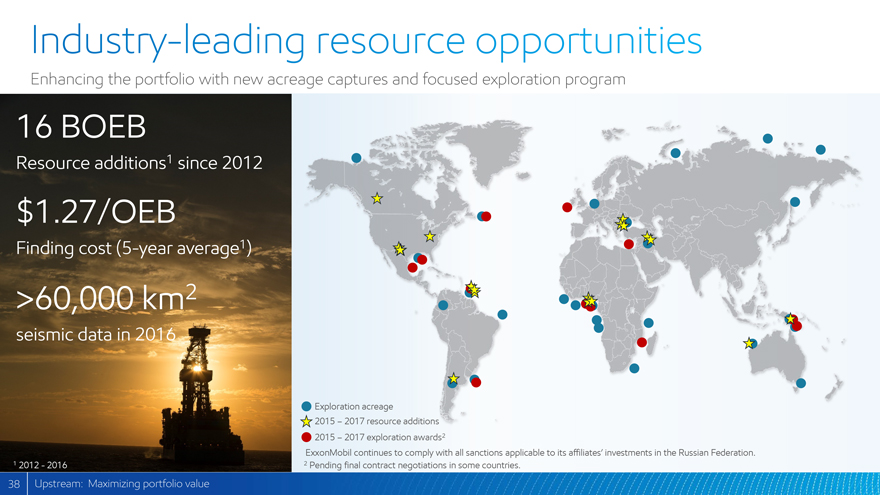
Industry-leading resource opportunities
Enhancing the portfolio with new acreage captures and focused exploration program
16 BOEB
Resource additions1 since 2012
$1.27/OEB
Finding cost (5-year average1)
>60,000 km2
seismic data in 2016
1 2012 - 2016
Exploration acreage
2015 – 2017 resource additions 2015 – 2017 exploration awards2
ExxonMobil continues to comply with all sanctions applicable to its affiliates’ investments in the Russian Federation.
2 Pending final contract negotiations in some countries.
38 Upstream: Maximizing portfolio value
|
|
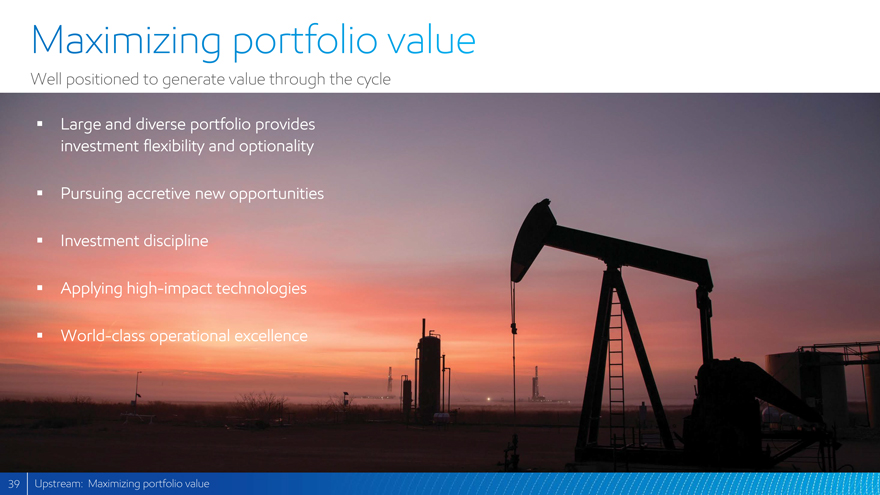
Maximizing portfolio value
Well positioned to generate value through the cycle
Large and diverse portfolio provides investment flexibility and optionality
Pursuing accretive new opportunities
Investment discipline
Applying high-impact technologies
World-class operational excellence
39 Upstream: Maximizing portfolio value
|
|
Downstream & Chemical
Building on strength
|
|
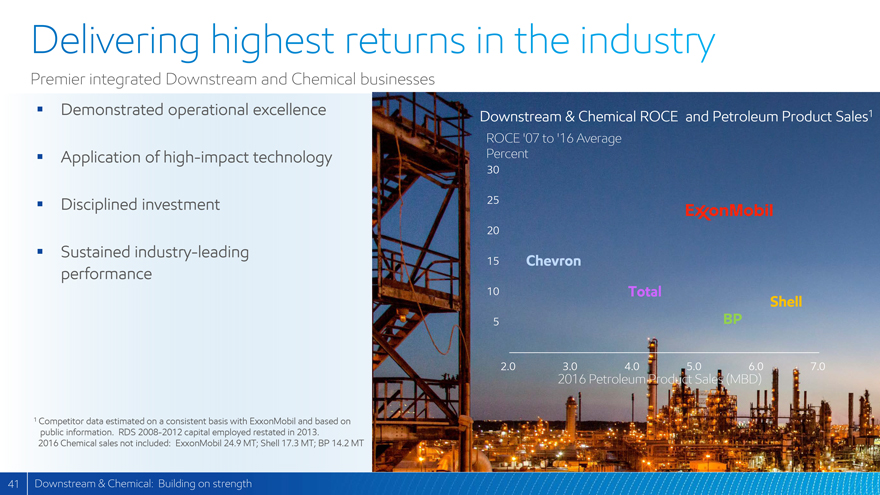
Delivering highest returns in the industry
Premier integrated Downstream and Chemical businesses
Demonstrated operational excellence
Application of high-impact technology
Disciplined investment
Sustained industry-leading performance
1 Competitor data estimated on a consistent basis with ExxonMobil and based on public information. RDS 2008-2012 capital employed restated in 2013.
2016 Chemical sales not included: ExxonMobil 24.9 MT; Shell 17.3 MT; BP 14.2 MT
Downstream & Chemical ROCE and Petroleum Product Sales1 ROCE ‘07 to ‘16 Average Percent 30 25 20 15 10 5 2.0 Chevron 3.0 2016 Petroleum Product Sales (MBD) ExxonMobil Total 4.0 5.0 BP 6.0 Shell 7.0
41 Downstream & Chemical: Building on strength
|
|
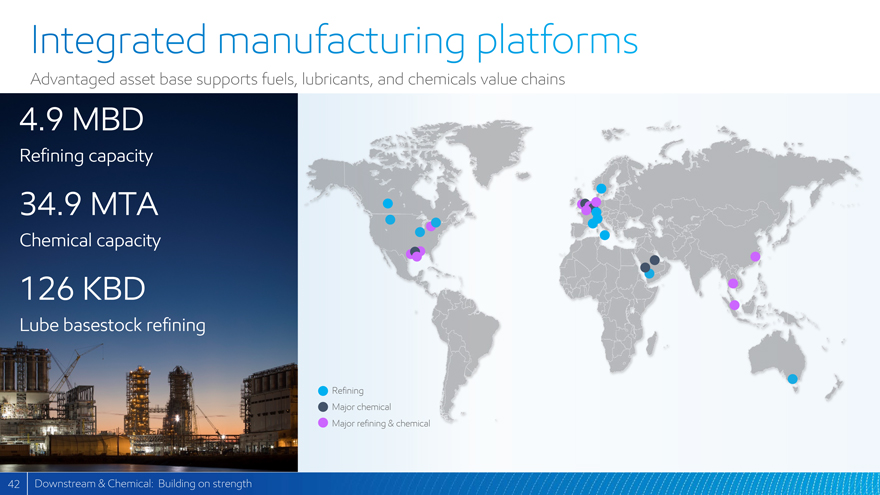
Integrated manufacturing platforms
Advantaged asset base supports fuels, lubricants, and chemicals value chains
4.9 MBD
Refining capacity
34.9 MTA
Chemical capacity
126 KBD
Lube basestock refining
Refining
Major chemical
Major refining & chemical
42 Downstream & Chemical: Building on strength
|
|
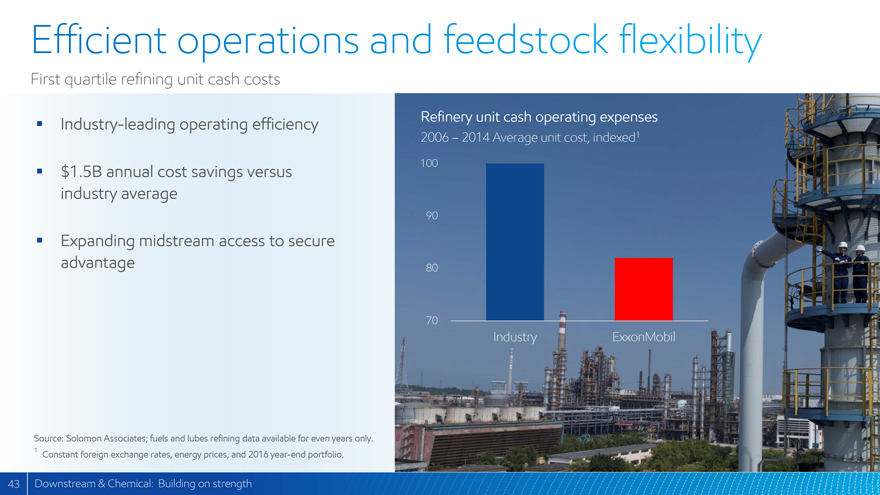
Efficient operations and feedstock flexibility
First quartile refining unit cash costs
Industry-leading operating efficiency
$1.5B annual cost savings versus industry average
Expanding midstream access to secure advantage
Source: Solomon Associates; fuels and lubes refining data available for even years only.
1 Constant foreign exchange rates, energy prices, and 2016 year-end portfolio.
Refinery unit cash operating expenses
2006 – 2014 Average unit cost, indexed1
100
90
80
70
Industry
ExxonMobil
43 Downstream & Chemical: Building on strength
|
|
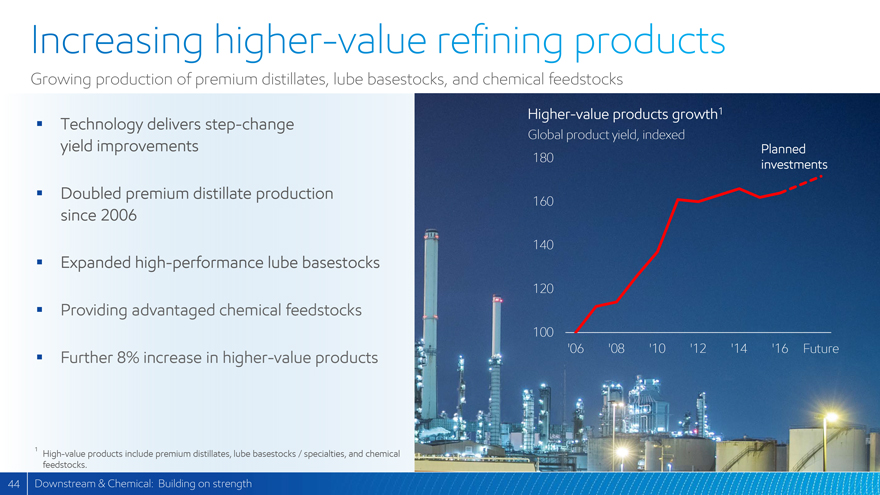
Increasing higher-value refining products
Growing production of premium distillates, lube basestocks, and chemical feedstocks
Technology delivers step-change yield improvements
Doubled premium distillate production since 2006
Expanded high-performance lube basestocks
Providing advantaged chemical feedstocks
Further 8% increase in higher-value products
Higher-value products growth1
Global product yield, indexed
Planned investments
180
160
140
120
100
‘06
‘08
‘10
‘12
‘14
‘16
Future
1 High-value products include premium distillates, lube basestocks / specialties, and chemical feedstocks.
44 Downstream & Chemical: Building on strength
|
|
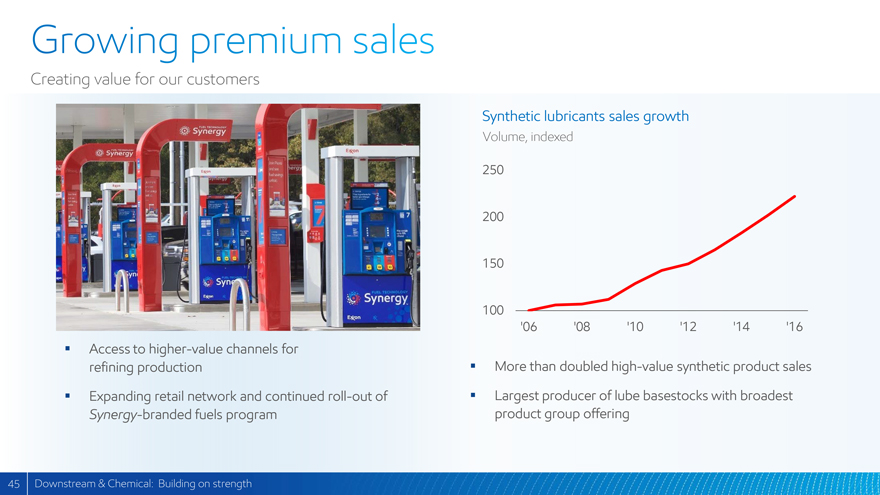
Growing premium sales
Creating value for our customers
Access to higher-value channels for refining production
Expanding retail network and continued roll-out of
Synergy-branded fuels program
Synthetic lubricants sales growth
Volume, indexed
250
200
150
100
‘06
‘08
‘10
‘12
‘14
‘16
More than doubled high-value synthetic product sales
Largest producer of lube basestocks with broadest product group offering
45 Downstream & Chemical: Building on strength
|
|
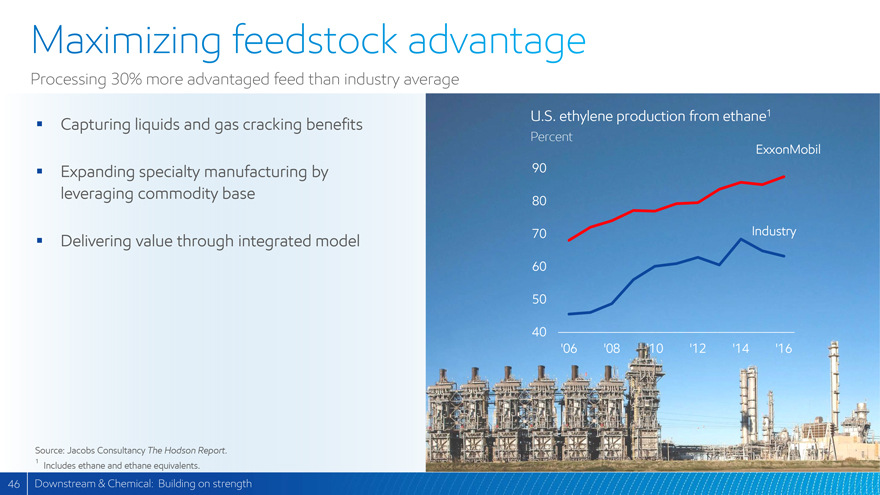
Maximizing feedstock advantage
Processing 30% more advantaged feed than industry average
Capturing liquids and gas cracking benefits
Expanding specialty manufacturing by leveraging commodity base
Delivering value through integrated model
U.S. ethylene production from ethane1
Percent
ExxonMobil
Industry
90
80
70
60
50
40
‘06
‘08
‘10
‘12
‘14
‘16
Source: Jacobs Consultancy The Hodson Report.
1 Includes ethane and ethane equivalents.
46 Downstream & Chemical: Building on strength
|
|
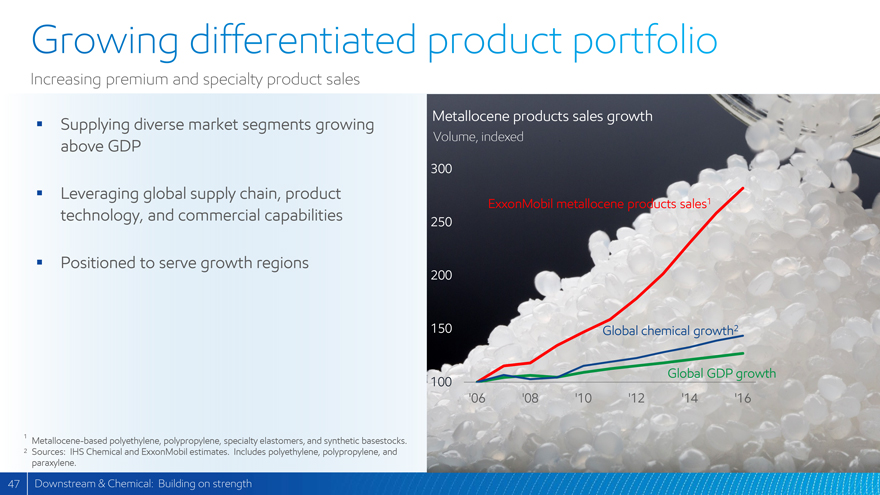
Growing differentiated product portfolio
Increasing premium and specialty product sales
Supplying diverse market segments growing above GDP
Leveraging global supply chain, product technology, and commercial capabilities
Positioned to serve growth regions
Metallocene products sales growth
Volume, indexed
300
ExxonMobil metallocene products sales 1
Global chemical growth 2
Global GDP growth
250
200
150
100
‘06
‘08
‘10
‘12
‘14
‘16
1 Metallocene-based polyethylene, polypropylene, specialty elastomers, and synthetic basestocks.
2 Sources: IHS Chemical and ExxonMobil estimates. Includes polyethylene, polypropylene, and paraxylene.
47 Downstream & Chemical: Building on strength
|
|
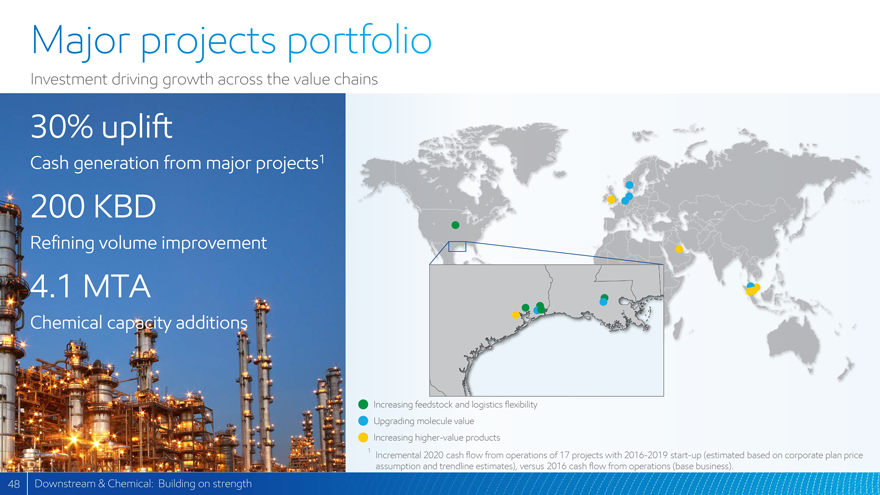
Major projects portfolio
Investment driving growth across the value chains
30% uplift
Cash generation from major projects1
200 KBD
Refining volume improvement
4.1 MTA
Chemical capacity additions
Increasing feedstock and logistics flexibility Upgrading molecule value
Increasing higher-value products
1 Incremental 2020 cash flow from operations of 17 projects with 2016-2019 start-up (estimated based on corporate plan price assumption and trendline estimates), versus 2016 cash flow from operations (base business).
48 Downstream & Chemical: Building on strength
|
|
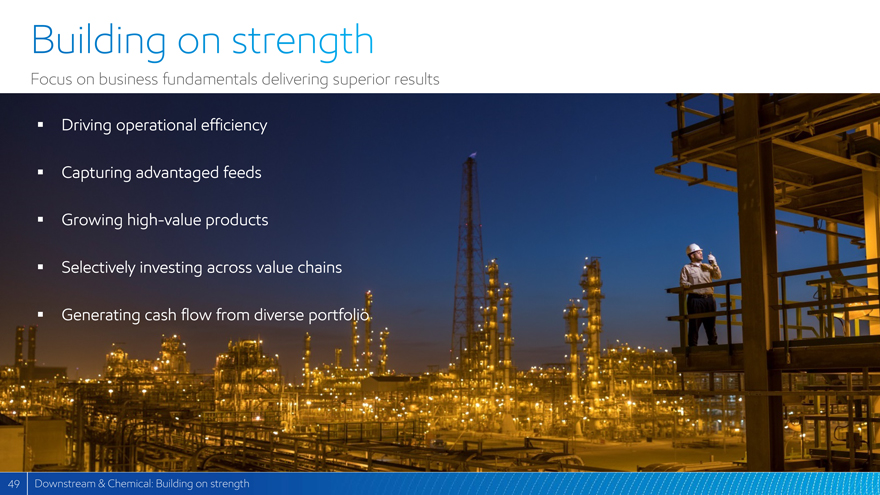
Building on strength
Focus on business fundamentals delivering superior results
Driving operational efficiency
Capturing advantaged feeds
Growing high-value products
Selectively investing across value chains
Generating cash flow from diverse portfolio
49 Downstream & Chemical: Building on strength
|
|
ExxonMobil investment case
|
|
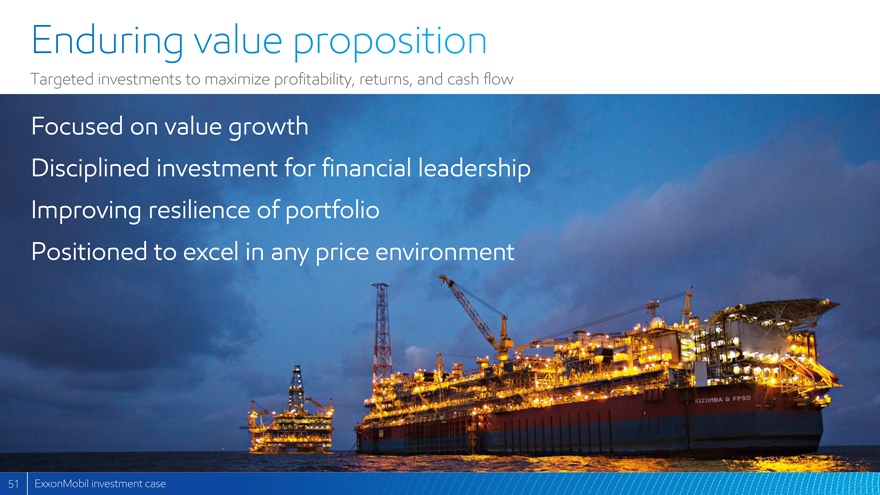
Enduring value proposition
Targeted investments to maximize profitability, returns, and cash flow
Focused on value growth
Disciplined investment for financial leadership
Improving resilience of portfolio
Positioned to excel in any price environment
51 ExxonMobil investment case
|
|
Break
|
|
Q&A
|
|
Reference material
|
|
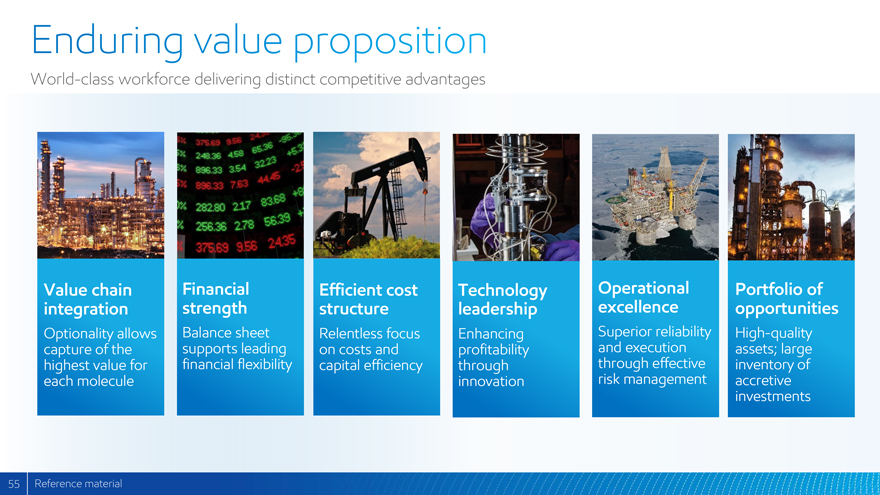
Enduring value proposition
World-class workforce delivering distinct competitive advantages
Value chain integration Financial strength Efficient cost structure Technology leadership Operational excellence Portfolio of opportunities
Optionality allows capture of the highest value for each molecule Balance sheet supports leading financial flexibility Relentless focus on costs and capital efficiency Enhancing profitability through innovation Superior reliability and execution through effective risk management High-quality assets; large inventory of accretive investments
55 Reference material
|
|
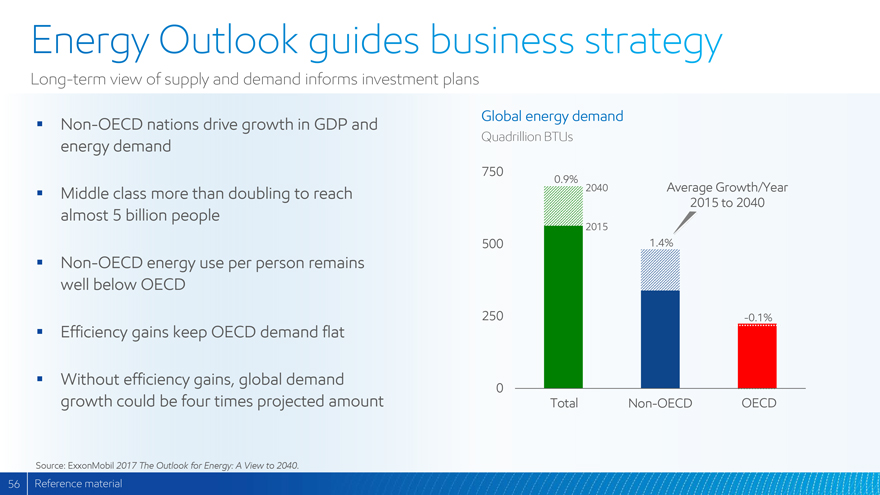
Energy Outlook guides business strategy
Long-term view of supply and demand informs investment plans
Non-OECD nations drive growth in GDP and energy demand
Middle class more than doubling to reach almost 5 billion people
Non-OECD energy use per person remains well below OECD
Efficiency gains keep OECD demand flat
Without efficiency gains, global demand growth could be four times projected amount
Source: ExxonMobil 2017 The Outlook for Energy: A View to 2040.
Global energy demand
Quadrillion BTUs
750
0.9% 2040 Average Growth/Year
2015 to 2040
2015
500 1.4%
250 -0.1%
0
Total Non-OECD OECD
56 Reference material
|
|
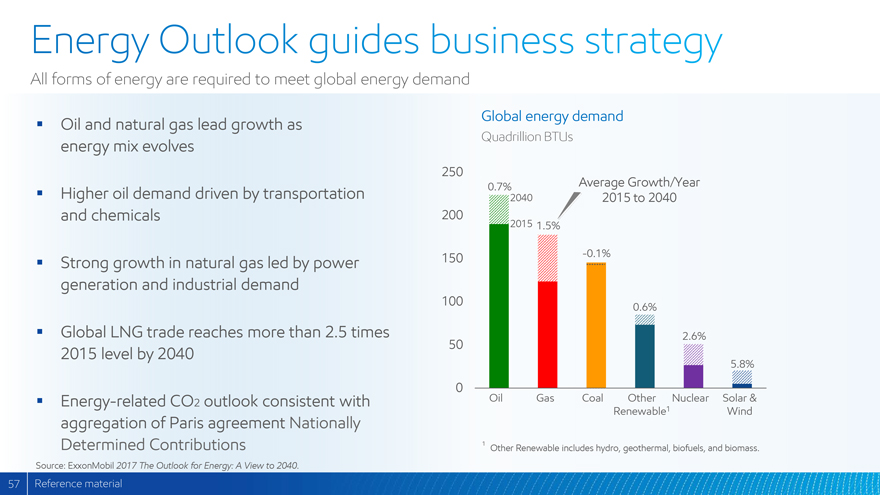
Energy Outlook guides business strategy
All forms of energy are required to meet global energy demand
Oil and natural gas lead growth as energy mix evolves
Higher oil demand driven by transportation and chemicals
Strong growth in natural gas led by power generation and industrial demand
Global LNG trade reaches more than 2.5 times 2015 level by 2040
Energy-related CO2 outlook consistent with aggregation of Paris agreement Nationally Determined Contributions
Source: ExxonMobil 2017 The Outlook for Energy: A View to 2040.
Global energy demand
Quadrillion BTUs
250
0.7% Average Growth/Year
2040 2015 to 2040
200
2015 1.5%
150 -0.1%
100 0.6%
50 2.6%
5.8%
0
Oil Gas Coal Other Nuclear Solar &
Renewable1Wind
1 Other Renewable includes hydro, geothermal, biofuels, and biomass.
57 Reference material
|
|
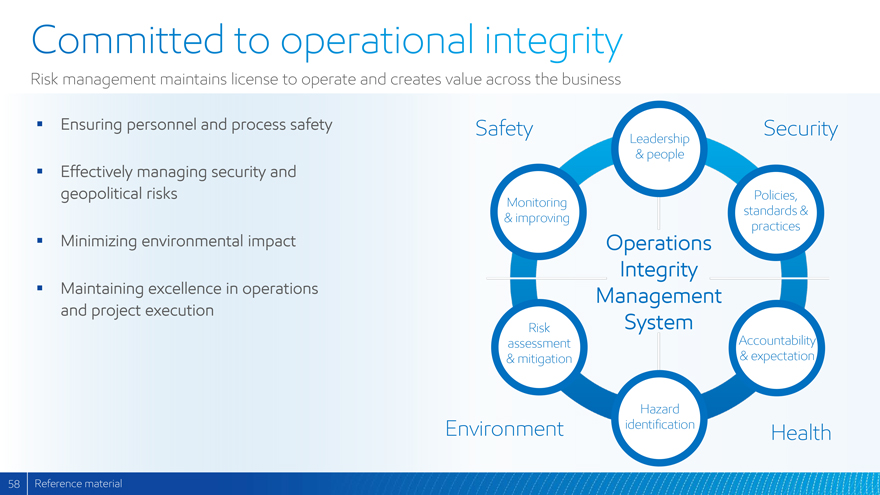
Committed to operational integrity
Risk management maintains license to operate and creates value across the business
Ensuring personnel and process safety
Effectively managing security and geopolitical risks
Minimizing environmental impact
Maintaining excellence in operations and project execution
Safety Security
Leadership & people
Monitoring & improving
Policies, standards & practices
Operations
Integrity
Management
System
Risk assessment & mitigation
Accountability & expectation
Hazard
identification
Environment
Health
58 Reference material
|
|
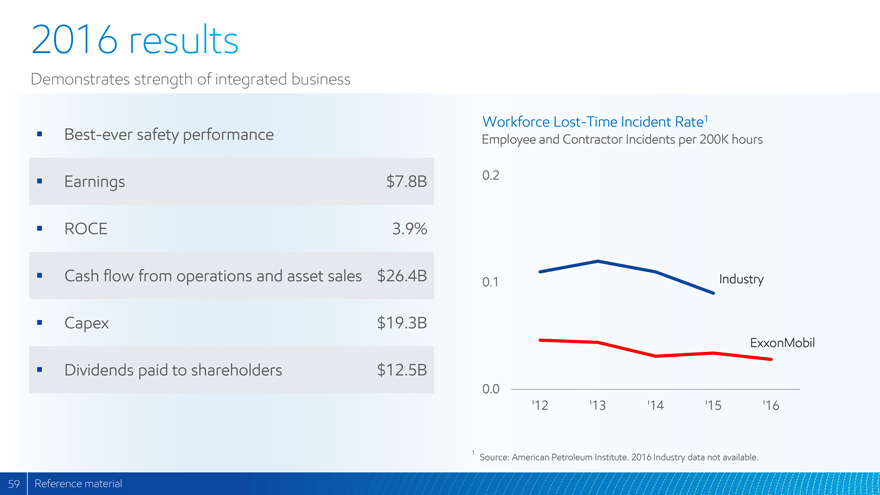
2016 results
Demonstrates strength of integrated business
Best-ever safety performance
Earnings $7.8B
ROCE 3.9%
Cash flow from operations and asset sales $26.4B
Capex $19.3B
Dividends paid to shareholders $12.5B
Workforce Lost-Time Incident Rate1
Employee and Contractor Incidents per 200K hours
0.2
0.1 Industry
ExxonMobil
0.0
‘12 ‘13 ‘14 ‘15 ‘16
1 Source: American Petroleum Institute. 2016 Industry data not available.
59 Reference material
|
|
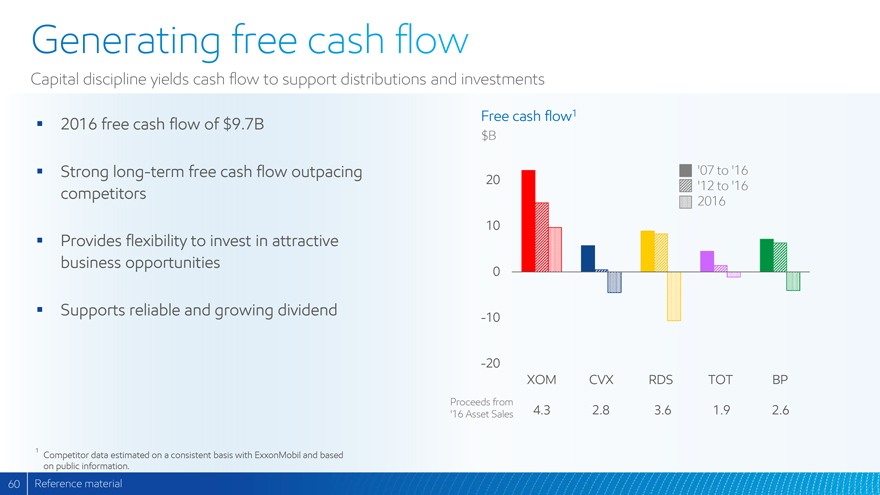
Generating free cash flow
Capital discipline yields cash flow to support distributions and investments
2016 free cash flow of $9.7B
Strong long-term free cash flow outpacing competitors
Provides flexibility to invest in attractive business opportunities
Supports reliable and growing dividend
1 Competitor data estimated on a consistent basis with ExxonMobil and based on public information.
Free cash flow1
$B
‘07 to ‘16
20 ‘12 to ‘16
2016
10
0
-10
-20
XOM CVX RDS TOT BP
Proceeds from
‘16 Asset Sales 4.3 2.8 3.6 1.9 2.6
60 Reference material
|
|
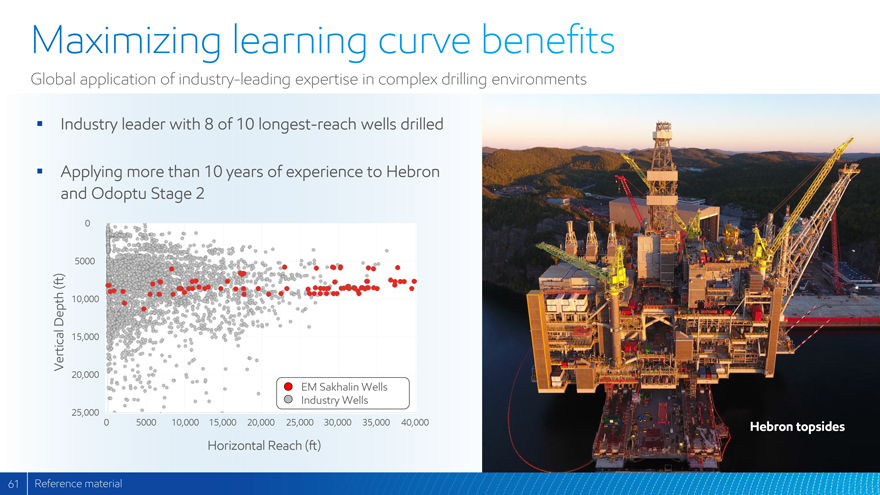
Maximizing learning curve benefits
Global application of industry-leading expertise in complex drilling environments
Industry leader with 8 of 10 longest-reach wells drilled
Applying more than 10 years of experience to Hebron and Odoptu Stage 2
0
5000
Vertical Depth (ft) 10,000
15,000
20,000
EM Sakhalin Wells
Industry Wells
25,000
0 5000 10,000 15,000 20,000 25,000 30,000 35,000 40,000
Horizontal Reach (ft)
Hebron topsides
61 Reference material
|
|
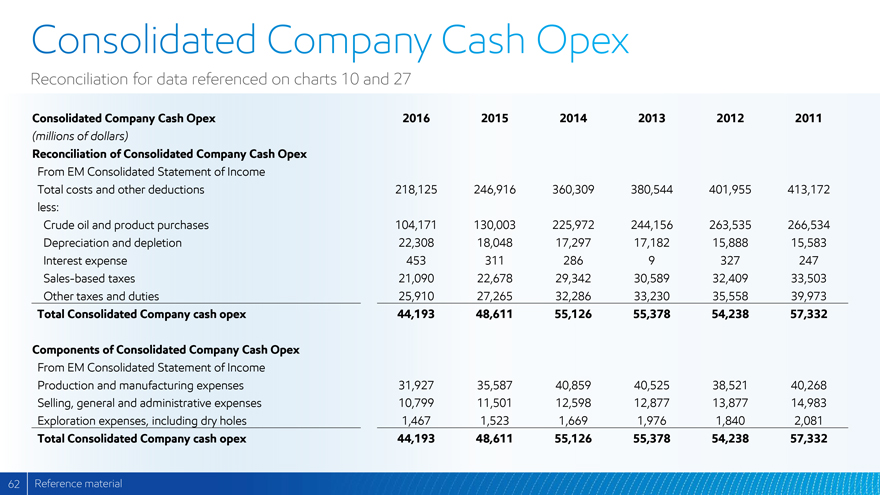
Consolidated Company Cash Opex
Reconciliation for data referenced on charts 10 and 27
Consolidated Company Cash Opex 2016 2015 2014 2013 2012 2011
(millions of dollars)
Reconciliation of Consolidated Company Cash Opex
From EM Consolidated Statement of Income
Total costs and other deductions 218,125 246,916 360,309 380,544 401,955 413,172
less:
Crude oil and product purchases 104,171 130,003 225,972 244,156 263,535 266,534
Depreciation and depletion 22,308 18,048 17,297 17,182 15,888 15,583
Interest expense 453 311 286 9 327 247
Sales-based taxes 21,090 22,678 29,342 30,589 32,409 33,503
Other taxes and duties 25,910 27,265 32,286 33,230 35,558 39,973
Total Consolidated Company cash opex 44,193 48,611 55,126 55,378 54,238 57,332
Components of Consolidated Company Cash Opex
From EM Consolidated Statement of Income
Production and manufacturing expenses 31,927 35,587 40,859 40,525 38,521 40,268
Selling, general and administrative expenses 10,799 11,501 12,598 12,877 13,877 14,983
Exploration expenses, including dry holes 1,467 1,523 1,669 1,976 1,840 2,081
Total Consolidated Company cash opex 44,193 48,611 55,126 55,378 54,238 57,332
62 Reference material