Exhibit 99.2
| Exhibit 99.2
|
2016 Analyst Meeting
New York Stock Exchange
March 2, 2016
|
|
Cautionary Statement
Forward-Looking Statements
Outlooks, projections, estimates, targets, business plans, and other statements of future events or conditions in this presentation or the subsequent discussion period are forward-looking statements. Actual future results, including financial and operating performance; demand growth and energy mix; ExxonMobil_s production growth and mix; the amount and mix of capital expenditures; future distributions; resource additions and recoveries; project plans, timing, costs, and capacities; efficiency gains; cost savings; integration benefits; product sales and mix; production rates; and the impact of technology could differ materially due to a number of factors. These include changes in oil or gas prices or other market conditions affecting the oil, gas, and petrochemical industries; reservoir performance; timely completion of development projects; war and other political or security disturbances; changes in law or government regulation, including environmental regulations and political sanctions; the outcome of commercial negotiations; the actions of competitors and customers; unexpected technological developments; general economic conditions, including the occurrence and duration of economic recessions; unforeseen technical difficulties; and other factors discussed here and under the heading “Factors Affecting Future Results” in the Investors section of our website at exxonmobil.com.
See also Item 1A of ExxonMobil_s 2015 Form 10-K. Forward-looking statements are based on management_s knowledge and reasonable expectations on the date hereof, and we assume no duty to update these statements as of any future date.
Frequently Used Terms
References to resources, resource base, recoverable resources, and similar terms include quantities of oil and gas that are not yet classified as proved reserves but that we believe will likely be moved into the proved reserves category and produced in the future. “Proved reserves” in this presentation are presented using the SEC pricing basis in effect for the year presented, except that for years prior to 2009, proved reserves were determined using the price and cost assumptions we used in managing the business, not historical prices used in SEC definitions; oil sands and equity company reserves are included for all periods. For definitions of, and information regarding, reserves, return on average capital employed, cash flow from operations and asset sales, free cash flow, and other terms used in this presentation, including information required by SEC Regulation G, see the “Frequently Used Terms” posted on the Investors section of our website. The Financial and Operating Review on our website also shows ExxonMobil’s net interest in specific projects.
The term project_ as used in this presentation can refer to a variety of different activities and does not necessarily have the same meaning as in any government payment transparency reports.
1
|
|
Agenda
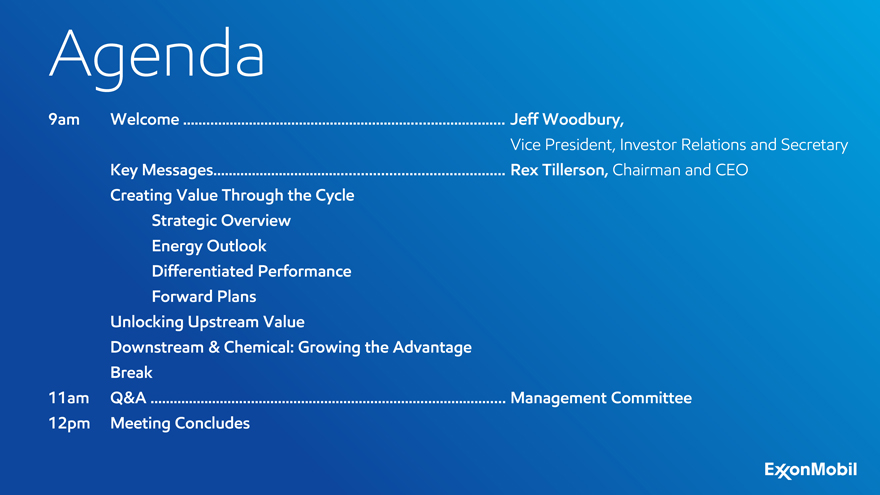
9am Welcome … Jeff Woodbury,
Vice President, Investor Relations and Secretary Key Messages Rex Tillerson, Chairman and CEO
Creating Value Through the Cycle Strategic Overview Energy Outlook Differentiated Performance Forward Plans Unlocking Upstream Value
Downstream & Chemical: Growing the Advantage Break
11am Q&A Management Committee 12pm Meeting Concludes
|
|
Key Messages
|
|
Key Messages
• Relentless focus on business fundamentals
Resilient integrated business model through the commodity price cycle Disciplined and paced investment approach focused on creating value Commitment to reliable and growing dividend
4
|
|
Creating Value Through the Cycle
Strategic Overview
|
|
Creating Value Through the Cycle: Strategic Overview
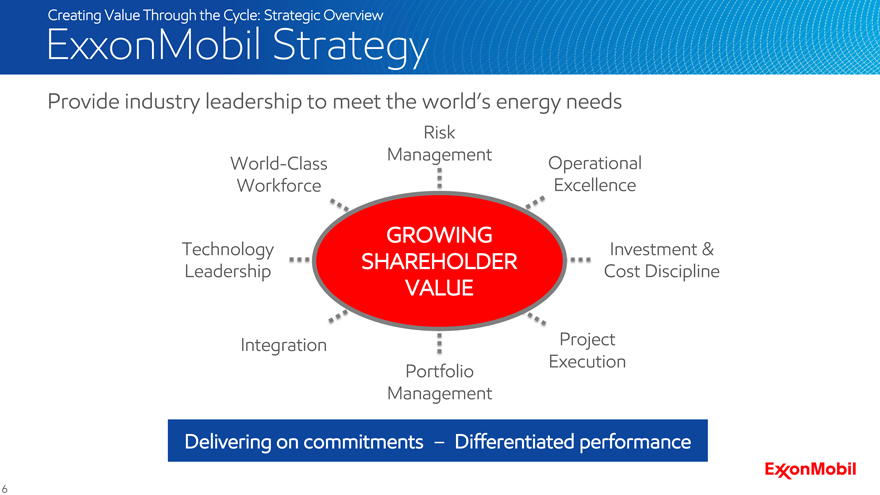
ExxonMobil Strategy
Provide industry leadership to meet the world_s energy needs
Risk
World-Class Management Operational
Workforce Excellence
GROWING
Technology Investment &
Leadership SHAREHOLDER Cost Discipline
VALUE
Integration Project
Portfolio Execution
Management
Delivering on commitments – Differentiated performance
6
|
|
Creating Value Through the Cycle: Strategic Overview
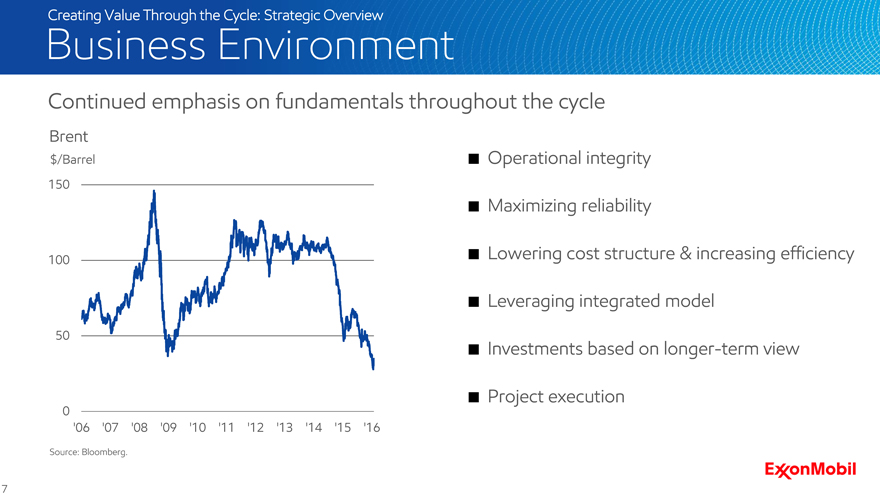
Business Environment
Continued emphasis on fundamentals throughout the cycle
Brent
$/Barrel
150
100
50
0
‘06 ‘07 ‘08 ‘09 ‘10 ‘11 ‘12 ‘13 ‘14 ‘15 ‘16
Source: Bloomberg.
Operational integrity
Maximizing reliability
Lowering cost structure & increasing efficiency
Leveraging integrated model
Investments based on longer-term view
Project execution
7
|
|
Creating Value Through the Cycle: Strategic Overview
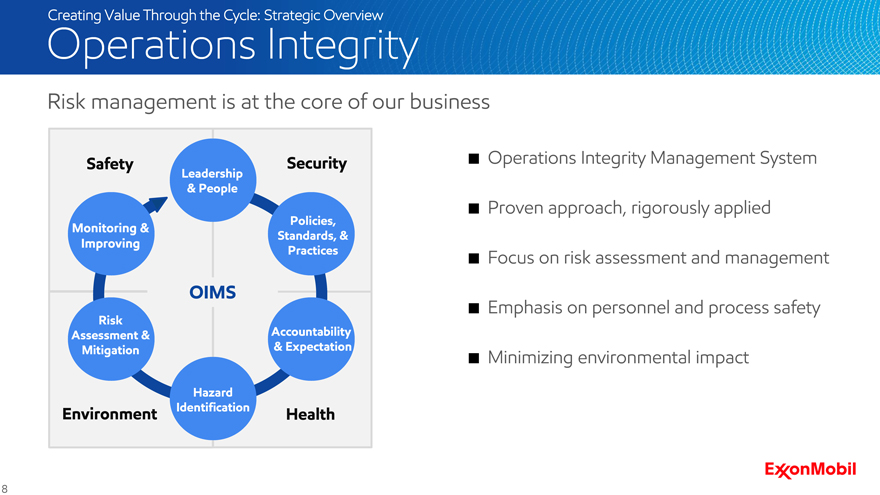
Operations Integrity
Risk management is at the core of our business
Operations Integrity Management System
Proven approach, rigorously applied
Focus on risk assessment and management
Emphasis on personnel and process safety
Minimizing environmental impact
8
|
|
Creating Value Through the Cycle: Strategic Overview
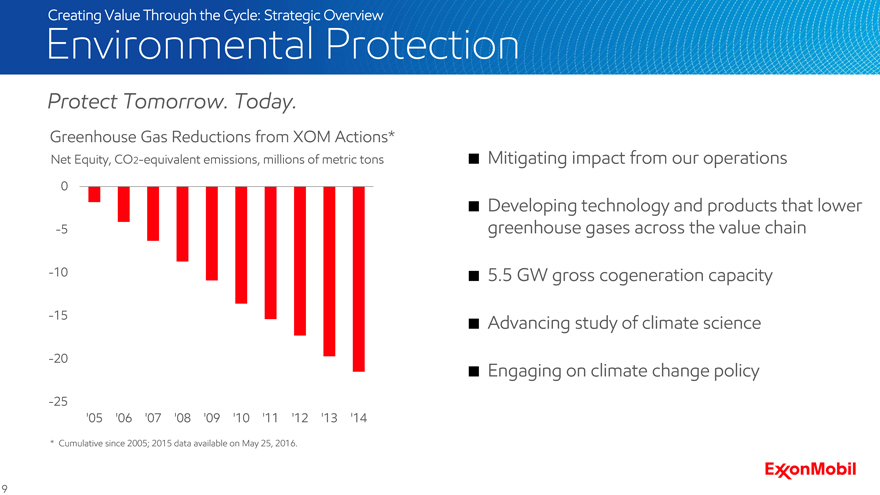
Environmental Protection
Protect Tomorrow. Today.
Greenhouse Gas Reductions from XOM Actions*
Net Equity, CO2-equivalent emissions, millions of metric tons 0
-5 -10 -15 -20
-25
‘05 ‘06 ‘07 ‘08 ‘09 ‘10 ‘11 ‘12 ‘13 ‘14
* Cumulative since 2005; 2015 data available on May 25, 2016.
Mitigating impact from our operations
Developing technology and products that lower
greenhouse gases across the value chain
5.5 GW gross cogeneration capacity
Advancing study of climate science
Engaging on climate change policy
9
|
|
Creating Value Through the Cycle: Strategic Overview
Business Integration
Delivers industry-leading returns through the business cycle
Understanding of full value chain leads
to resilient investments and operations
Diverse asset base provides optionality
Capture upside across entire value chain
Structural advantage underpins financial
strength
10
|
|
Creating Value Through the Cycle: Strategic Overview
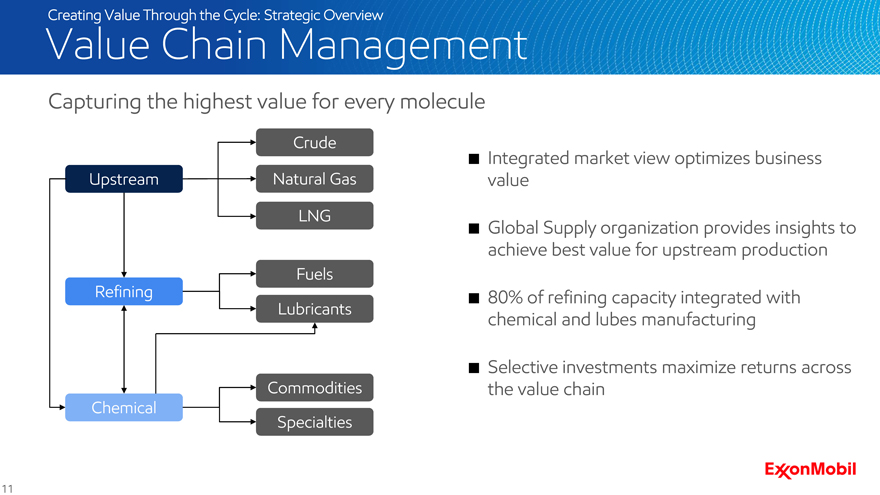
Value Chain Management
11
Capturing the highest value for every molecule
Crude
Upstream
Natural Gas
LNG
Fuels
Refining
Lubricants
Commodities
Chemical
Specialties
Integrated market view optimizes business
value
Global Supply organization provides insights to
achieve best value for upstream production
80% of refining capacity integrated with
chemical and lubes manufacturing
Selective investments maximize returns across
the value chain
|
|
Creating Value Through the Cycle: Strategic Overview
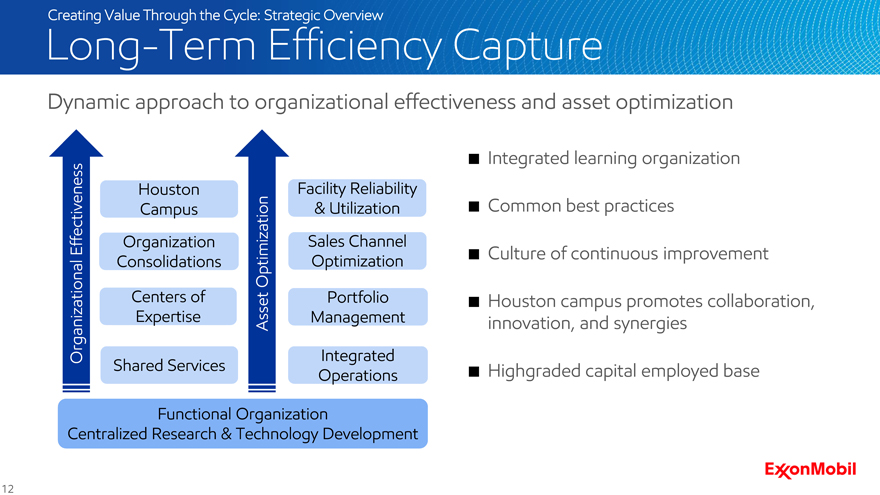
Long-Term Efficiency Capture
Dynamic approach to organizational effectiveness and asset optimization
Houston
Facility Reliability
Campus
& Utilization
Organization
Sales Channel
Consolidations
Optimization
Centers of
Portfolio
Expertise
Management
ganizational Effectiveness Or
Asset Optimization Integrated
Shared Services
Operations
Functional Organization
Centralized Research & Technology Development
Integrated learning organization
Common best practices
Culture of continuous improvement
Houston campus promotes collaboration,
innovation, and synergies
Highgraded capital employed base
12
|
|
Creating Value Through the Cycle: Strategic Overview
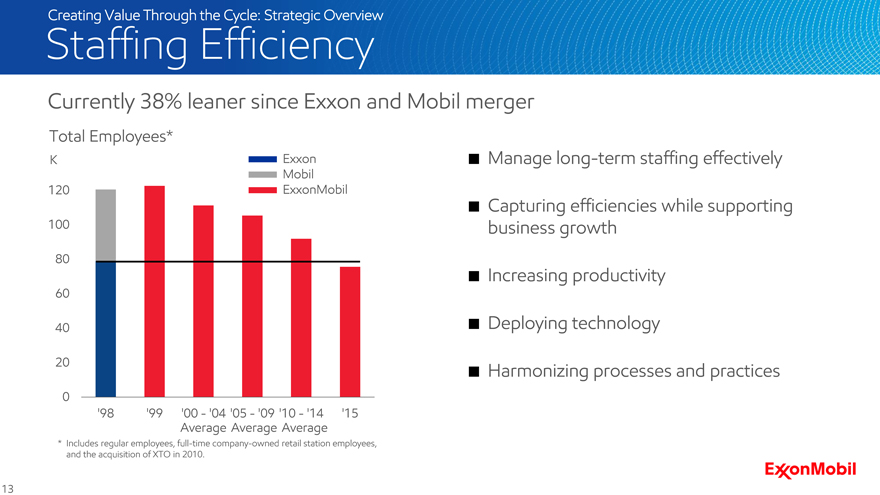
Staffing Efficiency
Currently 38% leaner since Exxon and Mobil merger
Total Employees*
K
Exxon
Mobil
120
ExxonMobil
100
80
60
40
20
0
‘98
‘99
‘00—‘04 ‘05—‘09 ‘10—‘14
‘15
Average Average Average
* Includes regular employees, full-time company-owned retail station employees, and the acquisition of XTO in 2010.
Manage long-term staffing effectively
Capturing efficiencies while supporting
business growth
Increasing productivity
Deploying technology
Harmonizing processes and practices
13
|
|
Creating Value Through the Cycle: Strategic Overview
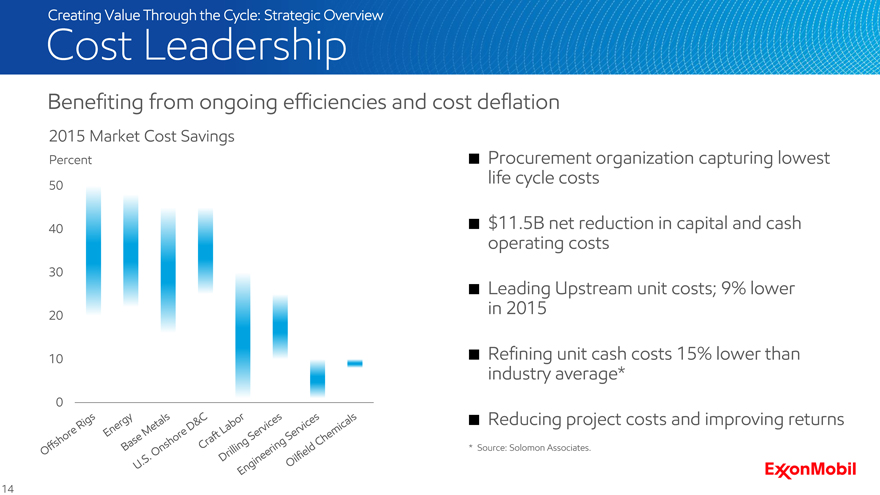
Cost Leadership
Benefiting from ongoing efficiencies and cost deflation
14
2015 Market Cost Savings
Percent
50
40
30
20
10
0
Procurement organization capturing lowest
life cycle costs
$11.5B net reduction in capital and cash
operating costs
Leading Upstream unit costs; 9% lower
in 2015
Refining unit cash costs 15% lower than
industry average*
Reducing project costs and improving returns
* Source:Solomon Associates.
|
|
Creating Value Through the Cycle: Strategic Overview
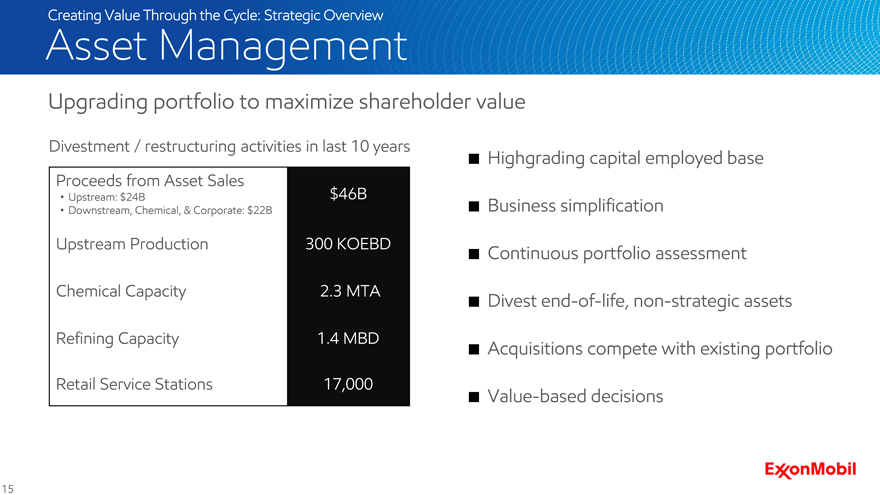
Asset Management
Upgrading portfolio to maximize shareholder value
15
Divestment / restructuring activities in last 10 years
Proceeds from Asset Sales
Upstream: $24B
$46B
Downstream, Chemical, & Corporate: $22B
Upstream Production
300 KOEBD
Chemical Capacity
2.3 MTA
Refining Capacity
1.4 MBD
Retail Service Stations
17,000
Highgrading capital employed base
Business simplification
Continuous portfolio assessment
Divest end-of-life, non-strategic assets
Acquisitions compete with existing portfolio
Value-based decisions
|
|
Creating Value Through the Cycle: Strategic Overview
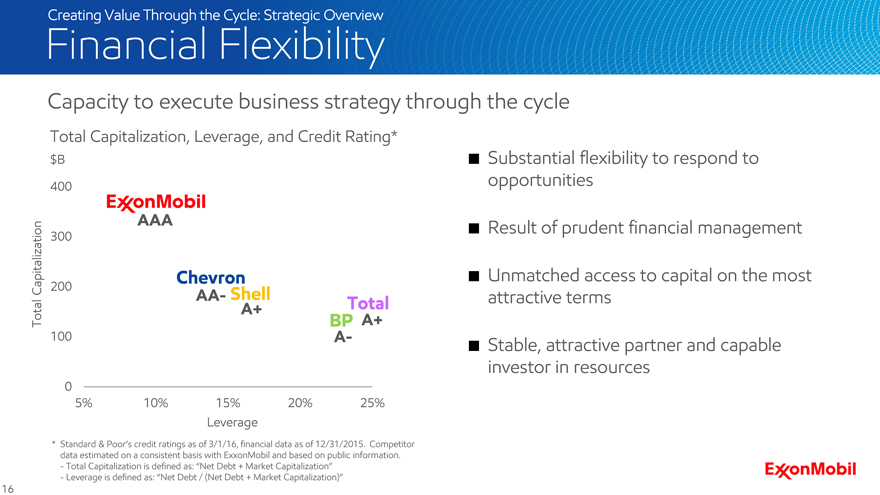
Financial Flexibility
Capacity to execute business strategy through the cycle
0
5% 10% 15% 20% 25% Leverage
* Standard & Poor_s credit ratings as of 3/1/16, financial data as of 12/31/2015. Competitor data estimated on a consistent basis with ExxonMobil and based on public information.
• Total Capitalization is defined as: Net Debt + Market Capitalization_
• Leverage is defined as: Net Debt / (Net Debt + Market Capitalization)_
16
Total Capitalization, Leverage, and Credit Rating*
$B
400
AAA
300
200
Chevron AA- Shell
A+
Total
Total Capitalization
BP A+
100
A-
Substantial flexibility to respond to
opportunities
Result of prudent financial management
Unmatched access to capital on the most
attractive terms
Stable, attractive partner and capable
investor in resources
|
|
Energy Outlook
|
|
Creating Value Through the Cycle: Energy Outlook
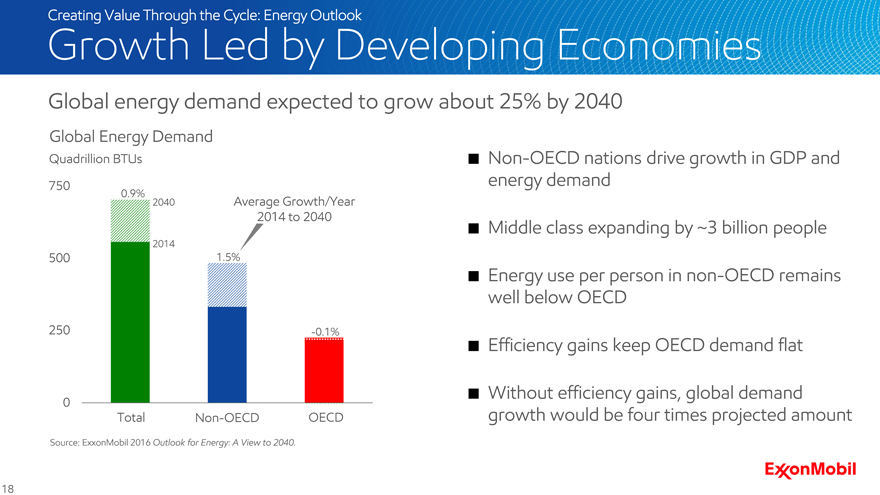
Growth Led by Developing Economies
Global energy demand expected to grow about 25% by 2040
Global Energy Demand
Quadrillion BTUs
750
0.9% 2040
Average Growth/Year
2014 to 2040
2014
500
1.5%
250 -0.1%
0
Total
Non-OECD
OECD
Source: ExxonMobil 2016 Outlook for Energy: AView to 2040.
Non-OECD nations drive growth in GDP and
energy demand
Middle class expanding by ~3 billion people
Energy use per person in non-OECD remains
well below OECD
Efficiency gains keep OECD demand flat
Without efficiency gains, global demand
growth would be four times projected amount
18
|
|
Creating Value Through the Cycle: Energy Outlook
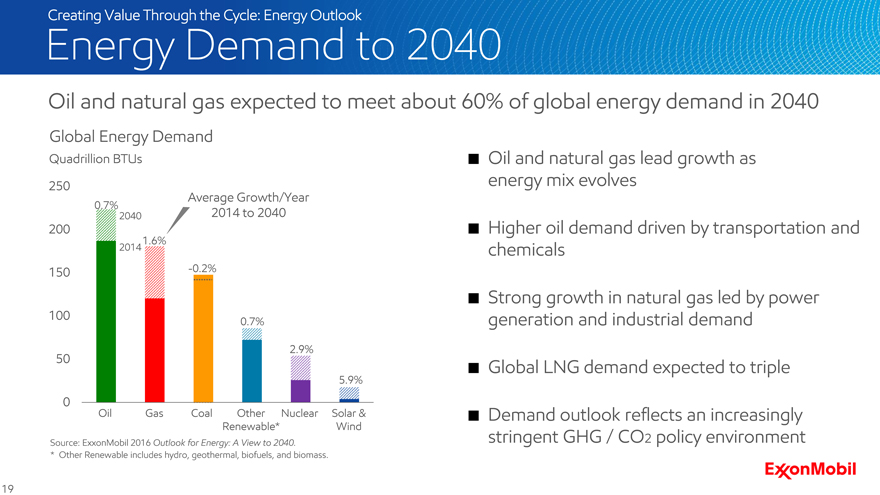
Energy Demand to 2040
Oil and natural gas expected to meet about 60% of global energy demand in 2040
Global Energy Demand
Quadrillion BTUs
250
Average Growth/Year
0.7% 2040
2014 to 2040
200
2014 1.6%
150
-0.2%
100
0.7%
2.9%
50
5.9%
0
Oil
Gas
Coal
Other
Nuclear
Solar &
Renewable*
Wind
Source: ExxonMobil 2016 Outlook for Energy: A View to 2040.
* Other Renewable includes hydro, geothermal, biofuels,and biomass.
Oil and natural gas lead growth as
energy mix evolves
Higher oil demand driven by transportation and
chemicals
Strong growth in natural gas led by power
generation and industrial demand
Global LNG demand expected to triple
Demand outlook reflects an increasingly
stringent GHG / CO2 policy environment
19
|
|
Creating Value Through the Cycle: Energy Outlook
Key Perspectives
Outlook guides our business strategy and investment plans
Affordable energy solutions are essential to advance global prosperity
Diverse energy supplies are required to meet demand growth
Technology advancements expand energy options and minimize environmental footprint
Resource access and substantial investments are necessary to meet demand
Free trade and sound, predictable government policies and processes are vital
20
|
|
Creating Value Through the Cycle
Differentiated Performance
|
|
22
Creating Value Through the Cycle: Differentiated Performance
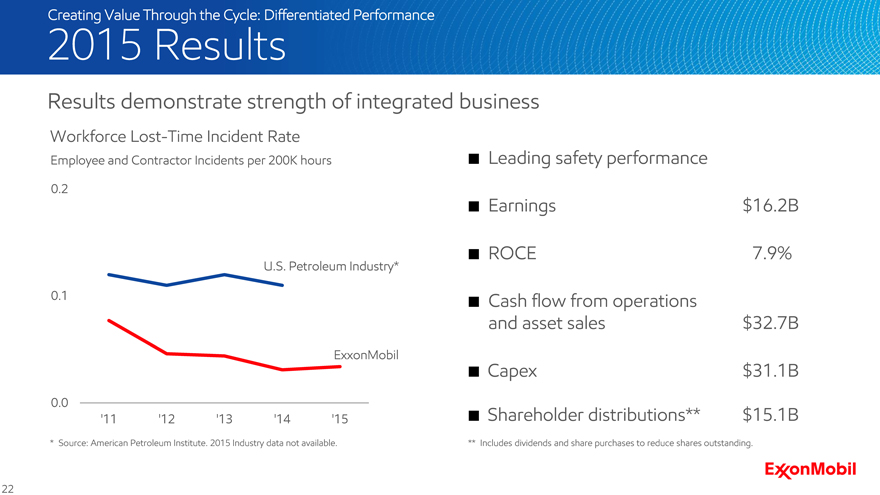
2015 Results
Results demonstrate strength of integrated business
Workforce Lost-Time Incident Rate
Employee and Contractor Incidents per 200K hours
0.2
U.S. Petroleum Industry*
0.1
ExxonMobil
0.0
‘11
‘12
‘13
‘14
‘15
Leading safety performance
Earnings
$16.2B
ROCE
$7.9%
Cash flow from operations
and asset sales
$32.7B
Capex
$31.1B
Shareholder distributions**
$
15.1B
* Source:American Petroleum Institute. 2015 Industry data not available.
** Includes dividends and share purchases to reduce shares outstanding.
|
|
Creating Value Through the Cycle: Differentiated Performance
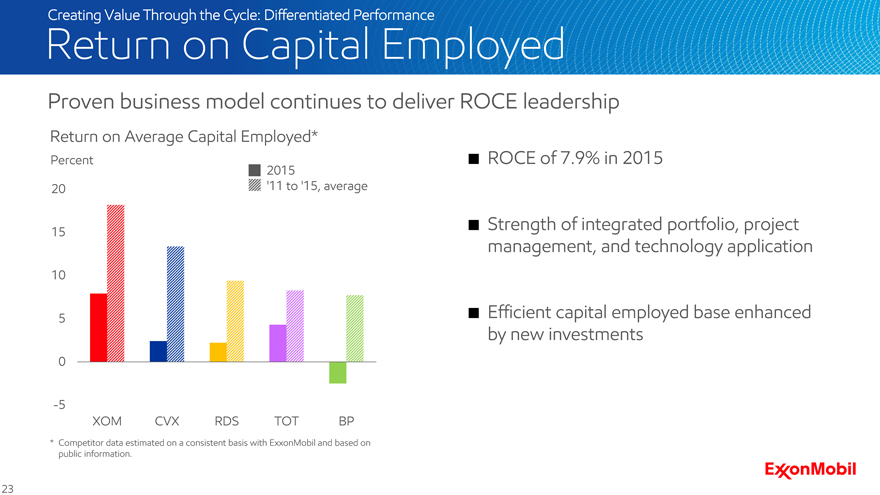
Return on Capital Employed
Proven business model continues to deliver ROCE leadership
Return on Average Capital Employed*
Percent
2015
20
‘11 to ‘15,
average
15
10
5
0
-5
XOM
CVX
RDS TOT
BP
* Competitor data estimated on a consistent basis with ExxonMobil and based on public information.
ROCE of 7.9% in 2015
Strength of integrated portfolio, project
management, and technology application
Efficient capital employed base enhanced
by new investments
23
|
|
Creating Value Through the Cycle: Differentiated Performance
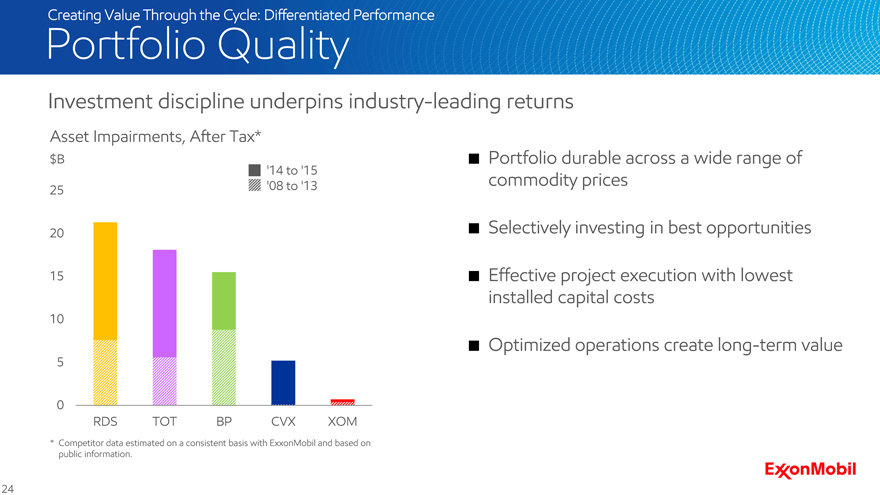
Portfolio Quality
Investment discipline underpins industry-leading returns
Asset Impairments, After Tax*
$B
‘14 to
‘15
25
‘08 to
‘13
20
15
10
5
0
RDS
TOT
BP
CVX
XOM
* Competitor data estimated on a consistent basis with ExxonMobil and based on public information.
Portfolio durable across a wide range of
commodity prices
Selectively investing in best opportunities
Effective project execution with lowest
installed capital costs
Optimized operations create long-term value
24
|
|
Creating Value Through the Cycle: Differentiated Performance
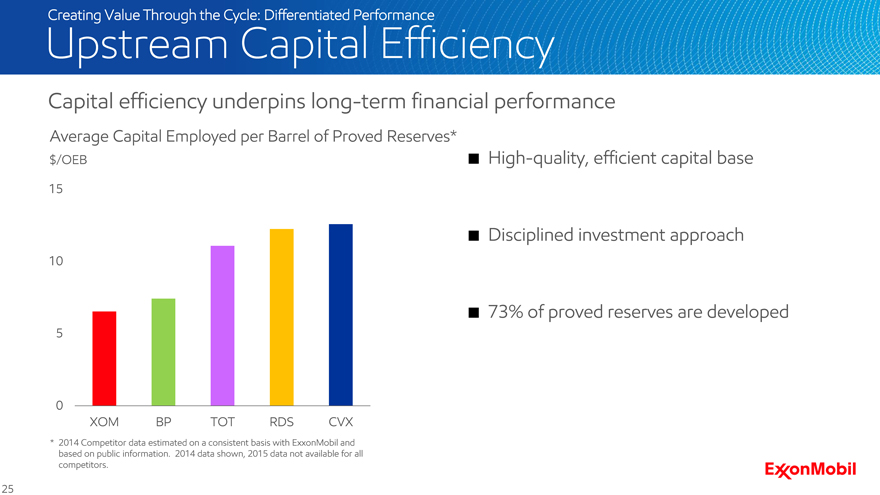
Upstream Capital Efficiency
Capital efficiency underpins long-term financial performance
Average Capital Employed per Barrel of Proved Reserves*
$/OEB
15
10
5
0
XOM
BP
TOT
RDS
CVX
High-quality, efficient capital base
Disciplined investment approach
73% of proved reserves are developed
* 2014 Competitor data estimated on a consistent basis with ExxonMobil and based on public information. 2014 data shown, 2015 data not available for all competitors.
25
|
|
Creating Value Through the Cycle: Differentiated Performance
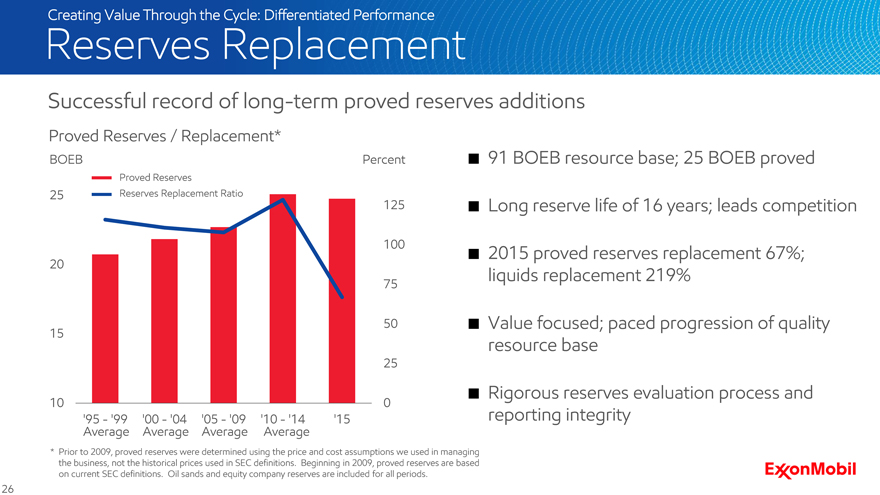
Reserves Replacement
Successful record of long-term proved reserves additions
Proved Reserves / Replacement*
BOEB
Percent
Proved Reserves
25
Reserves Replacement Ratio
125
100
20
75
50
15
25
10
0
‘95—‘99 ‘00—‘04 ‘05—‘09
‘10—‘14
‘15
Average Average Average
Average
91 BOEB resource base; 25 BOEB proved
Long reserve life of 16 years; leads competition
2015 proved reserves replacement 67%;
liquids replacement 219%
Value focused; paced progression of quality
resource base
Rigorous reserves evaluation process and
reporting integrity
* Prior to 2009, proved reserves were determined using the price and cost assumptions we used in managing the business, not the historical prices used in SEC definitions. Beginning in 2009, proved reserves are based on current SEC definitions. Oil sands and equity company reserves are included for all periods.
26
|
|
Creating Value Through the Cycle: Differentiated Performance
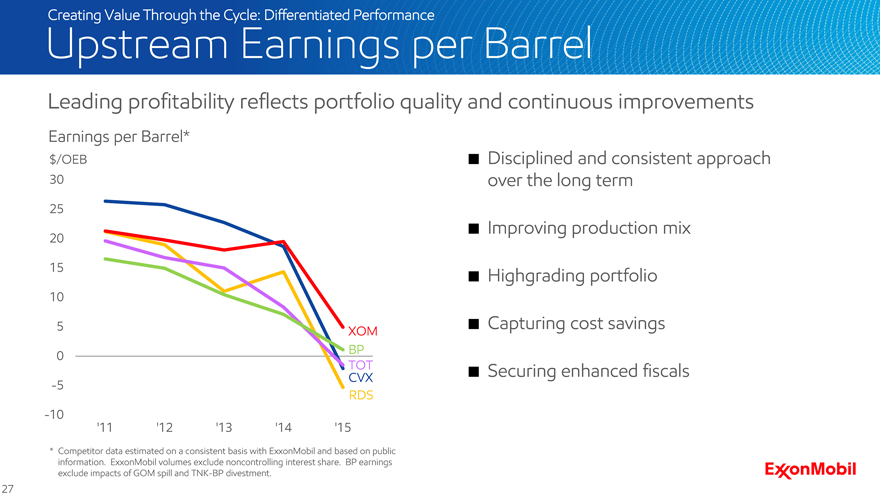
Upstream Earnings per Barrel
Leading profitability reflects portfolio quality and continuous improvements
Earnings per Barrel*
$/OEB
30
25
20
15
10
5
XOM
0
BP
TOT
-5
CVX
RDS
-10
‘11
‘12
‘13
‘14
‘15
Disciplined and consistent approach
over the long term
Improving production mix
Highgrading portfolio
Capturing cost savings
Securing enhanced fiscals
* Competitor data estimated on a consistent basis with ExxonMobil and based on public information. ExxonMobil volumes exclude noncontrolling interest share. BP earnings exclude impacts of GOM spill and TNK-BP divestment.
27
|
|
Creating Value Through the Cycle: Differentiated Performance
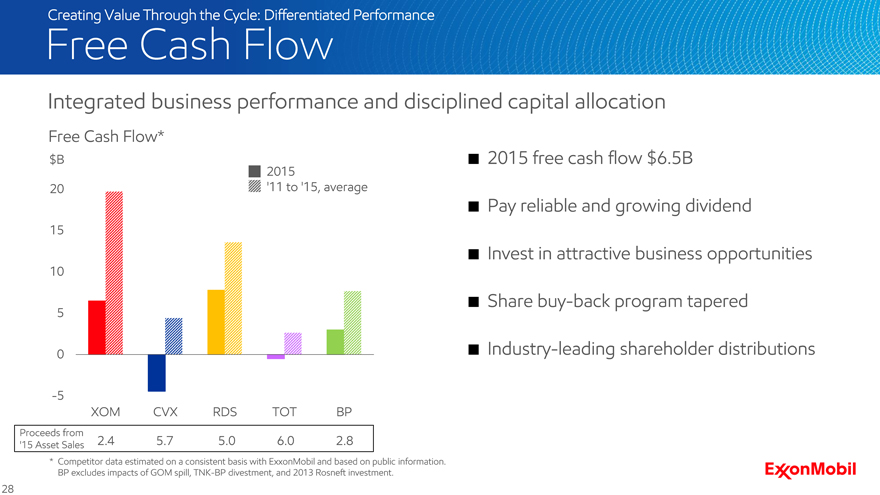
Free Cash Flow
Integrated business performance and disciplined capital allocation
Free Cash Flow*
$B
2015
20
‘11 to ‘15, average
15
10
5
0
-5
XOM
CVX
RDS
TOT
BP
Proceeds from
‘15 Asset Sales
2.4
5.7
5.0
6.0
2.8
2015 free cash flow $6.5B
Pay reliable and growing dividend
Invest in attractive business opportunities
Share buy-back program tapered
Industry-leading shareholder distributions
* Competitor data estimated on a consistent basis with ExxonMobil and based on public information. BP excludes impacts of GOM spill, TNK-BP divestment, and 2013 Rosneft investment.
28
|
|
Creating Value Through the Cycle: Differentiated Performance
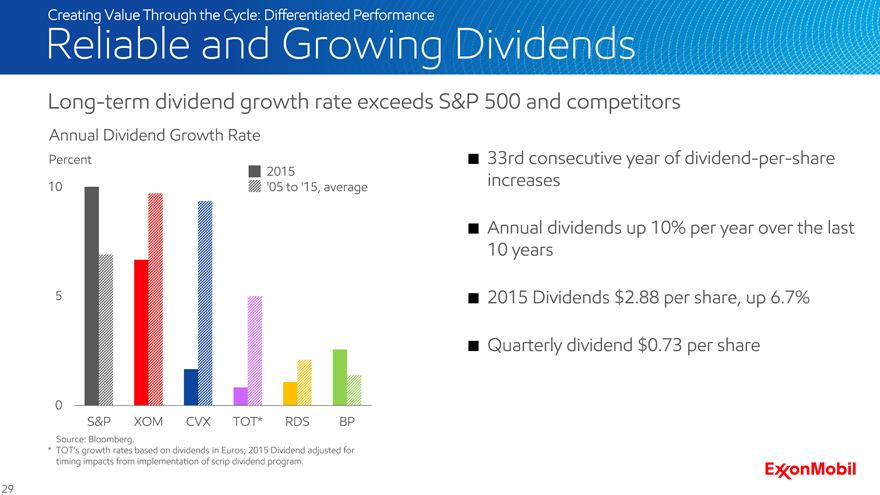
Reliable and Growing Dividends
Long-term dividend growth rate exceeds S&P 500 and competitors
Annual Dividend Growth Rate
Percent
2015
10
‘05 to ‘15, average
5
0
S&P
XOM
CVX
TOT*
RDS
BP
Source: Bloomberg.
* TOT_s growth rates based on dividends in Euros; 2015 Dividend adjusted for timing impacts from implementation of scrip dividend program.
33rd consecutive year of dividend-per-share
increases
Annual dividends up 10% per year over the last
10 years
2015 Dividends $2.88 per share, up 6.7%
Quarterly dividend $0.73 per share
29
|
|
Creating Value Through the Cycle: Differentiated Performance
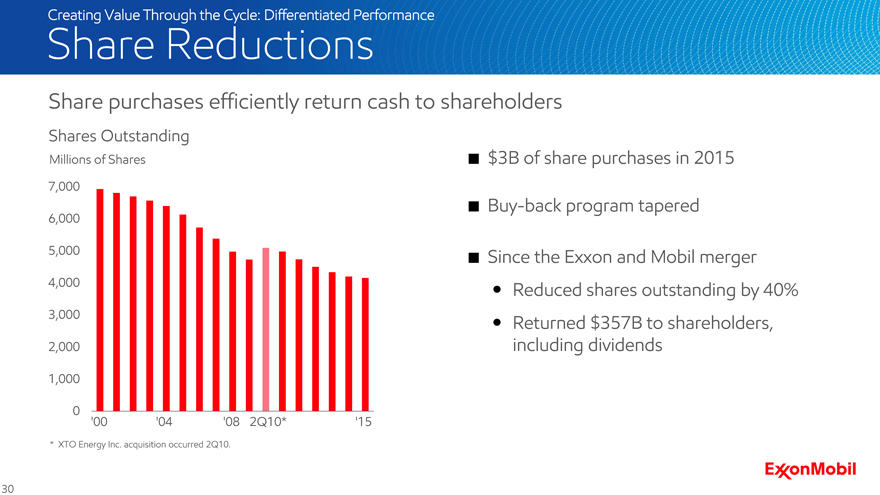
Share Reductions
Share purchases efficiently return cash to shareholders
Shares Outstanding
Millions of Shares
7,000
6,000
5,000
4,000
3,000
2,000
1,000
0
‘00
‘04
‘08
2Q10*
‘15
* XTO Energy Inc. acquisition occurred 2Q10.
$3B of share purchases in 2015
Buy-back program tapered
Since the Exxon and Mobil merger
Reduced shares outstanding by 40%
Returned $357B to shareholders,
including dividends
30
|
|
Creating Value Through the Cycle
Forward Plans
|
|
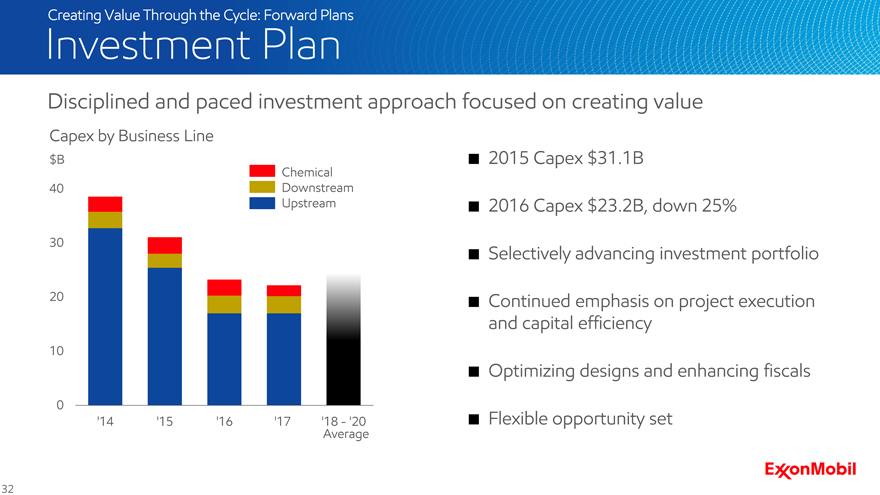
Creating Value Through the Cycle: Forward Plans
Investment Plan
Disciplined and paced investment approach focused on creating value
Capex by Business Line
$B
Chemical
40
Downstream
Upstream
30
20
10
0
‘14
‘15
‘16
‘17
‘18—‘20
Average
2015 Capex $
31.1B
2016 Capex $
23.2B, down 25%
Selectively advancing investment portfolio
Continued emphasis on project execution
and capital efficiency
Optimizing designs and enhancing fiscals
Flexible opportunity set
32
|
|
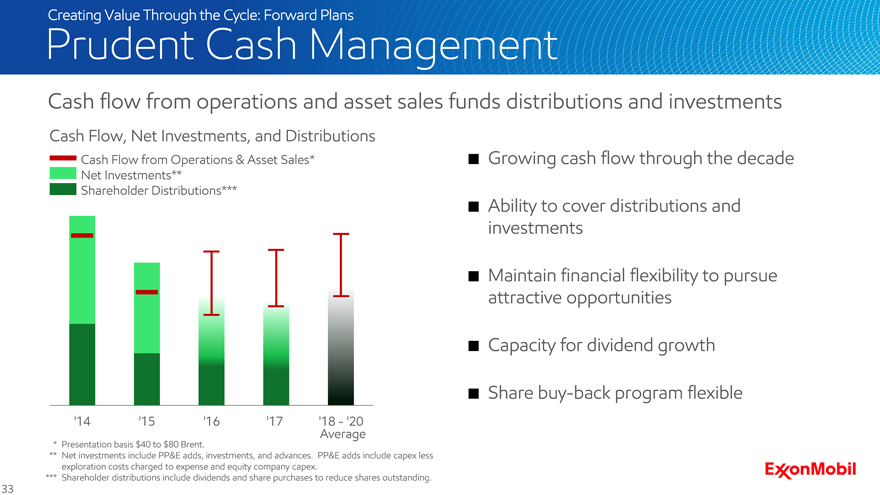
Creating Value Through the Cycle: Forward Plans
Prudent Cash Management
Cash flow from operations and asset sales funds distributions and investments
Cash Flow, Net Investments, and Distributions
* Presentation basis $40 to $80 Brent.
** Net investments include PP&E adds, investments, and advances. PP&E adds include capex less exploration costs charged to expense and equity company capex.
*** Shareholder distributions include dividends and share purchases to reduce shares outstanding.
33
Cash Flow from Operations &
Asset Sales*
Net Investments**
Shareholder Distributions***
‘14
‘15
‘16
‘17
‘18—‘20
Average
Growing cash flow through the decade
Ability to cover distributions and
investments
Maintain financial flexibility to pursue
attractive opportunities
Capacity for dividend growth
Share buy-back program flexible
|
|
Creating Value Through the Cycle: Forward Plans
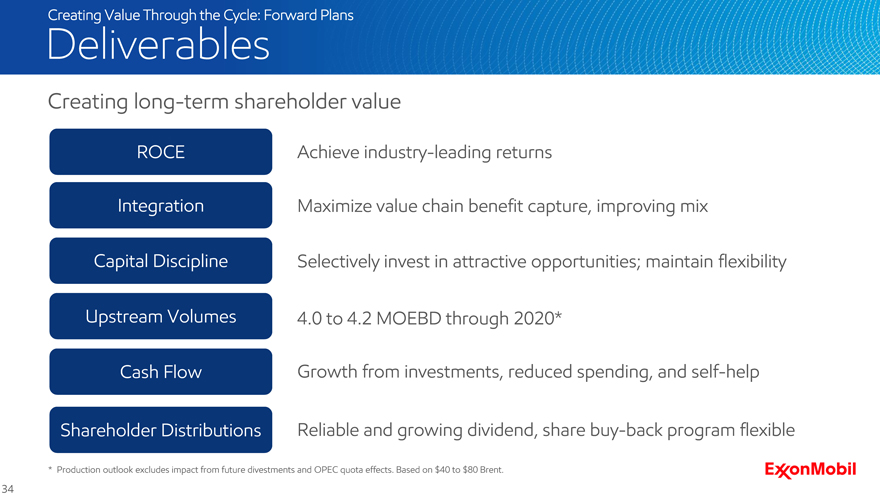
Deliverables
Creating long-term shareholder value
ROCE
Achieve industry-leading returns
Integration
Maximize value chain benefit capture, improving mix
Capital Discipline
Selectively invest in attractive opportunities; maintain flexibility
Upstream Volumes
4.0 to 4.2 MOEBD through 2020*
Cash Flow
Growth from investments, reduced spending, and self-help
Shareholder Distributions
Reliable and growing dividend, share buy-back program flexible
* Production outlook excludes impact from future divestments and OPEC quota effects. Based on $40 to $80 Brent.
34
|
|
Unlocking Upstream Value
|
|
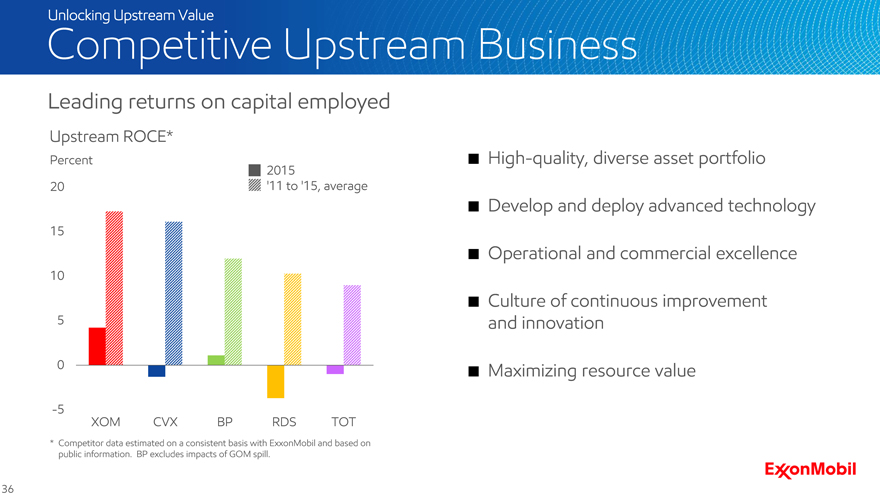
Unlocking Upstream Value
Competitive Upstream Business
Leading returns on capital employed
* Competitor data estimated on a consistent basis with ExxonMobil and based on public information. BP excludes impacts of GOM spill.
High-quality, diverse asset portfolio
Develop and deploy advanced technology
Operational and commercial excellence
Culture of continuous improvement
and innovation
Maximizing resource value
36
|
|
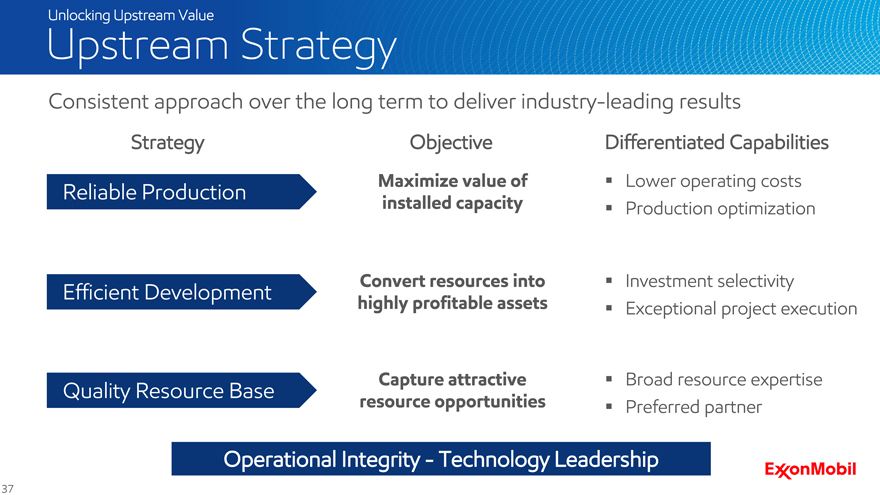
Unlocking Upstream Value
Upstream Strategy
Consistent approach over the long term to deliver industry-leading results
Strategy Objective Differentiated Capabilities
Reliable
Production
Maximize value of
Lower operating costs
installed capacity
Production optimization
Efficient
Development
Convert resources into
Investment selectivity
highly profitable assets
Exceptional project execution
Quality Resource Base
Capture attractive
Broad resource expertise
resource opportunities
Preferred partner
Operational Integrity -Technology Leadership
37
|
|
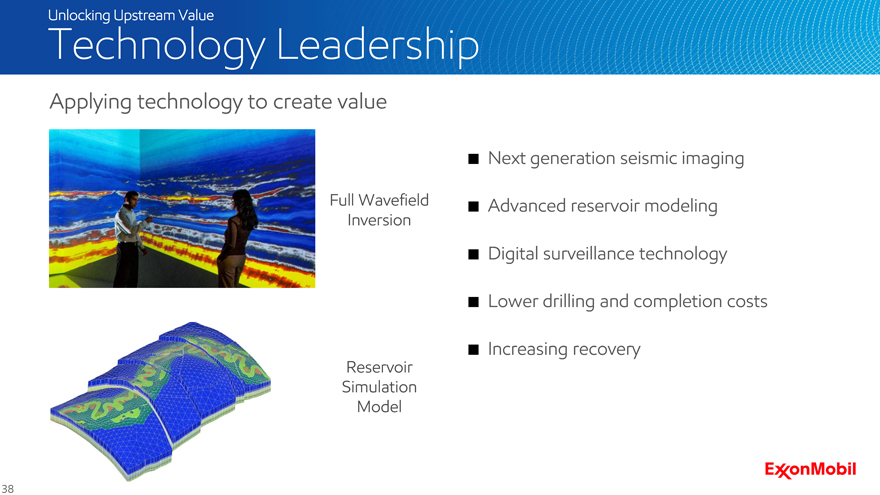
Unlocking Upstream Value
Technology Leadership
Reservoir Simulation Model
38
Applying technology to create value
Full Wavefield Inversion
Next generation seismic imaging
Advanced reservoir modeling
Digital surveillance technology
Lower drilling and completion costs
Increasing recovery
|
|
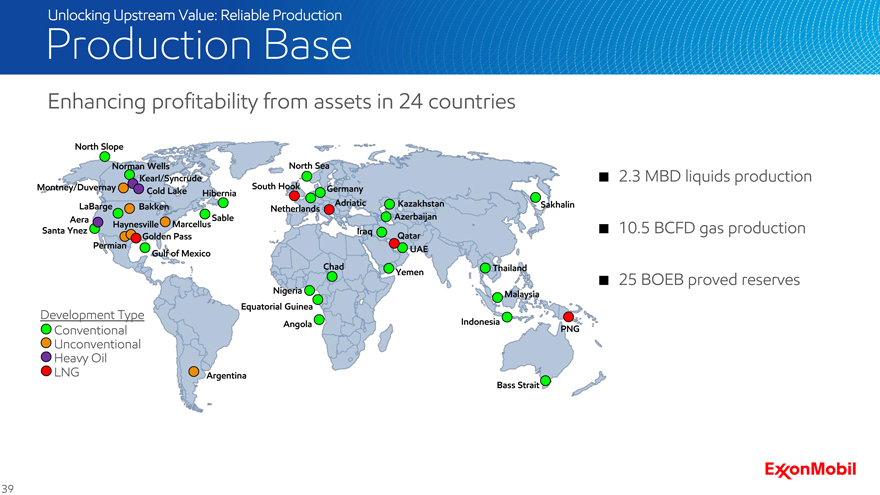
Unlocking Upstream Value: Reliable Production
Production Base
Enhancing profitability from assets in 24 countries
North Slope
Norman Wells North Sea
Kearl/Syncrude
Montney/Duvernay South Hook Germany Cold Lake Hibernia
LaBarge Bakken Adriatic Kazakhstan Sakhalin Netherlands Aera Sable Azerbaijan Haynesville Marcellus Santa Ynez Iraq Golden Pass Qatar
Permian UAE Gulf of Mexico
Chad Thailand Yemen Nigeria Malaysia Equatorial Guinea
Development Type
Angola Indonesia
Conventional PNG Unconventional Heavy Oil
LNG Argentina
Bass Strait
2.3 MBD liquids production
10.5 BCFD gas production
25 BOEB proved reserves
39
|
|
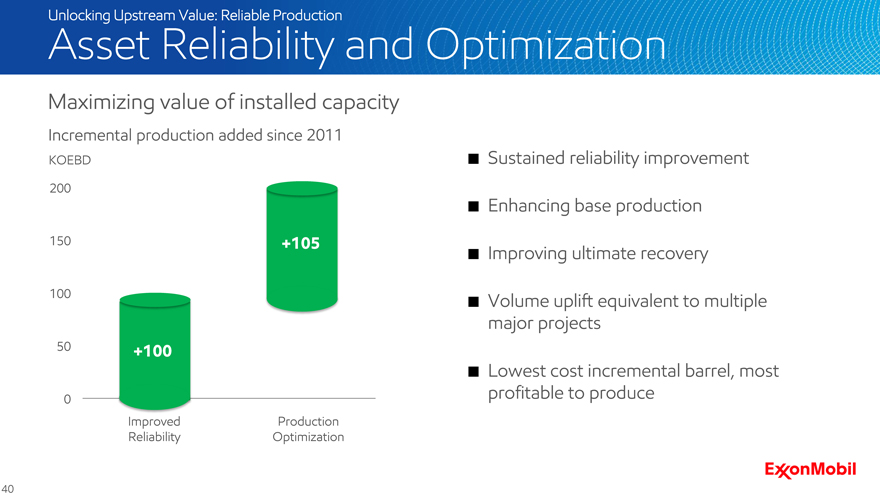
Unlocking Upstream Value: Reliable Production
Asset Reliability and Optimization
Maximizing value of installed capacity
Incremental production added since 2011
KOEBD 200
150 +105
100
50 +100
Improved
Production
Reliability
Optimization
Sustained reliability improvement
Enhancing base production
Improving ultimate recovery
Volume uplift equivalent to multiple
major projects
Lowest cost incremental barrel, most
profitable to produce
40
|
|
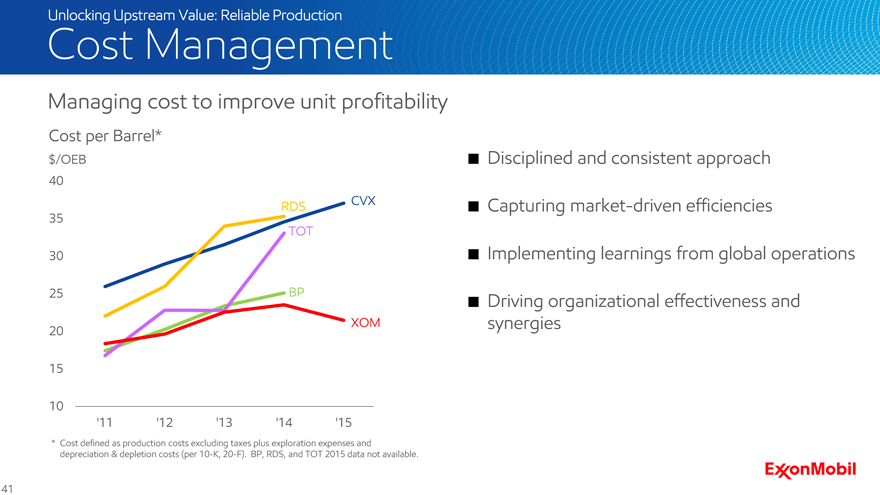
Unlocking Upstream Value: Reliable Production
Cost Management
Managing cost to improve unit profitability
Cost per Barrel*
$/OEB
40
RDS
CVX
35
TOT
30
25
BP
20
XOM
15
10
‘11
‘12
‘13
‘14
‘15
* Cost defined as production costs excluding taxes plus exploration expenses and depreciation & depletion costs (per 10-K, 20-F). BP, RDS, and TOT 2015 data not available.
Disciplined and consistent approach
Capturing market-driven efficiencies
Implementing learnings from global operations
Driving organizational effectiveness and
synergies
41
|
|
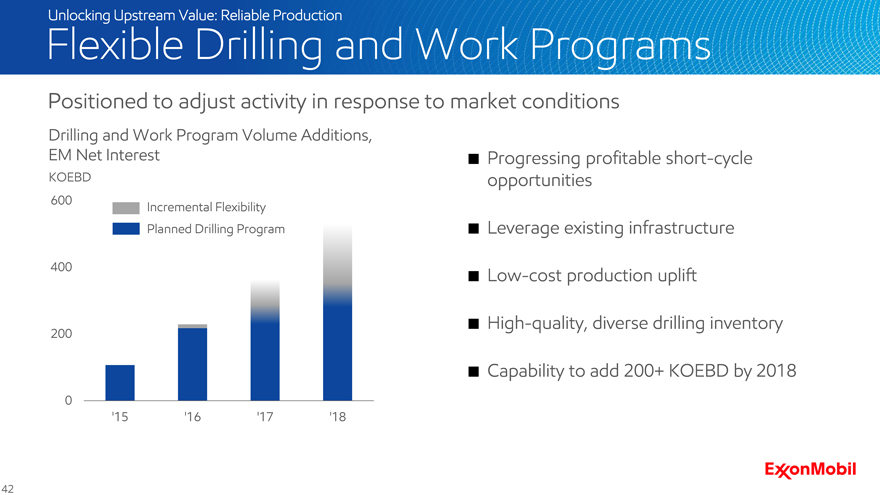
Unlocking Upstream Value: Reliable Production
Flexible Drilling and Work Programs
Positioned to adjust activity in response to market conditions
Drilling and Work Program Volume Additions, EM Net Interest
KOEBD
600
Incremental Flexibility
Planned Drilling Program
400
200
0
‘15
‘16
‘17
‘18
Progressing profitable short-cycle
opportunities
Leverage existing infrastructure
Low-cost production uplift
High-quality, diverse drilling inventory
Capability to add 200+ KOEBD by 2018
42
|
|
Unlocking Upstream Value: Reliable Production
U.S. Unconventional Portfolio
Unlocking value of a 15+ BOEB resource base
Near-term focus on Permian and Bakken
liquids plays
2.1 million net acres
220 KOEBD current net production
Low development and operating costs
Enhancing position through trades and
farm-ins
Operating position enables development
flexibility
43
|
|
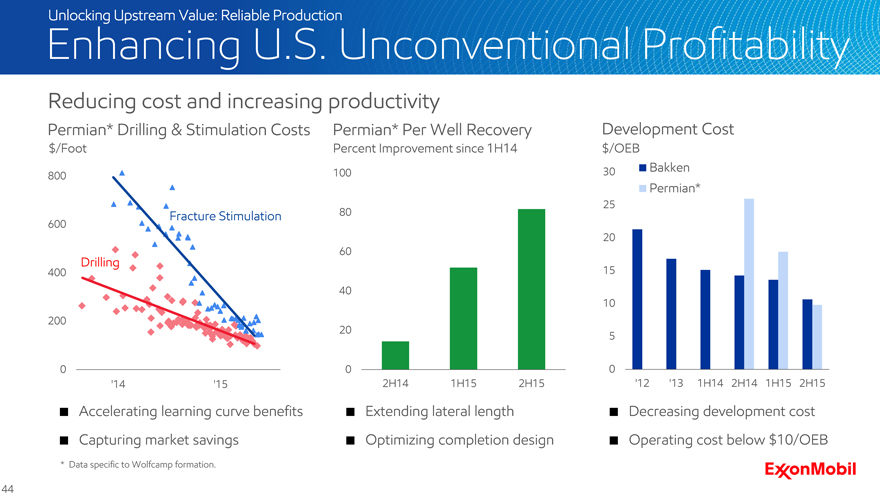
Unlocking Upstream Value: Reliable Production
Enhancing U.S. Unconventional Profitability
Reducing cost and increasing productivity
Permian* Drilling & Stimulation Costs
Permian* Per Well Recovery
Development Cost
$/Foot
Percent Improvement since 1H14
$/OEB
800
100
30
Bakken
Permian*
25
600
Fracture Stimulation
80
20
60
Drilling
400
15
40
10
200
20
5
0
0
0
‘14
‘15
2H14
1H15
2H15
‘12
‘13 1H14 2H14
1H15
2H15
Accelerating learning curve benefits
Extending lateral length
Decreasing development cost
Capturing market savings
Optimizing completion design
Operating cost below $10/OEB
* Dataspecific to Wolfcampformation.
44
|
|
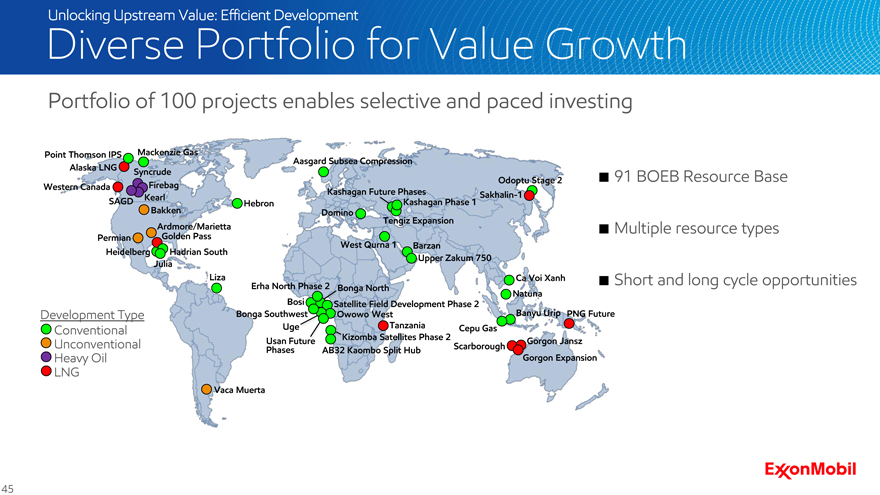
Unlocking Upstream Value: Efficient Development
Diverse Portfolio for Value Growth
Portfolio of 100 projects enables selective and paced investing
Point Thomson IPS
Mackenzie Gas
Aasgard Subsea Compression
Alaska LNG
Syncrude
Odoptu Stage 2
91 BOEB Resource Base
Western Canada
Firebag
Kearl
Kashagan Future Phases
Sakhalin-1
SAGD
Hebron
Kashagan Phase 1
Bakken
Domino
Ardmore/Marietta
Tengiz Expansion
Multiple resource types
Permian
Golden Pass
West Qurna 1
Barzan
Heidelberg Hadrian South
Upper Zakum 750
Julia
Liza
Ca Voi Xanh
Short and long cycle opportunities
Erha North Phase 2 Bonga North
Natuna
Bosi
Satellite Field Development Phase 2
Development Type
Bonga Southwest
Owowo West
Banyu Urip
PNG Future
Conventional
Uge
Tanzania
Cepu Gas
Unconventional
Usan Futu
Kizomba Satellites Phase 2
Gorgon Jansz
Phases
AB32 Kaombo Split Hub
Scarborough
Heavy Oil
Gorgon Expansion
LNG
Vaca Muerta
45
|
|
Unlocking Upstream Value: Efficient Development
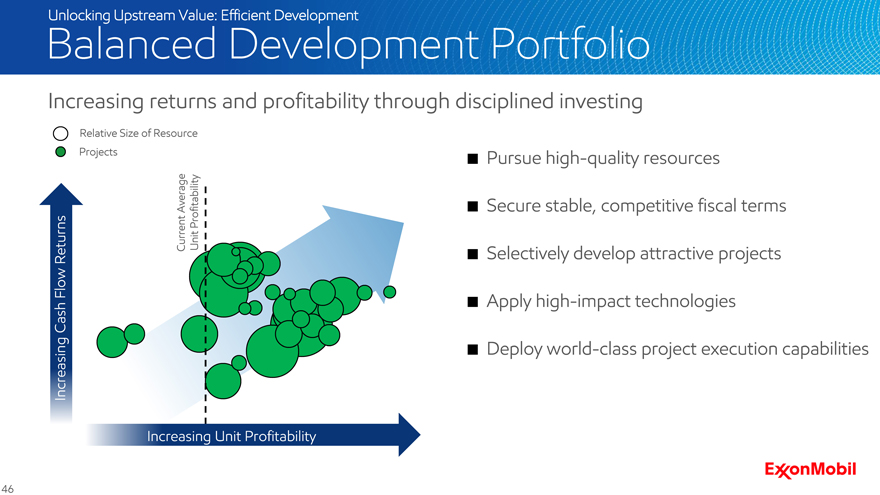
Balanced Development Portfolio
Increasing returns and profitability through disciplined investing
Relative Size of Resource
Projects
Pursue high-quality resources
Current Average Unit Profitability Secure stable, competitive fiscal terms
Selectively develop attractive projects
Apply high-impact technologies
Cash Flow Returns Increasing
Deploy world-class project execution capabilities
Increasing Unit Profitability
46
|
|
Unlocking Upstream Value: Efficient Development
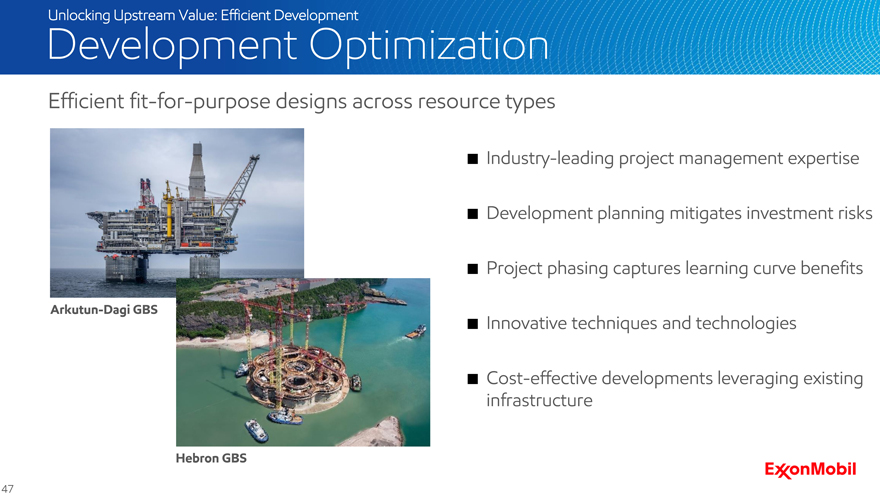
Development Optimization
Efficient fit-for-purpose designs across resource types
Industry-leading project management expertise
Development planning mitigates investment risks
Project phasing captures learning curve benefits
Arkutun-Dagi GBS
Innovative techniques and technologies
Cost-effective developments leveraging existing
infrastructure
Hebron GBS
47
|
|
Unlocking Upstream Value: Efficient Development
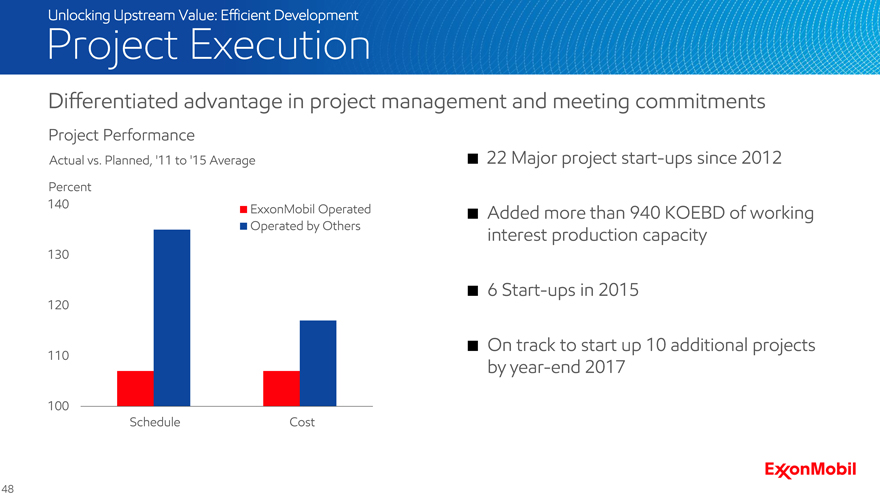
Project Execution
Differentiated advantage in project management and meeting commitments
Project Performance
Actual vs. Planned, ‘11 to ‘15 Average
Percent
140
ExxonMobil Operated
Operated by Others
130
120
110
100
Schedule
Cost
22 Major project start-ups since 2012
Added more than 940 KOEBD of working
interest production capacity
6 Start-ups in 2015
On track to start up 10 additional projects
by year-end 2017
48
|
|
Unlocking Upstream Value: Efficient Development
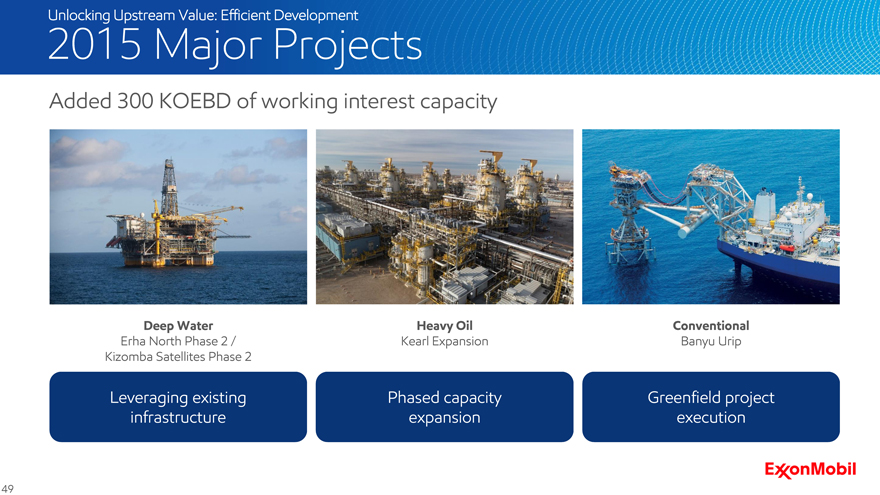
2015 Major Projects
Added 300 KOEBD of working interest capacity
Deep Water
Heavy Oil
Conventional
Erha North Phase 2 /
Kearl Expansion
Banyu Urip
Kizomba Satellites Phase 2
2015 Projects
Leveraging existing
Phased capacity
Greenfield project
infrastructure
expansion
execution
49
|
|
Unlocking Upstream Value: Efficient Development
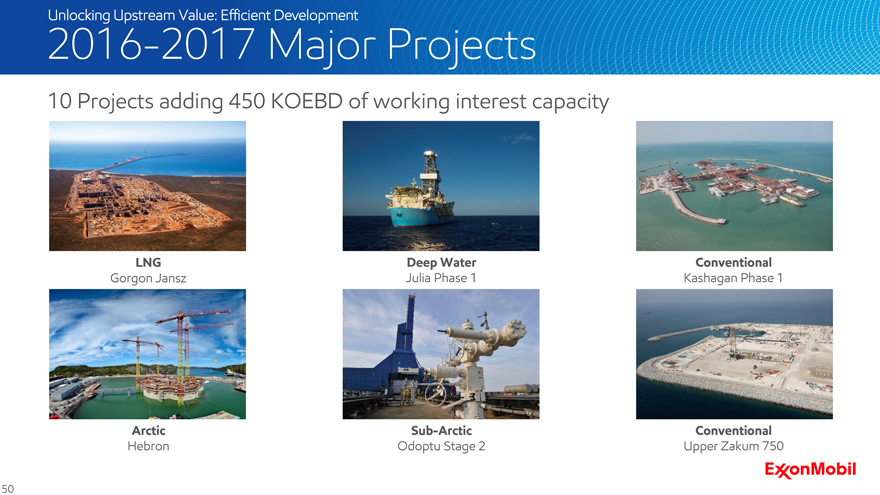
2016-2017 Major Projects
10 Projects adding 450 KOEBD of working interest capacity
LNG
Deep Water
Conventional
Gorgon Jansz
Julia Phase 1
Kashagan Phase 1
Arctic
Sub-Arctic
Conventional
Hebron
Odoptu Stage 2
Upper Zakum 750
50
|
|
Unlocking Upstream Value: Efficient Development
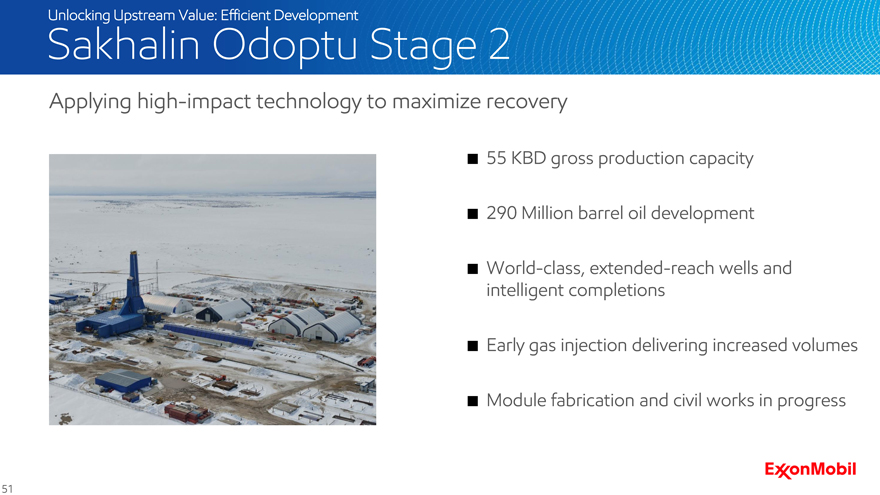
Sakhalin OdoptuStage 2
Applying high-impact technology to maximize recovery
55 KBD gross production capacity
290 Million barrel oil development
World-class, extended-reach wells and
intelligent completions
Early gas injection delivering increased volumes
Module fabrication and civil works in progress
51
|
|
Unlocking Upstream Value: Efficient Development
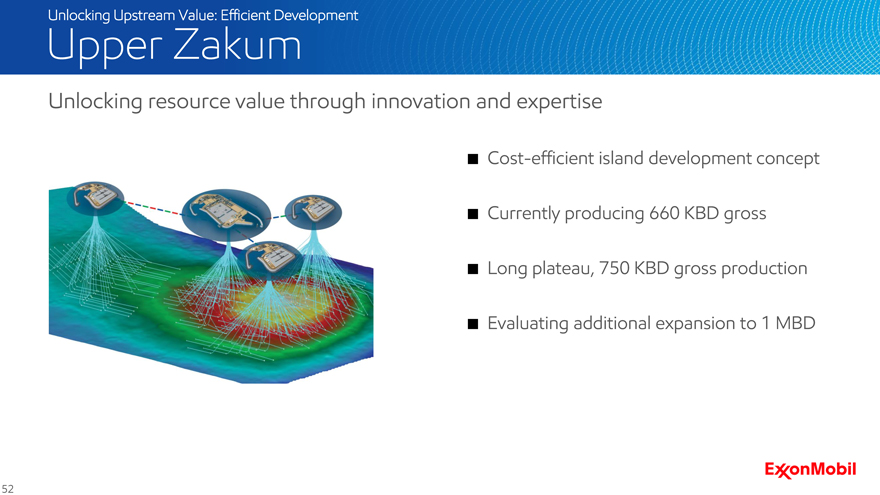
Upper Zakum
Unlocking resource value through innovation and expertise
Cost-efficient island development concept
Currently producing 660 KBD gross
Long plateau, 750 KBD gross production
Evaluating additional expansion to 1 MBD
52
|
|
Unlocking Upstream Value: Efficient Development
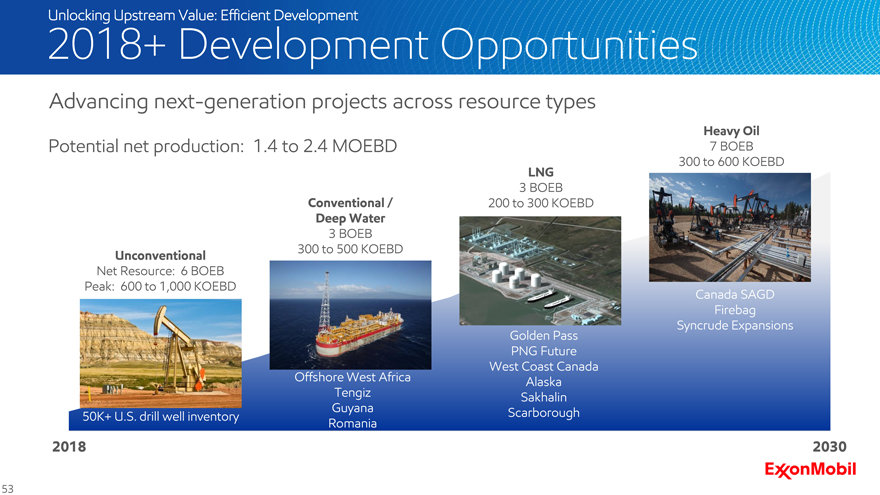
2018+ Development Opportunities
Advancing next-generation projects across resource types
Heavy Oil
Potential net production:
1.4 to 2.4 MOEBD
7 BOEB
300 to 600 KOEBD
LNG
3 BOEB
Conventional /
200 to 300 KOEBD
Deep Water
3 BOEB
Unconventional
300 to 500 KOEBD
Net Resource: 6 BOEB
Peak: 600 to 1,000 KOEBD
Canada SAGD
Firebag
Syncrude Expansions
Golden Pass
PNG Future
West Coast Canada
Offshore West Africa
Alaska
Tengiz
Sakhalin
50K+ U.S. drill well inventory
Guyana
Scarborough
Romania
2018
2030
53
|
|
Unlocking Upstream Value: Quality Resource Base
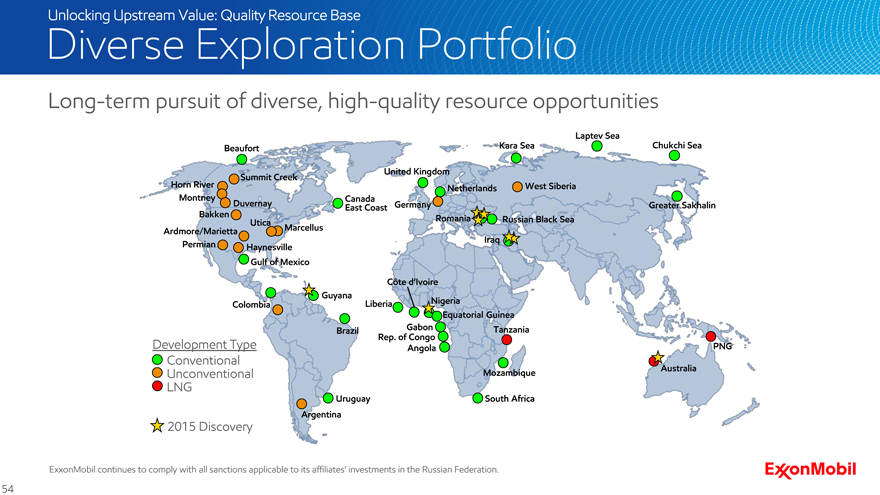
Diverse Exploration Portfolio
Long-term pursuit of diverse, high-quality resource opportunities
Laptev Sea
Beaufort
Kara Sea
Chukchi Sea
Summit Creek
United Kingdom
Horn River
Netherlands
West Siberia
Montney
Canada
Duvernay
East Coast Germany
Greater Sakhalin
Bakken
Utica
Romania
Russian Black Sea
Ardmore/Marietta
Marcellus
Permian
Haynesville
Iraq
Gulf of Mexico
C te d_Ivoire
Guyana
Colombia
Liberia
Nigeria
Equatorial Guinea
Brazil
Gabon
Tanzania
Rep. of Congo
Development Type
Angola
PNG
Conventional
Unconventional
Mozambique
Australia
LNG
Uruguay
South Africa
Argentina
2015 Discovery
ExxonMobil continues to comply with all sanctions applicable to its affiliates_ investments in the Russian Federation.
54
|
|
Unlocking Upstream Value: Quality Resource Base
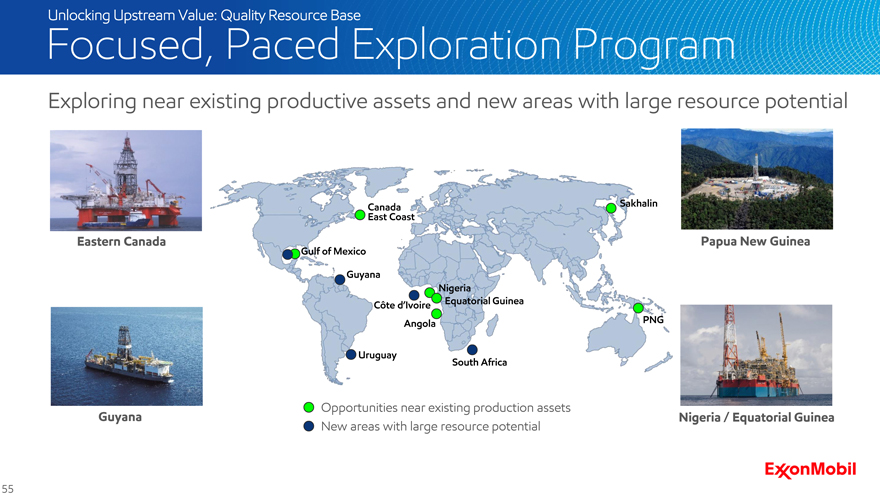
Focused, Paced Exploration Program
Exploring near existing productive assets and new areas with large resource potential
Canada
Sakhalin
East Coast
Eastern Canada
Papua New Guinea
Gulf of Mexico
Guyana
Nigeria
C te d_Ivoire
Equatorial Guinea
Angola
PNG
Uruguay
South Africa
Opportunities near existing production assets
Guyana
Nigeria / Equatorial Guinea
New areas with large resource potential
55
|
|
Unlocking Upstream Value: Quality Resource Base
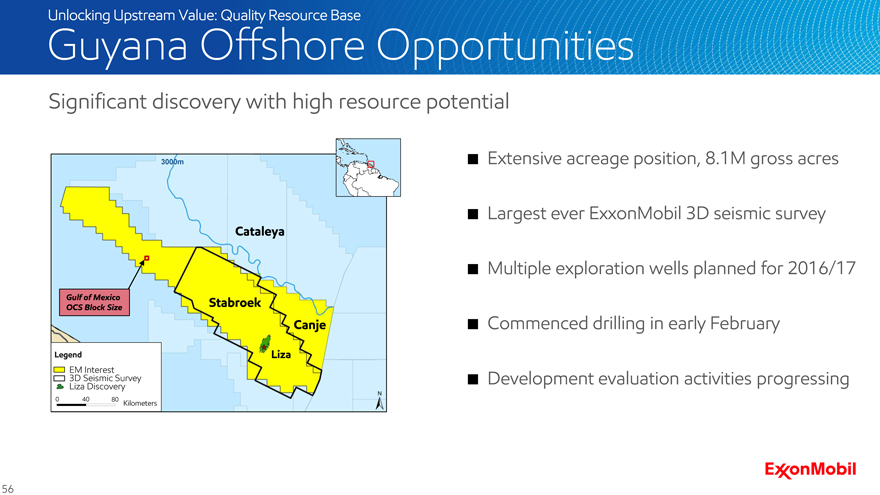
Guyana Offshore Opportunities
Significant discovery with high resource potential
3000m
Extensive acreage position, 8.1M gross acres
Largest ever ExxonMobil 3D seismic survey
Cataleya
Multiple exploration wells planned for 2016/17
Gulf of Mexico
Stabroek
OCS Block Size
Canje
Commenced drilling in early February
Legend
Liza
EM Interest
3D Seismic Survey
Development evaluation activities progressing
Liza Discovery
0
40
80
Kilometers
Km
0
100
200
56
|
|
Unlocking Upstream Value
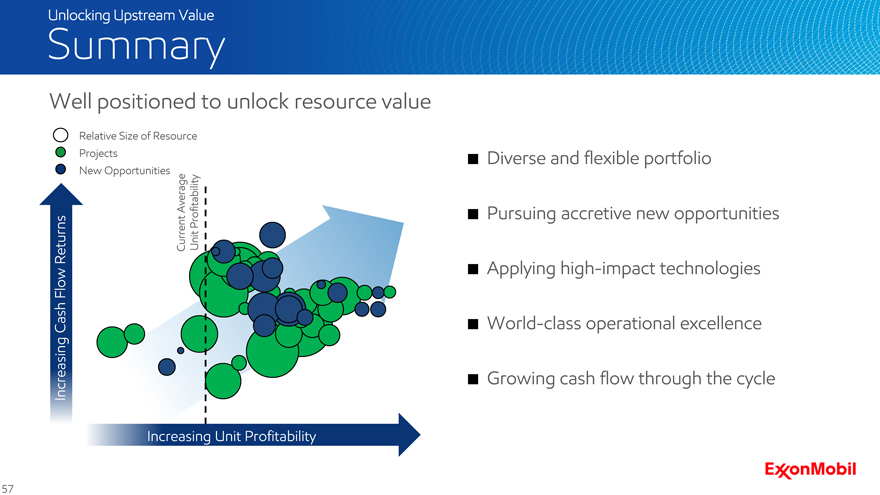
Summary
Well positioned to unlock
resource value
Relative Size of Resource
Projects
New Opportunities
Current Average Unit Profitability
Cash Flow Returns Increasing
Increasing Unit Profitability
Diverse and flexible portfolio
Pursuing accretive new opportunities
Applying high-impact technologies
World-class operational excellence
Growing cash flow through the cycle
57
|
|
Downstream & Chemical Growing the Advantage
|
|
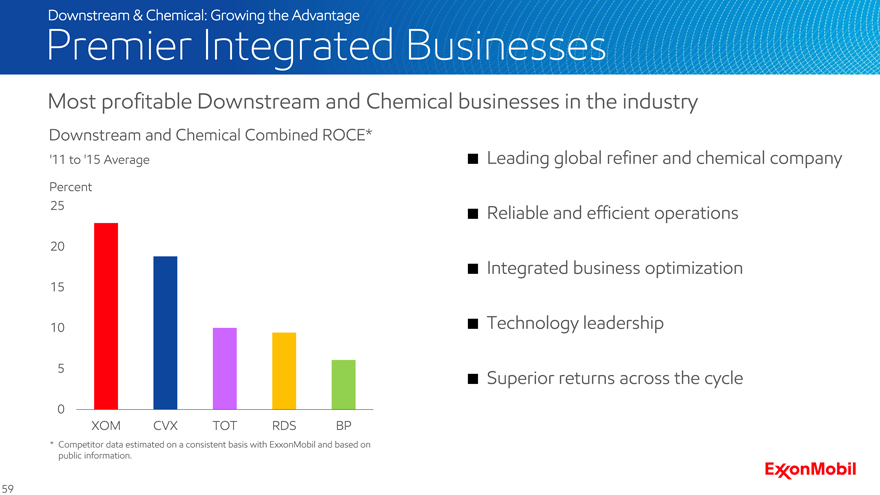
Downstream & Chemical: Growing the Advantage
Premier Integrated Businesses
Most profitable Downstream and Chemical businesses in the industry
Downstream and Chemical Combined ROCE*
‘11 to ‘15 Average Percent 25
20
15
10
5
0
XOM
CVX
TOT
RDS
BP
* Competitor data estimated on a consistent basis with ExxonMobil and based on public information.
Leading global refiner and chemical company
Reliable and efficient operations
Integrated business optimization
Technology leadership
Superior returns across the cycle
59
|
|
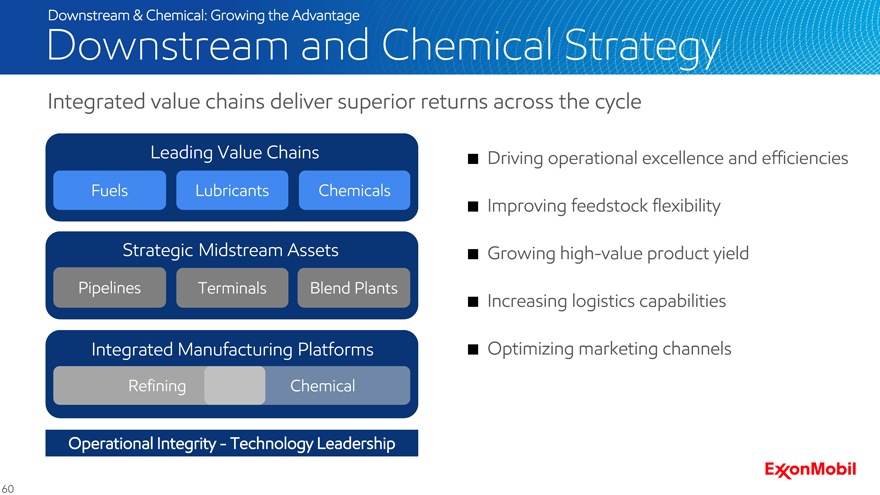
Downstream & Chemical: Growing the Advantage
Downstream and Chemical Strategy
Integrated value chains deliver superior returns across the cycle
Leading Value Chains
Fuels
Lubricants
Chemicals
Strategic Midstream Assets
Pipelines
Terminals
Blend Plants
Integrated Manufacturing Platforms
Driving operational excellence and efficiencies
Improving feedstock flexibility
Growing high-value product yield
Increasing logistics capabilities
Optimizing marketing channels
60
|
|
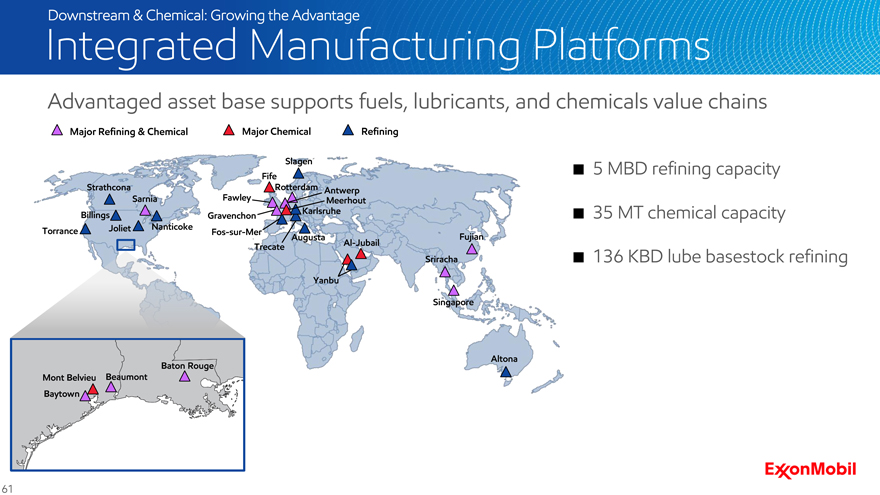
Downstream & Chemical: Growing the Advantage
Integrated Manufacturing Platforms
Advantaged asset base supports fuels, lubricants, and chemicals value chains
Major Refining & Chemical Major Chemical Refining
Slagen Fife
Strathcona Rotterdam Antwerp Sarnia Fawley Meerhout Billings Karlsruhe Gravenchon Torrance Joliet Nanticoke Fos-sur-Mer
Augusta Fujian Trecate Al-Jubail Sriracha
Yanbu
Singapore
Altona Baton Rouge Mont Belvieu Beaumont Baytown
5 MBD refining capacity
35 MT chemical capacity
136 KBD lube basestock refining
61
|
|
Downstream & Chemical: Growing the Advantage
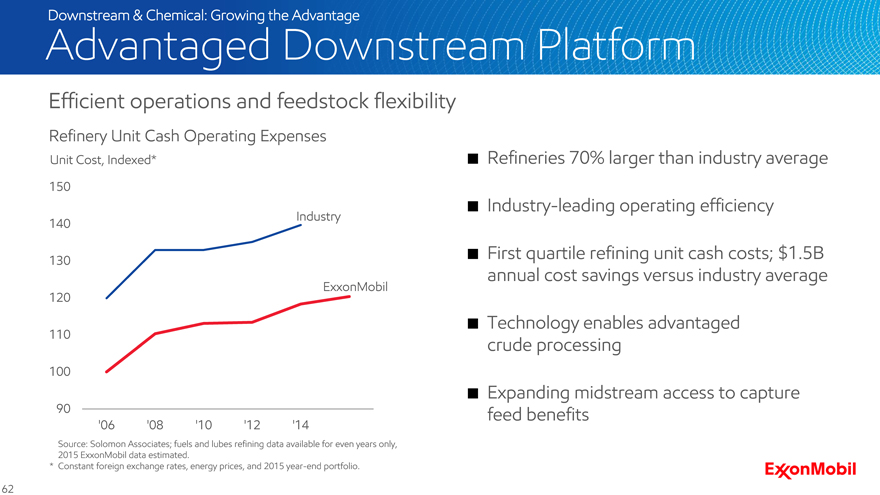
Advantaged Downstream Platform
Efficient operations and feedstock flexibility
Refinery Unit Cash Operating Expenses
Unit Cost, Indexed* 150
Industry 140
130
ExxonMobil 120
110
100
90
‘06 ‘08 ‘10 ‘12 ‘14
Source: Solomon Associates;fuels and lubes refining data available for even years only, 2015 ExxonMobil data estimated.
* Constant foreign exchange rates, energy prices, and 2015 year-end portfolio.
Refineries 70% larger than industry average
Industry-leading operating efficiency
First quartile refining unit cash costs; $1.5B
annual cost savings versus industry average
Technology enables advantaged
crude processing
Expanding midstream access to capture
feed benefits
62
|
|
Downstream & Chemical: Growing the Advantage
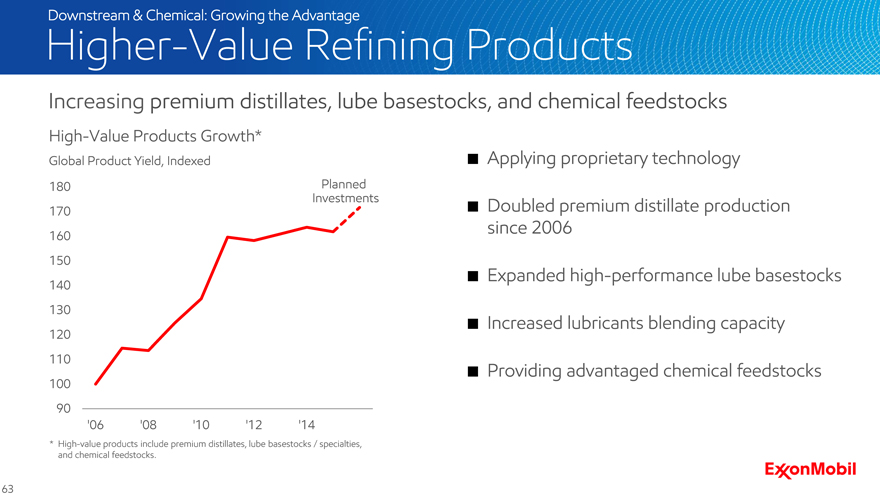
Higher-Value Refining Products
Increasing premium distillates, lube basestocks, and chemical feedstocks
High-Value Products Growth*
Global Product Yield, Indexed
180
Planned
Investments
170
160
150
140
130
120
110
100
90
‘06
‘08
‘10
‘12
‘14
* High-value products include premium distillates, lube basestocks / specialties, and chemical feedstocks.
Applying proprietary technology
Doubled premium distillate production
since 2006
Expanded high-performance lube basestocks
Increased lubricants blending capacity
Providing advantaged chemical feedstocks
63
|
|
Downstream & Chemical: Growing the Advantage
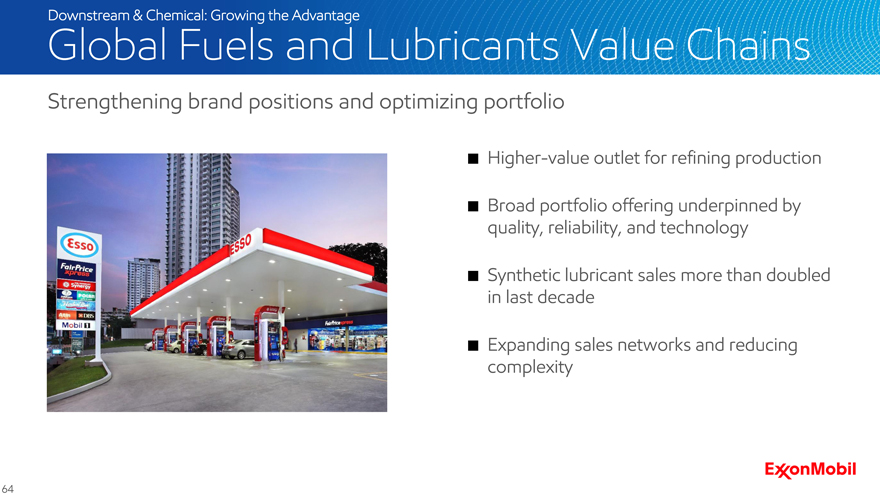
Global Fuels and Lubricants Value Chains
Strengthening brand positions and optimizing portfolio
Higher-value outlet for refining production
Broad portfolio offering underpinned by
quality, reliability, and technology
Synthetic lubricant sales more than doubled
in last decade
Expanding sales networks and reducing
complexity
64
|
|
Downstream & Chemical: Growing the Advantage
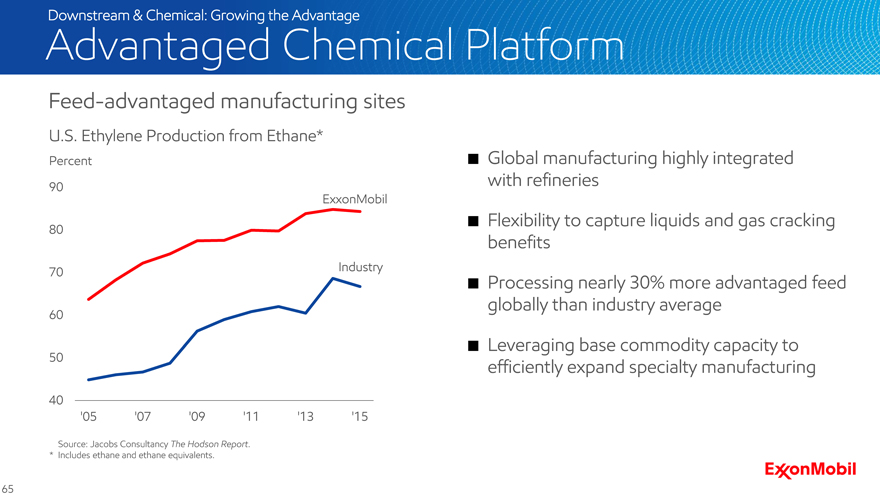
Advantaged Chemical Platform
Feed-advantaged manufacturing sites
U.S. Ethylene Production from Ethane*
Percent
90
ExxonMobil
80
70
Industry
60
50
40
‘05
‘07
‘09
‘11
‘13
‘15
Source: Jacobs Consultancy The Hodson Report.
*
Includes ethane and ethane equivalents.
Global manufacturing highly integrated
with refineries
Flexibility to capture liquids and gas cracking
benefits
Processing nearly 30% more advantaged feed
globally than industry average
Leveraging base commodity capacity to
efficiently expand specialty manufacturing
65
|
|
Downstream & Chemical: Growing the Advantage
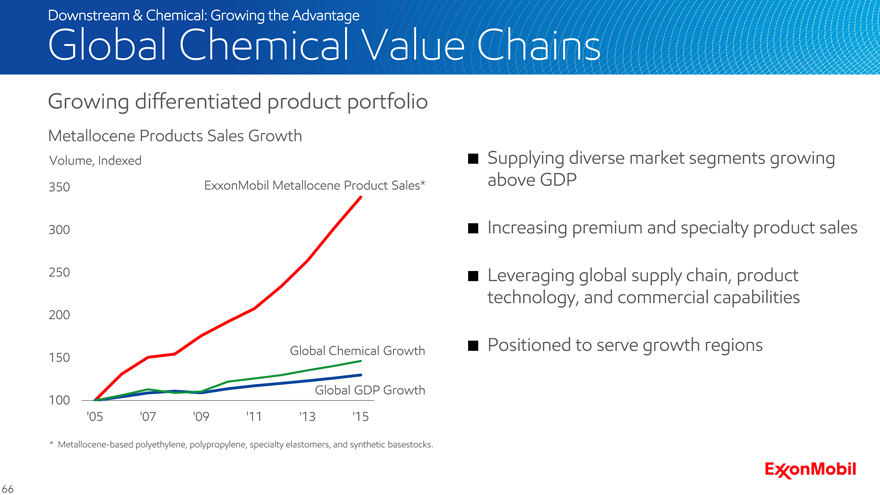
Global Chemical Value Chains
Growing differentiated product portfolio
Metallocene Products Sales Growth
Volume, Indexed
350
ExxonMobil Metallocene Product Sales*
300
250
200
150
Global Chemical Growth
Global GDP Growth
100
‘05
‘07
‘09
‘11
‘13
‘15
* Metallocene-based polyethylene, polypropylene, specialty elastomers, and synthetic basestocks.
Supplying diverse market segments growing
above GDP
Increasing premium and specialty product sales
Leveraging global supply chain, product
technology, and commercial capabilities
Positioned to serve growth regions
66
|
|
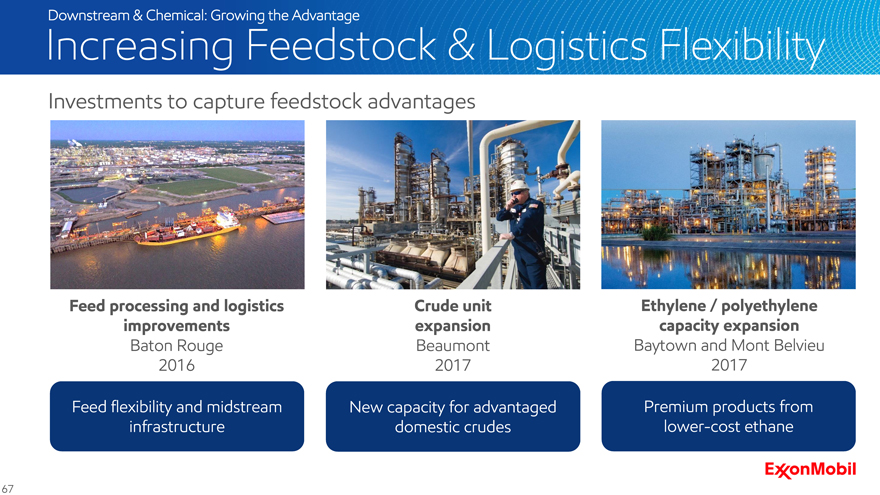
Downstream & Chemical: Growing the Advantage
Increasing Feedstock & Logistics Flexibility
Investments to capture feedstock advantages
Feed processing and logistics
Crude unit
Ethylene / polyethylene
improvements
expansion
capacity expansion
Baton Rouge
Beaumont
Baytown and Mont Belvieu
2016
2017
2017
Feed flexibility and midstream
New capacity for advantaged
Premium products from
infrastructure
domestic crudes
lower-cost ethane
67
|
|
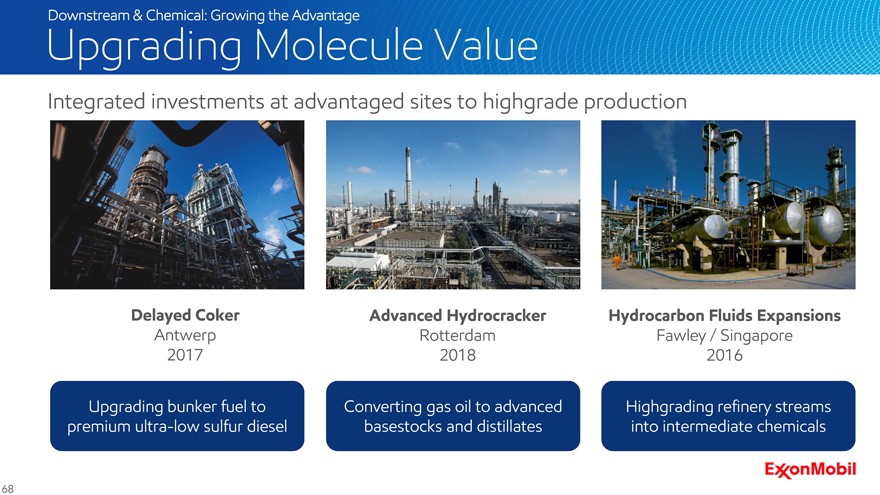
Downstream & Chemical: Growing the Advantage
Upgrading Molecule Value
Integrated investments at advantaged sites to highgradeproduction
Delayed Coker
Advanced Hydrocracker
Hydrocarbon Fluids Expansions
Antwerp
Rotterdam
Fawley / Singapore
2017
2018
2016
Upgrading bunker fuel to
Converting gas oil to advanced
Highgrading refinery streams
premium ultra-low sulfur diesel
basestocks and distillates
into intermediate chemicals
68
|
|
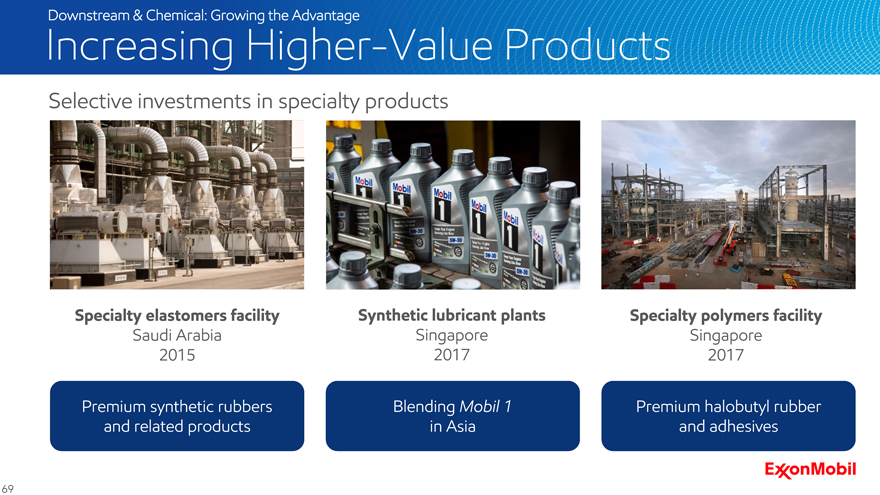
Downstream & Chemical: Growing the Advantage
Increasing Higher-Value Products
Selective investments in specialty products
Specialty elastomers facility
Synthetic lubricant plants
Specialty polymers facility
Saudi Arabia
Singapore
Singapore
2015
2017
2017
Premium synthetic rubbers
Blending Mobil 1
Premium halobutyl rubber
and related products
in Asia
and adhesives
69
|
|
Downstream & Chemical: Growing the Advantage
Summary
Focus on business fundamentals delivering superior results
Driving operational efficiency
Capturing advantaged feeds
Growing high-value products
Selectively investing across value chains
Generating cash flow from diverse portfolio
70
|
|
Closing Comments
Relentless focus on business fundamentals
Resilient integrated business model through the commodity price cycle
Disciplined and paced investment approach focused on creating value
Commitment to reliable and growing dividend
71