|
|
2015 Analyst Meeting
New York Stock Exchange
March 4, 2015
|
|
Cautionary Statement
Forward-Looking Statements
Outlooks, projections, estimates, targets, business plans, and other statements of future events or conditions in this presentation or the subsequent discussion period are forward-looking statements. Actual future results, including financial and operating performance; demand growth and energy mix; ExxonMobil’s production growth and mix; the amount and mix of capital expenditures; future distributions; resource additions and recoveries; finding and development costs; project plans, timing, costs, and capacities; efficiency gains; cost savings; integration benefits; product sales and mix; and the impact of technology could differ materially due to a number of factors. These include changes in oil or gas prices or other market conditions affecting the oil, gas, and petrochemical industries; reservoir performance; timely completion of development projects; war and other political or security disturbances; changes in law or government regulation, including environmental regulations and political sanctions; the outcome of commercial negotiations; the actions of competitors and customers; unexpected technological developments; the occurrence and duration of economic recessions; unforeseen technical difficulties; and other factors discussed here and under the heading “Factors Affecting Future Results” in the Investors section of our website at exxonmobil.com. See also Item 1A of ExxonMobil’s 2014 Form 10-K. Forward-looking statements are based on management’s knowledge and reasonable expectations on the date hereof, and we assume no duty to update these statements as of any future date.
Frequently Used Terms
References to resources, resource base, recoverable resources, and similar terms include quantities of oil and gas that are not yet classified as proved reserves but that we believe will likely be moved into the proved reserves category and produced in the future. “Proved reserves” in this presentation are presented using the SEC pricing basis in effect for the year presented, except for the calculation of 21 straight years of at least 100-percent replacement; oil sands and equity company reserves are included for all periods. For definitions of, and information regarding, reserves, return on average capital employed, cash flow from operations and asset sales, free cash flow, and other terms used in this presentation, including information required by SEC Regulation G, see the “Frequently Used Terms” posted on the Investors section of our website. The Financial and Operating Review on our website also shows ExxonMobil’s net interest in specific projects.
The term “project” as used in this presentation can refer to a variety of different activities and does not necessarily have the same meaning as in any government payment transparency reports.
1
|
|
Agenda
9am Welcome Jeff Woodbury,
Vice President, Investor Relations and Secretary
Key Messages and 2014 Results . Rex Tillerson, Chairman and CEO Energy Outlook Creating Value Through the Cycle Strategic Overview Differentiated Performance Forward Plans Unlocking Upstream Resource Value Strengthening the Downstream & Chemical Portfolio Break Summary 11am Q&A Management Committee 12pm Meeting Concludes
|
|
Key Messages and
2014 Results
|
|
Key Messages
Continued focus on fundamentals in a lower price environment
Selectively investing in attractive opportunities: 2014 Capex $38.5B; 2015 Capex $34B Growing higher-margin production: 4.0 MOEBD in 2014; 4.3 MOEBD in 2017 Delivering differentiated performance versus competition Industry-leading shareholder returns
4
|
|
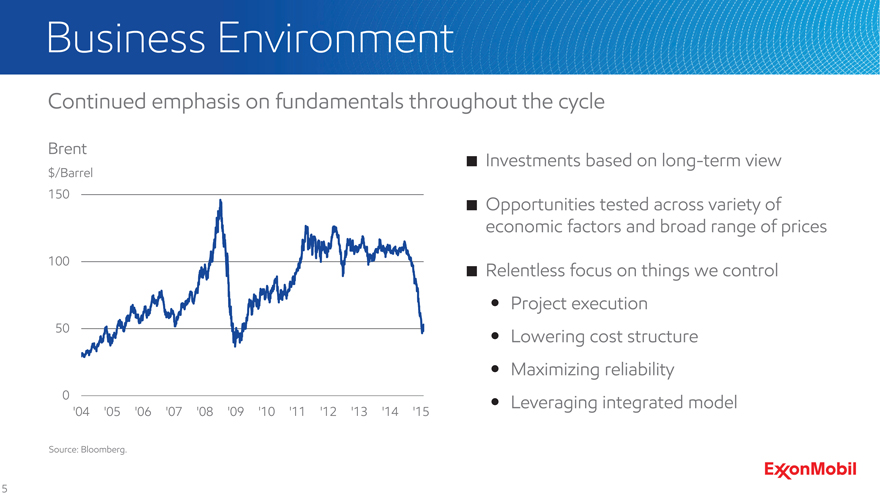
Business Environment
Continued emphasis on fundamentals throughout the cycle
Brent
Investments based on long-term view
$/Barrel 150
Opportunities tested across variety of economic factors and broad range of prices 100 Relentless focus on things we control Project execution
50 Lowering
cost structure Maximizing reliability
0 Leveraging integrated model
‘04 ‘05 ‘06 ‘07 ‘08 ‘09 ‘10 ‘11 ‘12 ‘13 ‘14 ‘15
Source: Bloomberg.
5
|
|
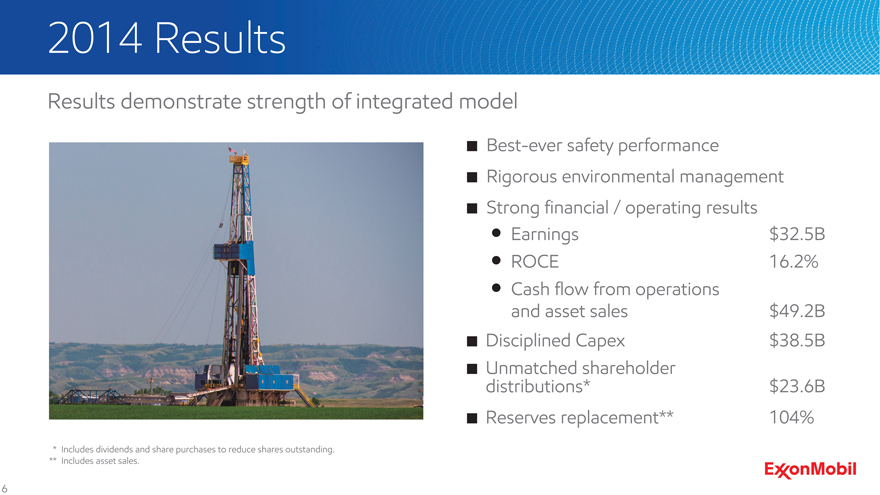
2014 Results
Results demonstrate strength of integrated model
Best-ever safety performance
Rigorous environmental management
Strong financial / operating results
Earnings $32.5B ROCE 16.2% Cash flow from operations and asset sales $49.2B
Disciplined Capex $38.5B
Unmatched distributions* shareholder $23.6B
Reserves replacement** 104%
* Includes dividends and share purchases to reduce shares outstanding.
** Includes asset sales.
6
|
|
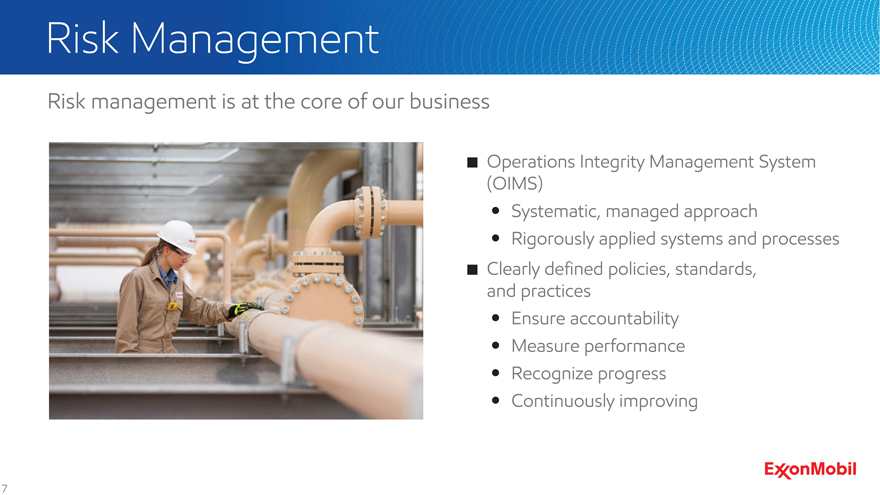
Risk Management
Risk management is at the core of our business
Operations Integrity Management System (OIMS) Systematic, managed approach Rigorously applied systems and processes
Clearly defined policies, standards, and practices Ensure accountability Measure performance Recognize progress Continuously improving
7
|
|
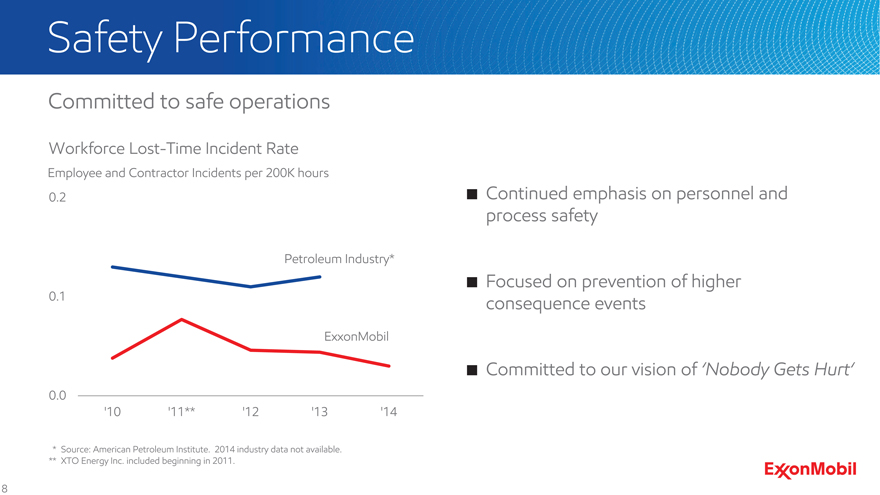
Safety Performance
Committed to safe operations
Workforce Lost-Time Incident Rate
Employee and Contractor Incidents per 200K hours
0.2 Continued emphasis on personnel and process safety
Petroleum Industry*
Focused on prevention of higher 0.1 consequence events
ExxonMobil
Committed to our vision of ‘Nobody Gets Hurt‘
0.0
‘10 ‘11** ‘12 ‘13 ‘14
* Source: American Petroleum Institute. 2014 industry data not available.
** XTO Energy Inc. included beginning in 2011.
8
|
|
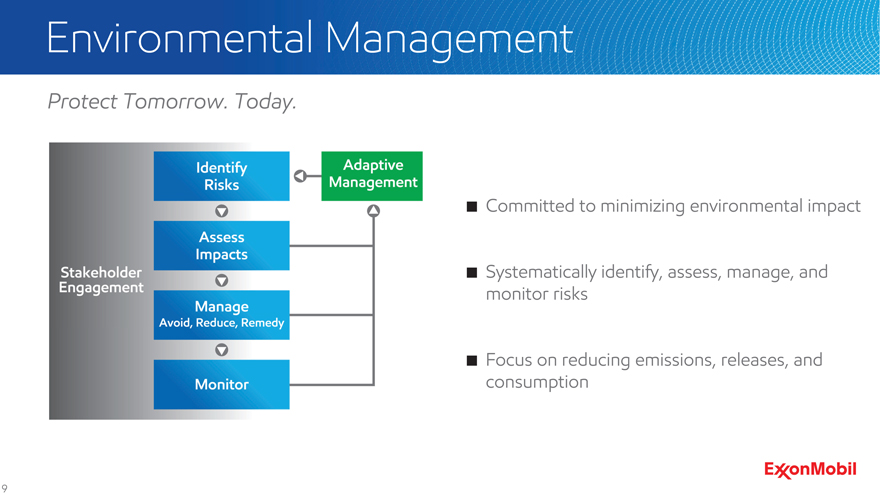
Environmental Management
Protect
Tomorrow.
Today.
Committed to minimizing environmental impact
Systematically identify, assess, manage, and monitor risks
Focus on reducing emissions, releases, and consumption
9
|
|
Energy Outlook
|
|
Energy Outlook
Growth Led by Developing Economies
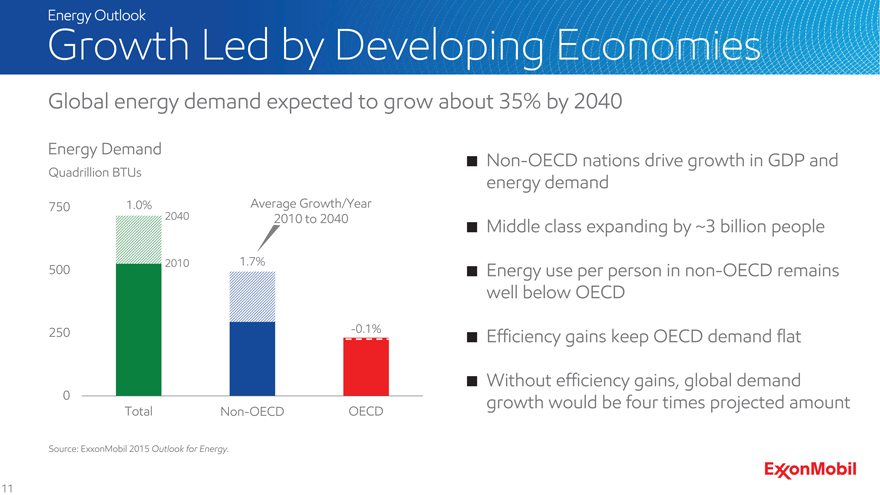
Global energy demand expected to grow about 35% by 2040
Energy Demand
Quadrillion BTUs
750 1.0% Average Growth/Year 2040 2010 to 2040
2010 1.7%
500
250 -0.1%
0
Total Non-OECD OECD
Source: ExxonMobil 2015 Outlook for Energy.
Non-OECD nations drive growth in GDP and energy demand
Middle class expanding by ~3 billion people
Energy use per person in non-OECD remains well below OECD
Efficiency gains keep OECD demand flat
Without efficiency gains, global demand growth would be four times projected amount
11
|
|
Energy Outlook
Energy Demand to 2040
Oil and natural gas expected to meet about 60% of global energy demand in 2040
Global Energy Demand
Quadrillion BTUs 250
0.8% 2040
Average Growth/Year 200 1.6% 2010 to 2040
2010
150 0.1%
100 1.0%
2.3%
50
7.7%
0
Other Solar & Oil Gas Coal Nuclear Renewable* Wind
Oil and natural gas lead growth as energy mix evolves
Higher oil demand driven by expanding needs for transportation and chemicals
Strong growth in natural gas led by power generation and industrial demand
Demand trends reflect reasonable cost of carbon assumptions
Source: ExxonMobil 2015 Outlook for Energy.
* Other Renewable includes hydro, geothermal, biofuels, and biomass.
12
|
|
|
|
Creating Value Through the Cycle
Strategic Overview
|
|
Creating Value Through the Cycle: Strategic Overview
ExxonMobil Strategy
Provide industry leadership to meet the world’s energy needs
Risk Management
World-Class Operational Workforce Excellence
GROWING
Technology Investment & Leadership SHAREHOLDER Cost Discipline
VALUE
Integration Project Execution Portfolio Management
Delivering on commitments – Differentiated performance
15
|
|
Creating Value Through the Cycle: Strategic Overview
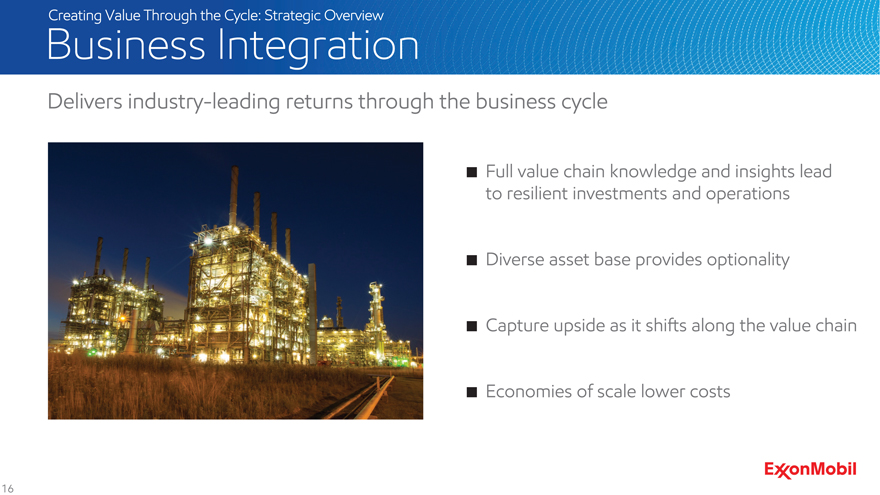
Business Integration
Delivers industry-leading returns through the business cycle
Full value chain knowledge and insights lead to resilient investments and operations
Diverse asset base provides optionality
Capture upside as it shifts along the value chain
Economies of scale lower costs
16
|
|
Creating Value Through the Cycle: Strategic Overview
Molecule Management
Capturing the highest value for every molecule
Integrated market view enables more effective response to changes in the business environment
75% of refining operations integrated with chemical and lubes manufacturing
Value chain investments maximize returns on produced and manufactured volumes
Global Supply organization provides insights to achieve best value from Upstream production
Upstream Refining Fuels Lubricants Chemical Commodities Specialties LNG Value Chain
Upstream Refining Fuels Lubricants Chemical Commodities Specialties LN 17
|
|
Creating Value Through the Cycle: Strategic Overview
North America Integration
Demonstrating benefits of the integrated model
Investments positioned to optimize Upstream and Downstream returns
Flexibility to process advantaged feedstocks
Logistics commitments expand access to crude and product markets
Accelerated value capture from Kearl bitumen
Capturing uplift from ethane and other NGLs
18
|
|
Creating Value Through the Cycle
Differentiated Performance
|
|
Creating Value Through the Cycle: Differentiated Performance
2014 Highlights
Delivering on commitments
FY14
Return on Capital Employed (%) 16.2 Industry-leading ROCE
Free Cash Flow ($B) 17.9 Free Cash Flow up $7.3B vs. 2013 CAPEX ($B) 38.5 Capex $1.3B below plan Upstream Production (MOEBD) 4.0 Achieved Upstream production target Upstream Unit Profitability* Improved profitability by $1.44 per barrel
19.47
($/OEB)
* ExxonMobil volume excludes noncontrolling interest share.
20
|
|
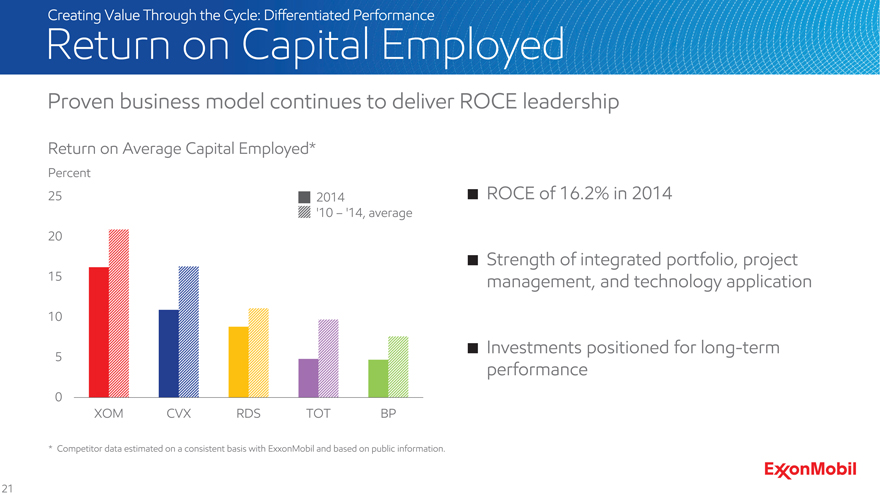
Creating Value Through the Cycle: Differentiated Performance
Return on Capital Employed
Proven business model continues to deliver ROCE leadership
Return on Average Capital Employed*
Percent
25 2014 ROCE of 16.2% in 2014
‘10 – ‘14, average 20
Strength of integrated portfolio, project 15 management, and technology application
10
Investments positioned for long-term
5
performance
0
XOM CVX RDS TOT BP
* Competitor data estimated on a consistent basis with ExxonMobil and based on public information.
21
|
|
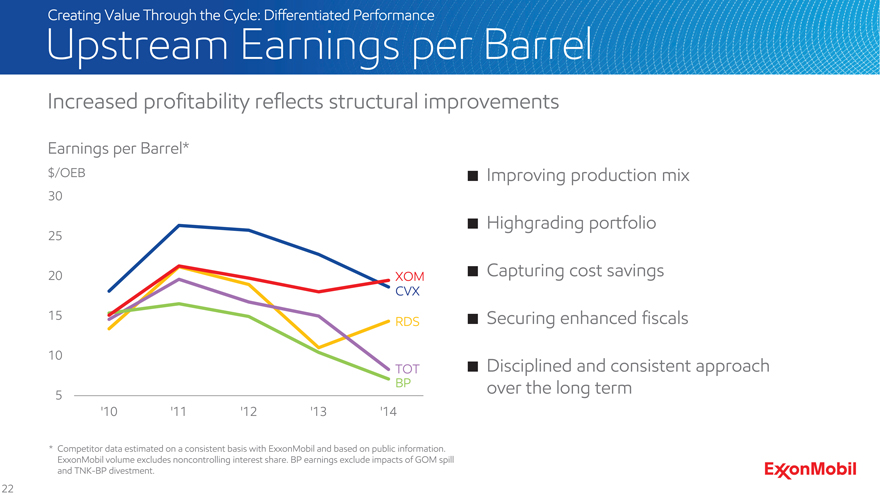
Creating Value Through the Cycle: Differentiated Performance
Upstream Earnings per Barrel
Increased profitability reflects structural improvements
Earnings per Barrel* $/OEB Improving production mix
30
Highgrading portfolio
25
20 XOM Capturing cost savings
CVX
15 RDS Securing enhanced fiscals
10
TOT Disciplined and consistent approach BP over the long term
5
‘10 ‘11 ‘12 ‘13 ‘14
* Competitor data estimated on a consistent basis with ExxonMobil and based on public information. ExxonMobil volume excludes noncontrolling interest share. BP earnings exclude impacts of GOM spill and TNK-BP divestment.
22
|
|
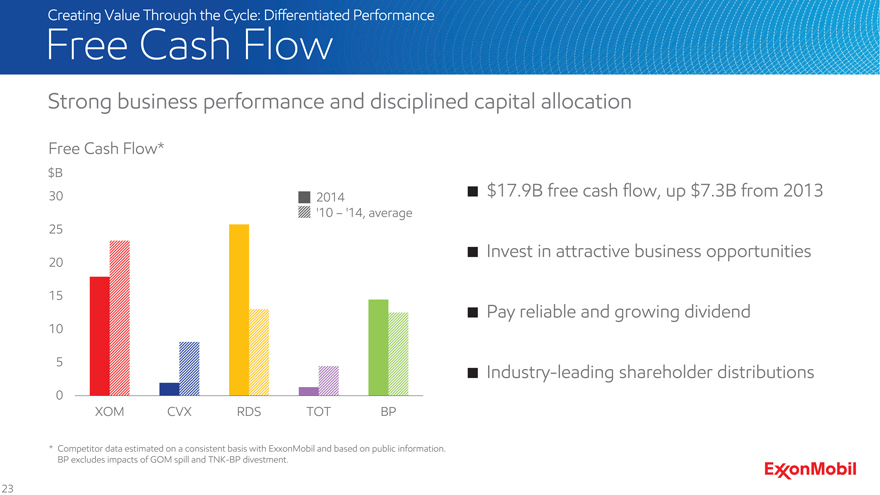
Creating Value Through the Cycle: Differentiated Performance
Free Cash Flow
Strong business performance and disciplined capital allocation
Free Cash Flow*
$B
30 2014 $17.9B free cash flow, up $7.3B from 2013
‘10 – ‘14, average 25
Invest in attractive business opportunities
20
15
Pay reliable and growing dividend
10
5 Industry-leading shareholder distributions
0
XOM CVX RDS TOT BP
* Competitor data estimated on a consistent basis with ExxonMobil and based on public information. BP excludes impacts of GOM spill and TNK-BP divestment.
23
|
|
Creating Value Through the Cycle: Differentiated Performance
Shareholder Distributions
Industry-leading shareholder distributions through the business cycle
Total Cash Distribution Yield*
Percent
10 2014 2.7% dividend yield; 2.7% buyback yield in 2014
‘10 – ‘14, average 8
6 Dividends per share up 55% from 2010
4
Distributed 46 cents of every dollar generated 2 from 2010 to 2014**
0
XOM CVX RDS TOT BP
* Competitor data estimated on a consistent basis with ExxonMobil and based on public information.
** Shareholder Distributions as a percentage of Cash Flow from Operations and Asset Sales.
24
|
|
Creating Value Through the Cycle: Differentiated Performance
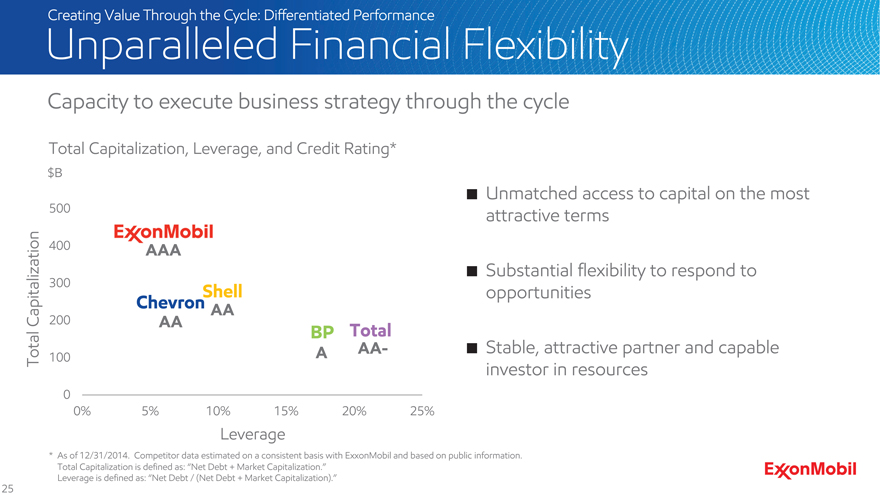
Unparalleled Financial Flexibility
Capacity to execute business strategy through the cycle
Total Capitalization, Leverage, and Credit Rating*
$B
Unmatched access to capital on the most 500 attractive terms
400 AAA
Substantial flexibility to respond to 300 Shell opportunities
Chevron AA
Capitalization 200 AA
BP Total
A AA- Stable, attractive partner and capable
Total 100 investor in resources
0
0% 5% 10% 15% 20% 25%
Leverage
* As of 12/31/2014. Competitor data estimated on a consistent basis with ExxonMobil and based on public information. Total Capitalization is defined as: “Net Debt + Market Capitalization.” Leverage is defined as: “Net Debt / (Net Debt + Market Capitalization).”
25
|
|
Creating Value Through the Cycle
Forward Plans
|
|
Creating Value Through the Cycle: Forward Plans
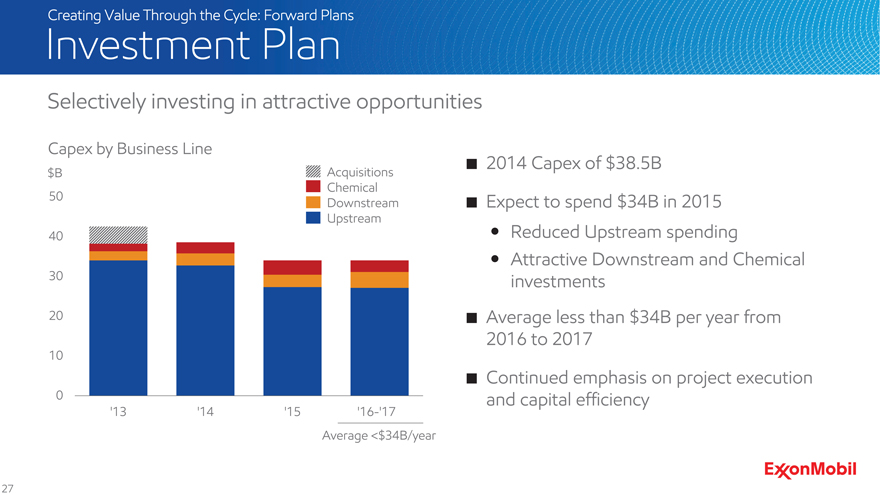
Investment Plan
Selectively investing in attractive opportunities
Capex by Business Line
2014 Capex of $38.5B
$B Acquisitions Chemical 50
Downstream Expect to spend $34B in 2015
Upstream
40 Reduced Upstream spending
Attractive Downstream and Chemical 30 investments
20 Average less than $34B per year from 2016 to 2017
10
Continued emphasis on project execution 0 and capital efficiency
‘13 ‘14 ‘15 ‘16-‘17 Average <$34B/year
27
|
|
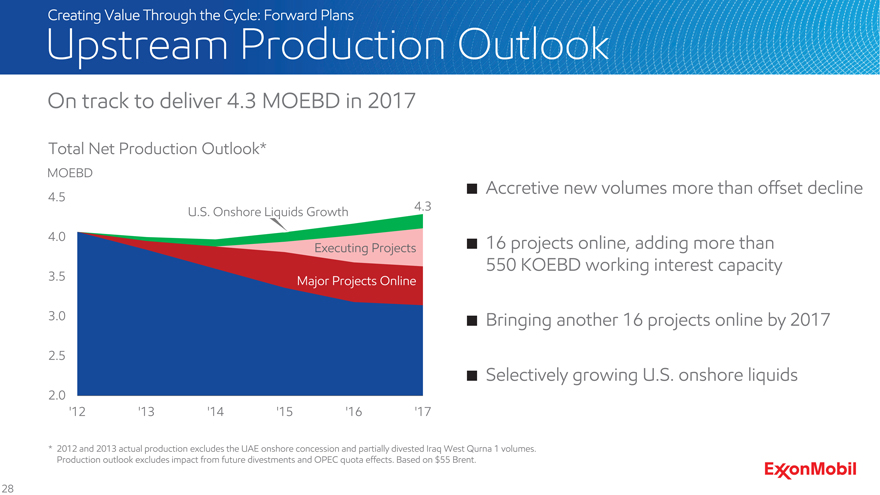
Creating Value Through the Cycle: Forward Plans
Upstream Production Outlook
On track to deliver 4.3 MOEBD in 2017
Total Net Production Outlook*
MOEBD
Accretive new volumes more than offset decline
4.5
U.S. Onshore Liquids Growth 4.3
4.0 16 projects online, adding more than Executing Projects 550 KOEBD working interest capacity
3.5 Major Projects Online
3.0 Bringing another 16 projects online by 2017
2.5
Selectively growing U.S. onshore liquids
2.0
‘12 ‘13 ‘14 ‘15 ‘16 ‘17
* 2012 and 2013 actual production excludes the UAE onshore concession and partially divested Iraq West Qurna 1 volumes. Production outlook excludes impact from future divestments and OPEC quota effects. Based on $55 Brent.
28
|
|
Creating Value Through the Cycle: Forward Plans
Upstream Production Outlook
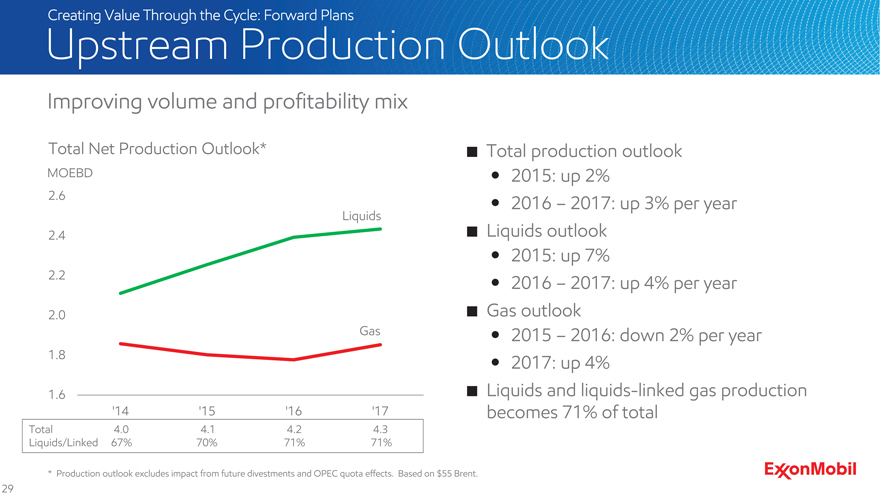
Improving volume and profitability mix
Total Net Production Outlook* Total production outlook
MOEBD 2015: up 2%
2.6 2016 – 2017: up 3% per year
Liquids
2.4 Liquids outlook 2015: up 7%
2.2 – 2017: up per year 2016 4% 2.0 Gas outlook Gas 2015 – 2016: down 2% per year 1.8 2017: up 4% 1.6 Liquids and liquids-linked gas production ‘14 ‘15 ‘16 ‘17 becomes 71% of total
Total 4.0 4.1 4.2 4.3 Liquids/Linked 67% 70% 71% 71%
* Production outlook excludes impact from future divestments and OPEC quota effects. Based on $55 Brent.
29
|
|
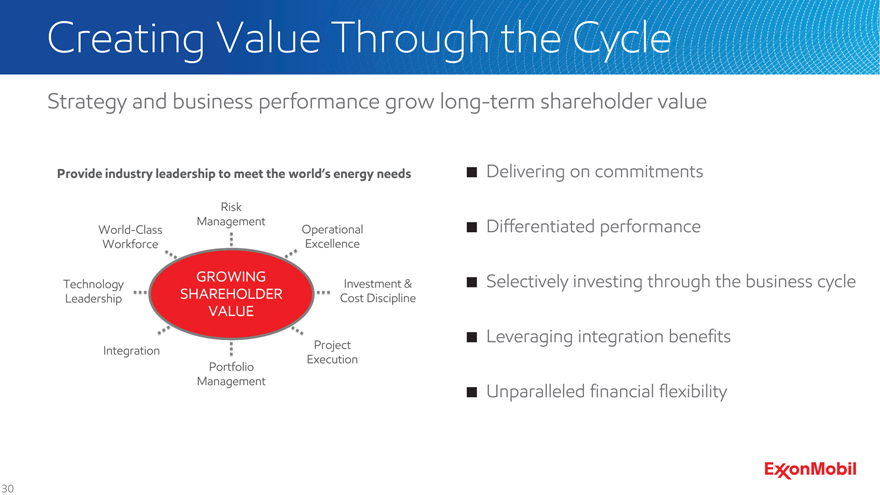
Creating Value Through the Cycle
Strategy and business performance grow long-term shareholder value
Delivering on commitments
Differentiated performance
Selectively investing through the business cycle
Leveraging integration benefits
Unparalleled financial flexibility
30
|
|
Unlocking Upstream Resource Value
|
|
Unlocking Upstream Resource Value
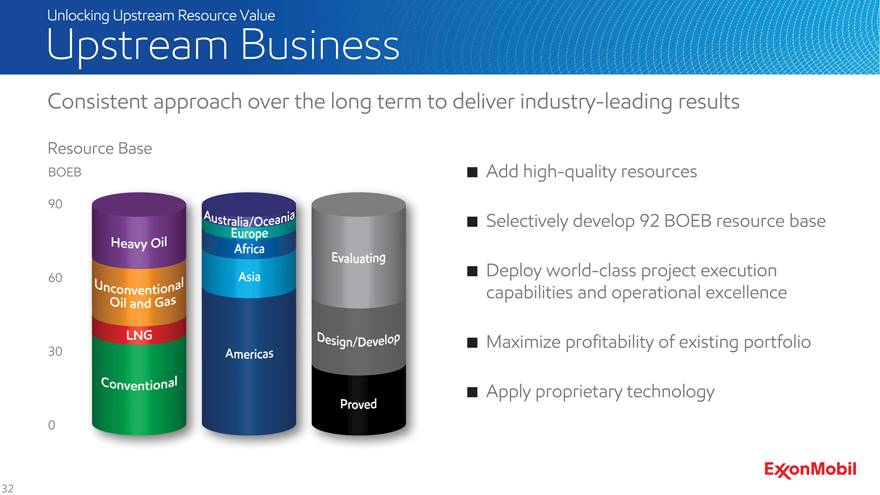
Upstream Business
Consistent approach over the long term to deliver industry-leading results
Resource Base
BOEB Add high-quality resources
90 develop 92 BOEB resource
Selectively base
60 Deploy world-class project execution capabilities and operational excellence
Maximize profitability of existing portfolio
30
Apply proprietary technology
0
32
|
|
Unlocking Upstream Resource Value
New Opportunity Growth
Strategically pursuing diverse set of high-quality resource opportunities
Laptev Sea Kara Sea
Beaufort Chukchi Sea United Kingdom Norway Summit Creek Horn River West Siberia Athabasca Netherlands Montney Duvernay CanadaEast Coast Germany Bakken Utica Marcellus Romania Russian Black Sea Ardmore/Marietta Permian Basin Kurdistan Region of Iraq Haynesville Gulf of Mexico
Vietnam Guyana Colombia Liberia Nigeria Malaysia Côte d’Ivoire Equatorial Guinea Gabon Tanzania Brazil
Rep. of Congo Indonesia PNG
Resource Type Angola
Conventional Madagascar
Unconventional Australia Heavy Oil LNG South Africa Argentina
ExxonMobil continues to comply with all sanctions applicable to its affiliates’ investments in the Russian Federation.
33
|
|
Unlocking Upstream Resource Value
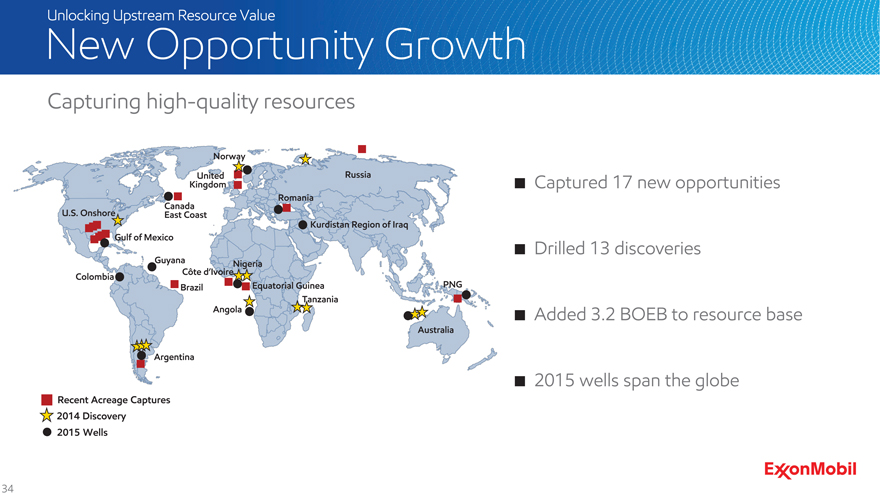
New Opportunity Growth
Capturing high-quality resources
Norway
United Russia
Kingdom Captured 17 new opportunities
Romania Canada U.S. Onshore East Coast
Kurdistan Region of Iraq
Gulf of Mexico
Guyana Drilled 13 discoveries
Nigeria Côte d’Ivoire Colombia
Brazil Equatorial Guinea PNG Tanzania
Angola Added 3.2 BOEB to resource base
Australia
Argentina
2015 wells span the globe
Recent Acreage Captures 2014 Discovery 2015 Wells
34
|
|
Unlocking Upstream Resource Value
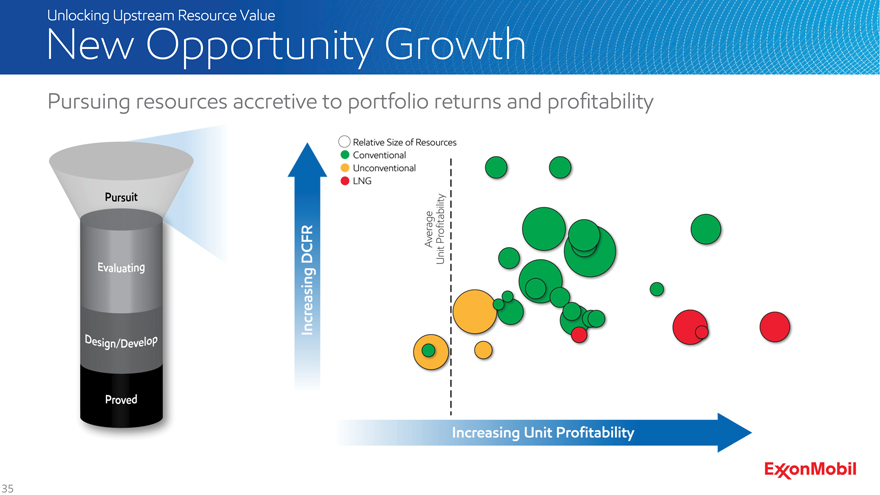
New Opportunity Growth
Pursuing resources accretive to portfolio returns and profitability
35
|
|
Unlocking Upstream Resource Value
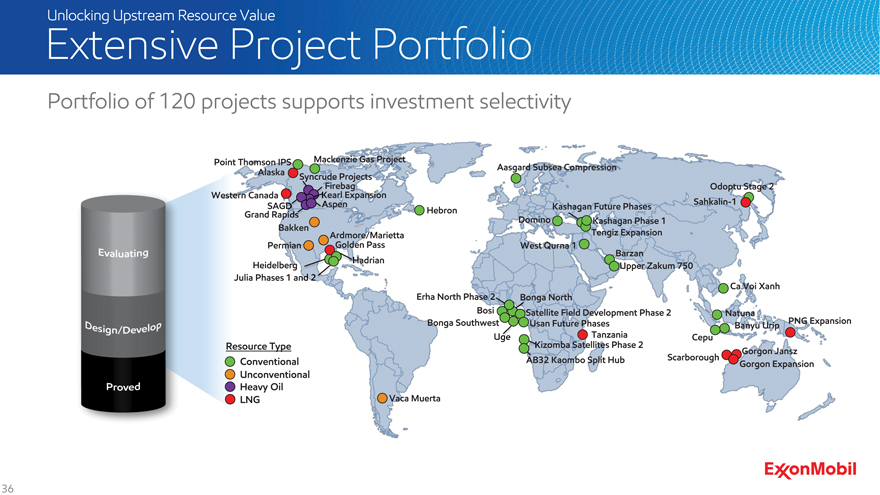
Extensive Project Portfolio
Portfolio of 120 projects supports investment selectivity
Point Thomson IPS Mackenzie Gas Project
Aasgard Subsea Compression
Alaska Syncrude Projects
Western Canada Kearl Firebag Expansion Odoptu Stage 2
SAGD Aspen Sahkalin-1
Hebron Kashagan Future Phases
Grand Rapids
Domino Kashagan Phase 1
Bakken
Ardmore/Marietta Tengiz Expansion
Permian Golden Pass West Qurna 1
Barzan
Hadrian
Heidelberg Upper Zakum 750
Julia Phases 1 and
Ca Voi Xanh
Erha North Phase 2 Bonga North
Bosi Satellite Field Development Phase 2 Natuna
Bonga Southwest Usan Future Phases PNG Expansion
Tanzania Banyu Urip
Cepu
Resource Type Kizomba Satellites Phase 2
Gorgon Jansz
Conventional AB32 Kaombo Split Hub Scarborough
Gorgon Expansion
Unconventional
Heavy Oil
LNG Vaca Muerta
36
|
|
Unlocking Upstream Resource Value
Highgrading the Portfolio
Increasing returns and profitability through disciplined investing
Pursue only high-quality resources
Secure stable, competitive fiscal terms
Selectively develop most attractive projects
Deploy world-class project execution capabilities
Apply high-impact technologies
37
|
|
Unlocking Upstream Resource Value
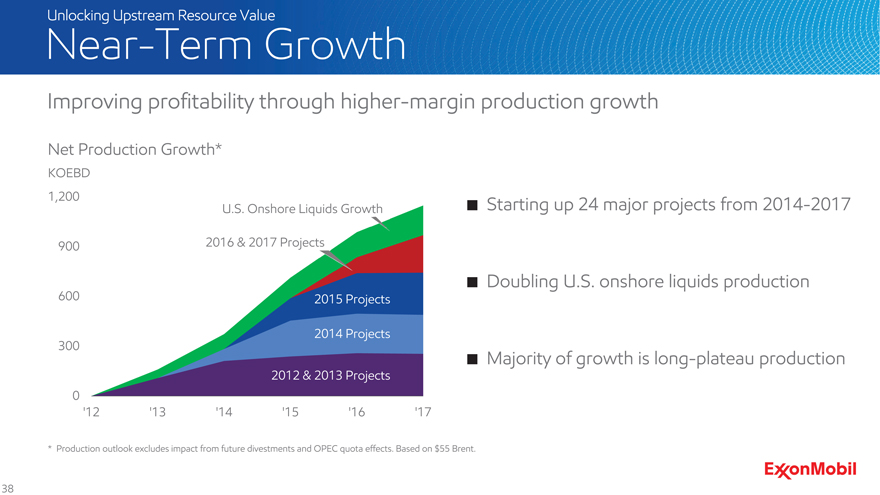
Near-Term Growth
Improving profitability through higher-margin production growth
Net Production Growth*
KOEBD
1,200 U.S. Onshore Liquids Growth Starting up 24 major projects from 2014-2017
900 2016 & 2017 Projects
600 Doubling U.S. onshore liquids production
2015 Projects
2014 Projects 300
Majority of growth is long-plateau production
2012 & 2013 Projects 0 ‘12 ‘13 ‘14 ‘15 ‘16 ‘17
* Production outlook excludes impact from future divestments and OPEC quota effects. Based on $55 Brent.
38
|
|
Unlocking Upstream Resource Value
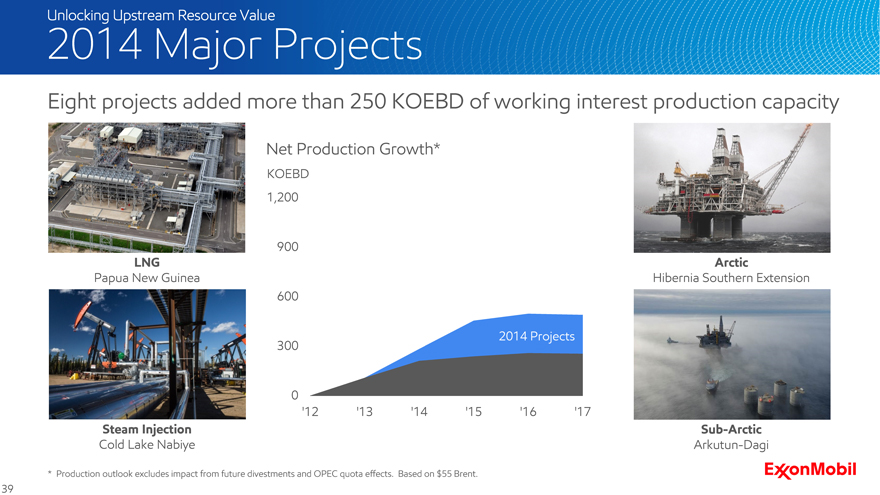
2014 Major Projects
Eight projects added more than 250 KOEBD of working interest production capacity
Net Production Growth*
KOEBD 1,200
900
LNG Arctic
Papua New Guinea Hibernia Southern Extension 600
2014 Projects 300
0
‘12 ‘13 ‘14 ‘15 ‘16 ‘17
Steam Injection Sub-Arctic
Cold Lake Nabiye Arkutun-Dagi
* Production outlook excludes impact from future divestments and OPEC quota effects. Based on $55 Brent.
39
|
|
Unlocking Upstream Resource Value
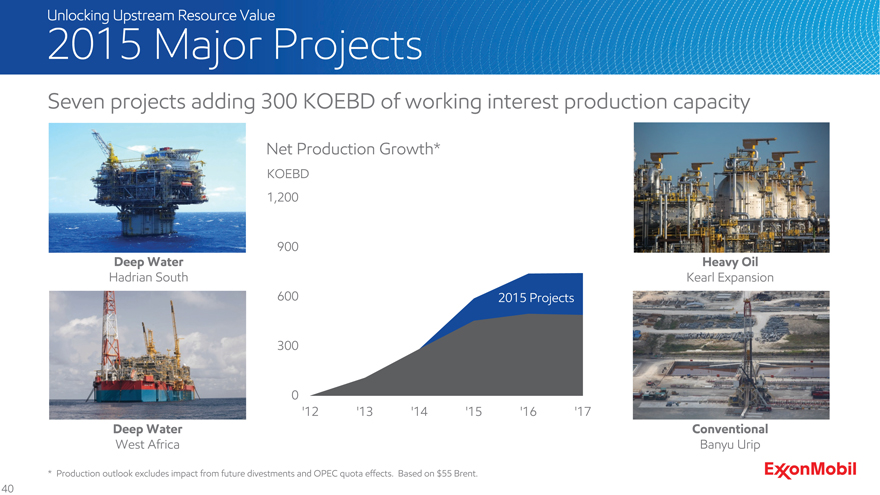
2015 Major Projects
Seven projects adding 300 KOEBD of working interest production capacity
Net Production Growth*
KOEBD 1,200
900
Deep Water Heavy Oil
Hadrian South Kearl Expansion 600 2015 Projects
300
0
‘12 ‘13 ‘14 ‘15 ‘16 ‘17
Deep Water Conventional
West Africa Banyu Urip
* Production outlook excludes impact from future divestments and OPEC quota effects. Based on $55 Brent.
40
|
|
Unlocking Upstream Resource Value
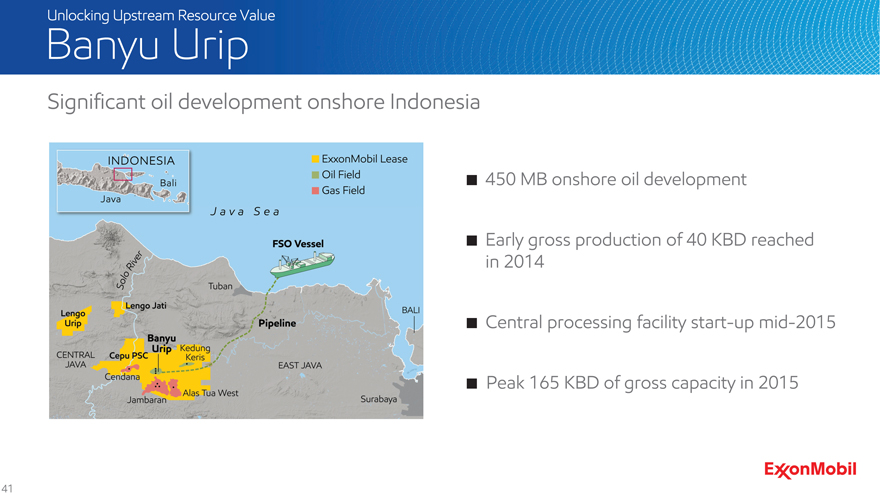
Banyu Urip
Significant oil development onshore Indonesia
450 MB onshore oil development
Early gross production of 40 KBD reached in 2014
Central processing facility start-up mid-2015
Peak 165 KBD of gross capacity in 2015
41
|
|
Unlocking Upstream Resource Value
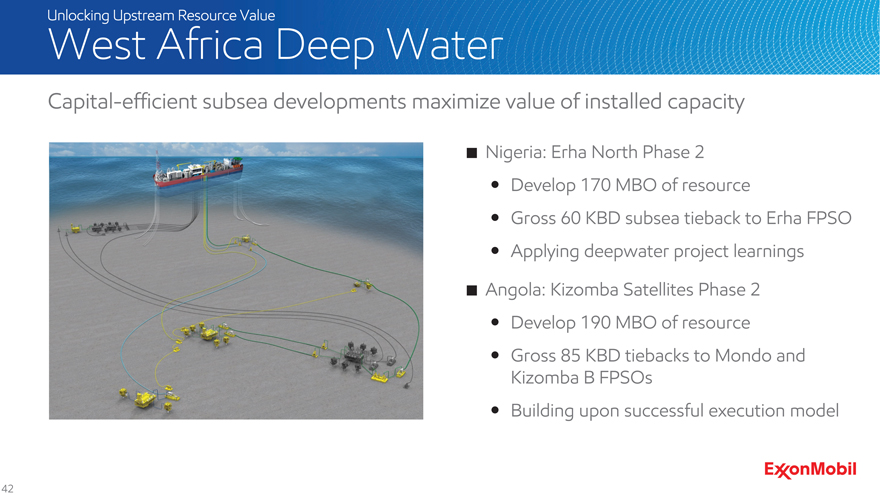
West Africa Deep Water
Capital-efficient subsea developments maximize value of installed capacity
Nigeria: Erha North Phase 2 Develop 170 MBO of resource
Gross 60 KBD subsea tieback to Erha FPSO Applying deepwater project learnings
Angola: Kizomba Satellites Phase 2 Develop 190 MBO of resource Gross 85 KBD tiebacks to Mondo and Kizomba B FPSOs Building upon successful execution model
42
|
|
Unlocking Upstream Resource Value
2016-2017 Major Projects
Nine projects adding more than 400 KOEBD of working interest production capacity
Net Production Growth*
KOEBD 1,200
2016 & 2017 Projects 900
LNG Conventional
Gorgon Jansz Upper Zakum 750
2015 Projects
600
300
0
‘12 ‘13 ‘14 ‘15 ‘16 ‘17
Arctic Sub-Arctic
Hebron Odoptu Stage 2
* Production outlook excludes impact from future divestments and OPEC quota effects. Based on $55 Brent.
43
|
|
Unlocking Upstream Resource Value
Hebron
Extending industry-leading Arctic development capabilities
700 MB oil development
Constructing gravity-based structure
Fabricating topsides
Integrating topsides and gravity-based structure in Newfoundland
150 KBD gross production capacity
44
|
|
Unlocking Upstream Resource Value
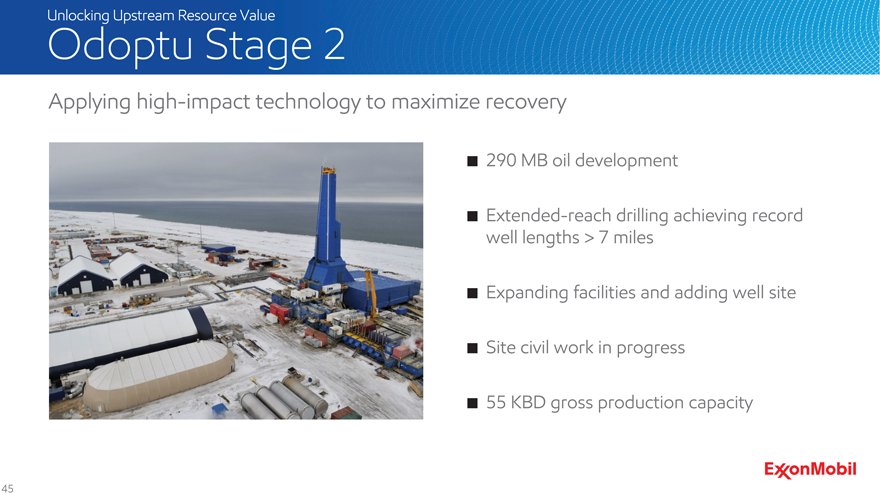
Odoptu Stage 2
Applying high-impact technology to maximize recovery
290 MB oil development
Extended-reach drilling achieving record well lengths > 7 miles
Expanding facilities and adding well site
Site civil work in progress
55 KBD gross production capacity
45
|
|
Unlocking Upstream Resource Value
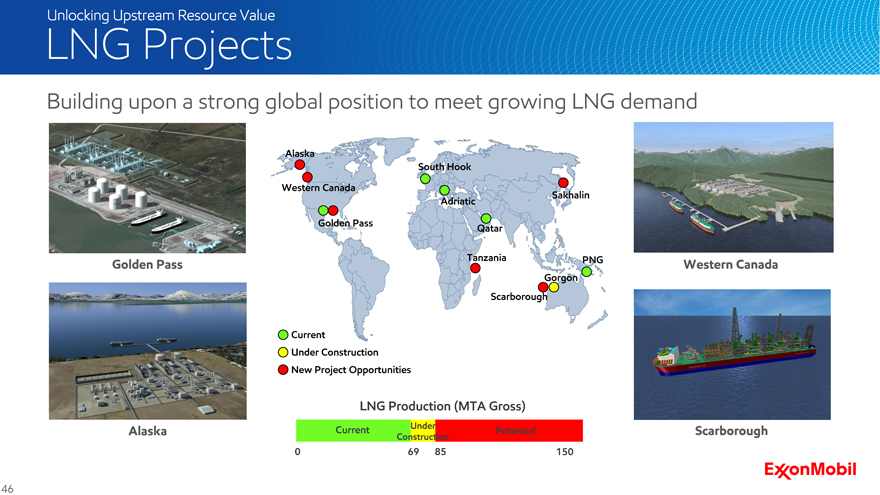
LNG Projects
Building upon a strong global position to meet growing LNG demand
Alaska
South Hook Western Canada
Sakhalin Adriatic Golden Pass Qatar
Tanzania PNG Western Canada Golden Pass
Gorgon Scarborough
Current
Under Construction New Project Opportunities
LNG Production (MTA Gross)
Alaska Current Under Potential Scarborough
Construction
0 69 85 150
46
|
|
Unlocking Upstream Resource Value
Project Management
Best-in-class project execution
Project Performance
Actual vs. Planned, ‘10 – ‘14 average Industry-leading performance in complex
Percent ExxonMobil Operated project development 140 Operated by Others
130 Effective development planning, design, and 120 execution lead to efficiencies 110 Systematically incorporating lessons learned to improve results
100
Schedule Cost
47
|
|
Unlocking Upstream Resource Value
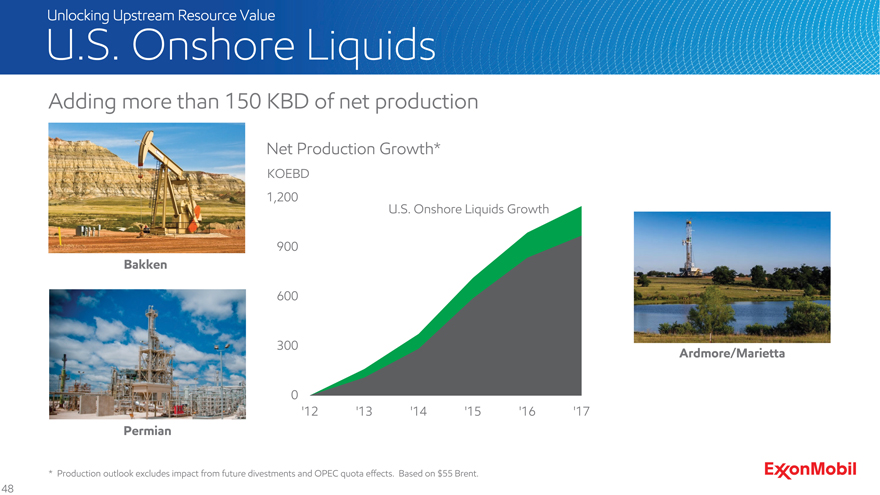
U.S. Onshore Liquids
Adding more than 150 KBD of net production
Net Production Growth*
KOEBD 1,200
U.S. Onshore Liquids Growth
900
Bakken
600
300
Ardmore/Marietta
0
‘12 ‘13 ‘14 ‘15 ‘16 ‘17
Permian
* Production outlook excludes impact from future divestments and OPEC quota effects. Based on $55 Brent.
48
|
|
Unlocking Upstream Resource Value
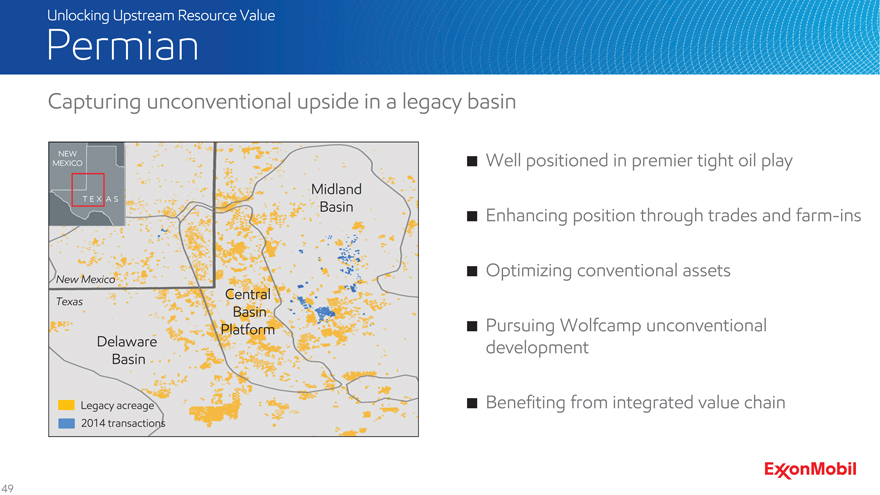
Permian
Capturing unconventional upside in a legacy basin
Well positioned in premier tight oil play
Midland
Basin Enhancing position through trades and farm-ins
Optimizing conventional assets
New Mexico
Central
Texas
Basin
Platform Pursuing Wolfcamp unconventional Delaware development
Basin
Legacy acreage Benefiting from integrated value chain
2014 transactions
49
|
|
Unlocking Upstream Resource Value
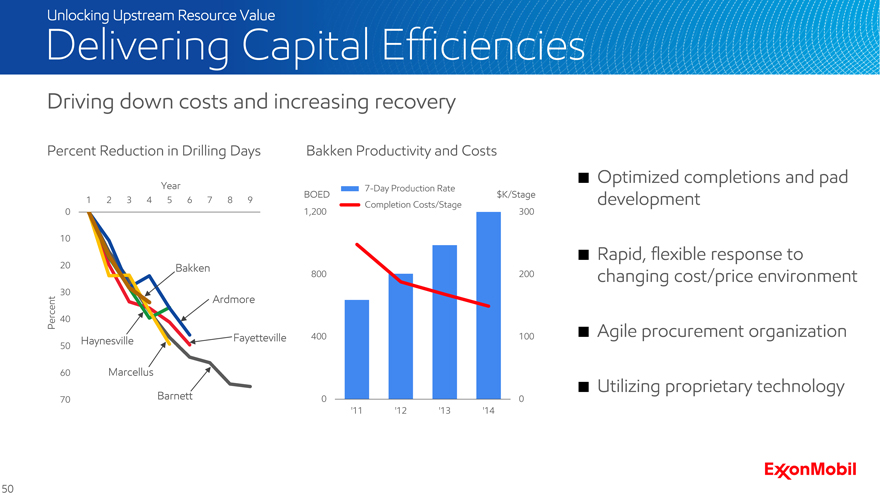
Delivering Capital Efficiencies
Driving down costs and increasing recovery
Percent Reduction in Drilling Days Bakken Productivity and Costs
Optimized completions and pad
Year 7-Day Production Rate
BOED $K/Stage
12 345 678 9 development
Completion Costs/Stage
0 1,200 300
10 Rapid, flexible response to
20 Bakken 800 200 changing cost/price environment
30
Ardmore
Percent 40
Fayetteville 400 100 Agile procurement organization
Haynesville
50
60 Marcellus
Utilizing proprietary technology
70 Barnett 0 0 ‘11 ‘12 ‘13 ‘14
50
|
|
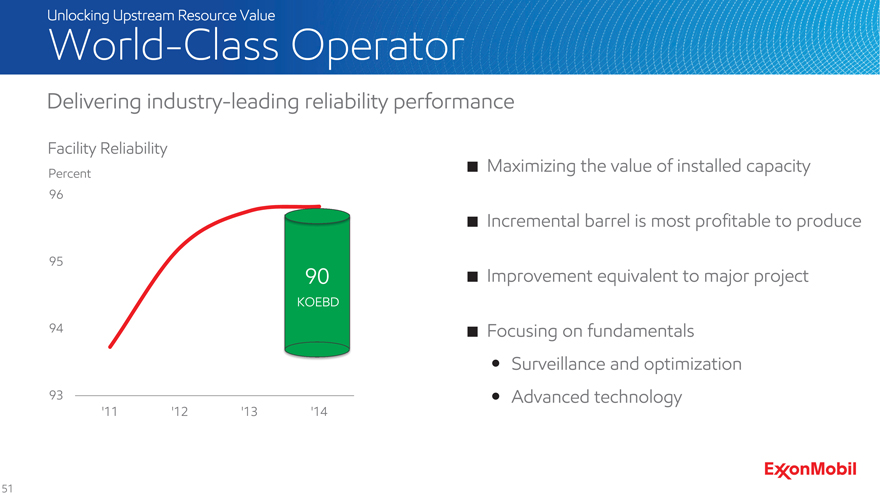
Unlocking Upstream Resource Value
World-Class Operator
Delivering industry-leading reliability performance
Facility Reliability the value of installed Percent Maximizing capacity
96
Incremental barrel is most profitable to produce
95
90 Improvement equivalent to major project
KOEBD
94 Focusing on fundamentals Surveillance and optimization
93 Advanced technology
‘11 ‘12 ‘13 ‘14
51
|
|
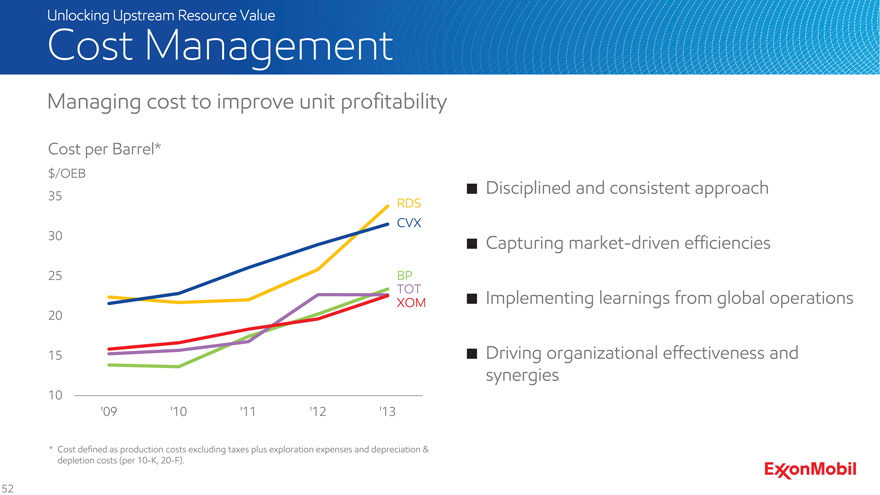
Unlocking Upstream Resource Value
Cost Management
Managing cost to improve unit profitability
Cost per Barrel*
$/OEB
Disciplined and consistent approach
35
RDS
30 CVX
Capturing market-driven efficiencies
25 BP
TOT Implementing learnings from global operations
20 XOM
15 Driving organizational effectiveness and synergies
10
‘09 ‘10 ‘11 ‘12 ‘13
* Cost defined as production costs excluding taxes plus exploration expenses and depreciation & depletion costs (per 10-K, 20-F).
52
|
|
Unlocking Upstream Resource Value
Summary
Well positioned to unlock maximum resource value
Disciplined investment and selectivity
Adding to a high-quality resource base
Developing a broad, diverse project portfolio
World-class operational excellence and project management expertise
Growing higher-margin production
53
|
|
Strengthening the Downstream &
Chemical Portfolio
|
|
Strengthening the Downstream & Chemical Portfolio
Increasing the Advantage
Strategically investing to outperform across the cycle
Achieving strong operational excellence
Improving feedstock flexibility
Growing high-value product yield
Driving operational efficiencies
Increasing logistics capabilities
55
|
|
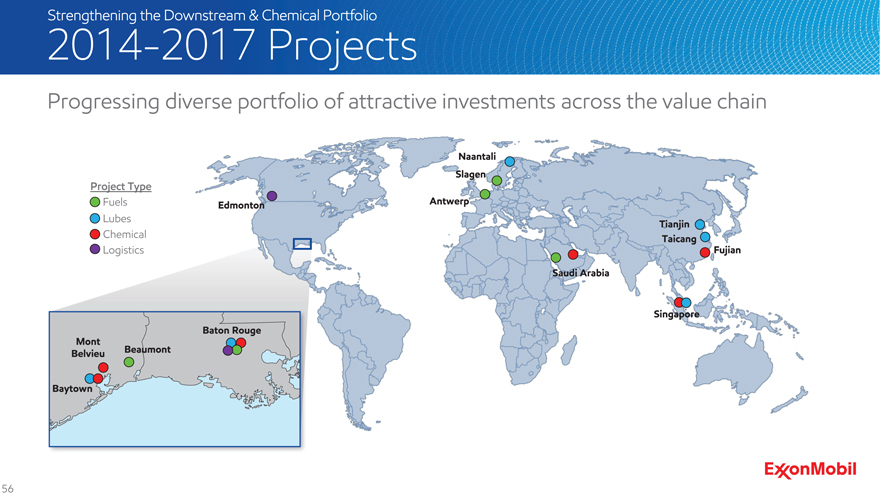
Strengthening the Downstream & Chemical Portfolio
2014-2017 Projects
Progressing diverse portfolio of attractive investments across the value chain
Naantali Slagen
Project Type
Fuels Edmonton Antwerp
Lubes
Chemical Tianjin Taicang
Logistics Fujian Saudi Arabia
Singapore Baton Rouge Mont Belvieu Beaumont
Baytown
56
|
|
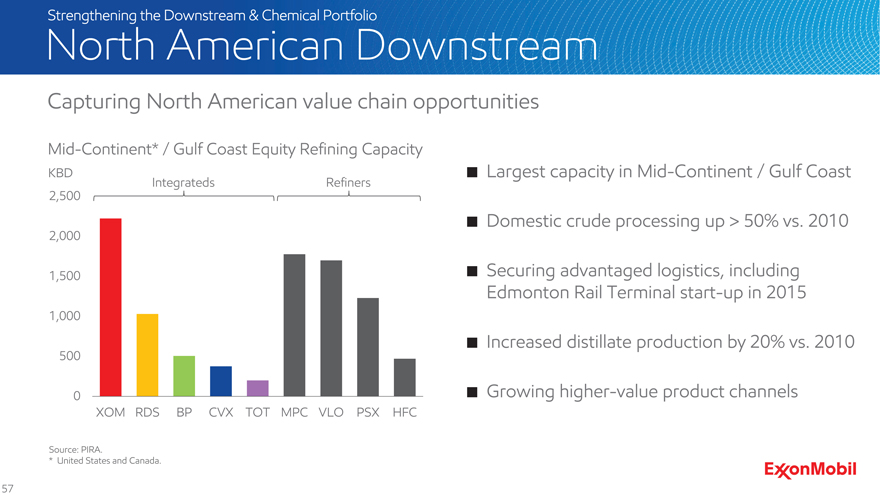
Strengthening the Downstream & Chemical Portfolio
North American Downstream
Capturing North American value chain opportunities
Mid-Continent* / Gulf Coast Equity Refining Capacity
KBD Largest capacity in Mid-Continent / Gulf Coast
Integrateds Refiners 2,500
Domestic crude processing up > 50% vs. 2010
2,000
1,500 Securing advantaged logistics, including Edmonton Rail Terminal start-up in 2015
1,000
500 Increased distillate production by 20% vs. 2010
0 Growing higher-value product channels
XOM RDS BP CVX TOT MPC VLO PSX HFC
Source: PIRA.
* United States and Canada.
57
|
|
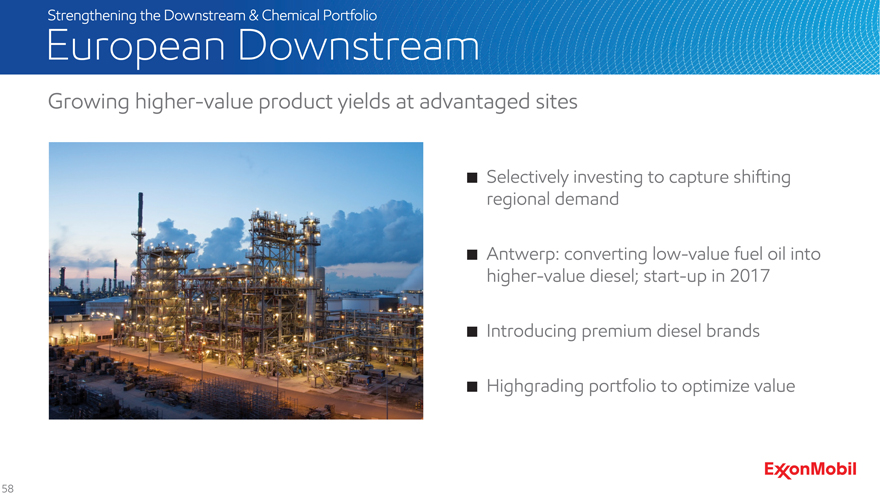
Strengthening the Downstream & Chemical Portfolio
European Downstream
Growing higher-value product yields at advantaged sites
Selectively investing to capture shifting regional demand
Antwerp: converting low-value fuel oil into higher-value diesel; start-up in 2017
Introducing premium diesel brands
Highgrading portfolio to optimize value
58
|
|
Strengthening the Downstream & Chemical Portfolio
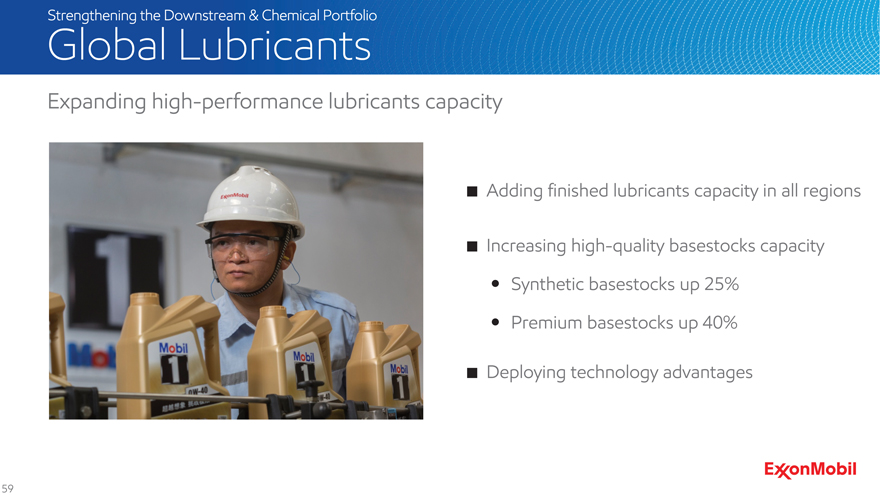
Global Lubricants
Expanding high-performance lubricants capacity
Adding finished lubricants capacity in all regions
Increasing high-quality basestocks capacity Synthetic basestocks up 25% Premium basestocks up 40%
Deploying technology advantages
59
|
|
Strengthening the Downstream & Chemical Portfolio
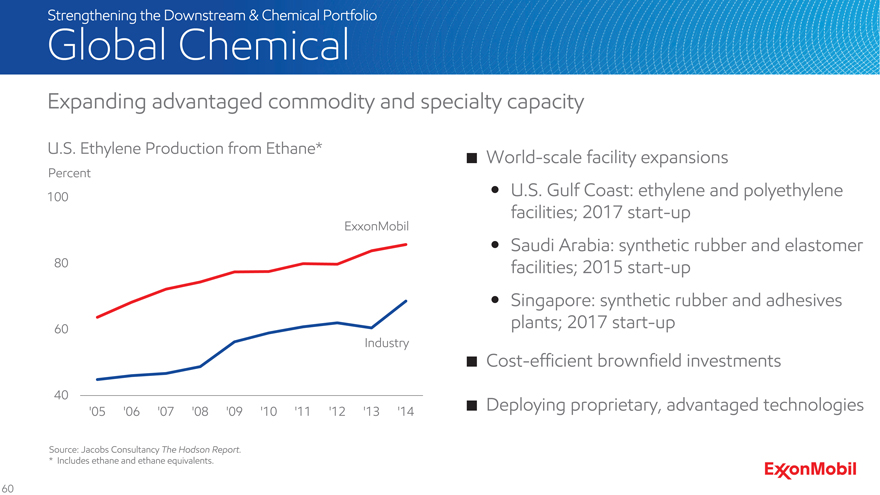
Global Chemical
Expanding advantaged commodity and specialty capacity
U.S. Ethylene Production from Ethane* World-scale facility expansions
Percent
100 U.S. Gulf Coast: ethylene and polyethylene facilities; 2017 start-up
ExxonMobil
Saudi Arabia: synthetic rubber and elastomer 80 facilities; 2015 start-up Singapore: synthetic rubber and adhesives 60 plants; 2017 start-up
Industry
Cost-efficient brownfield investments
40 Deploying proprietary, advantaged technologies
‘05 ‘06 ‘07 ‘08 ‘09 ‘10 ‘11 ‘12 ‘13 ‘14
Source: Jacobs Consultancy The Hodson Report.
* Includes ethane and ethane equivalents.
60
|
|
Strengthening the Downstream & Chemical Portfolio
Summary
Delivering industry-leading results through the business cycle
Downstream and Chemical Combined ROCE
Percent Superior financial performance
40
Generating solid cash flow
30
ExxonMobil
Proven strategies and competitive advantages
20
Selectively investing in attractive opportunities
10
Competitor
average* Disciplined approach to portfolio optimization
0
‘05 ‘06 ‘07 ‘08 ‘09 ‘10 ‘11 ‘12 ‘13 ‘14
* Competitor data (BP, RDS, CVX, and TOT) estimated on a consistent basis with ExxonMobil and based on public information.
61
|
|
Break
|
|
Summary
|
|
Key Messages
Continued focus on fundamentals in a lower price environment
Selectively investing in attractive opportunities: 2014 Capex $38.5B; 2015 Capex $34B
Growing higher-margin production: 4.0 MOEBD in 2014; 4.3 MOEBD in 2017
Delivering differentiated performance versus competition
Industry-leading shareholder returns
64
|
|
Q&A