| 1 | ||||||
| 3 | ||||||
| 14 | ||||||
| 16 | ||||||
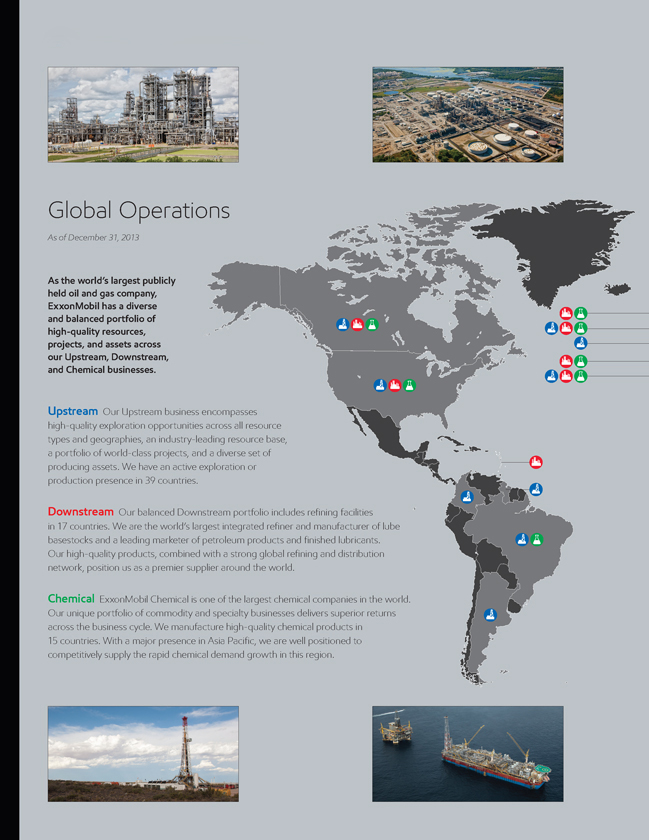
| 58 | ||||||
| 72 | ||||||
| 82 | ||||||
| 90 | ||||||
| 94 | ||||||
| 95 | ||||||
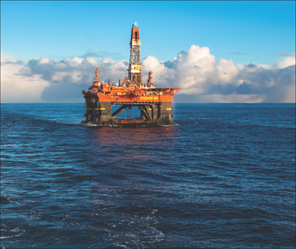
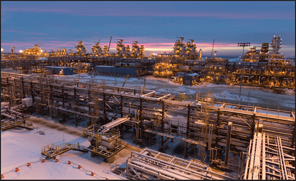
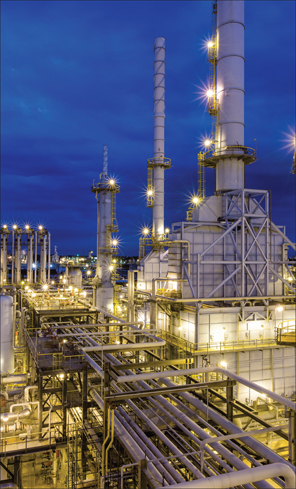
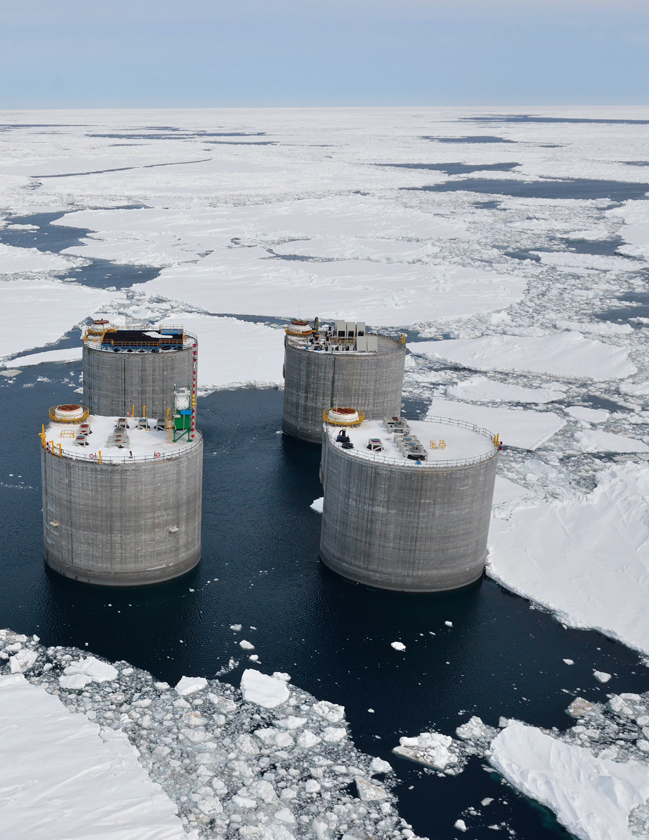
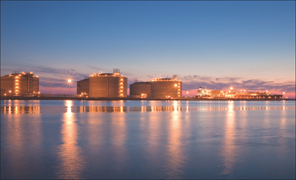
COVER PHOTO: Liquefied natural gas (LNG) produced at our joint ventures with Qatar Petroleum is transported to global markets at constant temperature and pressure by dedicated carriers designed and built to meet the most rigorous safety standards.
Statements of future events or conditions in this report, including projections, targets, expectations, estimates, and business plans, are forward-looking statements. Actual future results, including demand growth and energy mix; capacity growth; the impact of new technologies; capital expenditures; project plans, dates, costs, and capacities; resource additions, production rates, and resource recoveries; efficiency gains; cost savings; product sales; and financial results could differ materially due to, for example, changes in oil and gas prices or other market conditions affecting the oil and gas industry; reservoir performance; timely completion of development projects; war and other political or security disturbances; changes in law or government regulation; the actions of competitors and customers; unexpected technological developments; general economic conditions, including the occurrence and duration of economic recessions; the outcome of commercial negotiations; unforeseen technical difficulties; unanticipated operational disruptions; and other factors discussed in this report and in Item 1A of ExxonMobil’s most recent Form 10-K.
Definitions of certain financial and operating measures and other terms used in this report are contained in the section titled “Frequently Used Terms” on pages 90 through 93. In the case of financial measures, the definitions also include information required by SEC Regulation G.
“Factors Affecting Future Results” and “Frequently Used Terms” are also available on the “investors” section of our website.
Prior years’ data have been reclassified in certain cases to conform to the 2013 presentation basis.
The term “project” as used in this publication can refer to a variety of different activities and does not necessarily have the same meaning as in any government payment transparency reports.
2013: Financial & Operating Summary
We achieved strong financial and operating results in 2013, highlighted by our continued ability to generate strong cash flows that enable industry-leading shareholder distributions. We maintain a long-term perspective on our business with a relentless focus on operational excellence and disciplined investing through the business cycle. We continue to progress a unique and balanced set of profitable growth opportunities, which position us well to deliver long-term shareholder value.
FINANCIAL HIGHLIGHTS
| (millions of dollars, unless noted) |
|
Earnings After Income Taxes |
|
|
Average Capital Employed |
(1) |
|
Return on Average Capital Employed (%) |
(1) |
|
Capital and Exploration Expenditures |
(1) | ||||
| Upstream |
26,841 | 152,969 | 17.5 | 38,231 | ||||||||||||
| Downstream |
3,449 | 24,430 | 14.1 | 2,413 | ||||||||||||
| Chemical |
3,828 | 20,665 | 18.5 | 1,832 | ||||||||||||
| Corporate and Financing |
(1,538 | ) | (6,489 | ) | N.A. | 13 | ||||||||||
| Total |
32,580 | 191,575 | 17.2 | 42,489 | ||||||||||||
OPERATING HIGHLIGHTS
| Liquids production (net, thousands of barrels per day) |
2,202 | |||
| Natural gas production available for sale (net, millions of cubic feet per day) |
11,836 | |||
| Oil-equivalent production(2) (net, thousands of oil-equivalent barrels per day) |
4,175 | |||
| Refinery throughput (thousands of barrels per day) |
4,585 | |||
| Petroleum product sales (thousands of barrels per day) |
5,887 | |||
| Chemical prime product sales(1) (thousands of tonnes) |
24,063 | |||
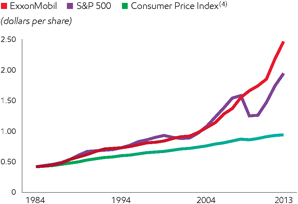
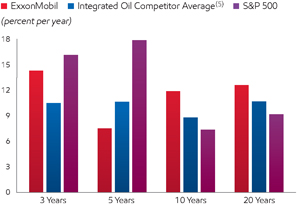
| Dividend Growth Since 1984(3) | Total Shareholder Returns(1) | |
|
| |
(1) See Frequently Used Terms on pages 90 through 93.
(2) Natural gas converted to oil-equivalent at 6 million cubic feet per 1 thousand barrels.
(3) S&P and CPI indexed to 1984 Exxon dividend.
(4) CPI based on historical yearly average from Bureau of Labor Statistics.
(5) Royal Dutch Shell, BP, Chevron, and Total values are on a consistent basis with ExxonMobil, based on public information.
|
|
EXXONMOBIL 2013 FINANCIAL & OPERATING REVIEW | |
|
|
RESULTS & HIGHLIGHTS
| • | Strong safety, environmental, and operations performance supported by effective risk management |
| • | Earnings of $32.6 billion and an industry-leading return on average capital employed(1) of 17 percent |
| • | Total shareholder distributions(1) of $25.9 billion |
| • | Dividends per share increased 11 percent in the second quarter of 2013, the 31st consecutive year of dividend-per-share increases |
| • | Proved oil and gas reserves(1) additions of 1.6 billion oil-equivalent barrels, replacing more than 100 percent of production for the 20th consecutive year |
| • | Started up six major Upstream projects with gross facility capacity of more than 930 thousand oil-equivalent barrels per day, highlighted by the Kearl Initial Development project |
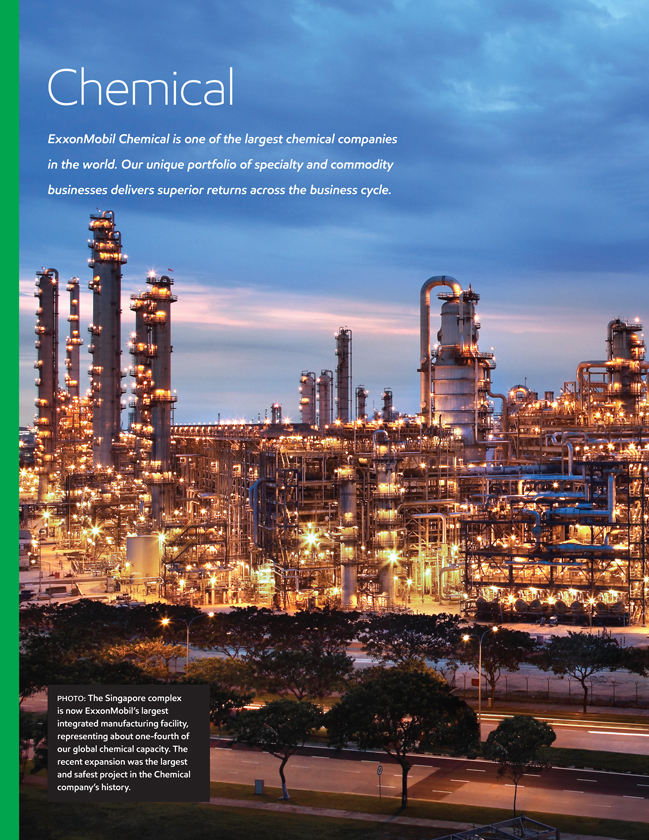
| • | Started up the Singapore Chemical Expansion project, more than doubling steam-cracking capacity at the site and significantly increasing premium and specialties capacity |
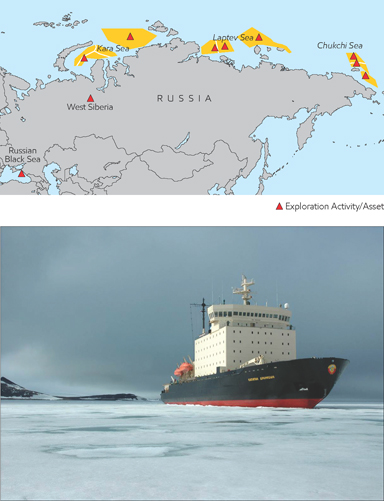
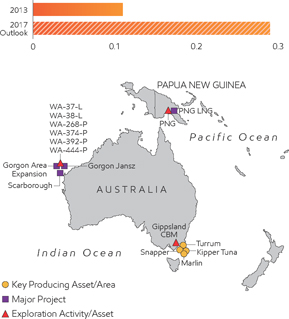
| • | Advanced construction and began commissioning activities at the Papua New Guinea Liquefied Natural Gas project |
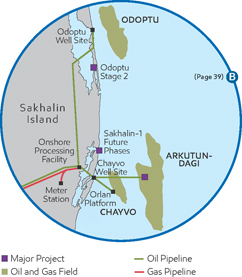
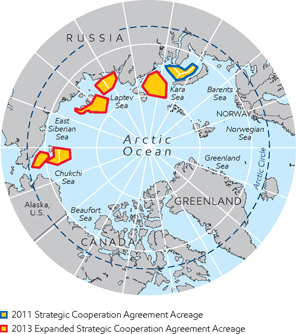
| • | Progressed and expanded the Strategic Cooperation Agreement with Rosneft to include seven additional licenses of exploration acreage in the Russian Arctic |
| • | Commissioned a new diesel hydrotreater in Singapore to increase ultra-low sulfur diesel production capacity |
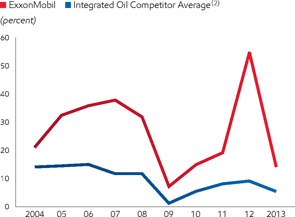
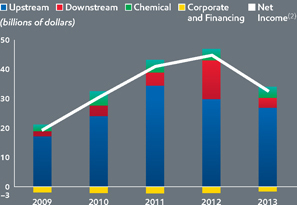
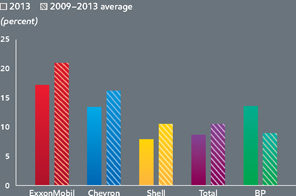
| Functional Earnings and Net Income | Return on Average Capital Employed(1)(3) | |
|
| |
(1) See Frequently Used Terms on pages 90 through 93.
(2) Net income attributable to ExxonMobil.
(3) Competitor data estimated on a consistent basis with ExxonMobil and based on public information.
|
| ||
ExxonMobil is positioned to deliver profitable growth as we start up our major projects and develop our unconventional portfolio in the Upstream and selectively invest in high-value opportunities in Downstream and Chemical. We continue to strategically position the company to deliver shareholder value over the long term, while maintaining our relentless focus on operational excellence.
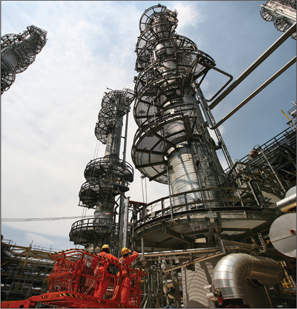
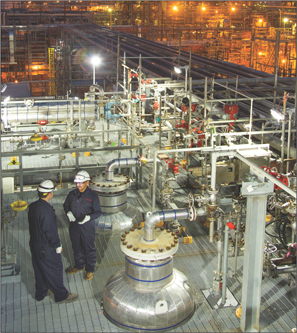
Operational Excellence Sustaining operational excellence is critical to our ability to deliver profitable growth. We rigorously deploy proven management systems to all of our facilities around the world and incorporate these standard systems into our daily operations to improve safety performance, increase reliability, and lower operating cost.
Upstream We are bringing several major projects online between 2012 and 2017, which are expected to deliver 1 million net oil-equivalent barrels per day of production by 2017, highlighted by the Kearl Initial Development in 2013, Papua New Guinea Liquefied Natural Gas (LNG) in 2014, and the Kearl Expansion project in 2015. We also continue to grow liquids production in our North American unconventional plays. This new production positions us to achieve profitable growth as our percentage of liquids and liquids-linked gas volumes are expected to increase to nearly 70 percent of total production in 2017.

Downstream We are making selective investments to strengthen our world-class Downstream business, which has been significantly improved through our continuous and disciplined portfolio management process. These investments will increase the production of high-value products, such as ultra-low sulfur diesel, jet fuel, and lubricants, to meet growing demand. Other investments will increase feedstock flexibility and operating efficiency at our advantaged manufacturing sites.
Chemical We are developing projects that capture advantaged feedstocks, deploy lower-cost processes, and increase premium product sales. Key examples include our recently completed Singapore expansion, where we more than doubled our steam-cracking capacity, and the specialty elastomers plant we are constructing in Saudi Arabia. Both of these projects will produce high-value premium products to serve growth markets. In the United States, we continue to progress a world-scale ethane cracker and associated premium polymer capacity at our Gulf Coast facilities to capture the value of advantaged feedstock from natural gas liquids.
We continue to evaluate and progress longer-term opportunities. Our deep portfolio includes additional LNG projects, global unconventional resources, and Russian Arctic developments with the potential to create long-term shareholder value. As we have demonstrated throughout our history, we maintain capital discipline by being selective and progressing only the opportunities with the greatest value.
Rex W. Tillerson, Chairman and CEO
|
|
EXXONMOBIL 2013 FINANCIAL & OPERATING REVIEW | |
DELIVERING PROFITABLE GROWTH
Operational Excellence
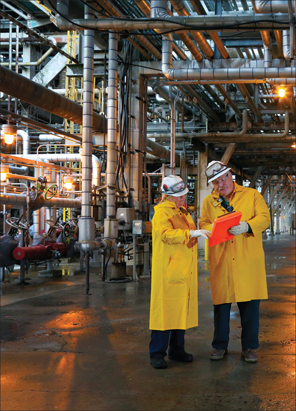
| Operational excellence underpins everything we do at ExxonMobil and is critical to delivering profitable growth. Driven by our talented and committed workforce, proven management systems are rigorously employed at ExxonMobil facilities across the globe and are incorporated into daily operations. These systems enable continuous improvement in safety performance, increased reliability, and lower operating costs.
CULTURE OF EXCELLENCE
Operational excellence begins with exceptional employees. Backed by comprehensive management systems, the men and women of ExxonMobil form the foundation for strong operational performance. We are proud of the culture of excellence reflected in the daily accomplishments of our employees around the world. It is a culture built by decades of past and current employees’ dedication to doing the right things, the right way, and not accepting compromises to our values.
Maintaining our culture of excellence begins the day a new employee starts working for ExxonMobil. In addition to having access to the depth and breadth of experiences of employees in similar positions around the world, new employees receive intensive training that is designed to incorporate proven best practices.
|
Comprehensive management systems are consistently applied around the globe, including at the Joliet Refinery (above and on opposite page). | |
| Employees also receive diverse experiences and assignments enabled by our global functional organization, which encourage the sharing of information and talent. Our goal is to retain employees for a long-term career so they can continue to grow | ||
| professionally, contribute to our strong experience base, and develop into our next generation of leaders. This philosophy applies equally to local workforce development, where we hire and train people of the developing countries in which we operate. | ||
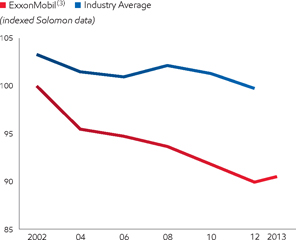
| Refining Energy Intensity(1)(2)
(1) Solomon Associates fuels refining data available for even years only. (2) 2013 data estimated by ExxonMobil. (3) Constant year-end 2013 portfolio. |
RELIABILITY AND EFFICIENCY
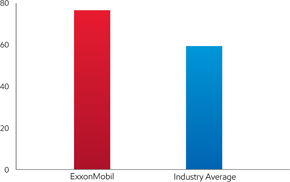
Operational excellence also involves a steadfast commitment to continuously improve the reliability and efficiency of our assets, which leads to improved profitability. We deploy rigorous reliability and maintenance systems that improve operating performance and preserve equipment integrity. Our Upstream reliability performance over the last five years demonstrates the effectiveness of our approach, with improved uptime more than 3 percentage points higher at ExxonMobil-operated assets compared to assets in our portfolio operated by others. This improvement equates to approximately 39 thousand net oil-equivalent barrels per day of additional production.
Another way that our commitment to operational excellence improves profitability is demonstrated by the efficiency of our Downstream assets. Cash operating costs at ExxonMobil refineries have been well below the |
|
| ||
| industry average, driven in large part by energy efficiency improvements. With energy representing as much as 60 percent of the operating cost of a refinery, every incremental improvement in energy efficiency results in increased margins and profitability. Since 2002, we have improved refinery energy efficiency by 10 percent, enabled by the application of our Global Energy Management System and strategic investments.
OPERATIONS INTEGRITY MANAGEMENT SYSTEM
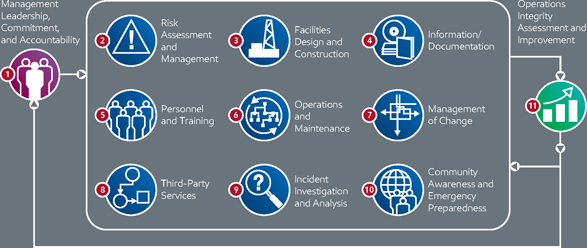
Management systems are deployed throughout our global operations to ensure the consistent application of high operating standards. The Operations Integrity Management System (OIMS) forms the cornerstone of our commitment to operational excellence and provides a solid framework to achieve safe and reliable operations.
OIMS establishes the framework for managing the safety, security, health, and environmental risks in our business, and provides the structure to help us meet or exceed applicable regulations. We continually assess the framework and its effectiveness and incorporate learnings to further improve performance. OIMS is implemented consistently around the world in all business lines, and compliance is tested on a regular basis. |
|
SYSTEMATIC APPROACH
ExxonMobil’s Operations Integrity Management System (OIMS) contributes to maintaining high standards across all operations. Each of the 11 elements of OIMS contains an underlying principle and a set of expectations that apply to all ExxonMobil operations worldwide. Management is responsible for having robust systems in place to satisfy these expectations and testing for compliance on a regular basis.
|
|
EXXONMOBIL 2013 FINANCIAL & OPERATING REVIEW | |
DELIVERING PROFITABLE GROWTH
Upstream: Developing Advantaged Resources
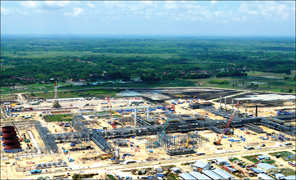
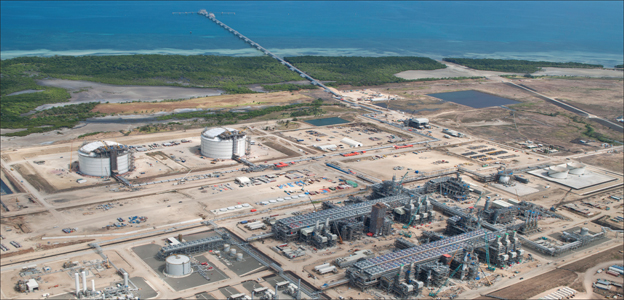
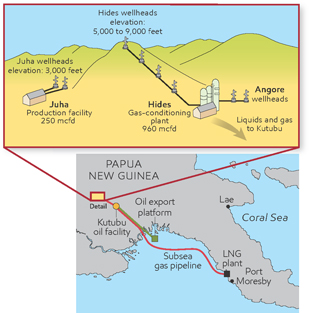
ExxonMobil’s unique combination of experience and expertise operating in difficult environments sets the stage for project execution success in emerging countries such as Papua New Guinea (PNG). In PNG, this knowledge has enabled ExxonMobil and its partners to surmount a myriad of challenges as they approach start-up of the PNG Liquefied Natural Gas (PNG LNG) project in 2014.
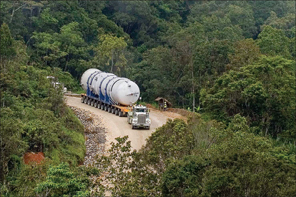
| The $19 billion development in PNG will produce 6.9 million tonnes per annum (MTA) of LNG for shipment to international markets as well as domestic sales. It is designed to tap world-class reserves from eight separate fields spread across approximately 120 miles. The project includes the construction of a 960-million-cubic-foot- per-day gas conditioning plant in the mountainous Southern Highlands, a liquefaction plant near Port Moresby, and 434 miles of pipeline (253 miles subsea) connecting the two. Successful project development, start-up, and future operations rely on strong relationships with host governments, local communities, and partners, as well as thoughtful planning and proper employment of project management fundamentals. |
A vessel is transported to the Hides gas plant site through the unique PNG terrain. |
WORLD-CLASS EXECUTION
Through a disciplined approach to project management, the project is well positioned to start up in 2014 despite difficult local conditions. The challenges included zero to low visibility, minimal pre-existing infrastructure, incredibly steep slopes (up to 50-percent grade), as well as geotechnical constraints such as volcanic soil and fault lines. The onshore pipeline, for instance, crosses five faults, which required strain-based-designed pipe and specialized installation procedures. An airfield was constructed in the Highlands to airlift facility modules to build the gas conditioning plant. During the airfield’s construction, more than 9 million cubic meters of earth were moved, and the area experienced enough rainfall to cover the site with 31 feet of water. In addition to technical challenges, a project of this magnitude required global experience to successfully manage a workforce of approximately 20,000 people (speaking more than 40 different languages). Papua New Guinean nationals comprised more than 40 percent of the workforce at its peak.
The project team is preparing for production as construction activities near completion.
|
| ||
COST COMPETITIVENESS
Global LNG projects must be cost-competitive to deliver superior returns. Based on our world-class project execution capabilities and ability to complete projects on schedule, PNG LNG will be at the low end of the cost curve relative to other projects being developed. Even by incorporating the more expensive cost component of the construction in the mountainous Highlands, the cost per MTA for the PNG LNG project will be among the lowest of projects being built in the region.
CAPTURING GROWING ASIAN LNG DEMAND
PNG LNG project revenues and profitability are underpinned by long-term LNG sales contracts covering more than 95 percent of the plant’s capacity. The project is optimally located to serve growing Asian markets where LNG demand is expected to grow by approximately 165 percent between 2010 and 2025, to 370 million tonnes per year. ExxonMobil’s LNG marketing experience and successful track record of developing large LNG projects were instrumental in securing sales with customers in China, Japan, and Taiwan.
EFFECTIVE RELATIONSHIPS WITH THE
GOVERNMENT AND LOCAL COMMUNITIES
Throughout construction, the project team, with our co-venture partners and positive relationship with the PNG government, has been able to draw on specific industry, socioeconomic, and cultural expertise that has helped position the project for success.
In 2011, we began training approximately 140 talented Papua New Guinean nationals for the production workforce that will operate the facilities for more than 30 years. Our Papua New Guinean employees developed into a team that respects and understands the importance of business fundamentals by maintaining excellence in safety, health and environment, and in ensuring accountability, integrity, and the highest standards of performance.
We created programs to improve maternal health and reduce child mortality rates as well as initiatives designed to promote sustainable business growth. For example, we developed the Enterprise Centre, which has already assisted more than 16,000 Papua New Guinean entrepreneurs. To care for the local environment, the project has adopted international best practices in its approach to biodiversity management, waste management and recycling, and invasive weed and pest control programs.
LEADING LNG CAPABILITIES
The PNG LNG project exemplifies ExxonMobil’s leadership in project execution, advanced technologies, and marketing capabilities. We will continue to enhance our reputation and leading LNG capabilities as we start delivering LNG cargoes from PNG in 2014. Our demonstrated expertise enables effective working relationships with customers, partners, and governments around the world as we progress other LNG opportunities in our portfolio, including expansion opportunities in PNG, to meet growing global demand.
PNG LNG underscores our ability to complete a complex project and develop a world-class resource in a challenging environment on schedule and at a competitive cost. This project will deliver reliable, affordable energy to our customers and create long-term economic value for the people of Papua New Guinea, our partners, and shareholders.
|
|
EXXONMOBIL 2013 FINANCIAL & OPERATING REVIEW | |
DELIVERING PROFITABLE GROWTH
Upstream: Developing Advantaged Resources
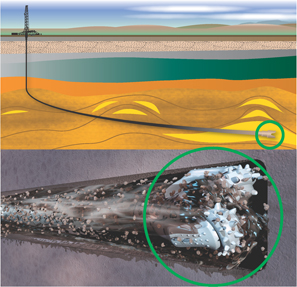
ExxonMobil has captured a significant position in one of the United States’ premier tight oil plays, the Bakken of North Dakota and Montana. By applying our unconventional expertise to leasehold covering nearly 570,000 acres and leveraging our world-class research organization, we are expanding the resource base and delivering strong, high-margin production growth.
| STRONG, HIGH-MARGIN GROWTH | ||
|
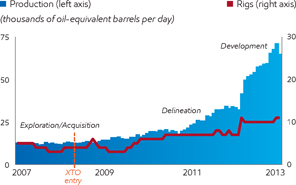
Driven by a record 110 wells brought to sales, improving well performance, and an opportunistic acquisition, Bakken gross-operated production increased 81 percent in 2013 to more than 59 thousand oil-equivalent barrels per day. Peak 30-day production rates on new Bakken wells also increased 22 percent in 2013 and have risen 46 percent in the last two years. Since XTO Energy entered the play in 2008, operated production is up fivefold, and our Bakken resource now exceeds more than 900 million net oil-equivalent barrels.
After several years of delineation drilling and optimizing drilling and completion practices, rapidly increasing production reflects our entry into the development stage of the play. We are now completing multiple pad-based wells in geological sweet spots and have significantly increased the number of stimulation stages in the horizontal laterals. In order to optimize productivity, the Bakken |
Bakken Production Growth Gross-Operated Production
|
completion “recipe” is being continuously adjusted based on several
factors, including the number of stages, varying stage length, the sand volume used in each stimulation, the liquid volume and rate, and the proppant type.
The late 2012 Bakken acquisition of more than 190,000 acres is another principal factor contributing to resource and production growth. In addition to increasing our production and acreage by roughly 50 percent, the quality of the acreage and location close to our core operations enabled us to highgrade the drilling inventory and seamlessly integrate the acquired properties. Moreover, we were able to add the properties at an attractive price since part of the transaction involved trading non-core legacy ExxonMobil properties to the seller. This provides a prime example of how the integration of XTO and ExxonMobil enhances shareholder value, and of our disciplined investment approach.
OPERATIONAL EXCELLENCE
We continue to demonstrate operational excellence through relentless efforts to increase drilling, completion, and operations
| efficiencies, and through our enduring commitment to safety and environmental performance, | all of which are critical to maximizing value. | |
| Bakken Stages
|
For example, after entering the Bakken development phase, highlighted by standardized drilling and completion practices and pad drilling, we have seen our drilling days per well decline 28 percent to 22 days since 2011. Coupled with a 39-percent reduction in completion costs per stimulation stage, these efficiencies have contributed to a 25-percent decrease in total drilling and completion costs in the last two years. |
Source: ExxonMobil estimates based on IHS and North Dakota Industrial Commission data.
|
| ||
| We also are progressing development of Bakken infrastructure to match production growth. In 2013, we completed a major upgrade to our gas gathering facilities in the Nesson area, increasing our ability to capture value from liquids-rich gas, and reducing downtime and gas flaring. Other transportation and gathering initiatives are under way in the Little Missouri and Fort Berthold areas.
INTEGRATING HIGH-IMPACT TECHNOLOGY
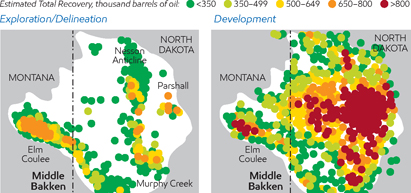
XTO and ExxonMobil’s Upstream Research Company are collaborating to increase Bakken recovery and enhance drilling, completion, and operational efficiencies. The unique combination of ExxonMobil’s research capability and XTO’s strong acreage position and operational expertise provides numerous opportunities to test new technologies in the field and deliver proven technologies for immediate benefit.
This partnership forms an important part of the future development strategy of the Middle Bakken and Three Forks reservoirs in the Williston Basin. Ultimately, integrated geoscience and engineering |
ExxonMobil is applying its Bakken expertise and technology in areas such as the Vaca Muerta in Argentina and West Siberia in Russia. |
teams will rapidly incorporate the results of regional geologic analyses and local stratigraphic trends, fracturing research, and data analytics into planning and completing the highest-impact wells in the most productive areas.
Initial field studies are already under way, with drilling and completion of pilot wells evaluating the optimum spacing of laterals in a drilling unit, and analyzing the potential from the lower benches of the Three Forks formation. Both of these could have a significant impact on our resource and production upside in the Bakken.
In addition, we have begun testing our next generation of completion technology, called XFrac. The Bakken industry standard for hydraulic fracturing completions requires setting dozens of “plugs” in the well to achieve the most effective completion. The plugs must then be drilled out and removed in order to produce the wells. Both of these steps require significant time at a substantial cost. Our proprietary XFrac technology is designed to eliminate the need for plugs, making it possible to complete the well at a lower cost and produce the well sooner, compared to the industry’s current methods.
When combined with XTO’s operational expertise, our proprietary technology provides unique opportunities to optimize Bakken development.

|
|
EXXONMOBIL 2013 FINANCIAL & OPERATING REVIEW | |
DELIVERING PROFITABLE GROWTH
Downstream: Strengthening the Portfolio
ExxonMobil’s Downstream investments continue to strengthen our advantaged manufacturing assets by leveraging proprietary technology to increase the yield of high-value products, improve feedstock flexibility, and increase operating efficiency. We carefully evaluate investment opportunities across a range of potential market conditions and advance only those projects likely to provide long-term shareholder value. The success of our disciplined investment approach is demonstrated by our industry-leading Downstream return on capital employed.
| Since 2005, we have reduced our refining capacity by more than 1 million barrels per day by divesting smaller, less-competitive facilities. The refineries that remain in our portfolio are generally larger, more efficient, and integrated with chemical and lubricant manufacturing facilities. Going forward, we will continue to strengthen our portfolio by investing in attractive return projects at our advantaged sites. These projects will capitalize on ExxonMobil’s technology, scale, and integration.
INCREASING HIGH-VALUE PRODUCT YIELDS
A key focus area for our Downstream investments is increasing the production of high-value products at our advantaged sites. While the demand for some petroleum products, such as gasoline and fuel oil, is expected to decline, demand for high-value products, such as ultra-low sulfur diesel, jet fuel, chemical feedstocks, and lubricants, is expected to continue to grow. Our investments will increase the production of these high-value products to meet future demand and improve profitability. Our fully integrated marketing and sales teams generate consumer demand for these products and help us maximize the value of every molecule that we produce. |
Downstream Return on Average Capital Employed(1)
(1) See Frequently Used Terms on pages 90 through 93. (2) Royal Dutch Shell, BP, Chevron, and Total values are estimated on a consistent basis with ExxonMobil, based on public information. |
A recent highlight was the commissioning of a new diesel hydrotreater at our Singapore Refinery, which resulted in a significant increase in our ultra-low sulfur diesel production capacity. To build on this success, we are evaluating the construction of a 50-thousand-barrel-per-day delayed coker at our integrated refinery in Antwerp, Belgium. If approved, the new facility will efficiently upgrade low-value fuel oil currently produced at our refineries in northern Europe into higher-value products, including ultra-low sulfur diesel.
Recent investments such as our new hydrotreater in Singapore are contributing to growing production of high-value products. Commissioned in December 2013, the new facility has a capacity of 62 thousand barrels per day.
|
| ||
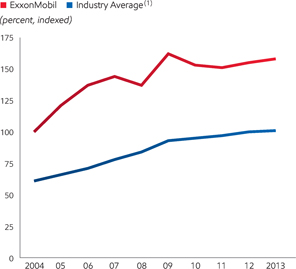
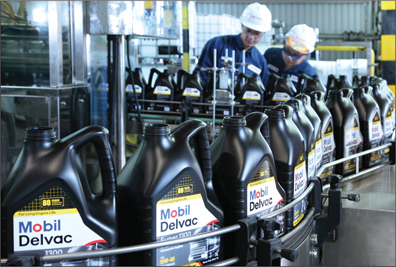
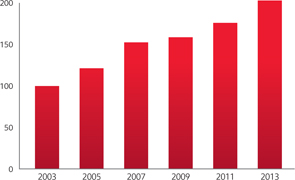
| We continue to expand our high-value lubricants business. Sales of our industry-leading products, Mobil 1, Mobil SHC, and Mobil Delvac 1, have almost doubled in the last 10 years and are growing at a faster rate than industry. To further capture profitable growth, we are increasing our capacity to produce high-performance lube basestocks at our facilities in Texas, Louisiana, and Singapore. We are also expanding our lube oil blending capacities in the United States, Finland, and China, supporting the growing demand for finished lubricants in key markets.
REDUCING RAW MATERIAL COST
Downstream investments will also continue to expand refinery feedstock flexibility in order to lower raw material costs and increase margins. Our major focus will remain in North America, where increased crude oil production is creating attractive downstream investment opportunities. ExxonMobil has |
ExxonMobil U.S. Gulf Coast Advantaged Crude Refining
|
the largest combined mid-continent and Gulf Coast refining capacity, and refineries in these regions are benefiting from the growing North American crude oil supply. Our investments in these facilities will further expand our capability to process both light and heavy crude oil.
|
EXPANDING LOGISTICS CAPABILITY
We are investing to strengthen our crude oil and product logistics capabilities, particularly in North America. For example, in 2013, we acquired a controlling interest in the Wolverine Pipeline system to improve our U.S. mid-continent product logistics. We also recently began construction of a new crude oil rail export terminal in Edmonton to provide cost-advantaged logistics for the growing supply of Western Canadian crude oil. The new terminal will begin operating in 2015 with a capacity of up to 250 thousand barrels per day. Additional investments will expand product export capabilities at our large U.S. Gulf Coast refineries.
WORLD-CLASS OPERATING EFFICIENCY
Underpinned by disciplined investments, worldwide cash operating cost for our portfolio of refineries has been well below the industry average and consistently outperforms competition. Future investments will strengthen our cost advantage. For example, building on our leadership position in cogeneration, we recently started up a new project at our refinery in Augusta, Italy, and are progressing plans for the next project at our refinery in Singapore.
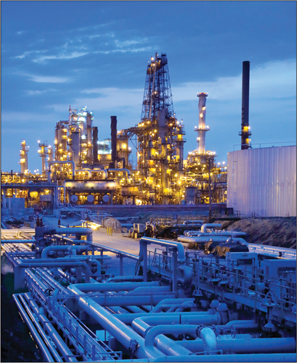
Future downstream investments are expected to increase high-value product yields, reduce raw material cost, and improve operating efficiency at advantaged sites, such as our Baytown Refinery. |
|
|
EXXONMOBIL 2013 FINANCIAL & OPERATING REVIEW | |
DELIVERING PROFITABLE GROWTH
Chemical: Strategic Investments
We capture market opportunities in our Chemical business by developing world-scale projects that process advantaged feedstocks, deploy lower-cost processes, and increase premium product sales, particularly targeting growth markets. Our strategic and disciplined investment approach delivers superior returns throughout the business cycle and across a variety of market conditions.
| Our major projects in Singapore, the United States, and Saudi Arabia are all based on the proven combination of advantaged feedstocks, lower-cost processes, and premium products. These projects leverage proprietary technologies to efficiently serve expanding markets and deliver profitable growth.
SINGAPORE
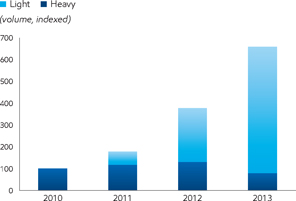
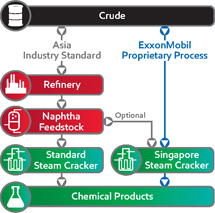
Our recent Singapore expansion illustrates how we identify and approach new capital investments. The project doubled our steam-cracking capacity at the site and significantly increased capacity for premium and specialty products to serve the rapidly growing markets in Asia and beyond.
Enabled by dozens of new proprietary technologies, the world-scale steam cracker can process an unprecedented range of feedstocks, from light gases to heavy liquids, including crude oil. Converting crude oil directly into chemicals provides a cost advantage over naphtha feedstock, the industry standard in Asia. This technology also saves energy and reduces emissions by eliminating the refining steps required to produce naphtha. This crude-cracking approach is an industry first. It is also another step in our ongoing search for advantaged chemical feedstock and demonstrates our ability to innovate and extend our competitive advantage. |
An industry-standard steam cracker in Asia receives naphtha feedstock from a refinery. Our Singapore expansion steam cracker is able to process crude directly, bypassing the refinery steps. |
Crude cracking produces a wider range of valuable by-products that can be further upgraded to additional specialty products, making this a platform for growth. We are developing plans for additional specialty product lines, including halobutyl rubber to supply the growing tire market, as well as premium resins for adhesive applications. These facilities are planned to start up in 2017.
UNITED STATES
As the largest U.S. chemical manufacturer and natural gas producer, we are progressing a unique project that builds on our proven integration model. In addition to capitalizing on the abundance of low-cost ethane feedstock, it will be enhanced by advantages in integration, scale, and premium products.
The project includes a new world-scale ethane cracker at our site in Baytown, Texas, already the country’s largest integrated refining and chemical manufacturing site. Feedstock and energy supplies will be coordinated with ExxonMobil’s Upstream business. Two world-scale polyethylene lines, the largest in industry, will be added at the nearby Mont Belvieu Plastics Plant to produce a mixed slate of polyolefin products, including metallocene polyethylene.

|
Based on sustainability and performance advantages, metallocene polyethylene demand grows faster than commodity polyethylene and commands a market premium. As the world’s largest producer of metallocene polyethylene, with manufacturing locations in all major regions, we will leverage our existing global supply chain and market-facing resources to further penetrate growth markets around the world.
Based on our competitive advantages, we believe the Baytown expansion project, with start-up planned for 2017, is well positioned to outperform other announced projects in North America.
Enable and Exceed metallocene polyethylene resins provide stronger, lighter, and lower-cost packaging solutions with reduced environmental impact. |
|
| ||
SAUDI ARABIA
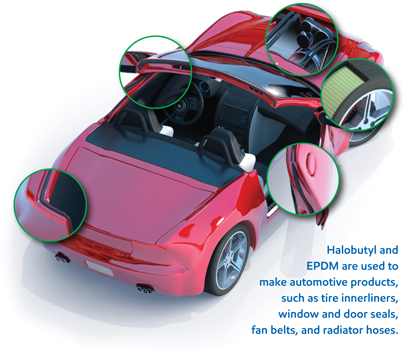
In Saudi Arabia, we are working with our joint venture partner, Saudi Basic Industries Corporation, to build a world-scale specialty elastomers facility. This will produce a broad range of synthetic rubber and related products to help meet the growing demand for rubber-based automotive products created by the significant expansion of road networks and vehicle ownership in the Middle East and Asia. We are integrating proprietary ExxonMobil technologies for premium halobutyl and ethylene propylene diene monomer (EPDM) rubbers into our existing operations at Jubail Industrial City with start-up planned for 2015.
These ExxonMobil processes enable lower-cost production versus competition. For example, our halobutyl technology saves energy and capital investment per tonne of capacity through our proprietary configuration and equipment design. Similarly, our metallocene EPDM technology utilizes fewer process steps and consumes less energy, while
significantly reducing emissions.
This project builds on our world-scale commodity assets at the site, which
are based on low-cost feedstocks, to provide specialty products needed
to develop the automotive industry in Saudi Arabia and beyond.
DELIVERING SUPERIOR FINANCIAL PERFORMANCE
Our investments are guided by rigorous analysis of growth
opportunities that leverage integration and capture advantages
in feedstock, lower-cost processes, and premium products,
where we can bring benefits to our customers while
generating industry-leading returns for our shareholders.
The success of this approach is evidenced by our ability
to deliver superior returns on capital employed relative
to competitors throughout the business cycle.
Our recently completed investments, combined with
those under development, will continue to support our
industry-leading position.
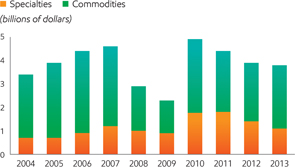
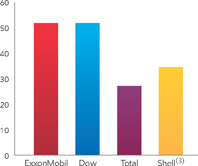
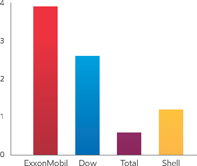
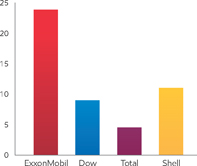
| Chemical: Industry-Leading Returns(1) (10-year average, 2004–2013)
|
||||
| Revenue
|
Earnings
|
ROCE (2)
| ||
| (billions of dollars) | (billions of dollars) | (percent) | ||
|
|
| ||
(1) Competitor values are estimated on a consistent basis with ExxonMobil and are based on public information. Chemical segments only: Royal Dutch Shell and Total (Total data only available through 2011). Dow Chemical shown on a corporate total basis.
(2) See Frequently Used Terms on pages 90 through 93.
(3) Royal Dutch Shell revenue data only available through 2012.
|
| ||
|
| ||

|
EXXONMOBIL 2013 FINANCIAL & OPERATING REVIEW | |
|
Upstream
| ||||||||||||||||
| The disciplined execution of ExxonMobil’s Upstream strategies, underpinned by a relentless focus on operational excellence, drives delivery of our competitive advantages and superior results.
RESULTS & HIGHLIGHTS
• Strong safety and environmental performance
• Industry-leading earnings of $26.8 billion
• Proved oil and natural gas reserve additions of 1.6 billion oil-equivalent barrels, replacing more than 100 percent of production for the 20th consecutive year
|
STRATEGIES
• Apply effective risk management, safety,
• Identify and
selectively capture the
• Exercise a disciplined approach to investing
• Develop and apply high-impact technologies
• Maximize profitability of existing oil and gas
• Capitalize on
growing natural gas and power
| |||||||||||||||
| • Added 6.6 billion oil-equivalent barrels of new
resource, increasing the overall resource base to
• Exploration discoveries totaling 1.5 billion oil-equivalent barrels in several
countries, including
• Six major project start-ups including the 110-thousand-barrel-per-day Kearl Initial
Development
• Advanced construction and began commissioning activities at the Papua New Guinea
Liquefied
• Signed expansion of the 2011 Strategic Cooperation Agreement with Rosneft to include seven
• Advanced preparation to drill first Kara Sea exploration well in 2014
• Progressed three North America liquefied natural gas opportunities in Alaska,
Western Canada,
| ||||||||||||||||
|
UPSTREAM STATISTICAL RECAP
|
2013
|
2012
|
2011
|
2010
|
2009
|
| ||||||||||
| Earnings (millions of dollars) |
26,841 | 29,895 | 34,439 | 24,097 | 17,107 | |||||||||||
| Liquids production (net, thousands of barrels per day) |
2,202 | 2,185 | 2,312 | 2,422 | 2,387 | |||||||||||
| Natural gas production available for sale |
11,836 | 12,322 | 13,162 | 12,148 | 9,273 | |||||||||||
| Oil-equivalent production(1) (net, thousands of barrels per day) |
4,175 | 4,239 | 4,506 | 4,447 | 3,932 | |||||||||||
| Proved reserves replacement ratio(2)(3) (percent) |
106 | 124 | 116 | 211 | 100 | |||||||||||
| Resource additions(2) (millions of oil-equivalent barrels) |
6,595 | 4,012 | 4,086 | 14,580 | 2,860 | |||||||||||
| Average capital employed(2) (millions of dollars) |
152,969 | 139,442 | 129,807 | 103,287 | 73,201 | |||||||||||
| Return on average capital employed(2) (percent) |
17.5 | 21.4 | 26.5 | 23.3 | 23.4 | |||||||||||
| Capital and exploration expenditures(2) (millions of dollars) |
38,231 | 36,084 | 33,091 | 27,319 | 20,704 | |||||||||||
|
(1) Natural gas converted to oil-equivalent at 6 million cubic feet per 1 thousand barrels. (2) See Frequently Used Terms on pages 90 through 93. (3) Proved reserves exclude asset sales. Includes non-consolidated interests and Canadian oil sands. Note: Unless otherwise stated, production rates, project capacities, and acreage values referred to on pages 16 through 47 are gross.
| ||||||||||||||||
|
| ||
BUSINESS OVERVIEW
Oil and natural gas are expected to continue to play a leading role in meeting the world’s growing demand for energy. In fact, oil and natural gas are projected to be the world’s top two energy sources accounting for approximately 60 percent of global demand by 2040, up slightly from today.
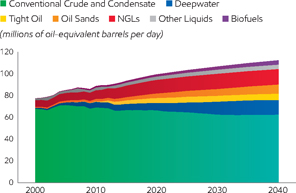
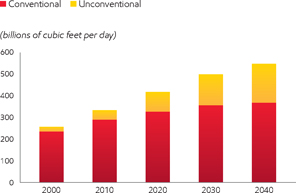
Demand for oil and other liquid fuels is forecast to increase by about 25 percent from 2010 to 2040. Meeting this demand will require replacing normal conventional resource decline while also increasing production from deepwater, tight oil, oil sands, and natural gas liquids. Global demand for natural gas is likely to increase by about 65 percent by 2040. About 65 percent of the growth in natural gas supplies through 2040 is expected to be from unconventional sources, which will account for one-third of global production by 2040. Meanwhile, liquefied natural gas (LNG) volume is expected to triple by 2040, contributing approximately 15 percent of global gas supply. Meeting the world’s growing demand for energy presents a tremendous challenge that will require a long-term view, significant investment, and continuing innovation to develop conventional and unconventional resources.
ExxonMobil is well positioned to meet this challenge while delivering sustained, long-term value for our shareholders through the disciplined execution of our Upstream strategies across exploration, development, production, natural gas and power marketing, and research activities. We begin by identifying and selectively capturing the highest-quality resources, testing for technical and commercial quality as well as materiality. We then apply a disciplined approach to investing and cost management. Proven project management systems incorporate best practices developed from our extensive worldwide experience to rigorously manage our global project portfolio from initial discovery to start-up.
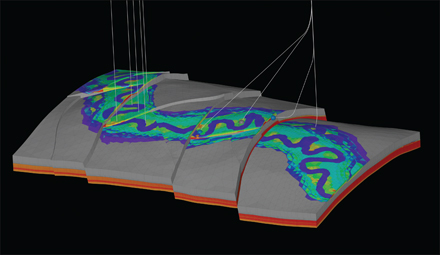
We have a steadfast commitment to develop and apply high-impact technologies in areas such as subsurface imaging, reservoir modeling, and well completions. This enhances our ability to find, efficiently develop, and produce new resources from some of the most challenging reservoirs. These technologies also enable us to improve the economic performance of our existing assets.
We apply robust operating and risk management systems to maximize the profitability of our existing oil and gas production. Over the last five years, our operated-facility downtime has been close to 25-percent better than fields operated by others in which we hold an interest, which equates to approximately 39 thousand net oil-equivalent barrels per day.
With our detailed knowledge of global energy markets, we are also able to capitalize on growing natural gas and power markets. In 2013, we sold more than 14 billion net cubic feet per day of gas across 35 countries including participating in LNG operations that delivered more than 62 million tonnes to global markets. Our industry leadership in the application of cogeneration technology enables the capture of additional value by increasing efficiency and reducing emissions.
Our Upstream strategies, supported by a relentless focus on effective risk management, safety, and operational excellence, are designed to deliver superior results through the long term.
| Global Liquids Supply by Type | Global Natural Gas Production by Type | |
|
| |
| Source: ExxonMobil, 2014 The Outlook for Energy: A View to 2040 | Source: ExxonMobil, 2014 The Outlook for Energy: A View to 2040 | |
|
|
EXXONMOBIL 2013 FINANCIAL & OPERATING REVIEW | |
Opportunity Capture
Integration of technical expertise, extensive global databases, and industry-leading research capabilities enables ExxonMobil to identify and selectively capture the highest-quality resources across all resource types and environments. The depth and breadth of our worldwide experience as explorers, developers, producers, and technology innovators position us favorably as a partner of choice for resource owners and other organizations.
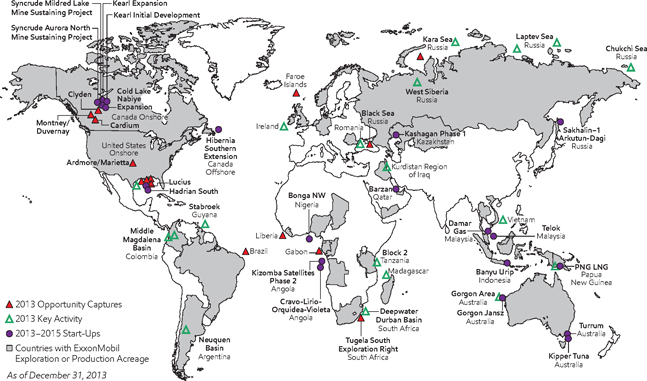
2013 OPPORTUNITY CAPTURES
In 2013, we captured 15 new opportunities spanning conventional and unconventional plays to build on our industry-leading resource base. At year-end 2013, our exploration acreage totaled more than 61 million net acres in 32 countries. Some of the new acreage positions that were established are in Russia, Brazil, Gabon, Liberia, South Africa, and the Faroe Islands.
Brazil • We participated in the Brazil Tender Round 11 in 2013 and successfully acquired two blocks in the Potiguar and Ceara basins for a combined 190,000 net acres. ExxonMobil will operate these blocks.
Canada • In February 2013, we completed the acquisition of Celtic Exploration Ltd., expanding our presence in Western Canada through the addition of roughly 545,000 net acres in the liquids-rich Montney Shale and 104,000 net acres in the Duvernay Shale unconventional plays. In addition, ExxonMobil acquired an interest in the in situ Steam-Assisted Gravity Drainage Clyden oil sands lease adding 226,000 net acres of high-quality oil resource.
Faroe Islands • ExxonMobil expanded its position in 2013 and acquired a 26-percent interest in license L016 in the Faroe Islands, covering 249,000 net acres.
Gabon • ExxonMobil entered Gabon by acquiring a 30-percent stake in the deepwater Arouwe Block encompassing 327,000 net acres.
Liberia • ExxonMobil entered Liberia by acquiring an 83-percent interest in Liberia Block 13, adding approximately 520,000 net acres in a deepwater play.
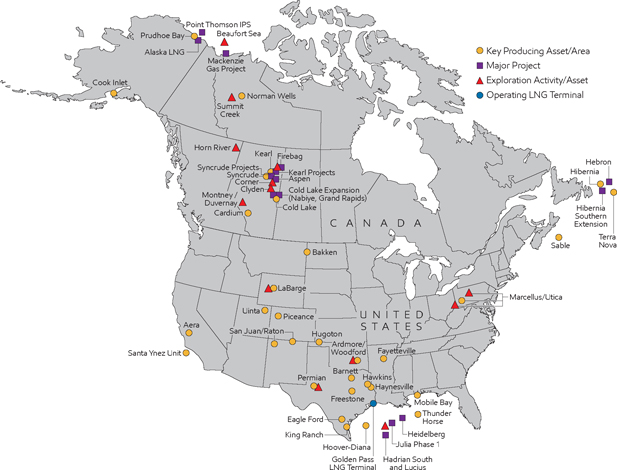
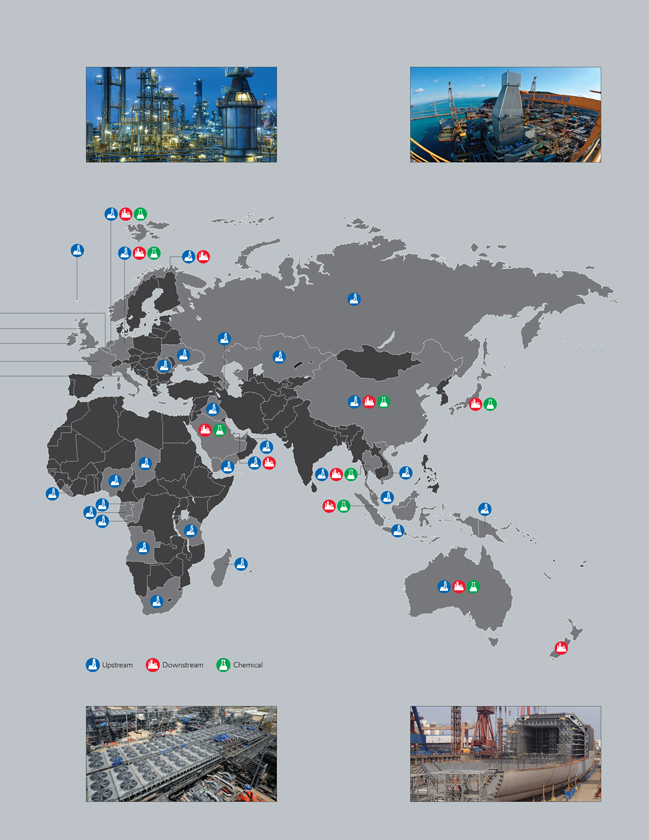
GLOBAL UPSTREAM PORTFOLIO
|
| ||
| Russia • ExxonMobil is working with Rosneft on the exploration potential in the Kara Sea (10.35 million net acres) and the Black Sea Tuapinskiy (990,000 net acres), as part of the original Strategic Cooperation Agreement (SCA). Additionally, agreements were signed to increase the scope of the SCA, including seven new blocks in the Russian Arctic.
South Africa • ExxonMobil acquired a 75-percent interest and 2.1 million net acres in the Tugela South deepwater block offshore South Africa, representing another new country entry in 2013.
U.S. Offshore • We expanded our position in the Gulf of Mexico by a combined 75,000 net acres. We were awarded 11 Offshore Continental Shelf (OCS) blocks in Sale 229 and Sale 227 and concluded a six-block farm-in agreement.
U.S. Onshore • In April, we acquired 12,000 net acres of additional Woodford Shale acreage in southern Oklahoma, bringing our total acreage position to more than 270,000 net acres in the liquids-rich Ardmore/Marietta area. |
|
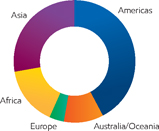
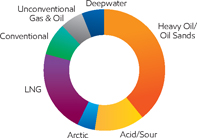
RESOURCES
In 2013, we continued to build our diverse global portfolio of resources and reserves by adding 6.6 billion oil-equivalent barrels. After adjusting for production, asset sales, and revisions to existing fields, the resource base totals more than 90 billion oil-equivalent barrels. Proved reserves comprise approximately 28 percent of the resource base, or 25.2 billion oil-equivalent barrels.
The addition of an average of 4.8 billion oil-equivalent barrels to our resource base per year over the last decade demonstrates the success of our global strategy to identify, evaluate, pursue, and capture high-quality opportunities. Today, ExxonMobil holds the largest global resource base among international oil companies. The size and diversity of our resource base afford further advantage by supporting global risk management and offering unequaled investment flexibility.
We continue to increase and expand the quality of our resources through successful exploration drilling, capture of undeveloped resources, strategic acquisitions, and increased recovery from existing fields. In 2013, resources were added in Argentina, Australia, Canada, Nigeria, Norway, Tanzania, the United Arab Emirates, and the United States.
Our exploration drilling program added 1.5 billion oil-equivalent barrels in 2013, with additions from multiple resource types around the world. Additions from exploration drilling averaged approximately 2 billion oil-equivalent barrels per year over the last decade.
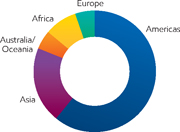
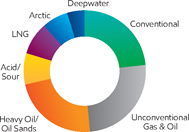
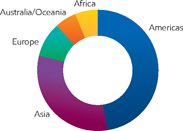
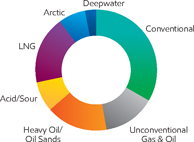
| Resource Additions/Acquisitions(1) | Resource Base Distribution(1) | Resource Base Distribution(1) | ||
| By Resource Type | By Region | By Resource Type | ||
| (percent, oil-equivalent barrels added) | (percent, oil-equivalent barrels) | (percent, oil-equivalent barrels) | ||
|
|
| ||
(1) See Frequently Used Terms on pages 90 through 93.
|
|
EXXONMOBIL 2013 FINANCIAL & OPERATING REVIEW | |
Opportunity Capture, continued
|
Our resource base is assessed annually to include new
The largest components of ExxonMobil’s resource base |
RESOURCE BASE CHANGES (1) | |||||||||
| (billions of oil-equivalent barrels) | 2013 | 5-Year Average |
||||||||
| Resource additions/acquisitions |
6.6 | 6.4 | ||||||||
| Revisions to existing fields |
(0.2 | ) | (0.6 | ) | ||||||
| Production |
(1.6 | ) | (1.6 | ) | ||||||
| Sales |
(1.2 | ) | (0.6 | ) | ||||||
|
|
||||||||||
| Net change versus year-end 2012 |
3.6 | 3.6 | ||||||||
|
Proved Reserves Replacement Ratio(1)(2)
(percent of annual production replaced with proved reserves additions)
|
| |||||||||
PROVED RESERVES
ExxonMobil’s resource base includes 25.2 billion oil-equivalent barrels of proved oil and gas reserves, equating to 16 years of reserves life at current production rates. These reserves represent a diverse global portfolio distributed across all geographic regions and resource types, with a higher proportion of liquids.
In 2013, we replaced 103 percent of the reserves we produced, including the impact of asset sales. We added 1.6 billion oil-equivalent barrels to proved reserves (76 percent liquids) while producing 1.6 billion oil-equivalent barrels. Excluding asset sales, our proved reserves replacement ratio was 106 percent. Key proved reserve additions resulted from the funding of the Abu Dhabi Upper Zakum 750 project and the associated license extension, and North America unconventional activities.
ExxonMobil added 10.3 billion oil-equivalent barrels to proved reserves over the last five years, more than replacing production over that time period. The development of new fields and extensions of existing fields have resulted in the addition of an average of 1.1 billion oil-equivalent barrels per year to proved reserves.
Revisions to proved reserves have averaged about 0.4 billion oil-equivalent barrels per year over the last five years, driven by effective reservoir management and the application of new technologies. We have more than replaced our production for 20 consecutive years. Proved reserve estimates are managed by a team of experienced reserve experts and are the result of a rigorous and structured management review process.
| Proved Reserves Distribution(1) |
Proved Reserves Distribution(1) | Proved Reserves Distribution(1) | ||
| By Region | By Resource Type | By Hydrocarbon Type | ||
| (percent, oil-equivalent barrels) | (percent, oil-equivalent barrels) | (percent, oil-equivalent barrels) | ||
|
|
| ||
(1) See Frequently Used Terms on pages 90 through 93.
(2) Includes asset sales.
|
| ||
Global Upstream Portfolio
Our disciplined investment approach combines systematic project assessment with technical and commercial expertise. We advance opportunities that will provide the most attractive returns across a broad range of potential market conditions, while maintaining a focus on the efficient use of capital. We apply this approach across the asset life cycle from initial resource capture and project execution through production operations. Our primary focus is to deliver superior investment returns over the long term.
| PRODUCTION VOLUMES
Net liquids production was up 17 thousand barrels per day versus 2012 as start-up of the Kearl Initial Development project, ramp-up of recent West Africa projects, increasing U.S. unconventional liquids production, and improved uptime performance more than offset field decline. Net natural gas production was down 4 percent as expected lower U.S. production and field decline were partially offset by lower facility downtime, higher weather-related demand, and project start-ups. Net oil-equivalent production of 4.2 million barrels per day decreased 1.5 percent versus 2012 consistent with our projections.
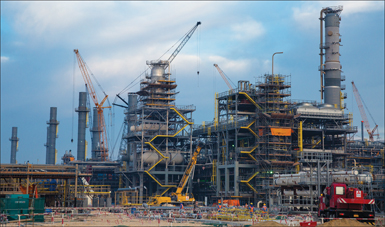
Near-term activity will focus on starting up 14 projects in 2014 and 2015, highlighted by the Papua New Guinea Liquefied Natural Gas, Sakhalin-1 Arkutun-Dagi, Banyu Urip, and Kearl Expansion projects. We will continue to develop our significant, liquids-rich North American unconventional resources. We will also continue to pursue attractive opportunities to increase volumes from existing assets through new drill wells, workovers of existing wells, and secondary and tertiary recovery programs. |
FOCUS ON PROFITABILITY
We have focused efforts to improve long-term unit profitability and have made strategic choices to meet this objective. We have a portfolio of production volumes across a range of profitability. We first maximize the production of our high-profit volumes by running our facilities at the highest uptime possible. Application of technologies to reduce costs and improve recovery is another key enabler to producing high-profit volumes. In some instances, improved fiscal or contractual terms are needed to improve profitability. In these cases, we engage the resource owners to develop mutually beneficial solutions, as we have done with the Upper Zakum concession in the United Arab Emirates. Another example of improving long-term profitability is our decision to continue shifting capital from dry gas to liquids-rich plays in North America, which reduces total oil-equivalent production but improves the profitability mix as we increase the production of higher-margin liquids.
|
Excluding the impact of the United Arab Emirates onshore concession expiry and the Iraq West Qurna I partial divestment, liquids production is anticipated to grow by 2 percent in 2014 and by 4 percent per year on average from 2015 through 2017. Natural gas production is anticipated to decline by 2 percent in 2014 and to grow by 1 percent per year on average from 2015 through 2017.
|
The forward-looking projections of production volumes in this document reflect our best assumptions regarding technical, commercial, and regulatory aspects of existing operations and new projects. Factors that could impact actual volumes include project start-up timing, regulatory changes, quotas, changes in market conditions, asset sales, and entitlement volume effects under certain production sharing contracts and royalty agreements.
The production we are bringing online from our major projects and other activities positions us to achieve profitable growth as our liquids and liquids-linked gas volumes as a percentage of total volumes are projected to increase to nearly 70 percent in 2017. |
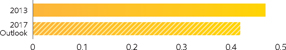
Production Outlook(1)
(millions of oil-equivalent barrels per day, net)
|
| Total (millions of oil-equivalent barrels per day, net) |
4.0 | (1) | 4.0 | 4.1 | 4.2 | 4.3 | ||||||||||||||
(1) 2013 production excludes the impact of United Arab Emirates onshore concession expiry and Iraq West Qurna I partial divestment. Production based on 2013 average price ($109 Brent).
|
|
EXXONMOBIL 2013 FINANCIAL & OPERATING REVIEW | |
Global Upstream Portfolio, continued
| 2013 MAJOR DEVELOPMENT PROJECTS
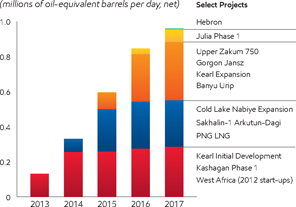
ExxonMobil participated in six major start-ups in 2013 and we plan to bring 21 more major projects online by 2017. These projects, along with our 2012 start-ups, are expected to deliver 1 million net oil-equivalent barrels per day to our production volumes by 2017.
Kearl Initial Development • (Combined ExxonMobil and Imperial Oil interest, 100 percent) Kearl Initial Development started up in April 2013. It is anticipated to produce 110 thousand barrels of bitumen per day and employs a number of technology innovations, including a proprietary froth treatment process that eliminates the need to build an upgrader. Ongoing expansion and planned future debottlenecking have the potential to increase production up to 345 thousand barrels per day.
Kashagan Phase 1 • (ExxonMobil interest, 17 percent) Phase 1 of the Kashagan Development started up in September 2013 and reached a maximum gross production level of approximately 80 thousand barrels per day. Following a brief period of production, the field was shut-in due to a leak in the main gas pipeline. Work is progressing on the repair options and production reinstatement. |
Major Project Production Outlook Production by Start-Up Year(1)
(1) Excludes impact of future divestments and OPEC quota effect. Production based on 2013 average price ($109 Brent). |
Syncrude Aurora North Mine Sustaining Project • (Imperial Oil interest, 25 percent) Aurora North oil sands ore processing plant relocations and tailings management facility start-ups were completed in October 2013. These projects enable sustained production rates of approximately 215 thousand barrels of bitumen per day.
Telok • (ExxonMobil interest, 50 percent) Located offshore Malaysia, Telok first gas was achieved in March 2013 ahead of plan. Eight wells have been successfully drilled, and seven completions tied in and flowing full well stream gas to the host platform Guntong E at an estimated combined rate of 275 million cubic feet per day.
| Kipper Tuna and Turrum • (ExxonMobil interest, Tuna and Turrum 50 percent; Kipper 32.5 percent) The Kipper Tuna and Turrum projects started up in 2013 with initial production from the Tuna and Turrum fields. Located in the Gippsland Basin in Australia, the projects include a new offshore platform and subsea tieback. Peak production will be achieved following the completion of development drilling at Turrum and start-up of onshore gas conditioning facilities. | PROJECT EXECUTION PERFORMANCE – EXXONMOBIL PROJECTS |
|||||||||
| (percent of plan, 2009-2013 average) | Cost | Schedule | ||||||||
| ExxonMobil Operated |
102 | 106 | ||||||||
| Operated by Others
|
|
133
|
|
|
139
|
| ||||
|
|
||||||||||
| Upstream Projects |
Upstream Projects | Upstream Projects | ||
| By Geographic Region | By Resource Type | By Hydrocarbon Type | ||
| (percent, number of projects) | (percent, oil-equivalent barrels) | (percent, oil-equivalent barrels) | ||
|
|
| ||
|
| ||
| MAJOR PROJECT START-UPS(1) | ||||||||||||||||||||||||||||||||||||||
| Facility Capacity (Gross) |
ExxonMobil | Facility Capacity (Gross) |
ExxonMobil | |||||||||||||||||||||||||||||||||||
| Liquids (KBD) |
Gas (MCFD) |
Working Interest (%) |
Liquids (KBD) |
Gas (MCFD) |
Working Interest (%) | |||||||||||||||||||||||||||||||||
| 2012-2013 (Actual) |
|
2017+ (Projected) | ||||||||||||||||||||||||||||||||||||
| Angola |
Kizomba Satellites Phase 1 | 100 | – | 40 | n | Angola | AB32 Kaombo Split Hub | 250 | – | 15 | l | |||||||||||||||||||||||||||
| Australia |
Kipper Tuna | 15 | 175 | 40 | n | Australia | Gorgon Area Expansion | 10 | 915 | 25 | l | |||||||||||||||||||||||||||
| Turrum | 20 | 200 | 50 | n | Scarborough | – | 1,030 | 50 | n | |||||||||||||||||||||||||||||
| Canada |
Kearl Initial Development | 110 | – | 100 | n | Canada | Aspen | 90 | – | 100 | n | |||||||||||||||||||||||||||
|
Syncrude Aurora North Mine |
215 | – | 25 | p | Cold Lake Grand Rapids | 40 | – | 100 | n | |||||||||||||||||||||||||||||
| Sustaining Project | ||||||||||||||||||||||||||||||||||||||
|
Kazakhstan |
Kashagan Phase 1 |
|
370 |
|
|
450 |
|
|
17 |
|
l |
Firebag | 380 | – | 70 | n | ||||||||||||||||||||||
|
Malaysia |
Telok |
|
– |
|
|
430 |
|
|
50 |
|
n |
Hebron | 150 | – | 36 | n | ||||||||||||||||||||||
|
Nigeria |
Satellite Field Development |
|
70 |
|
|
– |
|
|
40 |
|
n |
Kearl Debottleneck | 125 | – | 100 | n | ||||||||||||||||||||||
| Phase 1 | Mackenzie Gas Project | 10 | 830 | 56 | n | |||||||||||||||||||||||||||||||||
|
Usan
|
|
180 |
|
|
– |
|
|
30 |
|
l |
Syncrude Aurora South | 210 | – | 25 | p | |||||||||||||||||||||||
|
2014-2016 (Projected) |
Phases 1 and 2 | |||||||||||||||||||||||||||||||||||||
| Angola
|
Cravo-Lirio-Orquidea-Violeta (CLOV) |
160 | – | 20 | l | Syncrude Mildred Lake Extension |
210 | – | 25 | p | ||||||||||||||||||||||||||||
|
Indonesia |
Cepu Gas |
5 | 220 | 41 | p | |||||||||||||||||||||||||||||||||
| Kizomba Satellites Phase 2 | 85 | – | 40 | n |
Natuna |
– | 1,100 | ** | n | |||||||||||||||||||||||||||||
|
Australia |
Gorgon Jansz |
|
20 |
|
|
2,765 |
|
|
25 |
|
l |
Iraq |
West Qurna I |
1,600 | – | 25 | p | |||||||||||||||||||||
| Canada |
Cold Lake Nabiye Expansion | 50 | – | 100 | n | Kazakhstan | Aktote | 50 | 850 | 17 | l | |||||||||||||||||||||||||||
| Hibernia Southern Extension | 55 | – | 27 | n | Kashagan Future Phases | 1,260 | – | 17 | l | |||||||||||||||||||||||||||||
| Kearl Expansion | 110 | – | 100 |
n |
Tengiz Expansion | 260 | – | 25 | l | |||||||||||||||||||||||||||||
|
Syncrude Mildred Lake Mine Sustaining Project |
180 | – | 25 | p | Tengiz Sustaining Project | 395 | – | 25 | l | |||||||||||||||||||||||||||||
|
Indonesia |
Banyu Urip |
165 | 15 | 45 | n |
Nigeria |
Bonga North |
100 | 60 | 20 | l | |||||||||||||||||||||||||||
| Malaysia |
Damar Gas | 5 | 200 | 50 | n | Bonga Southwest | 225 | 15 | 16 | l | ||||||||||||||||||||||||||||
| Nigeria |
Erha North Phase 2 | 60 | – | 56 | n | Bosi | 140 | 260 | 56 | n | ||||||||||||||||||||||||||||
|
Norway
|
Aasgard Subsea Compression
|
|
40
|
|
|
415
|
|
|
14
|
|
l |
Satellite Field Development Phase 2 |
80 | – | 40 | n | ||||||||||||||||||||||
| Papua |
PNG LNG | 30 | 1,000 | 33 | n | Uge | 110 | 20 | 20 | n | ||||||||||||||||||||||||||||
| New Guinea |
||||||||||||||||||||||||||||||||||||||
|
Qatar |
Barzan |
90 | 1,400 | 7 | p |
Usan Future Phases |
50 | – | 30 | n | ||||||||||||||||||||||||||||
| Russia |
Sakhalin-1 Arkutun-Dagi | 90 | – | 30 | n | Romania | Domino | – | 630 | 50 | n | |||||||||||||||||||||||||||
| U.S. |
Hadrian South | 5 | 300 | 47 | n | Russia | Sakhalin-1 Future Phases | – | 800 | 30 | n | |||||||||||||||||||||||||||
| Heidelberg | 80 | 80 | 9 | l | Sakhalin-1 Odoptu Stage 2 | 55 | – | 30 | n | |||||||||||||||||||||||||||||
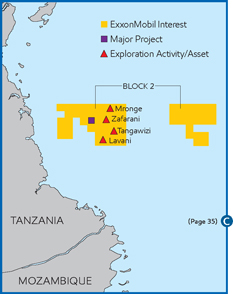
| Julia Phase 1 | 30 | – | 50 | n | Tanzania | Tanzania Block 2 | – | 1,000 | 35 | l | ||||||||||||||||||||||||||||
| Lucius | 100 | 150 | 15 | l |
United Arab Emirates |
Upper Zakum 750 | 750 | – | 28 | p | ||||||||||||||||||||||||||||
| Point Thomson Initial Production System
|
10 | 200 | 37 | n | U.S. | Alaska LNG | 60 | 3,500 | 36 | l | ||||||||||||||||||||||||||||
| KBD = Thousand barrels per day MCFD = Million cubic feet per day
| ||||||||||||||||||||||||||||||||||||||
|
n ExxonMobil Operated l Co-Venturer Operated D Joint Operations ** Pending Final Agreements | ||||||||||||||||||||||
| (1) | The term “project” as used in this publication can refer to a variety of different activities and does not necessarily have the same meaning as in any government payment transparency reports. |
|
|
EXXONMOBIL 2013 FINANCIAL & OPERATING REVIEW | |
Worldwide Upstream Operations
| ExxonMobil has an interest in exploration
and
THE AMERICAS
Our Americas portfolio includes conventional onshore
fields, |
AMERICAS HIGHLIGHTS | 2013 | 2012 | 2011 | ||||||||||
| Earnings (billions of dollars) |
5.6 | 5.5 | 7.8 | |||||||||||
| Proved Reserves (BOEB) |
12.0 | 11.8 | 10.8 | |||||||||||
| Acreage (gross acres, million) |
46.2 | 47.0 | 50.2 | |||||||||||
| Net Liquids Production (MBD) |
0.7 | 0.7 | 0.7 | |||||||||||
| Net Gas Available for Sale (BCFD) |
3.9 | 4.2 | 4.3 | |||||||||||
|
|
||||||||||||||
|
Americas Production
(millions of oil-equivalent barrels per day, net)
|
| |||||||||||||
|
| ||
UNITED STATES
ExxonMobil is a leading reserves holder and producer of oil and natural gas in the United States. We maintain a significant position in all major producing regions, including offshore
Gulf of Mexico, the
Gulf Coast, the
Rockies, the
mid-continent,
California, Alaska,
and
Appalachia.
Our U.S.
portfolio includes
mature conventional assets,
emerging unconventional
developments, and new
deepwater developments. With a
focus on technological improvements,
operational efficiency, and high-quality
drilling programs, we are extending the
lives of our base producing fields, some
of which have been onstream for decades.
Our portfolio is further augmented by
activity in unconventional plays,
eight of which are estimated to
contain recoverable resources of
greater than 1 billion oil-equivalent
barrels. Future developments are
also planned from ExxonMobil’s
extensive deepwater Gulf
of Mexico acreage position.
Gulf of Mexico/Gulf Coast
2013 average net production in the Gulf of
Mexico was 43 thousand barrels of liquids
per day and 159 million cubic feet of gas.
Deepwater • In the deepwater
Gulf of Mexico, we operate the
Hoover platform that is located in more
than 4,800 feet of water and produces
oil and gas from the Hoover field and several
subsea tiebacks. In addition, we are a partner in six
deepwater fields, including the co-venturer-operated Thunder Horse field (ExxonMobil interest, 25 percent) where active drilling is ongoing.
Activity continues in the Keathley Canyon (KC) area. We are developing the Hadrian-5 discovery under a unitization agreement
as part of the Anadarko-operated Lucius development (ExxonMobil interest, 15 percent).
|
| ||
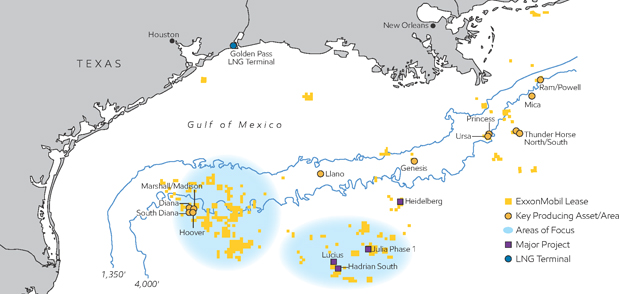
The Hadrian South project (ExxonMobil interest, 47 percent), which is situated in KC-963 and KC-964, is being developed as a subsea tieback to the Lucius platform. Start-up for both developments is planned for 2014.
ExxonMobil and its co-venturers continue to incorporate appraisal drilling results into concept selection for development of the Hadrian North oil discovery (ExxonMobil interest, 50 percent), which is situated on blocks KC-918 and KC-919.
The Julia Phase 1 project (ExxonMobil interest, 50 percent) in the Walker Ridge (WR) area was fully funded in 2013, as a subsea tieback to the Chevron-operated Jack-St. Malo host facility on WR-718. First oil production is planned for 2016.
ExxonMobil is also participating in the Anadarko-operated Heidelberg project (ExxonMobil interest, 9 percent), which was fully funded in 2013. The project develops resources located in a five-block unit in Green Canyon and is planned to start up in 2016.
We continue to expand and evaluate our substantial exploration portfolio of 1.5 million net acres in the deepwater Gulf of Mexico with investments in advanced seismic data to further enhance understanding of the subsurface. ExxonMobil was the high bidder on four Offshore Continental Shelf (OCS) blocks in Sale 229 and seven OCS blocks in Sale 227.
Conventional • The Mobile Bay development offshore Alabama contributed net production of 121 million cubic feet of gas per day during 2013. We continue to realize the cost efficiency and environmental benefits associated with the consolidation of our sour gas plants in late 2010.
| LNG • Golden Pass Products, LLC, a partnership of ExxonMobil and Qatar Petroleum International, progressed federal permitting to add up to 15.6 million tonnes per annum of proposed export capacity to the existing Golden Pass LNG terminal, a liquefied natural gas (LNG) import terminal at Sabine Pass, Texas. This project affords this world-class LNG terminal the opportunity to import or export natural gas in response to market conditions. The project received approval to export to countries with Free Trade Agreements (FTA) with the United States in 2012 and is awaiting approval to export to non-FTA countries. In 2013, the Federal Energy Regulatory Commission (FERC) Pre-Filing Environmental Review Process was initiated. |
| |
|
The Golden Pass LNG terminal in Sabine Pass, Texas, progressed federal permitting to add up to 15.6 million tonnes per annum of proposed LNG export capacity. |
|
|
EXXONMOBIL 2013 FINANCIAL & OPERATING REVIEW | |
Worldwide Upstream Operations, continued
U.S. Onshore Texas and Louisiana
ExxonMobil is a leading producer in Louisiana and Texas with a strong position in multiple unconventional gas plays and the Permian Basin. In 2013, onshore net production in Texas and Louisiana averaged 102 thousand barrels of liquids per day and 1.8 billion cubic feet of gas per day.
Conventional • ExxonMobil is a leading leaseholder and producer in the Permian Basin. After ramping up activity to eight drilling rigs in 2013, we completed more than 130 wells across multiple fields, primarily Russell, Goldsmith, Fullerton, Cornell, and Mahoney. More than 65 workover rigs are also active in the Permian, increasing production by opening up additional zones with fracture stimulation treatments, most significantly in the Fullerton and Robertson areas. We are also optimizing development and expanding infrastructure in our carbon dioxide projects in the Central Basin Platform area and in East Texas, and continue to evaluate the results of the Means Residual Oil Zone project that started up in late 2011.
Unconventional • ExxonMobil holds 224,000 net acres in the Haynesville/Bossier Shale of East Texas and Louisiana, where we continued to realize the benefits of our drilling and completion improvements. We also continued well spacing tests in both the Haynesville and overlying Bossier Shale reservoir with encouraging early results.
In the Barnett Shale play in North Texas, we completed 95 wells in 2013 across our leasehold of 218,000 net acres, primarily focusing on the liquids-rich gas areas. In the Freestone tight gas trend, ExxonMobil holds 319,000 net acres. We brought 11 wells online in 2013 and completed upgrades to both sweet and sour gas infrastructure in the Beargrass area to handle high-volume horizontal completions.
In the Permian, we continue to evaluate unconventional potential across our acreage, highlighted by the Wolfcamp, Wolfbone, Wolfberry, and Bone Springs reservoirs. In 2013, we completed nine Bone Springs wells that had average 30-day rates of approximately 600 oil-equivalent barrels per day.
Mid-Continent and Appalachia
ExxonMobil produces oil and gas throughout the mid-continent states, including Wyoming, Utah, North Dakota, Montana, Colorado, Kansas, Oklahoma, Arkansas, and New Mexico, as well as the Appalachian states of Pennsylvania and West Virginia. Average net production from these areas in 2013 was 88 thousand barrels of liquids per day and more than 1.5 billion cubic feet of gas per day.
Conventional • The LaBarge development (ExxonMobil interest, 100 percent) in Wyoming comprises the Madison, Tip Top, and Hogsback fields and the Shute Creek gas processing plant. It includes one of the world’s largest helium recovery and physical solvent gas sweetening plants. Implementation of a project to improve environmental performance of the Shute Creek plant’s compressor engines started up in early 2012, and record carbon dioxide sales of more than 340 million cubic feet per day were reached in late 2013. The LaBarge facilities processed an average of 629 million cubic feet of inlet gas per day in 2013.
ExxonMobil’s proprietary Controlled Freeze Zone (CFZ) technology underwent rigorous testing from 2012 to 2013 at the Shute Creek commercial demonstration plant. CFZ is a single-step cryogenic separation process with the potential to make carbon capture and storage more affordable and significantly reduce carbon dioxide and hydrogen sulfide content in the natural gas stream while meeting or exceeding product purity specifications. The testing also demonstrated the ability to reinject the acid gas product stream, a key differentiating attribute of this technology.
Unconventional • The Bakken Shale remained one of our most active unconventional programs in 2013 with well completions and production volumes reaching all-time highs. ExxonMobil currently holds 570,000 net acres of high-quality resource in this play. Through the deployment of 10 rigs and the acquisition of more than 190,000 acres from Denbury Resources, gross-operated production in the Bakken increased 81 percent from 2012 to 59 thousand barrels of oil per day in 2013.
The liquids-rich Woodford Shale in the Ardmore Basin of southern Oklahoma was another one of our active areas in 2013. We operated 12 rigs across our more than 270,000 net acres of leasehold and continue to successfully delineate the Woodford and Caney reservoirs across our core Ardmore and Marietta areas. We are also progressing infrastructure projects to optimize the liquids-rich production from this area.
In the Fayetteville Shale, pad drilling, optimized well spacing, and improved drilling processes are increasing efficiencies as development proceeds across our 490,000 net acres.
|
| ||
ExxonMobil holds a material acreage position in the Marcellus Shale of 589,000 acres across Pennsylvania and West Virginia and 84,000 acres in the promising Utica Shale in Ohio. We continue to be encouraged by early drilling results. In 2013, we commissioned and started up a 125-million-cubic-foot-per-day cryogenic gas plant in Butler County, which will increase our returns in the Marcellus area through the capture of additional natural gas liquids. In Utah, Colorado, and New Mexico, development of the more than 1 million net acres in the Uinta, Piceance, Raton, and San Juan has continued.
California
Net production from fields both onshore and offshore California averaged 91 thousand barrels of liquids per day and 23 million cubic feet of gas per day during 2013. The Santa Ynez Unit (SYU) development (ExxonMobil interest, 100 percent) consists of three platforms located 5 miles offshore Santa Barbara and a processing plant in Las Flores Canyon. We continue to successfully employ world-class extended-reach drilling from these platforms to increase recovery. In 2013, development drilling was resumed at the SYU Harmony drilling rig following several upgrades that resulted in a 70-percent increase in the rig’s reach capacity. Onshore California, we are progressing plans to commence further development drilling in 2014.
ExxonMobil also has a 48-percent equity share in Aera Energy LLC’s operations, comprising eight fields and about 11,000 wells that produce 61 thousand net oil-equivalent barrels per day of a mixture of heavy and conventional oil with associated natural gas.
Alaska
Average net production in Alaska was 106 thousand barrels of liquids per day in 2013. ExxonMobil is the largest holder of discovered natural gas resources on the North Slope of Alaska. The initial development phase of the Point Thomson project is progressing with site preparation and an air strip completed, permanent housing camp occupied, and large processing module fabrication in progress. Together with the State of Alaska and its co-venturers, ExxonMobil is continuing to progress the Alaska LNG project to commercialize Alaskan gas resources.
CANADA
ExxonMobil is one of the leading oil and gas producers in Canada through our wholly owned affiliate, ExxonMobil Canada, and majority-owned affiliate Imperial Oil (ExxonMobil interest, 69.6 percent). Through these entities, we have one of the largest resource positions in Canada and possess a significant portfolio of major projects, both onshore and offshore.
Offshore Canada Operations
The Hibernia field (ExxonMobil interest, 33 percent) offshore Newfoundland is operated by Hibernia Management and Development Company Ltd., utilizing ExxonMobil personnel and processes. Hibernia’s net production averaged 29 thousand barrels of oil per day in 2013. Progress continued on the Hibernia Southern Extension project (ExxonMobil interest, 27 percent), which consists of a subsea tieback to the existing Hibernia platform and will access recoverable resources of approximately 170 million gross oil-equivalent barrels. Subsea equipment installation was completed and subsea drilling commenced. Start-up is expected in 2014.
| The Hebron project (ExxonMobil interest, 36 percent) is an ExxonMobil-operated oil development located in 300 feet of water offshore Newfoundland. The planned gravity-based structure with topsides facilities and drill rig will have a gross capacity of 150 thousand barrels per day. In 2013, construction of the concrete gravity-based structure continued in Newfoundland, while fabrication of topsides modules in Newfoundland and Korea commenced. Start-up is expected in 2017.
The Hebron project, which will utilize a gravity-based structure (shown under construction), will have gross production capacity of 150 thousand barrels per day and will be located in 300 feet of water offshore Newfoundland. |
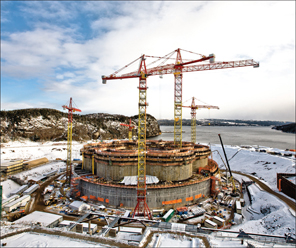
|
|
|
EXXONMOBIL 2013 FINANCIAL & OPERATING REVIEW | |
Worldwide Upstream Operations, continued
The co-venturer-operated Terra Nova development (ExxonMobil interest, 19 percent) produced 7 thousand net barrels of oil per day in 2013. Located in 300 feet of water, Terra Nova consists of a unique, harsh-environment-equipped floating production, storage, and offloading (FPSO) vessel.
The ExxonMobil-operated Sable Offshore Energy project (ExxonMobil interest, 51 percent; Imperial Oil interest, 9 percent) in Nova Scotia comprises five producing fields. Net production in 2013 averaged 53 million cubic feet of gas per day and 2 thousand barrels of associated natural gas liquids per day.
ExxonMobil and Imperial Oil continue to progress the assessment of blocks EL476 and EL477 (formerly EL446 and EL449) in the arctic Beaufort Sea, covering 500,000 net acres (combined ExxonMobil and Imperial Oil interest, 50 percent). In 2013, we continued interpretation of 3D seismic data and progressed plans for the first exploration well.
Onshore Canada Operations
In 2013, the Cold Lake heavy oil field in Alberta (Imperial Oil interest, 100 percent) achieved production of 127 thousand net barrels of oil per day. Cold Lake is the largest thermal in situ heavy oil project in the world. It has more than 4,200 wells directionally drilled from multiple satellite pads tied back to central facilities, which reduces surface land requirements. Cyclic steam stimulation is used to recover bitumen, and recovery is increased through the use of leading-edge thermal recovery technologies. Since the inception of the Cold Lake project, continuous improvements and advances in technology have allowed us to more than double the expected recovery from the initial commercial development area. The next expansion of the Cold Lake development is the Nabiye project, which was 65-percent complete at year end and will increase capacity by 50 thousand barrels of bitumen per day. Experimental pilots are currently under way to test solvent-based recovery technologies that would further enhance recovery and lower greenhouse gas emissions.
The Syncrude oil sands mining operation (Imperial Oil interest, 25 percent) produced synthetic crude averaging 65 thousand net barrels per day in 2013. We are progressing several projects to sustain production and continue to evaluate future developments including Mildred Lake Extension and Aurora South Phases 1 and 2.
The Kearl oil sands project (ExxonMobil and Imperial Oil interest, 100 percent) is developing a world-class resource in northern Alberta expected to exceed 4 billion barrels. Production of mined diluted bitumen from the first of three froth treatment trains began in April 2013. Two additional bitumen froth trains came online in sequence as planned, reaching total production from the initial development of 100 thousand barrels per day by year end. Fabrication and construction are well advanced on the expansion project, which is expected to produce an additional 110 thousand barrels of bitumen per day. Future debottlenecking of both the initial development and expansion project is expected to increase total production to 345 thousand barrels of bitumen per day.
In 2013, we also continued to evaluate oil sands acreage in the Athabasca region on both in situ and mining leases including Aspen, Corner, Grand Rapids, and Firebag. We acquired an additional 226,000 net acres of high-quality in situ oil sands in 2013. ExxonMobil is continually leveraging our extensive acreage position in Canada to maximize value through selective swaps, farm-ins, and divestments.
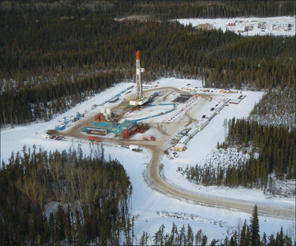
|
The Mackenzie Gas project received regulatory approvals from the Canadian government in 2011. Once sanctioned, the project will develop three fields containing approximately 6 trillion cubic feet of natural gas.
In the Horn River Basin in northeast British Columbia (combined ExxonMobil and Imperial Oil interest, 100 percent), we currently hold approximately 340,000 net acres and are one of the largest landholders in the basin. Evaluation of our acreage position has progressed with the ongoing production from a pilot project consisting of eight horizontal production wells and associated facilities. Production started in August 2012 from the 30-million-cubic-foot-per-day capacity facility.
Nabiye is the next expansion phase of the Cold Lake development. |
|
| ||
ExxonMobil began development of the 649,000 net acres in the Montney and Duvernay that were added in February 2013 through the acquisition of Celtic Exploration Ltd. Throughout the winter months of 2013, two new wells were completed in the Montney and Duvernay. By year-end 2013, four drilling rigs were active in this liquids-rich area with the potential to increase further.
Imperial Oil and ExxonMobil are in the early stages of project assessment and planning for a proposed LNG plant in Western Canada. Through the jointly owned affiliate WCC LNG Ltd., ExxonMobil and Imperial Oil received an export permit in 2013 from the National Energy Board to export up to 30 million tonnes of LNG per year for 25 years.
| SOUTH AMERICA
Argentina In Argentina, ExxonMobil holds a 51-percent interest in the Chihuidos concession. In June 2013, we sold our 23-percent working interest in the Aguarague concession to YPF. During 2013, we sold net daily gas production of 28 million cubic feet from these concessions into markets in Argentina. We also continued our exploration drilling and well-testing campaign in the highly-prospective Vaca Muerta shale formation in the Neuquen Basin where ExxonMobil holds more than 850,000 net acres. Drilling commenced on two ExxonMobil-operated wells with completion and testing activities ongoing on previously drilled wells. Drilling and testing results are being evaluated with additional wells planned for 2014.
Brazil ExxonMobil captured a 50-percent operating interest in two deepwater blocks in Brazil Tender Round 11 in 2013. Seismic operations are planned for 2014 and 2015.
Colombia ExxonMobil has an interest in four blocks and a technical evaluation agreement for one block in the emerging tight liquids play of the Magdalena Basin. An initial short-term test of the first exploration well and additional drilling are planned for 2014.
|
In 2013, we continued our exploration drilling program in the highly-prospective Vaca Muerta shale formation in Argentina.
|
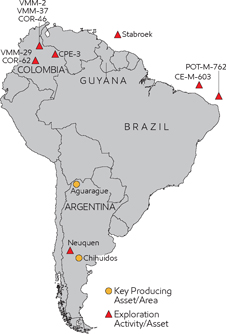
|
In the heavy oil play, ExxonMobil holds a technical evaluation agreement in Block CPE-3 onshore Colombia covering more than 3.2 million net acres. In 2013, 2D seismic data was collected to evaluate potential core hole locations. Exploratory core hole drilling is expected to be completed in 2014.
Guyana ExxonMobil holds a 50-percent operating interest in the Stabroek deepwater block (3.3 million net acres) offshore Guyana. In 2013, we completed 3D seismic data acquisition to evaluate its potential.
Venezuela The Cerro Negro and La Ceiba assets of ExxonMobil affiliates were expropriated without compensation by Venezuela on June 27, 2007. Prior to expropriation, ExxonMobil affiliates owned a 41.67-percent interest in Cerro Negro and a 50-percent interest in La Ceiba. ExxonMobil affiliates filed a request for arbitration against Venezuela with the International Centre for Settlement of Investment Disputes (ICSID) in September 2007. The ICSID arbitration is ongoing. |
|
|
EXXONMOBIL 2013 FINANCIAL & OPERATING REVIEW | |
Worldwide Upstream Operations, continued
| EUROPE
ExxonMobil is one of Europe’s largest producers of oil and
ExxonMobil continues to progress exploration activities
and |
EUROPE HIGHLIGHTS | 2013 | 2012 | 2011 | ||||||||||
|
Earnings (billions of dollars) |
3.4 | 4.0 | 7.1 | |||||||||||
| Proved Reserves (BOEB) |
2.3 | 2.5 | 2.7 | |||||||||||
| Acreage (gross acres, million) |
21.2 | 43.7 | 44.1 | |||||||||||
| Net Liquids Production (MBD) |
0.2 | 0.2 | 0.3 | |||||||||||
| Net Gas Available for Sale (BCFD) |
3.3 | 3.2 | 3.4 | |||||||||||
|
|
||||||||||||||
|
Europe Production
(millions of oil-equivalent barrels per day, net)
|
| |||||||||||||
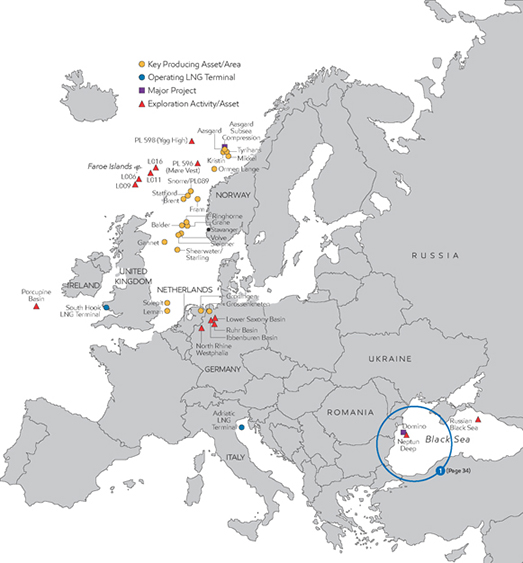
natural gas and oil opportunities in Germany. Additionally, ExxonMobil provides natural gas supply to the
European market through liquefied natural gas (LNG) from our joint ventures with Qatar Petroleum, including
receiving terminals in the United Kingdom and Italy where ExxonMobil has equity interests.
Faroe Islands
ExxonMobil holds approximately 783,000
net acres through a 49-percent interest in
license L006, a 50-percent interest
in licenses L009 and L011, and a
26-percent interest in license L016.
The licenses are operated by Statoil. Drilling
of the Brugdan-2 wildcat well on license L006
began in June 2012 and was subsequently
suspended due to the onset of winter weather.
Plans are being finalized to complete drilling
of Brugdan-2 in 2014.
Germany
ExxonMobil is Germany’s largest natural gas
producer, with production from
ExxonMobil-operated fields
accounting for approximately
70 percent of all natural gas
produced in the country. In 2013,
these fields generated an average net
production of 428 million cubic feet per
day. During the year, we also reduced our
operational footprint through a series
of infrastructure rationalization and
upgrade projects. Most notably,
the consolidation of the
Grossenkneten and NEAG sour
gas plants has now been
completed. All of our current
sour gas production now
routes through the
Grossenkneten gas plant.
|
| ||
Our subsidiaries in Germany hold 4 million net acres of exploration acreage in Lower Saxony, Hamburg, and North Rhine Westphalia. These contain potential shale gas, tight gas, tight liquids, and coal bed methane exploration plays. Future exploration activities await the issuance of permits for hydraulic fracturing.
Greenland
In 2012, ExxonMobil completed the geological evaluation of Blocks 4 and 6 in the Disko West area, offshore Greenland, and withdrew from the licenses in 2013 having met all commitments.
Ireland
ExxonMobil has interests in two Frontier Exploration Licenses (FEL): Dunquin FEL 3/04 (ExxonMobil interest, 25.5 percent) and Cuchulain FEL 1/99 (ExxonMobil interest, 36 percent). These licenses cover approximately 220,000 net acres in the Porcupine Basin, approximately 125 miles off the southwest coast of Ireland. The 44/23-1 Dunquin deepwater exploration well was plugged and abandoned in the third quarter of 2013. The well did not encounter any significant hydrocarbon accumulations.
| Italy The Adriatic LNG terminal (ExxonMobil interest, 71 percent) located 10 miles offshore of Porto Levante, Italy, in the northern Adriatic Sea, is the world’s only fixed offshore LNG storage and regasification terminal. In 2013, 60 LNG cargoes were delivered, providing 3.6 million tonnes of LNG to the Italian natural gas grid.
Netherlands Nederlandse Aardolie Maatschappij (NAM), a 50-percent ExxonMobil equity company with Shell as the operator, is the largest natural gas producer in the Netherlands. Gas is produced from more than 100 fields located both onshore and offshore. Daily net production in the Netherlands averaged 2 billion cubic feet of gas in 2013. The majority of this production comes from the Groningen field (ExxonMobil interest, 30 percent), which is Europe’s largest natural gas field. In 2013, NAM continued to progress the Underground Storage Expansion project at Norg, which will help to sustain peak Groningen gas deliveries. NAM also started up a nitrogen injection project to enhance gas recovery from the De Wijk field. This first-ever commercial application of nitrogen injection solely for methane recovery will extend the life of this field, which has been producing for more than 50 years. |
The West Alpha Rig, in Norway, commenced drilling at Balder in February 2013. |
Norway
ExxonMobil is among the largest oil and gas producers in Norway, with average net production of 161 thousand barrels of liquids per day and 495 million cubic feet of gas per day in 2013. We operate offshore producing fields in Norway, including Ringhorne (ExxonMobil interest, 100 percent), Ringhorne East (ExxonMobil interest, 77 percent), and Balder (ExxonMobil interest, 100 percent). In 2013, production averaged 44 thousand oil-equivalent barrels per day for Balder and Ringhorne combined.
Drilling at Balder resumed in 2013 following the interpretation of a recent seismic survey in the Balder/Ringhorne area, and will continue into 2014. We are assessing the potential for further drilling at Ringhorne in future years.
ExxonMobil also has significant equity participation in approximately 20 producing fields offshore Norway. In 2013, average net production from these fields yielded 114 thousand barrels of liquids per day and 478 million cubic feet of gas per day. There are active drilling programs in several core areas including successful exploration drilling at Grane, Aasgard, and Volve.
In 2013, ExxonMobil’s equity in Ormen Lange was reduced from 7.2 percent to 6.3 percent following an equity redetermination. At Grane, a decision was made to restart import gas injection for improved oil recovery.
|
|
EXXONMOBIL 2013 FINANCIAL & OPERATING REVIEW | |
Worldwide Upstream Operations, continued
Progress continues on new subsea technology with the execution of the Aasgard Subsea Compression (ASC) project (ExxonMobil interest, 13.5 percent) and advancement of a subsea compression pilot at Ormen Lange. The ASC project will help to maximize recovery from the Aasgard and Mikkel fields. This project is in the execution phase and represents an industry first in the application of subsea compression. The pilot compressor was completed in 2013 and readied for final testing under load in a submerged test facility in 2014.
ExxonMobil holds two exploration licenses covering 398,000 net acres: Møre Vest (ExxonMobil operated; working interest, 35 percent) in the Møre Basin and Ygg High (ExxonMobil interest, 30 percent) in the deepwater outer Vøring Basin. A 2D seismic survey using new acquisition technology was acquired for the Møre Vest license in 2013. We continued to process the 3D seismic survey acquired in 2012 for the Ygg High license. The primary exploration target is located beneath thick basalt layers that will require the application of specialized imaging technology to identify potential future drilling opportunities.
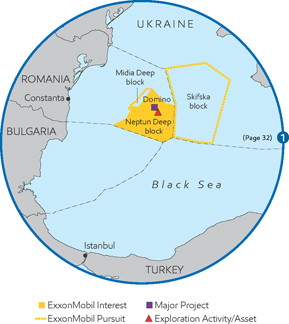
Poland
In 2013, ExxonMobil permanently abandoned the 2011 Krupe-1 and
Siennica-1 shale gas wells and withdrew from its Poland licenses.
Romania
ExxonMobil has a 50-percent working interest in the deepwater Neptun
Deep block covering approximately 932,000 net acres in the Black Sea.
Acquisition of a 2,300-square-mile 3D seismic survey was completed in
2013 and the data is currently being evaluated. Resource appraisal and
concept selection activities are progressing in support of potential
development of the Domino discovery with additional exploration and
appraisal drilling anticipated in 2014. ExxonMobil expanded its position
in the Romanian Black Sea with an agreement to purchase the deepwater
portion of the Midia License, covering 53,000 net acres.
Turkey
In 2013, ExxonMobil exited the operated sub-blocks of Licenses 3921
Kastamonu and 3922 Samsun and the Petrobras-operated portion of
License 3922 Sinop.
Ukraine
In August 2012, an ExxonMobil-led consortium won the tender for the
Skifska offshore block in the Black Sea totaling 1.65 million net acres
(ExxonMobil interest, 40 percent). We are working with our co-venturers
and the Ukrainian government to finalize the Production Sharing Agreement.
United Kingdom
ExxonMobil holds significant interest in more than 40 producing fields in the North Sea, principally through a joint venture with Shell. In 2013, average net production from these fields was 20 thousand barrels of liquids per day and 293 million cubic feet of gas per day.
Following drilling results in 2013, an alternate subsea satellite development is under consideration for the offshore Fram field (ExxonMobil interest, 68 percent).
The South Hook LNG regasification terminal (ExxonMobil interest, 24 percent) located in Milford Haven, Wales, delivers gas to the United Kingdom’s natural gas grid. In 2013, 52 LNG cargoes were delivered, providing more than 5.6 million tonnes of LNG.
In addition, ExxonMobil has interests in several North Sea hydrocarbon transportation and processing systems, including the SEGAL gas plant at St. Fergus where we maximize the extraction of natural gas liquids to provide feedstocks to our onshore ethylene plant in Fife, Scotland.
|
| ||
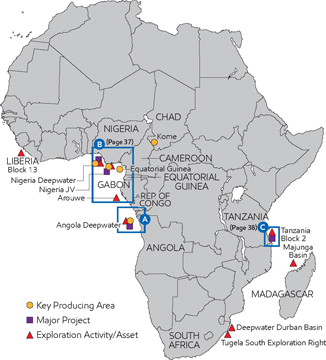
AFRICA
ExxonMobil is one of Africa’s leading oil producers. Our operations in Africa accounted for 11 percent of our 2013 net oil and natural gas production and 17 percent of total Upstream earnings. In addition to producing activities, we have ongoing exploration activities. ExxonMobil holds interests in 19 deepwater blocks offshore Africa totaling approximately 11 million net acres.
Angola
We have interests in three deepwater blocks covering nearly 2 million acres in Angola. These world-class development opportunities have a gross recoverable resource potential of approximately 11 billion oil-equivalent barrels. Including production from the co-venturer-operated Block 17, our net production in Angola averaged 123 thousand barrels of oil per day in 2013. Several new projects are under construction or in development planning.
Block 15 • ExxonMobil has a 40-percent interest in Block 15. We have discovered total resources of approximately 5 billion gross oil-equivalent barrels on the block. With daily output of
more than 370 thousand barrels of oil, Block 15 was Angola’s
second-highest-producing block in 2013, and facilities continue to operate with very high levels of reliability.
Block 15 development now focuses on the Kizomba Satellites Phase 2 project, which includes subsea tiebacks to the Kizomba B and Mondo floating production, storage, and offloading (FPSO) vessels. The Phase 2 project is expected to recover nearly 190 million barrels of oil. Production is anticipated to start in 2015. Through collaborative development efforts with our partners and major contractors, we continue to utilize the local workforce to enhance Angolan economic development and competitiveness.
Block 17 • ExxonMobil has a 20-percent interest in Block 17. Through year-end 2013, 15 discoveries have been made on the block with a gross recoverable resource potential of approximately 5 billion oil-equivalent barrels. During 2013, production averaged more than 590 thousand barrels of oil per day from the Girassol, Dalia, Rosa, and Pazflor projects.
| AFRICA HIGHLIGHTS | 2013 | 2012 | 2011 |
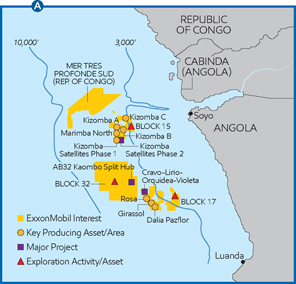
| ||||||||||
|
Earnings (billions of dollars) |
4.5 | 7.2 | 5.4 | |||||||||||
| Proved Reserves (BOEB) |
1.5 | 1.7 | 1.8 | |||||||||||
| Acreage (gross acres, million) |
23.0 | 14.1 | 15.1 | |||||||||||
| Net Liquids Production (MBD) |
0.5 | 0.5 | 0.5 | |||||||||||
| Net Gas Available for Sale (BCFD) |
– | – | – | |||||||||||
|
|
||||||||||||||
|
Africa Production
(millions of oil-equivalent barrels per day, net)
|
|
|||||||||||||
|
|
EXXONMOBIL 2013 FINANCIAL & OPERATING REVIEW | |
Worldwide Upstream Operations, continued
| Project execution activities continued for the Cravo- Lirio-Orquidea-Violeta (CLOV) project. CLOV is located in 4,100 feet of water and will use a new FPSO vessel to produce 160 thousand barrels of oil per day. The FPSO vessel arrived in Angola in 2013 and is expected to start production in 2014.
Also within Block 17, front-end engineering and design activities are under way for the Pazflor Satellites project, a subsea tieback to the Pazflor FPSO vessel. The project is expected to start production in 2017.
Block 32 • Development planning activities continue for Block 32 where ExxonMobil owns a 15-percent interest. Through year-end 2013, 12 discoveries have been announced with a total resource of approximately 1.4 billion oil-equivalent barrels. The first FPSO vessel development planned for Block 32 is the Kaombo Split Hub project in the southeastern section of the block, which is progressing toward a full-funding decision in 2014, with estimated recovery of about 600 million barrels of oil. The water depths on this block range from 4,900 to 8,200 feet.
|
Angola Block 15 facilities, including the asset at Kizomba B, continue to operate with very high reliability. |
Block 32 co-venturers were granted an exploration license extension in 2013, and exploration activities resumed with acquisition of a 3D seismic survey starting in November 2013. Seismic data acquisition will continue into 2014, when exploration drilling is planned to resume.
Chad
ExxonMobil is Chad’s leading oil producer (ExxonMobil interest, 40 percent) with average net production of 29 thousand barrels of oil per day in 2013. We celebrated the 10th anniversary of our operations in Chad in 2013 and continue an active two-rig development drilling program focused on the Kome, Bolobo, and Miandoum fields. ExxonMobil continues to support Chad resource development, and in late 2013, facilitated the start of crude shipment by other producers through our existing dedicated Chad-Cameroon pipeline to available markets.
Equatorial Guinea
ExxonMobil operates the Zafiro field in Equatorial Guinea (ExxonMobil interest, 71 percent) in water depths between 400 and 2,800 feet. The Zafiro field has produced more than 965 million barrels in its 17 years of production. In 2013, net production averaged 34 thousand barrels of oil per day. A drilling and wellwork campaign began in 2013 and will continue through 2014.
Gabon
ExxonMobil acquired a 30-percent interest in the Arouwe Block offshore Gabon in 2013. A well is planned in this deepwater block in 2014.
Liberia
In 2013, ExxonMobil acquired an 83-percent interest in deepwater Liberia Block 13, covering approximately 520,000 net acres offshore Liberia’s central coast. Assessment of the block’s resource potential is under way, with future drilling planned.
Libya
ExxonMobil has been under force majeure since March 2011 in Contract Areas 20 and 21. In accordance with contractual terms, these Exploration and Production Sharing Agreements terminated in March 2013.
Madagascar
ExxonMobil holds an interest in more than 9.3 million net acres in the Majunga Basin offshore Madagascar. Extensions to the Production Sharing Contracts were ratified in 2013, and exploration activity resumed in Madagascar with 2D seismic data acquisition.
|
| ||
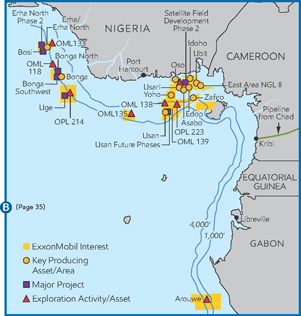
Nigeria
ExxonMobil continues to develop our interest in offshore Nigeria, both in shallow and deepwater acreage. We operate a shallow-water joint venture with the Nigerian National Petroleum Corporation (NNPC) offshore southeastern Nigeria (ExxonMobil interest, 40 percent for crude and condensate; 51 percent for natural gas liquids) as well as the deepwater Erha and Erha North fields. ExxonMobil also produces from co-venturer-operated fields. Development drilling and project activities using Nigeria’s expanding capabilities are under way to further develop our interests. In 2013, net production in Nigeria averaged 285 thousand barrels of liquids per day.
Nigeria – Deepwater
Erha/Erha North • The Erha development (ExxonMobil interest, 56 percent) is located 60 miles offshore in 3,900 feet of water. The development consists of more than 30 subsea wells tied back to an FPSO vessel, with a capacity in excess of 200 thousand barrels per day.
The Erha North Phase 2 project (ExxonMobil interest, 56 percent), which was fully funded in 2013, is a subsea tieback to the existing Erha FPSO vessel. The project will further develop the currently producing Erha North field, with a peak production rate of approximately 60 thousand barrels of oil per day. Engineering, procurement, and construction (EPC) contracts have been executed. Start-up is targeted for 2016.
Bonga North • The Bonga North development (ExxonMobil interest, 20 percent) is planned as multiple subsea wells tied back to an FPSO vessel. Early engineering and design continue, with the revised concept expected to develop more than 500 million oil-equivalent barrels.
Bonga Northwest • Bonga Northwest (ExxonMobil interest, 20 percent) is planned as a subsea tieback to the existing Bonga FPSO vessel, which began production from the Bonga field in 2005. Project execution activities continue on Bonga Northwest, which is expected to develop approximately 125 million barrels of oil. Start-up is targeted for 2014.
Bonga Southwest • The Bonga Southwest project (ExxonMobil interest, 16 percent) is planned as an FPSO vessel development with a dedicated gas export pipeline. The project is anticipated to develop approximately 800 million oil-equivalent barrels. Early procurement and contracting activities are under way.
Bosi • (ExxonMobil interest, 56 percent) is planned as a spread-moored FPSO vessel with associated subsea developments. The Bosi Phase 1 project is expected to develop more than 600 million barrels of oil. Project concept selection activities are progressing in participation with the Nigerian government and co-venture partner Shell Oil.
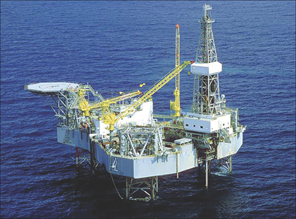
|
OPL 214 • ExxonMobil was awarded operatorship of OPL 214 in 2001 (ExxonMobil interest, 20 percent) and discovered the Uge field in 2005. Development planning for Uge continues.
OPL 223 / OML 138 / OML 139 • Following the Owowo West discovery in 2012, we have continued to evaluate the potential of this deepwater region. A wildcat well on OML 138 (ExxonMobil interest, 30 percent) spud in December 2013. We are planning additional wells on OPL 223 (ExxonMobil interest, 27 percent) and OML 138 to further assess this area.
The Shelf Baltic drilling rig, offshore Nigeria, supported 2013 joint venture activities. |
|
|
EXXONMOBIL 2013 FINANCIAL & OPERATING REVIEW | |
Worldwide Upstream Operations, continued
Usan • First production from the Usan project (ExxonMobil interest, 30 percent) was achieved in February 2012. Usan is located 60 miles offshore Nigeria in 2,500 feet of water. Full development is designed to recover more than 300 million barrels of oil using subsea wells connected to a 180-thousand-barrel-per-day capacity FPSO vessel. ExxonMobil plans to assume operatorship of this asset in early 2014.
Nigeria Shelf – Joint Venture
ExxonMobil’s portfolio on the Nigerian shelf encompasses 69 fields. We have ongoing activities to increase liquids volumes, including an active development drilling program, installation of new platforms, enhanced oil-recovery projects, and a series of platform upgrades. In addition, exploration activities continue in an effort to identify new opportunities within the joint venture. ExxonMobil discovered oil in an exploration well in early 2013 in OML 68 (ExxonMobil interest, 40 percent), and commercial viability and prospectivity are being evaluated.
Satellite Field Development • Execution of ExxonMobil’s “design one, build multiple” approach for the Satellite Field Development project (ExxonMobil interest, 40 percent) is progressing. Phase 1 achieved first oil in October 2012 with the installation of three new platforms, with drilling continuing into 2014. Peak production from Phase 1 is anticipated to reach 70 thousand barrels of liquids per day and recover more than 120 million barrels of oil and natural gas liquids. Project activities are progressing on Phase 2 of the Satellite Field Development, with early design of four new wellhead platforms and associated interconnecting pipelines.
Natural Gas Liquids • Production of natural gas liquids occurs from the Oso Natural Gas Liquids project and the East Area Natural Gas Liquids II project (ExxonMobil interest, 51 percent). Production from these two projects averaged 36 thousand barrels per day in 2013. The projects are expected to recover approximately 400 million barrels of natural gas liquids. In addition, they have contributed to a 50-percent reduction in flaring since 2007.
Domestic Power Generation and Natural Gas Supply • Development of a nominal 530-megawatt power plant is under way. Engineering, procurement, and construction contract awards have been advanced for governmental approval. The plant is a central component of an integrated plan to increase gas utilization and power generation capacity in Nigeria.
Republic of Congo
Throughout the license period, five discoveries were announced in the Mer Tres Profonde Sud block (ExxonMobil interest, 30 percent) with a total resource of approximately 400 million gross oil-equivalent barrels. We continue to evaluate development options.
South Africa
In 2013, the government of South Africa approved ExxonMobil acquiring a 75-percent interest in the Tugela South Exploration Right. Future exploration rights in three offshore areas, and ExxonMobil’s 75-percent interest in them, remain subject to South
|
|
African governmental approval. Additionally, ExxonMobil completed the study of the hydrocarbon potential of the Deepwater Durban Basin pursuant to a technical cooperation permit with the government, and submitted an application for an exploration right with 100-percent interest.
Tanzania After the three discoveries in 2012 on Block 2 (ExxonMobil interest, 35 percent), two additional wells were drilled in 2013. Tangawizi-1 was drilled in early 2013, which resulted in a 4-trillion to 6-trillion-cubic-foot natural gas discovery. A second discovery was made with the drilling of the Mronge-1 well, where an additional 2 trillion to 3 trillion cubic feet of natural gas was discovered, bringing the total discovered resource to 17 trillion to 20 trillion cubic feet of natural gas in place. 3D seismic data acquisition was completed in early 2013, and this data is being assessed to identify future prospects. Additional drilling is planned to further assess the potential of the block. Development planning, onshore site selection, and commercial discussions regarding a potential joint LNG plant with adjoining blocks were initiated in 2013. |
|
| ||
| ASIA
In Asia, ExxonMobil is participating in the development
of
Azerbaijan The
Azeri-Chirag-Gunashli (ACG) megafield (ExxonMobil |
ASIA HIGHLIGHTS | 2013 | 2012 | 2011 | ||||||||||
|
Earnings (billions of dollars) |
13.0 | 12.7 | 13.4 | |||||||||||
| Proved Reserves (BOEB) |
7.9 | 7.7 | 8.1 | |||||||||||
| Acreage (gross acres, million) |
60.3 | 31.5 | 31.0 | |||||||||||
| Net Liquids Production (MBD) |
0.8 | 0.8 | 0.8 | |||||||||||
| Net Gas Available for Sale (BCFD) |
4.3 | 4.5 | 5.0 | |||||||||||
|
|
||||||||||||||
|
Asia Production
(millions of oil-equivalent barrels per day, net)
|
| |||||||||||||
China
In July 2013, ExxonMobil signed a Joint Study Agreement covering 946,000 net acres in the Ordos Basin. We are working with PetroChina to evaluate the unconventional gas potential within the study area.
Indonesia
ExxonMobil operates the onshore Arun and Arun satellite fields and the North Sumatra offshore field that supply natural gas to the PT Arun LNG Plant. In 2013, net production from these fields averaged 110 million cubic feet of gas per day and 1 thousand barrels of associated liquids per day.
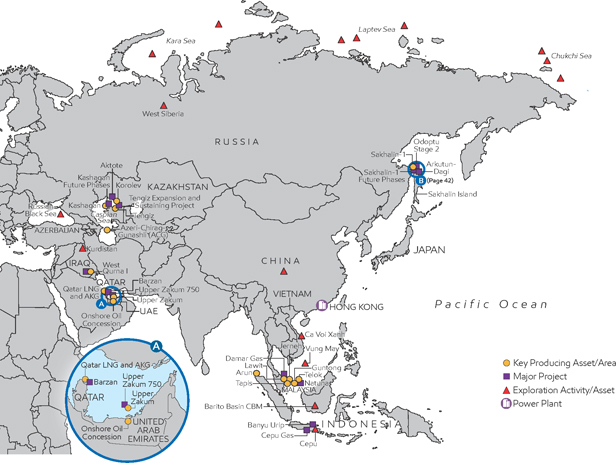
|
|
EXXONMOBIL 2013 FINANCIAL & OPERATING REVIEW | |
Worldwide Upstream Operations, continued
| We also have active operations in the Cepu Contract Area, onshore Java (ExxonMobil interest, 45 percent). In 2013, we continued to increase production from the Banyu Urip early production facility, which was producing 29 thousand barrels per day at year end. The 165 thousand-barrel-per-day development is progressing and consists of 49 wells, an onshore central processing facility, and a 60-mile pipeline to transport oil to a floating storage and offloading (FSO) vessel off the coast of East Java. In 2013, we progressed the central processing facility construction activities, nearly completed onshore pipeline construction, commenced offshore pipelay and mooring tower construction, and progressed the FSO vessel refurbishment. Development well drilling is under way with two rigs in parallel operations.
Progress also continued on the Cepu Gas project, a unitized development covering the Jambaran and Tiung Biru gas fields with |
The Banyu Urip development will have a capacity of 165 thousand barrels of oil per day. |
PT Pertamina EP Cepu as the unit operator. Key milestones in 2013 included the completion of engineering optimization studies, awarding of process license contracts, and commencement of environmental impact assessments. The project is preparing for tendering for front-end engineering design contracts.
In December 2013, our Indonesian affiliate, Esso Natuna Ltd., signed a Fourth Restated Principles of Agreement with the government of Indonesia on key terms and conditions for a new PSC to develop Natuna’s hydrocarbon resources. Discussions to finalize an East Natuna PSC continue.
During 2013, ExxonMobil exited the deepwater Cendrawasih block offshore West Papua and initiated the exit process for the deepwater Surumana and Mandar blocks and the onshore Java Gunting block.
Iraq
ExxonMobil signed agreements with the South Oil Company of the Iraqi Ministry of Oil in 2010 to redevelop and expand production from the West Qurna I oil field in southern Iraq (ExxonMobil interest, 25 percent). In 2013, we sold a partial interest, reducing our interest from 60 percent to 25 percent. Located in one of Iraq’s most prolific producing areas, West Qurna I field redevelopment and expansion will entail infill drilling, reservoir pressure support, development of undeveloped reservoirs, new production facilities, and associated support infrastructure.
In 2013, we continued with redevelopment activities and the finalization of long-term development plans. Seismic data acquisition was completed and water injection activities are under way. Production capacity from West Qurna I reached 500 thousand barrels per day in 2013.
In October 2011, ExxonMobil signed six Production Sharing Contracts covering more than 848,000 acres in the Kurdistan Region of Iraq. ExxonMobil began a 2D seismic data acquisition program across four of our six blocks in 2013. Additionally, drilling operations began with the spud of the first ExxonMobil-operated well. Seismic and drilling operations will continue in 2014 to meet our license obligations.
Kazakhstan
Tengiz • ExxonMobil participates in the Tengizchevroil (TCO) joint venture (ExxonMobil interest, 25 percent), which includes a production license area encompassing the super-giant Tengiz field, the nearby Korolev field, and an associated processing complex. The Tengiz field has produced more than 2.2 billion barrels of oil from a total gross resource of approximately 6 billion barrels. Front-end engineering progressed and early works were initiated in 2013 for two projects to increase production capacity by as much as 260 thousand barrels of oil per day and extend current production rates as reservoir pressure declines.
Kashagan • As a participant in the North Caspian Production Sharing Agreement (ExxonMobil interest, 17 percent), we are working with consortium members to progress phased development of the massive Kashagan field located offshore in the Caspian Sea. Phase 1 includes an offshore production and separation hub on an artificial island, several drilling
|
| ||
islands, and an onshore processing plant. The facilities for commercial production have been installed and started up in September 2013. After a brief period of production reaching approximately 80 thousand barrels per day, the field was shut-in due to a leak in the main gas pipeline. Work is progressing on repair options and production reinstatement.
Caspian Pipeline Consortium • The Caspian Pipeline Consortium (ExxonMobil interest, 7.5 percent), operates a pipeline that runs from the Tengiz field in Kazakhstan to the Novorossiysk marine terminal on the Russian Black Sea coast. Currently, the consortium is constructing an expansion project that will increase system capacity from 0.6 million to 1.4 million barrels per day. Expansion capacity is expected to start up in phases from early 2014 through 2016. This pipeline system represents the lowest-cost export option for Kazakhstan, with both Tengizchevroil and future Kashagan developments as major shippers.
Malaysia
ExxonMobil operates 44 platforms in 18 fields in Malaysia, and is one of the country’s major suppliers of crude oil and natural gas. Net production in 2013 averaged 36 thousand barrels of liquids per day and 363 million cubic feet of gas per day.
During 2013, fabrication and installation work continued on the Tapis field Enhanced Oil Recovery project, with the large central processing facility deck to be installed in 2014, in support of start-up forecasted for third quarter 2014. Fabrication and offshore installation work was completed for both the Telok and Damar Gas projects, leading to first gas production from Telok in March 2013, and initiation of drilling on Damar.
Qatar
ExxonMobil participates in the RasGas and Qatargas LNG projects, the Al Khaleej and Barzan gas projects, as well as the Helium and common facilities projects, all of which are supplied by Qatar’s North Field, the world’s largest non-associated gas field. In 2013, production from ExxonMobil and Qatar Petroleum joint ventures exceeded 61 million tonnes of LNG reliably distributed to worldwide customers.
ExxonMobil and Qatar Petroleum also have joint interests outside of Qatar, including three LNG terminals located in the United Kingdom, Italy, and the United States.
Al Khaleej Gas • The Al Khaleej Gas (AKG) Phase 1 and 2 project facilities are helping to meet growing domestic demand in Qatar. The combined capacity of these facilities is 2 billion cubic feet per day.
Barzan • The Barzan project, scheduled to start up in 2014, will supply up to 1.4 billion cubic feet per day of natural gas, primarily to meet the demand driven by Qatar’s rapidly growing infrastructure and industry requirements. Fabrication of the topsides for the three offshore wellhead platforms concluded in South Korea, and the heavy lift of the topsides onto the jacket structures offshore Qatar was completed successfully; hook-up and commissioning activities are ongoing. Onshore construction activities continue, and development drilling of all the production wells is complete.
| Qatargas • ExxonMobil participates in the Qatargas 1 and Qatargas 2 joint ventures with interests ranging from 10 to 30 percent. Qatargas 1 consists of three trains with a total capacity of 9.9 million tonnes per year, delivering LNG primarily to Japan and Western Europe. Qatargas 2 consists of two 7.8-million-tonnes-per-year trains. Deliveries of LNG from Qatargas 2 utilize a fleet of Q-Flex and Q-Max vessels, the world’s largest LNG carriers. The Qatargas operations also produce associated products including condensate, liquefied petroleum gas, helium, and sulfur. |
The Barzan project will supply up to 1.4 billion cubic feet of gas per day. Start-up is planned for 2014.
|
|
|
EXXONMOBIL 2013 FINANCIAL & OPERATING REVIEW | |
Worldwide Upstream Operations, continued
RasGas • RasGas is a joint venture between Qatar Petroleum and ExxonMobil, with 70-percent and 30-percent interests, respectively. RasGas operates a total of seven LNG trains with capacities ranging from 3.3 million to 7.8 million tonnes per year with a combined production capacity of 36.3 million tonnes per year. LNG from the seven trains is sold predominantly to the Asian and European markets. RasGas also employs a fleet of LNG carriers including Q-Flex and Q-Max vessels. In addition to LNG, RasGas also produces substantial volumes of associated products including condensate, liquefied petroleum gas, helium, and sulfur.
Helium • The RasGas operated Helium 2 project started operations in 2013. The Helium 2 project increases existing capacity by 1.3 billion cubic feet per year to 2 billion cubic feet per year, making Qatar one of the world’s largest helium producers. ExxonMobil participation in the Helium 1 and Helium 2 projects is 22 percent and 18 percent, respectively.
Common Facilities • Qatargas and RasGas also participate in common facilities for the storage and loading of LNG, condensate, liquefied petroleum gas, and sulfur on behalf of the Ras Laffan Industrial City joint venture companies. Sharing common facilities enables all participants to benefit from economies of scale.
Russia
ExxonMobil operates the Sakhalin-1 project (ExxonMobil interest, 30 percent), which comprises the Chayvo, Odoptu, and Arkutun-Dagi fields. The Sakhalin-1 project, which is being developed in phases, represents one of the largest foreign investments in Russia.
In 2013, ExxonMobil and Rosneft achieved several major milestones under the 2011 Strategic Cooperation Agreement. In February 2013, ExxonMobil and Rosneft increased the scope of the strategic cooperation by including seven new blocks in the Russian Arctic, stretching across the Kara, Laptev, and Chukchi Seas. These seven blocks cover an area of more than 150 million gross acres. We completed the joint venture frameworks for the Kara Sea and Black Sea projects in June 2013. Rosneft holds a 67-percent interest with ExxonMobil holding a 33-percent interest in the Kara Sea and Black Sea projects.
December 2013 marked the joint venture formation to implement the West Siberia tight oil pilot development program, where data collection operations are currently under way to evaluate the potential for commercial production. Rosneft holds a 51-percent interest with ExxonMobil holding 49 percent.
Sakhalin-1 Chayvo and Odoptu • Oil production and gas sales to far east Russia commenced in 2005 with production from the initial development phase of the Chayvo field. Exports of crude oil to international markets from the De-Kastri terminal started in 2006.
In 2013, the Yastreb rig, one of the world’s most powerful land drilling rigs, continued extended-reach drilling from the Chayvo onshore well site to capture resources more than 7 miles offshore under the Sea of Okhotsk. Daily production from Chayvo and Odoptu in 2013 averaged 144 thousand barrels of oil and 225 million cubic feet of natural gas. Since the initial start-up of
|
|
Sakhalin-1 in 2005, nearly 460 million barrels of oil have been produced and exported to world markets. Additionally, 448 billion cubic feet of natural gas have been supplied to Russian domestic customers. Engineering is under way on Odoptu Stage 2, a planned expansion that will add a well site and extended-reach wells, increase capacity, and recover additional resources. | |||
|
Sakhalin-1 Arkutun-Dagi • Arkutun-Dagi is the next phase of the Sakhalin-1 development. The development is under way with commissioning and operational testing of the platform topsides in South Korea prior to installation offshore after the sea ice clears. Plans are to commence drilling and start up in 2014.
Sakhalin Future Phase • ExxonMobil continues to pursue potential development options for Sakhalin-1 gas resources, including LNG exports, domestic sales, and export gas sales via pipeline. ExxonMobil and Rosneft are studying LNG feasibility, including LNG plant site selection.
|
|
| ||
| Kara Sea • In 2013, 2D and 3D seismic data acquisition was completed along with ice defense trials and other met-ocean and environmental studies in preparation for 2014 drilling.
Black Sea • Drilling is scheduled to commence in late 2014 or early 2015.
West Siberia • The pilot program includes drilling new horizontal and vertical wells using the latest fracturing technologies, deepening existing wells, and redeveloping idle wells. Horizontal drilling is scheduled to begin in 2014.
In 2013, the Arctic Research Center was established as a joint venture with Rosneft to provide technology and technical services supporting oil and gas exploration, and development on the Arctic Shelf.
United Arab Emirates In 2013, ExxonMobil participated in the development and production of oil resources in the United Arab Emirates through two concessions. Net production from the onshore oil concession was 141 thousand barrels of oil per day. The onshore concession expired in January 2014. Net production from the Upper Zakum offshore concession was 165 thousand barrels of oil per day. In 2013, the Upper Zakum governing agreements were extended to 2041. |
Integrated ice management technologies were successfully tested in the Kara Sea and will be fully deployed during the 2014 drilling campaign. | |||
Our ability to deliver superior technology and project execution excellence afforded us entry into Upper Zakum in 2006. Upper Zakum (ExxonMobil interest, 28 percent) is one of the world’s largest oil fields, with an initial resource estimate of approximately 50 billion gross barrels of oil.
The offshore Upper Zakum field covers more than 450 square miles with production capacity exceeding 550 thousand barrels of oil per day. In association with our joint venture partners, we are applying leading-edge reservoir simulation and extended-reach drilling technology that will increase daily field production capacity nearly 40 percent to 750 thousand barrels of oil per day. In 2013, the North Island became the second of four artificial islands to be completed, with the remaining two islands well progressed. Initial civil and infrastructure activities are ongoing, and engineering activities progressed for the on-island facilities. Offshore pipelay also commenced in 2013. Additionally, a second drill rig commenced drilling, and two of four custom-built drill rigs were completed and delivered to the islands.
Vietnam
In 2013, we progressed processing, interpretation, and evaluation of the 3D seismic data and well results from 2012. We continued concept selection work and initiated commercial negotiations. Planning is under way for an additional well targeted to spud in 2014.
|
|
EXXONMOBIL 2013 FINANCIAL & OPERATING REVIEW | |
Worldwide Upstream Operations, continued
| AUSTRALIA/OCEANIA
ExxonMobil is a leading oil and gas producer in the
Australia
Gippsland Basin • The Kipper Tuna and Turrum projects are |
AUSTRALIA/OCEANIA HIGHLIGHTS | 2013 | 2012 | 2011 | ||||||||||
|
Earnings (billions of dollars) |
0.3 | 0.5 | 0.8 | |||||||||||
| Proved Reserves (BOEB) |
1.5 | 1.5 | 1.5 | |||||||||||
| Acreage (gross acres, million) |
9.3 | 9.5 | 7.8 | |||||||||||
| Net Liquids Production (MBD) |
0.0 | 0.1 | 0.1 | |||||||||||
| Net Gas Available for Sale (BCFD) |
0.4 | 0.4 | 0.3 | |||||||||||
|
|
||||||||||||||
|
Australia/Oceania Production
(millions of oil-equivalent barrels per day, net)
|
| |||||||||||||
The Kipper Tuna project started production in 2013.
|
| ||
Gorgon Jansz • In 2013, project execution activities continued on the 15.6-million-tonnes-per-year Gorgon Jansz LNG project (ExxonMobil interest, 25 percent). The development consists of subsea infrastructure for offshore production and transportation of hydrocarbons, three 5.2-million-tonnes-per-year LNG trains (nominal capacity), and a 280-million-cubic-foot-per-day domestic gas plant located on Barrow Island. The project includes the world’s largest carbon dioxide sequestration project.
In 2013, a majority of the gas processing modules and pipe rack units for the first LNG train were installed on Barrow Island. Following the raising of the LNG tank roofs in 2012, the roofs were raised on two of four condensate tanks in 2013. Additionally, most of the offshore and onshore pipelines were installed, including the domestic gas pipeline from Barrow Island to the mainland.
ExxonMobil, as work operator for Jansz-Io drilling and completion, has spudded all 10 development wells, with a majority of the wells drilled to total depth. Well completions and installation of subsea trees are ongoing. Gas will be produced via one of the world’s longest subsea tiebacks, located in 4,430 feet of water.
Gorgon Area Expansion • The exploration and appraisal drilling program in the Greater Gorgon area conducted in 2012 and 2013 has confirmed the presence of additional high-quality gas resource that can support a potential expansion of the Gorgon project. Pre-FEED studies are being undertaken to assess expansion project feasibility and optimal project timing.
Scarborough • Development and execution planning continues for the Scarborough LNG project (ExxonMobil interest, 50 percent). Floating LNG is being progressed as the lead development concept, and early engineering and optimization activities are progressing.
Papua New Guinea
The Papua New Guinea Liquefied Natural Gas (PNG LNG) project (ExxonMobil interest, 33 percent) is progressing, with LNG delivery on track to begin in 2014.
| Construction of the LNG plant progressed, including installation and start-up of the main power generators and commissioning | ||
| the initial train gas processing equipment and compressors. Progress also continues on the 181-mile onshore pipeline, which is now more than 90-percent complete. The associated gas project is essentially complete, and Oil Search Limited is supplying commissioning gas from the Kutubu central processing facility.
Construction activities, including systems completion, at the Hides Gas Conditioning Plant are well under way. Other project activities include the drilling of the first two wells at the Hides natural gas field.
Although construction activity is beginning to ramp down, at its peak, approximately 20,000 people worked together across multiple sites to meet project commitments. About 40 percent of the construction workforce are Papua New Guinean nationals.
In addition to the PNG LNG project and exploration drilling activities, we continued acquisition of a multiyear seismic program in the Papua New Guinea Highlands to further evaluate our acreage portfolio. More than 110 miles of 2D seismic data were acquired during 2013 to guide future exploration drilling. Planning is under way to acquire additional 2D seismic data in 2014.
Drilling operations for the first two wells at the Hides natural gas field in Papua New Guinea took place during 2013. |
| |
|
|
EXXONMOBIL 2013 FINANCIAL & OPERATING REVIEW | |
Technology
ExxonMobil’s commitment to research and development is a key contributor to delivering profitable growth. We develop and apply innovative solutions to enhance the resolution of the complex subsurface, develop resources in challenging conditions, and drive operational efficiency. Technology plays a crucial role in all aspects of our operations.
SHARPENING SUBSURFACE FOCUS
| ExxonMobil’s High Performance Computing (HPC) capability is enabling a broad spectrum of high-impact technologies, including our industry-leading Full Wavefield Inversion (FWI) that is delivering significant value to the business. Our technical teams are integrating high-resolution FWI data into their interpretation methods from exploration to delineation and development to production. Our proprietary 3D velocity modeling environment enables interpreters to integrate their expertise with multiple geologic | ||||
| and geophysical datasets to rapidly construct detailed models, further enhancing our ability to accurately image complex structures. Backed by our commitment to HPC, ExxonMobil researchers continue to enhance our FWI capability to deliver increasingly detailed representations of the subsurface.
ExxonMobil research teams, leveraging our imaging capabilities, are exploring opportunities to optimize the underlying seismic data collection process. Enhancements to seismic data acquisition can minimize survey costs and improve efficiency in challenging operating conditions like the High Arctic, where open- |
| |||
| High Performance Computing is enabling a new generation of reservoir modeling technologies that provide unparalleled insights into the subsurface. | ||||
| water access is limited for much of the year. | ||||
ExxonMobil is also leveraging HPC capability to develop a suite of industry-leading subsurface technologies. We are changing the way geoscientists and engineers model and simulate fluid flow in the subsurface, reducing uncertainty across all stages of asset life. Large, complex simulations are completed in minutes, allowing subsurface teams the flexibility to test multiple scenarios enabling optimum development planning. Our expertise in computational science is furthering our understanding of the complex interactions that occur down hole when drilling or completing a well, enabling us to drill farther and more efficiently and deliver more productive completions. The growing integration of computational science, enabled by HPC capability, is delivering a step change in subsurface understanding that will accelerate in the years to come.
DEVELOPING ARCTIC RESOURCES
ExxonMobil’s comprehensive and integrated arctic research program continues to support our Upstream operations through applied expertise in ice characterization and management. A month-long, ice defense field trial to test sea ice and iceberg detection and tracking systems was completed safely and successfully in 2013. The collaborative trial combined an ice-breaking vessel, fixed wing aircraft, and a helicopter all outfitted with various ice detection systems along with satellite imagery and ice drift beacons to identify and track the movement of ice features. These integrated capabilities will be used in the summer of 2014 to maintain operations integrity during drilling operations in the Kara Sea. Through our arctic research, ExxonMobil is also advancing remote sensing technology to allow ice thickness measurement over large areas.
|
| ||
Thickness is an important design parameter for determining ice load on a structure. We recently completed a separate field test of these sensors over the Alaskan arctic waters.
ExxonMobil’s continued research in ice characterization and management will enable extended operating windows in the High Arctic. For example, we are building on our experience in the design of gravity-based structures for arctic conditions to develop new concepts for drilling, offshore loading, and subsea production to enable safe operations in these challenging and sensitive environments. The Arctic Research Center, a joint venture with Rosneft, was established in 2013 and will play a key role in developing technologies and improved capability for operating in the High Arctic.
TECHNOLOGY FOR OIL SANDS
ExxonMobil, in collaboration with Imperial Oil Limited, is undertaking a comprehensive effort to improve the characterization of reservoir properties and bitumen quality in our heavy oil assets. These technologies are aimed at reducing our environmental footprint and improving operational efficiency. Advanced applications of ground-penetrating radar and airborne electromagnetic data provide a cost-effective method for improving subsurface imaging in the shallow reservoirs at Kearl. Subsurface teams are gaining new insights on bitumen ore quality distribution and enhancing prediction capabilities ahead of the active mine face through stratigraphic analysis. These technologies target hundreds of millions of dollars in savings within the current projects, and the savings are expected to grow with future mine expansions.
A pilot test for Solvent-Assisted, Steam-Assisted Gravity Drainage (SA-SAGD) technology, for in situ heavy oil development, has been ongoing at Cold Lake since 2010. The SAGD process reduces oil viscosity underground by heating it with steam, allowing it to be produced by a second well below the steam chamber. With SA-SAGD, the addition of solvent improves bitumen production rates and reduces associated greenhouse gas emissions intensity.
We are also developing new technology for use in our oil sands developments that will decrease the size and operational lifetimes of tailings ponds and reduce the overall footprint of the mining operation. This technology is planned for use at Kearl following field-scale testing. Longer term, we are progressing a novel nonaqueous extraction technology that uses solvent rather than water to extract bitumen from oil sands. This step-change process could reduce freshwater usage by up to 90 percent, eliminate wet tailings, and enhance bitumen recovery through improved extraction efficiency of the solvent process.
SA-SAGD technology reduces oil viscosity underground by heating it with a mixture of steam and solvent, allowing it to be produced by a nearby well. A pilot test at Cold Lake has improved recovery and reduced associated greenhouse gas emissions intensity.
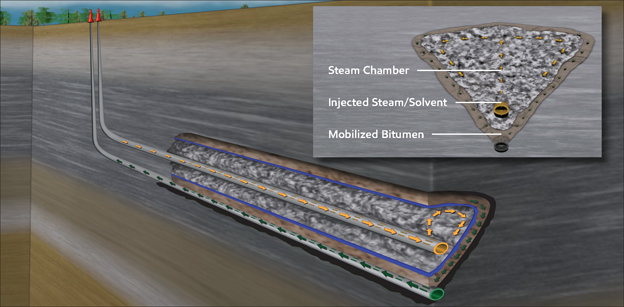
|
|
EXXONMOBIL 2013 FINANCIAL & OPERATING REVIEW | |
UPSTREAM OPERATING STATISTICS
| NET LIQUIDS PRODUCTION (1) – Including Oil Sands and Non-Consolidated Operations | ||||||||||||||||||||
| (thousands of barrels per day)
|
2013 | 2012 | 2011 | 2010 | 2009 | |||||||||||||||
| United States |
||||||||||||||||||||
| Alaska |
106 | 110 | 114 | 117 | 123 | |||||||||||||||
| Lower 48 |
325 | 308 | 309 | 291 | 261 | |||||||||||||||
| Total United States |
431 | 418 | 423 | 408 | 384 | |||||||||||||||
| Canada/South America |
280 | 251 | 252 | 263 | 267 | |||||||||||||||
| Total Americas |
711 | 669 | 675 | 671 | 651 | |||||||||||||||
|
|
|
|
||||||||||||||||||
| Europe |
||||||||||||||||||||
| United Kingdom |
20 | 20 | 55 | 80 | 90 | |||||||||||||||
| Norway |
161 | 177 | 205 | 246 | 280 | |||||||||||||||
| Other |
9 | 10 | 10 | 9 | 9 | |||||||||||||||
| Total Europe |
190 | 207 | 270 | 335 | 379 | |||||||||||||||
|
|
|
|
||||||||||||||||||
| Africa |
||||||||||||||||||||
| Nigeria |
285 | 293 | 324 | 391 | 391 | |||||||||||||||
| Angola |
123 | 120 | 99 | 141 | 194 | |||||||||||||||
| Equatorial Guinea |
34 | 38 | 45 | 53 | 55 | |||||||||||||||
| Other |
27 | 36 | 40 | 43 | 45 | |||||||||||||||
| Total Africa |
469 | 487 | 508 | 628 | 685 | |||||||||||||||
|
|
|
|
||||||||||||||||||
| Asia |
||||||||||||||||||||
| Malaysia |
36 | 40 | 38 | 48 | 52 | |||||||||||||||
| Middle East |
545 | 548 | 567 | 478 | 368 | |||||||||||||||
| Russia/Caspian |
196 | 179 | 191 | 191 | 182 | |||||||||||||||
| Other |
7 | 5 | 12 | 13 | 5 | |||||||||||||||
| Total Asia |
784 | 772 | 808 | 730 | 607 | |||||||||||||||
|
|
|
|
||||||||||||||||||
| Australia/Oceania |
48 | 50 | 51 | 58 | 65 | |||||||||||||||
|
|
|
|
||||||||||||||||||
| Total worldwide |
2,202 | 2,185 | 2,312 | 2,422 | 2,387 | |||||||||||||||
|
|
|
|
||||||||||||||||||
| Gas Plant Liquids Included Above |
||||||||||||||||||||
| United States |
87 | 83 | 78 | 59 | 50 | |||||||||||||||
| Non-U.S. |
172 | 184 | 213 | 207 | 173 | |||||||||||||||
|
|
|
|
||||||||||||||||||
| Total worldwide |
259 | 267 | 291 | 266 | 223 | |||||||||||||||
|
|
|
|
||||||||||||||||||
| Oil Sands and Non-Consolidated Volumes Included Above |
||||||||||||||||||||
| United States |
63 | 63 | 66 | 69 | 73 | |||||||||||||||
| Canada/South America – Bitumen |
148 | 123 | 120 | 115 | 120 | |||||||||||||||
| Canada/South America – Synthetic Oil |
65 | 69 | 67 | 67 | 65 | |||||||||||||||
| Europe |
6 | 4 | 5 | 5 | 5 | |||||||||||||||
| Asia |
441 | 410 | 425 | 404 | 320 | |||||||||||||||
|
|
|
|
||||||||||||||||||
| Total worldwide |
723 | 669 | 683 | 660 | 583 | |||||||||||||||
|
|
|
|
||||||||||||||||||
| (1) | Net liquids production quantities are the volumes of crude oil and natural gas liquids withdrawn from ExxonMobil’s oil and gas reserves, excluding royalties and quantities due to others when produced, and are based on the volumes delivered from the lease or at the point measured for royalty and/or severance tax purposes. Volumes include 100 percent of the production of majority-owned affiliates, including liquids production from oil sands operations in Canada, and ExxonMobil’s ownership of the production by companies owned 50 percent or less. |
|
| ||
| NET NATURAL GAS PRODUCTION AVAILABLE FOR SALE (1) – Including Non-Consolidated Operations | ||||||||||||||||||||
| (millions of cubic feet per day)
|
2013 | 2012 | 2011 | 2010 | 2009 | |||||||||||||||
| United States |
3,545 | 3,822 | 3,917 | 2,596 | 1,275 | |||||||||||||||
| Canada/South America |
354 | 362 | 412 | 569 | 643 | |||||||||||||||
| Total Americas |
3,899 | 4,184 | 4,329 | 3,165 | 1,918 | |||||||||||||||
|
|
|
|
||||||||||||||||||
| Europe |
||||||||||||||||||||
| Netherlands |
2,035 | 1,841 | 1,826 | 2,041 | 1,676 | |||||||||||||||
| United Kingdom |
293 | 306 | 441 | 550 | 594 | |||||||||||||||
| Norway |
495 | 605 | 663 | 700 | 786 | |||||||||||||||
| Germany |
428 | 468 | 518 | 545 | 633 | |||||||||||||||
| Total Europe |
3,251 | 3,220 | 3,448 | 3,836 | 3,689 | |||||||||||||||
|
|
|
|
||||||||||||||||||
| Africa |
6 | 17 | 7 | 14 | 19 | |||||||||||||||
|
|
|
|
||||||||||||||||||
| Asia |
||||||||||||||||||||
| Indonesia |
110 | 131 | 164 | 215 | 245 | |||||||||||||||
| Malaysia |
363 | 376 | 420 | 513 | 545 | |||||||||||||||
| Middle East |
3,632 | 3,835 | 4,261 | 3,865 | 2,367 | |||||||||||||||
| Russia/Caspian |
207 | 177 | 184 | 187 | 153 | |||||||||||||||
| Other |
17 | 19 | 18 | 21 | 22 | |||||||||||||||
| Total Asia |
4,329 | 4,538 | 5,047 | 4,801 | 3,332 | |||||||||||||||
|
|
|
|
||||||||||||||||||
| Australia/Oceania |
351 | 363 | 331 | 332 | 315 | |||||||||||||||
|
|
|
|
||||||||||||||||||
| Total worldwide |
11,836 | 12,322 | 13,162 | 12,148 | 9,273 | |||||||||||||||
|
|
|
|
||||||||||||||||||
| Non-Consolidated Natural Gas Volumes Included Above |
|
|||||||||||||||||||
| United States |
15 | 3 | – | 1 | 1 | |||||||||||||||
| Europe |
1,957 | 1,774 | 1,747 | 1,977 | 1,618 | |||||||||||||||
| Asia |
3,149 | 3,093 | 3,168 | 2,954 | 1,918 | |||||||||||||||
|
|
|
|
||||||||||||||||||
| Total worldwide |
5,121 | 4,870 | 4,915 | 4,932 | 3,537 | |||||||||||||||
|
|
|
|
||||||||||||||||||
| NATURAL GAS SALES (2) | ||||||||||||||||||||
| (millions of cubic feet per day)
|
2013 | 2012 | 2011 | 2010 | 2009 | |||||||||||||||
| United States |
4,424 | 4,816 | 5,002 | 3,166 | 1,321 | |||||||||||||||
| Canada/South America |
377 | 407 | 517 | 696 | 739 | |||||||||||||||
| Europe |
5,474 | 5,727 | 6,254 | 6,401 | 5,854 | |||||||||||||||
| Africa |
6 | 17 | 7 | 14 | 19 | |||||||||||||||
| Asia |
3,706 | 3,865 | 4,289 | 4,102 | 2,760 | |||||||||||||||
| Australia/Oceania |
360 | 370 | 338 | 339 | 322 | |||||||||||||||
|
|
|
|
||||||||||||||||||
| Total worldwide |
14,347 | 15,202 | 16,407 | 14,718 | 11,015 | |||||||||||||||
|
|
|
|
||||||||||||||||||
| (1) | Net natural gas available for sale quantities are the volumes withdrawn from ExxonMobil’s natural gas reserves, excluding royalties and volumes due to others when produced, and excluding gas purchased from others, gas consumed in producing operations, field processing plant losses, volumes used for gas lift, gas injection and cycling operations, quantities flared, and volume shrinkage due to the removal of condensate or natural gas liquids fractions. |
| (2) | Natural gas sales include 100 percent of the sales of ExxonMobil and majority-owned affiliates and ExxonMobil’s ownership of sales by companies owned 50 percent or less. Numbers include sales of gas purchased from third parties. |
|
|
EXXONMOBIL 2013 FINANCIAL & OPERATING REVIEW | |
Upstream Operating Statistics, continued
| NUMBER OF NET WELLS DRILLED ANNUALLY (1) | ||||||||||||||||||||
| (net wells drilled)
|
2013 | 2012 | 2011 | 2010 | 2009 | |||||||||||||||
| Productive |
||||||||||||||||||||
| Exploratory(2) |
16 | 16 | 25 | 37 | 20 | |||||||||||||||
| Development |
1,373 | 1,310 | 1,554 | 1,200 | 829 | |||||||||||||||
|
|
|
|
||||||||||||||||||
| Total |
1,389 | 1,326 | 1,579 | 1,237 | 849 | |||||||||||||||
|
|
|
|
||||||||||||||||||
| Dry |
||||||||||||||||||||
| Exploratory(2) |
8 | 8 | 11 | 7 | 9 | |||||||||||||||
| Development |
8 | 8 | 16 | 5 | 5 | |||||||||||||||
|
|
|
|
||||||||||||||||||
| Total |
16 | 16 | 27 | 12 | 14 | |||||||||||||||
|
|
|
|
||||||||||||||||||
| Net Wells Drilled |
||||||||||||||||||||
| Exploratory(2) |
24 | 24 | 36 | 44 | 29 | |||||||||||||||
| Development |
1,381 | 1,318 | 1,570 | 1,205 | 834 | |||||||||||||||
|
|
|
|
||||||||||||||||||
| Total |
1,405 | 1,342 | 1,606 | 1,249 | 863 | |||||||||||||||
|
|
|
|
||||||||||||||||||
| NET ACREAGE AT YEAR END (3) | ||||||||||||||||||||
| (thousands of net acres)
|
2013 | 2012 | 2011 | 2010 | 2009 | |||||||||||||||
| Undeveloped |
||||||||||||||||||||
| United States |
4,843 | 5,185 | 5,326 | 4,914 | 5,111 | |||||||||||||||
| Canada/South America |
9,232 | 8,700 | 9,877 | 11,977 | 17,107 | |||||||||||||||
| Europe |
6,585 | 16,123 | 16,107 | 16,118 | 13,470 | |||||||||||||||
| Africa |
13,446 | 7,707 | 8,100 | 8,612 | 10,555 | |||||||||||||||
| Asia |
25,331 | 20,244 | 19,919 | 19,086 | 20,457 | |||||||||||||||
| Australia/Oceania |
1,991 | 1,991 | 1,476 | 1,352 | 5,216 | |||||||||||||||
|
|
|
|
||||||||||||||||||
| Total worldwide |
61,428 | 59,950 | 60,805 | 62,059 | 71,916 | |||||||||||||||
|
|
|
|
||||||||||||||||||
| Developed |
||||||||||||||||||||
| United States |
10,302 | 10,366 | 10,311 | 9,919 | 5,120 | |||||||||||||||
| Canada/South America |
2,041 | 1,940 | 1,959 | 2,439 | 2,460 | |||||||||||||||
| Europe |
2,867 | 2,872 | 2,868 | 2,986 | 3,806 | |||||||||||||||
| Africa |
780 | 780 | 700 | 684 | 758 | |||||||||||||||
| Asia |
1,197 | 1,165 | 1,230 | 1,271 | 1,160 | |||||||||||||||
| Australia/Oceania |
758 | 719 | 719 | 719 | 719 | |||||||||||||||
|
|
|
|
||||||||||||||||||
| Total worldwide |
17,945 | 17,842 | 17,787 | 18,018 | 14,023 | |||||||||||||||
|
|
|
|
||||||||||||||||||
| NET CAPITALIZED COSTS AT YEAR END (3) | ||||||||||||||||||||
| (millions of dollars)
|
2013 | 2012 | 2011 | 2010 | 2009 | |||||||||||||||
| United States |
82,797 | 80,135 | 76,363 | 70,011 | 20,363 | |||||||||||||||
| Canada/South America |
38,456 | 28,683 | 21,721 | 18,089 | 13,408 | |||||||||||||||
| Europe |
12,988 | 13,042 | 11,399 | 12,845 | 14,357 | |||||||||||||||
| Africa |
23,224 | 23,010 | 24,790 | 22,563 | 20,917 | |||||||||||||||
| Asia |
28,495 | 26,852 | 25,594 | 23,765 | 21,859 | |||||||||||||||
| Australia/Oceania |
8,647 | 9,230 | 6,864 | 5,284 | 3,725 | |||||||||||||||
|
|
|
|
||||||||||||||||||
| Total worldwide |
194,607 | 180,952 | 166,731 | 152,557 | 94,629 | |||||||||||||||
|
|
|
|
||||||||||||||||||
| (1) | A regional breakout of this data is included on pages 11 and 12 of ExxonMobil’s 2013 Form 10-K. |
| (2) | These include near-field and appraisal wells classified as exploratory for SEC reporting. |
| (3) | Includes non-consolidated interests and Canadian oil sands operations. |
|
| ||
| COSTS INCURRED IN PROPERTY ACQUISITION, EXPLORATION, AND DEVELOPMENT ACTIVITIES (1) | ||||||||||||||||
| (millions of dollars) | Property Acquisition Costs |
Exploration Costs |
Development Costs |
Total Costs |
||||||||||||
| During 2013 |
||||||||||||||||
| United States |
628 | 617 | 7,639 | 8,884 | ||||||||||||
| Canada/South America |
4,337 | 485 | 8,527 | 13,349 | ||||||||||||
| Europe |
– | 306 | 2,309 | 2,615 | ||||||||||||
| Africa |
153 | 361 | 3,278 | 3,792 | ||||||||||||
| Asia |
64 | 1,092 | 4,321 | 5,477 | ||||||||||||
| Australia/Oceania |
4 | 111 | 1,733 | 1,848 | ||||||||||||
|
|
||||||||||||||||
| Total worldwide |
5,186 | 2,972 | 27,807 | 35,965 | ||||||||||||
|
|
||||||||||||||||
| During 2012 |
||||||||||||||||
| United States |
1,923 | 646 | 7,676 | 10,245 | ||||||||||||
| Canada/South America |
76 | 405 | 7,601 | 8,082 | ||||||||||||
| Europe |
119 | 488 | 2,793 | 3,400 | ||||||||||||
| Africa |
15 | 520 | 3,081 | 3,616 | ||||||||||||
| Asia |
43 | 554 | 3,998 | 4,595 | ||||||||||||
| Australia/Oceania |
31 | 248 | 2,333 | 2,612 | ||||||||||||
|
|
||||||||||||||||
| Total worldwide |
2,207 | 2,861 | 27,482 | 32,550 | ||||||||||||
|
|
||||||||||||||||
| During 2011 |
||||||||||||||||
| United States |
2,967 | 484 | 8,505 | 11,956 | ||||||||||||
| Canada/South America |
178 | 372 | 5,478 | 6,028 | ||||||||||||
| Europe |
– | 672 | 2,063 | 2,735 | ||||||||||||
| Africa |
– | 303 | 4,316 | 4,619 | ||||||||||||
| Asia |
642 | 518 | 3,618 | 4,778 | ||||||||||||
| Australia/Oceania |
– | 154 | 1,710 | 1,864 | ||||||||||||
|
|
||||||||||||||||
| Total worldwide |
3,787 | 2,503 | 25,690 | 31,980 | ||||||||||||
|
|
||||||||||||||||
| During 2010 |
||||||||||||||||
| United States |
45,143 | 694 | 8,270 | 54,107 | ||||||||||||
| Canada/South America |
136 | 527 | 4,757 | 5,420 | ||||||||||||
| Europe |
64 | 606 | 1,452 | 2,122 | ||||||||||||
| Africa |
3 | 453 | 4,390 | 4,846 | ||||||||||||
| Asia |
115 | 547 | 3,195 | 3,857 | ||||||||||||
| Australia/Oceania |
– | 228 | 1,146 | 1,374 | ||||||||||||
|
|
||||||||||||||||
| Total worldwide |
45,461 | 3,055 | 23,210 | 71,726 | ||||||||||||
|
|
||||||||||||||||
| During 2009 |
||||||||||||||||
| United States |
205 | 549 | 2,787 | 3,541 | ||||||||||||
| Canada/South America |
353 | 498 | 2,394 | 3,245 | ||||||||||||
| Europe |
1 | 525 | 3,639 | 4,165 | ||||||||||||
| Africa |
605 | 880 | 4,596 | 6,081 | ||||||||||||
| Asia |
121 | 529 | 2,946 | 3,596 | ||||||||||||
| Australia/Oceania |
– | 130 | 768 | 898 | ||||||||||||
|
|
||||||||||||||||
| Total worldwide |
1,285 | 3,111 | 17,130 | 21,526 | ||||||||||||
|
|
||||||||||||||||
| (1) | Includes non-consolidated interests and Canadian oil sands operations. |
|
|
EXXONMOBIL 2013 FINANCIAL & OPERATING REVIEW | |
Upstream Operating Statistics, continued
| PROVED OIL AND GAS RESERVES (1) | ||||||||||||||||||||
|
2013 |
2012 | 2011 | 2010 | 2009 | ||||||||||||||||
| Liquids, Including Oil Sands and Non-Consolidated Reserves (millions of barrels at year end) |
| |||||||||||||||||||
| Net proved developed and undeveloped reserves |
||||||||||||||||||||
| United States |
2,882 | 2,758 | 2,372 | 2,303 | 1,972 | |||||||||||||||
| Canada/South America |
4,512 | 4,446 | 3,894 | 2,946 | 2,918 | |||||||||||||||
| Europe |
328 | 373 | 405 | 454 | 517 | |||||||||||||||
| Africa |
1,394 | 1,501 | 1,675 | 1,799 | 1,907 | |||||||||||||||
| Asia |
3,887 | 3,488 | 3,620 | 3,896 | 4,049 | |||||||||||||||
| Australia/Oceania |
236 | 250 | 262 | 275 | 288 | |||||||||||||||
|
|
|
|
||||||||||||||||||
| Total worldwide |
13,239 | 12,816 | 12,228 | 11,673 | 11,651 | |||||||||||||||
|
|
|
|
||||||||||||||||||
| Proportional interest in oil sands and non-consolidated reserves included above |
||||||||||||||||||||
| United States |
345 | 348 | 353 | 351 | 356 | |||||||||||||||
| Canada/South America (bitumen)(2) |
3,630 | 3,560 | 3,106 | 2,102 | 2,055 | |||||||||||||||
| Canada/South America (synthetic oil)(2) |
579 | 599 | 653 | 681 | 691 | |||||||||||||||
| Europe |
28 | 28 | 29 | 31 | 30 | |||||||||||||||
| Asia |
1,586 | 1,726 | 1,733 | 1,873 | 2,050 | |||||||||||||||
| Net proved developed reserves included above |
||||||||||||||||||||
| United States |
1,737 | 1,753 | 1,722 | 1,749 | 1,490 | |||||||||||||||
| Canada/South America |
2,515 | 1,266 | 1,281 | 1,333 | 1,311 | |||||||||||||||
| Europe |
276 | 296 | 330 | 382 | 386 | |||||||||||||||
| Africa |
945 | 1,004 | 1,050 | 1,055 | 1,122 | |||||||||||||||
| Asia |
2,955 | 2,503 | 2,617 | 2,929 | 2,876 | |||||||||||||||
| Australia/Oceania |
105 | 116 | 126 | 139 | 153 | |||||||||||||||
|
|
|
|
||||||||||||||||||
| Total worldwide |
8,533 | 6,938 | 7,126 | 7,587 | 7,338 | |||||||||||||||
|
|
|
|
||||||||||||||||||
| Natural Gas, Including Non-Consolidated Reserves (billions of cubic feet at year end) |
| |||||||||||||||||||
| Net proved developed and undeveloped reserves |
||||||||||||||||||||
| United States |
26,301 | 26,370 | 26,366 | 26,111 | 11,802 | |||||||||||||||
| Canada/South America |
1,235 | 925 | 835 | 1,258 | 1,368 | |||||||||||||||
| Europe |
11,694 | 12,784 | 13,755 | 14,788 | 16,173 | |||||||||||||||
| Africa |
867 | 929 | 982 | 908 | 920 | |||||||||||||||
| Asia |
24,248 | 25,515 | 27,037 | 28,399 | 30,304 | |||||||||||||||
| Australia/Oceania |
7,515 | 7,568 | 7,247 | 7,351 | 7,440 | |||||||||||||||
|
|
|
|
||||||||||||||||||
| Total worldwide |
71,860 | 74,091 | 76,222 | 78,815 | 68,007 | |||||||||||||||
|
|
|
|
||||||||||||||||||
| Proportional interest in non-consolidated reserves included above |
||||||||||||||||||||
| United States |
281 | 155 | 112 | 117 | 114 | |||||||||||||||
| Europe |
8,884 | 9,535 | 10,169 | 10,746 | 11,450 | |||||||||||||||
| Asia |
18,514 | 19,670 | 20,566 | 21,139 | 22,001 | |||||||||||||||
| Net proved developed reserves included above |
||||||||||||||||||||
| United States |
14,852 | 14,597 | 15,533 | 15,441 | 7,582 | |||||||||||||||
| Canada/South America |
664 | 670 | 658 | 1,077 | 1,200 | |||||||||||||||
| Europe |
9,041 | 9,583 | 10,629 | 11,683 | 12,782 | |||||||||||||||
| Africa |
779 | 814 | 853 | 711 | 739 | |||||||||||||||
| Asia |
22,529 | 23,581 | 25,067 | 27,087 | 25,206 | |||||||||||||||
| Australia/Oceania |
969 | 1,012 | 1,070 | 1,174 | 1,262 | |||||||||||||||
|
|
|
|
||||||||||||||||||
| Total worldwide |
48,834 | 50,257 | 53,810 | 57,173 | 48,771 | |||||||||||||||
|
|
|
|
||||||||||||||||||
| (1) | ExxonMobil reserves determined in accordance with current SEC definitions. Proved reserves as defined by the SEC are based on the average of the market prices on the first day of each calendar month during the year and include mining and equity company reserves. See Frequently Used Terms on pages 90 through 93. |
| (2) | Proved reserves classified as bitumen are associated with the Cold Lake and Kearl projects in Canada. Proved reserves classified as synthetic oil are associated with the Syncrude project in Canada. Cold Lake uses in situ methods, and hydrocarbons are produced from wells drilled into the subsurface. Syncrude is an oil sands mining project which includes an upgrader that converts the mined hydrocarbons into a higher gravity crude oil. Kearl is an oil sands mining project that does not incorporate an upgrader. |
|
| ||
| PROVED OIL AND GAS RESERVES (1) | ||||||||||||||||||||||||||
|
2013 |
2012 | 2011 | 2010 | 2009 | ||||||||||||||||||||||
| Oil Equivalent, Including Oil Sands and Non-Consolidated Reserves (millions of barrels at year end) |
| |||||||||||||||||||||||||
| Net proved developed and undeveloped reserves |
|
|||||||||||||||||||||||||
| United States |
7,266 | 7,153 | 6,766 | 6,654 | 3,939 | |||||||||||||||||||||
| Canada/South America |
4,718 | 4,600 | 4,033 | 3,155 | 3,146 | |||||||||||||||||||||
| Europe |
2,277 | 2,504 | 2,698 | 2,919 | 3,212 | |||||||||||||||||||||
| Africa |
1,539 | 1,656 | 1,839 | 1,951 | 2,060 | |||||||||||||||||||||
| Asia |
7,928 | 7,740 | 8,126 | 8,630 | 9,100 | |||||||||||||||||||||
| Australia/Oceania |
1,488 | 1,511 | 1,470 | 1,500 | 1,528 | |||||||||||||||||||||
|
|
|
|
||||||||||||||||||||||||
| Total worldwide |
25,216 | 25,164 | 24,932 | 24,809 | 22,985 | |||||||||||||||||||||
|
|
|
|
||||||||||||||||||||||||
| PROVED OIL AND GAS RESERVES REPLACEMENT (1) | ||||||||||||||||||||||||||
| 2013 | 2012 | 2011 | 2010 | 2009 |
Average |
|||||||||||||||||||||
| Liquids (millions of barrels) |
||||||||||||||||||||||||||
| Revisions |
651 | 471 | 270 | 358 | 361 | 422 | ||||||||||||||||||||
| Improved recovery |
– | 23 | – | 5 | 15 | 9 | ||||||||||||||||||||
| Extensions/discoveries |
541 | 760 | 1,166 | 185 | 142 | 559 | ||||||||||||||||||||
| Purchases |
57 | 219 | 16 | 378 | – | 134 | ||||||||||||||||||||
| Sales |
(24 | ) | (86 | ) | (54 | ) | (21 | ) | (3 | ) | (38 | ) | ||||||||||||||
|
|
|
|
|
|
||||||||||||||||||||||
| Total additions |
1,225 | 1,387 | 1,398 | 905 | 515 | 1,086 | ||||||||||||||||||||
| Production |
802 | 799 | 843 | 883 | 870 | 839 | ||||||||||||||||||||
|
|
|
|
|
|
||||||||||||||||||||||
| Reserves replacement ratio, |
156 | 184 | 172 | 105 | 60 | 134 | ||||||||||||||||||||
| Reserves replacement ratio, |
153 | 174 | 166 | 102 | 59 | 129 | ||||||||||||||||||||
|
|
|
|
|
|
||||||||||||||||||||||
| Natural Gas (billions of cubic feet) |
||||||||||||||||||||||||||
| Revisions |
714 | (1,873 | ) | 64 | 879 | 135 | (16 | ) | ||||||||||||||||||
| Improved recovery |
– | – | – | – | – | – | ||||||||||||||||||||
| Extensions/discoveries |
1,108 | 4,383 | 2,682 | 1,988 | 5,694 | 3,171 | ||||||||||||||||||||
| Purchases |
675 | 509 | 303 | 12,789 | 8 | 2,857 | ||||||||||||||||||||
| Sales |
(114 | ) | (353 | ) | (523 | ) | (106 | ) | (13 | ) | (222 | ) | ||||||||||||||
|
|
|
|
|
|
||||||||||||||||||||||
| Total additions |
2,383 | 2,666 | 2,526 | 15,550 | 5,824 | 5,790 | ||||||||||||||||||||
| Production |
4,614 | 4,797 | 5,119 | 4,742 | 3,696 | 4,594 | ||||||||||||||||||||
|
|
|
|
|
|
||||||||||||||||||||||
| Reserves replacement ratio, |
54 | 63 | 60 | 330 | 158 | 131 | ||||||||||||||||||||
| Reserves replacement ratio, |
52 | 56 | 49 | 328 | 158 | 126 | ||||||||||||||||||||
|
|
|
|
|
|
||||||||||||||||||||||
| Oil Equivalent (millions of barrels) |
||||||||||||||||||||||||||
| Revisions |
770 | 159 | 281 | 505 | 383 | 420 | ||||||||||||||||||||
| Improved recovery |
– | 23 | – | 5 | 15 | 9 | ||||||||||||||||||||
| Extensions/discoveries |
726 | 1,490 | 1,613 | 516 | 1,091 | 1,087 | ||||||||||||||||||||
| Purchases |
170 | 304 | 67 | 2,510 | 1 | 610 | ||||||||||||||||||||
| Sales |
(43 | ) | (145 | ) | (141 | ) | (38 | ) | (5 | ) | (75 | ) | ||||||||||||||
|
|
|
|
|
|
||||||||||||||||||||||
| Total additions |
1,623 | 1,831 | 1,820 | 3,498 | 1,485 | 2,051 | ||||||||||||||||||||
| Production |
1,571 | 1,599 | 1,697 | 1,674 | 1,486 | 1,605 | ||||||||||||||||||||
|
|
|
|
|
|
||||||||||||||||||||||
| Reserves replacement ratio, |
106 | 124 | 116 | 211 | 100 | 132 | ||||||||||||||||||||
| Reserves replacement ratio, |
103 | 115 | 107 | 209 | 100 | 128 | ||||||||||||||||||||
|
|
|
|
|
|
||||||||||||||||||||||
| (1) | ExxonMobil reserves determined in accordance with current SEC definitions. Proved reserves as defined by the SEC are based on the average of the market prices on the first day of each calendar month during the year and include mining and equity company reserves. See Frequently Used Terms on pages 90 through 93. |
|
|
EXXONMOBIL 2013 FINANCIAL & OPERATING REVIEW | |
Upstream Operating Statistics, continued
| 2013 RESERVES CHANGES BY REGION (1) | ||||||||||||||||||||||||||||||||||||||||
| Crude Oil and Natural Gas Liquids | Bitumen | Synthetic Oil | ||||||||||||||||||||||||||||||||||||||
| United States |
Canada/ South America |
Europe | Africa | Asia | Australia/ Oceania |
Total | Canada/ South America |
Canada/ South America |
Liquids Total |
|||||||||||||||||||||||||||||||
| Liquids (millions of barrels) |
||||||||||||||||||||||||||||||||||||||||
| Revisions |
40 | 20 | 24 | 13 | 423 | 3 | 523 | 124 | 4 | 651 | ||||||||||||||||||||||||||||||
| Improved recovery |
– | – | – | – | – | – | – | – | – | – | ||||||||||||||||||||||||||||||
| Extensions/discoveries |
227 | – | – | 52 | 262 | – | 541 | – | – | 541 | ||||||||||||||||||||||||||||||
| Purchases |
36 | 21 | – | – | – | – | 57 | – | – | 57 | ||||||||||||||||||||||||||||||
| Sales |
(24 | ) | – | – | – | – | – | (24 | ) | – | – | (24 | ) | |||||||||||||||||||||||||||
|
|
|
|
||||||||||||||||||||||||||||||||||||||
| Total additions |
279 | 41 | 24 | 65 | 685 | 3 | 1,097 | 124 | 4 | 1,225 | ||||||||||||||||||||||||||||||
| Production |
(155 | ) | (25 | ) | (69 | ) | (172 | ) | (286 | ) | (17 | ) | (724 | ) | (54 | ) | (24 | ) | (802 | ) | ||||||||||||||||||||
| Net change |
124 | 16 | (45 | ) | (107 | ) | 399 | (14 | ) | 373 | 70 | (20 | ) | 423 | ||||||||||||||||||||||||||
|
|
|
|
||||||||||||||||||||||||||||||||||||||
| Reserves replacement ratio, excluding sales (percent) |
195 | 164 | 35 | 38 | 240 | 18 | 155 | 230 | 17 | 156 | ||||||||||||||||||||||||||||||
| Reserves replacement ratio, including sales (percent) |
180 | 164 | 35 | 38 | 240 | 18 | 152 | 230 | 17 | 153 | ||||||||||||||||||||||||||||||
|
|
|
|
||||||||||||||||||||||||||||||||||||||
| Natural Gas (billions of cubic feet) |
||||||||||||||||||||||||||||||||||||||||
| Revisions |
214 | (56 | ) | 119 | (22 | ) | 373 | 86 | 714 | |||||||||||||||||||||||||||||||
| Improved recovery |
– | – | – | – | – | – | – | |||||||||||||||||||||||||||||||||
| Extensions/discoveries |
1,084 | 2 | 8 | – | 14 | – | 1,108 | |||||||||||||||||||||||||||||||||
| Purchases |
153 | 522 | – | – | – | – | 675 | |||||||||||||||||||||||||||||||||
| Sales |
(106 | ) | (8 | ) | – | – | – | – | (114 | ) | ||||||||||||||||||||||||||||||
|
|
||||||||||||||||||||||||||||||||||||||||
| Total additions |
1,345 | 460 | 127 | (22 | ) | 387 | 86 | 2,383 | ||||||||||||||||||||||||||||||||
| Production |
(1,414 | ) | (150 | ) | (1,217 | ) | (40 | ) | (1,654 | ) | (139 | ) | (4,614 | ) | ||||||||||||||||||||||||||
| Net change |
(69 | ) | 310 | (1,090 | ) | (62 | ) | (1,267 | ) | (53 | ) | (2,231 | ) | |||||||||||||||||||||||||||
|
|
||||||||||||||||||||||||||||||||||||||||
| Reserves replacement ratio, excluding sales (percent) |
103 | 312 | 10 | – | 23 | 62 | 54 | |||||||||||||||||||||||||||||||||
| Reserves replacement ratio, including sales (percent) |
95 | 307 | 10 | – | 23 | 62 | 52 | |||||||||||||||||||||||||||||||||
|
|
||||||||||||||||||||||||||||||||||||||||
| (1) | See Frequently Used Terms on pages 90 through 93. |
|
| ||
| PROVED OIL AND GAS RESERVES REPLACEMENT(1) | ||||||||||||||||||||||||||
| (million barrels of oil or billion cubic feet of gas unless noted) |
2013 | 2012 | 2011 | 2010 | 2009 | Average 2009-2013 |
||||||||||||||||||||
| Non-U.S. |
||||||||||||||||||||||||||
| E&P costs (millions of dollars) |
27,081 | 22,305 | 20,024 | 17,619 | 17,985 | 21,003 | ||||||||||||||||||||
|
|
|
|
|
|
||||||||||||||||||||||
| Liquids reserves additions |
946 | 849 | 1,175 | 426 | 375 | 754 | ||||||||||||||||||||
| Liquids production |
647 | 647 | 689 | 735 | 731 | 690 | ||||||||||||||||||||
|
|
|
|
|
|
||||||||||||||||||||||
| Gas reserves additions |
1,038 | 1,138 | 712 | 179 | 5,340 | 1,681 | ||||||||||||||||||||
| Gas production |
3,200 | 3,273 | 3,560 | 3,680 | 3,124 | 3,367 | ||||||||||||||||||||
|
|
|
|
|
|
||||||||||||||||||||||
| Oil-equivalent reserves additions, |
1,121 | 1,135 | 1,425 | 459 | 1,266 | 1,081 | ||||||||||||||||||||
| Oil-equivalent reserves additions, |
1,120 | 1,038 | 1,295 | 456 | 1,264 | 1,035 | ||||||||||||||||||||
| Oil-equivalent production |
1,180 | 1,193 | 1,283 | 1,348 | 1,252 | 1,251 | ||||||||||||||||||||
|
|
|
|
|
|
||||||||||||||||||||||
| Reserves replacement ratio, |
95 | 95 | 111 | 34 | 101 | 86 | ||||||||||||||||||||
| Reserves replacement ratio, |
95 | 87 | 101 | 34 | 101 | 83 | ||||||||||||||||||||
| Reserves replacement |
24.16 | 19.65 | 14.05 | 38.39 | 14.21 | 19.43 | ||||||||||||||||||||
|
|
|
|
|
|
||||||||||||||||||||||
| United States |
||||||||||||||||||||||||||
| E&P costs (millions of dollars) |
8,884 | 10,245 | 11,956 | 54,107 | 3,541 | 17,747 | ||||||||||||||||||||
|
|
|
|
|
|
||||||||||||||||||||||
| Liquids reserves additions |
279 | 538 | 223 | 479 | 140 | 332 | ||||||||||||||||||||
| Liquids production |
155 | 152 | 154 | 148 | 139 | 150 | ||||||||||||||||||||
|
|
|
|
|
|
||||||||||||||||||||||
| Gas reserves additions |
1,345 | 1,528 | 1,814 | 15,371 | 484 | 4,108 | ||||||||||||||||||||
| Gas production |
1,414 | 1,524 | 1,559 | 1,062 | 572 | 1,226 | ||||||||||||||||||||
|
|
|
|
|
|
||||||||||||||||||||||
| Oil-equivalent reserves additions, |
545 | 841 | 536 | 3,077 | 224 | 1,045 | ||||||||||||||||||||
| Oil-equivalent reserves additions, |
503 | 793 | 525 | 3,041 | 221 | 1,017 | ||||||||||||||||||||
| Oil-equivalent production |
391 | 406 | 414 | 325 | 234 | 354 | ||||||||||||||||||||
|
|
|
|
|
|
||||||||||||||||||||||
| Reserves replacement ratio, |
139 | 207 | 129 | 947 | 96 | 295 | ||||||||||||||||||||
| Reserves replacement ratio, |
129 | 195 | 127 | 936 | 94 | 287 | ||||||||||||||||||||
| Reserves replacement |
16.30 | 12.18 | 22.31 | 17.58 | 15.81 | 16.98 | ||||||||||||||||||||
|
|
|
|
|
|
||||||||||||||||||||||
| Worldwide |
||||||||||||||||||||||||||
| E&P costs (millions of dollars) |
35,965 | 32,550 | 31,980 | 71,726 | 21,526 | 38,749 | ||||||||||||||||||||
|
|
|
|
|
|
||||||||||||||||||||||
| Liquids reserves additions |
1,225 | 1,387 | 1,398 | 905 | 515 | 1,086 | ||||||||||||||||||||
| Liquids production |
802 | 799 | 843 | 883 | 870 | 839 | ||||||||||||||||||||
|
|
|
|
|
|
||||||||||||||||||||||
| Gas reserves additions |
2,383 | 2,666 | 2,526 | 15,550 | 5,824 | 5,790 | ||||||||||||||||||||
| Gas production |
4,614 | 4,797 | 5,119 | 4,742 | 3,696 | 4,594 | ||||||||||||||||||||
|
|
|
|
|
|
||||||||||||||||||||||
| Oil-equivalent reserves additions, |
1,666 | 1,976 | 1,961 | 3,536 | 1,490 | 2,126 | ||||||||||||||||||||
| Oil-equivalent reserves additions, |
1,623 | 1,831 | 1,820 | 3,497 | 1,485 | 2,051 | ||||||||||||||||||||
| Oil-equivalent production |
1,571 | 1,599 | 1,697 | 1,673 | 1,486 | 1,605 | ||||||||||||||||||||
|
|
|
|
|
|
||||||||||||||||||||||
| Reserves replacement ratio, |
106 | 124 | 116 | 211 | 100 | 132 | ||||||||||||||||||||
| Reserves replacement ratio, |
103 | 115 | 107 | 209 | 100 | 128 | ||||||||||||||||||||
| Reserves replacement |
21.59 | 16.47 | 16.31 | 20.28 | 14.45 | 18.23 | ||||||||||||||||||||
|
|
|
|
|
|
||||||||||||||||||||||
| (1) | ExxonMobil reserves determined in accordance with current SEC definitions. Proved reserves as defined by the SEC are based on the average of the market prices on the first day of each calendar month during the year and include mining and equity company reserves. See Frequently Used Terms on pages 90 through 93. |
| (2) | Calculation based on exploration and production costs divided by oil-equivalent reserves additions. All values exclude the impact of asset sales; i.e., reserves sold and proceeds received. |
|
|
EXXONMOBIL 2013 FINANCIAL & OPERATING REVIEW | |
Upstream Operating Statistics, continued
| OIL AND GAS EXPLORATION AND PRODUCTION EARNINGS |
The revenue, cost, and earnings data are shown both on a total dollar and a unit basis, and are inclusive of non-consolidated and Canadian oil sands operations.
| Total Revenues and Costs, Including Non-Consolidated Interests and Oil Sands | Revenues and Costs per Unit of Sales or Production(1) | |||||||||||||||||||||||||||||||||||||||||||||
| United States |
Canada/ South America |
Europe | Africa | Asia | Australia/ Oceania |
Total | United States |
Canada/ South America |
Outside Americas |
Worldwide | ||||||||||||||||||||||||||||||||||||
| 2013 |
(millions of dollars) |
|
(dollars per unit of sales) |
| ||||||||||||||||||||||||||||||||||||||||||
| Revenue |
||||||||||||||||||||||||||||||||||||||||||||||
| Liquids |
13,350 | 7,558 | 6,751 | 18,811 | 28,440 | 1,596 | 76,506 | 84.87 | 75.28 | 101.92 | 95.25 | |||||||||||||||||||||||||||||||||||
| Natural gas |
3,880 | 360 | 11,384 | 6 | 13,477 | 539 | 29,646 | 3.00 | 2.80 | 8.77 | 6.86 | |||||||||||||||||||||||||||||||||||
|
|
(dollars per barrel of net oil-equivalent production) |
| ||||||||||||||||||||||||||||||||||||||||||||
| Total revenue |
17,230 | 7,918 | 18,135 | 18,817 | 41,917 | 2,135 | 106,152 | 46.20 | 63.93 | 78.86 | 69.66 | |||||||||||||||||||||||||||||||||||
| Less costs: |
||||||||||||||||||||||||||||||||||||||||||||||
| Production costs excluding taxes |
4,742 | 3,965 | 3,318 | 2,396 | 2,423 | 654 | 17,498 | 12.72 | 32.02 | 8.56 | 11.48 | |||||||||||||||||||||||||||||||||||
| Depreciation and depletion |
5,133 | 989 | 2,050 | 3,269 | 2,635 | 334 | 14,410 | 13.76 | 7.99 | 8.07 | 9.46 | |||||||||||||||||||||||||||||||||||
| Exploration expenses |
413 | 386 | 260 | 288 | 997 | 92 | 2,436 | 1.11 | 3.12 | 1.59 | 1.60 | |||||||||||||||||||||||||||||||||||
| Taxes other than income |
1,617 | 94 | 4,466 | 1,583 | 9,146 | 427 | 17,333 | 4.33 | 0.74 | 15.21 | 11.37 | |||||||||||||||||||||||||||||||||||
| Related income tax |
1,788 | 542 | 4,956 | 6,841 | 14,191 | 202 | 28,520 | 4.79 | 4.38 | 25.50 | 18.72 | |||||||||||||||||||||||||||||||||||
| Results of producing activities |
3,537 | 1,942 | 3,085 | 4,440 | 12,525 | 426 | 25,955 | 9.49 | 15.68 | 19.93 | 17.03 | |||||||||||||||||||||||||||||||||||
| Other earnings(2) |
662 | (495 | ) | 302 | 59 | 234 | (118 | ) | 644 | 1.77 | (4.00 | ) | 0.47 | 0.42 | ||||||||||||||||||||||||||||||||
| Total earnings, excluding power and coal |
4,199 | 1,447 | 3,387 | 4,499 | 12,759 | 308 | 26,599 | 11.26 | 11.68 | 20.40 | 17.45 | |||||||||||||||||||||||||||||||||||
| Power and coal |
(8 | ) | – | – | – | 250 | – | 242 | ||||||||||||||||||||||||||||||||||||||
| Total earnings |
4,191 | 1,447 | 3,387 | 4,499 | 13,009 | 308 | 26,841 | 11.23 | 11.68 | 20.64 | 17.61 | |||||||||||||||||||||||||||||||||||
| Unit Earnings Excluding NCI Volumes(3) | 18.03 | |||||||||||||||||||||||||||||||||||||||||||||
|
|
|
|||||||||||||||||||||||||||||||||||||||||||||
| 2012 |
(millions of dollars) | (dollars per unit of sales) | ||||||||||||||||||||||||||||||||||||||||||||
| Revenue |
||||||||||||||||||||||||||||||||||||||||||||||
| Liquids |
13,362 | 6,997 | 7,652 | 20,560 | 28,798 | 1,624 | 78,993 | 87.43 | 75.90 | 104.66 | 98.10 | |||||||||||||||||||||||||||||||||||
| Natural gas |
3,003 | 264 | 10,996 | 17 | 12,689 | 583 | 27,552 | 2.15 | 1.98 | 8.15 | 6.11 | |||||||||||||||||||||||||||||||||||
|
|
(dollars per barrel of net oil-equivalent production) |
| ||||||||||||||||||||||||||||||||||||||||||||
| Total revenue |
16,365 | 7,261 | 18,648 | 20,577 | 41,487 | 2,207 | 106,545 | 42.39 | 63.54 | 78.89 | 68.68 | |||||||||||||||||||||||||||||||||||
| Less costs: |
||||||||||||||||||||||||||||||||||||||||||||||
| Production costs excluding taxes |
4,511 | 3,079 | 2,812 | 2,395 | 2,090 | 488 | 15,375 | 11.68 | 26.94 | 7.41 | 9.91 | |||||||||||||||||||||||||||||||||||
| Depreciation and depletion |
5,038 | 848 | 1,711 | 2,879 | 2,461 | 264 | 13,201 | 13.05 | 7.42 | 6.96 | 8.51 | |||||||||||||||||||||||||||||||||||
| Exploration expenses |
400 | 292 | 291 | 234 | 513 | 136 | 1,866 | 1.04 | 2.56 | 1.12 | 1.20 | |||||||||||||||||||||||||||||||||||
| Taxes other than income |
2,005 | 89 | 4,082 | 1,702 | 8,906 | 446 | 17,230 | 5.20 | 0.78 | 14.39 | 11.12 | |||||||||||||||||||||||||||||||||||
| Related income tax |
1,561 | 720 | 6,307 | 8,091 | 14,850 | 281 | 31,810 | 4.04 | 6.30 | 28.10 | 20.50 | |||||||||||||||||||||||||||||||||||
| Results of producing activities |
2,850 | 2,233 | 3,445 | 5,276 | 12,667 | 592 | 27,063 | 7.38 | 19.54 | 20.91 | 17.44 | |||||||||||||||||||||||||||||||||||
| Other earnings(2) |
1,084 | (703 | ) | 526 | 1,943 | (200 | ) | (59 | ) | 2,591 | 2.81 | (6.15 | ) | 2.11 | 1.68 | |||||||||||||||||||||||||||||||
| Total earnings, excluding power and coal |
3,934 | 1,530 | 3,971 | 7,219 | 12,467 | 533 | 29,654 | 10.19 | 13.39 | 23.02 | 19.12 | |||||||||||||||||||||||||||||||||||
| Power and coal |
(9 | ) | – | – | – | 250 | – | 241 | ||||||||||||||||||||||||||||||||||||||
| Total earnings |
3,925 | 1,530 | 3,971 | 7,219 | 12,717 | 533 | 29,895 | 10.17 | 13.39 | 23.26 | 19.27 | |||||||||||||||||||||||||||||||||||
| Unit Earnings Excluding NCI Volumes(3) | 19.75 | |||||||||||||||||||||||||||||||||||||||||||||
| (1) | The per-unit data are divided into two sections: (a) revenue per unit of sales from ExxonMobil’s own production; and, (b) operating costs and earnings per unit of net oil-equivalent production. Units for crude oil and natural gas liquids are barrels, while units for natural gas are thousands of cubic feet. The volumes of crude oil and natural gas liquids production and net natural gas production available for sale used in this calculation are shown on pages 48 and 49. The volumes of natural gas were converted to oil-equivalent barrels based on a conversion factor of 6 thousand cubic feet per barrel. |
| (2) | Includes earnings related to transportation operations, LNG liquefaction and transportation operations, sale of third-party purchases, technical services agreements, other nonoperating activities, and adjustments for noncontrolling interests. |
| (3) | Calculation based on total earnings (net income attributable to ExxonMobil) divided by net oil-equivalent production less noncontrolling interest (NCI) volumes. |
|
| ||
Oil and Gas Exploration and Production Earnings (continued)
| Total Revenues and Costs, Including Non-Consolidated Interests and Oil Sands | Revenues and Costs per Unit of Sales or Production(1) | |||||||||||||||||||||||||||||||||||||||||||||
| United States |
Canada/ South America |
Europe | Africa | Asia | Australia/ Oceania |
Total | United States |
Canada/ South America |
Outside Americas |
Worldwide | ||||||||||||||||||||||||||||||||||||
| 2011 |
(millions of dollars) | (dollars per unit of sales) | ||||||||||||||||||||||||||||||||||||||||||||
| Revenue |
||||||||||||||||||||||||||||||||||||||||||||||
| Liquids |
14,362 | 7,584 | 10,149 | 20,204 | 29,411 | 1,793 | 83,503 | 92.80 | 83.06 | 102.99 | 98.97 | |||||||||||||||||||||||||||||||||||
| Natural gas |
4,926 | 494 | 11,278 | 7 | 11,311 | 481 | 28,497 | 3.45 | 3.29 | 7.16 | 5.93 | |||||||||||||||||||||||||||||||||||
|
|
(dollars per barrel of net oil-equivalent production) |
| ||||||||||||||||||||||||||||||||||||||||||||
| Total revenue |
19,288 | 8,078 | 21,427 | 20,211 | 40,722 | 2,274 | 112,000 | 49.10 | 69.25 | 74.58 | 68.11 | |||||||||||||||||||||||||||||||||||
| Less costs: |
||||||||||||||||||||||||||||||||||||||||||||||
| Production costs excluding taxes |
4,589 | 2,751 | 3,037 | 2,608 | 2,050 | 497 | 15,532 | 11.68 | 23.58 | 7.22 | 9.45 | |||||||||||||||||||||||||||||||||||
| Depreciation and depletion |
4,815 | 980 | 2,088 | 2,159 | 2,256 | 236 | 12,534 | 12.26 | 8.40 | 5.94 | 7.62 | |||||||||||||||||||||||||||||||||||
| Exploration expenses |
278 | 290 | 612 | 233 | 618 | 73 | 2,104 | 0.71 | 2.49 | 1.35 | 1.28 | |||||||||||||||||||||||||||||||||||
| Taxes other than income |
2,193 | 79 | 3,626 | 2,055 | 8,337 | 295 | 16,585 | 5.58 | 0.68 | 12.61 | 10.08 | |||||||||||||||||||||||||||||||||||
| Related income tax |
2,445 | 969 | 7,689 | 7,888 | 14,062 | 353 | 33,406 | 6.22 | 8.31 | 26.43 | 20.32 | |||||||||||||||||||||||||||||||||||
| Results of producing activities |
4,968 | 3,009 | 4,375 | 5,268 | 13,399 | 820 | 31,839 | 12.65 | 25.79 | 21.03 | 19.36 | |||||||||||||||||||||||||||||||||||
| Other earnings(2) |
133 | (322 | ) | 2,729 | 88 | (259 | ) | (9 | ) | 2,360 | 0.33 | (2.76 | ) | 2.24 | 1.44 | |||||||||||||||||||||||||||||||
| Total earnings, excluding power and coal |
5,101 | 2,687 | 7,104 | 5,356 | 13,140 | 811 | 34,199 | 12.98 | 23.03 | 23.27 | 20.80 | |||||||||||||||||||||||||||||||||||
| Power and coal |
(5 | ) | – | – | – | 245 | – | 240 | ||||||||||||||||||||||||||||||||||||||
| Total earnings |
5,096 | 2,687 | 7,104 | 5,356 | 13,385 | 811 | 34,439 | 12.97 | 23.03 | 23.49 | 20.94 | |||||||||||||||||||||||||||||||||||
| Unit Earnings Excluding NCI Volumes(3) | 21.28 | |||||||||||||||||||||||||||||||||||||||||||||
|
|
|
|||||||||||||||||||||||||||||||||||||||||||||
| 2010 |
(millions of dollars) | (dollars per unit of sales) | ||||||||||||||||||||||||||||||||||||||||||||
| Revenue |
||||||||||||||||||||||||||||||||||||||||||||||
| Liquids |
10,567 | 6,343 | 8,935 | 17,511 | 19,118 | 1,418 | 63,892 | 70.98 | 66.27 | 74.67 | 73.12 | |||||||||||||||||||||||||||||||||||
| Natural gas |
3,716 | 707 | 9,358 | 11 | 7,990 | 401 | 22,183 | 3.92 | 3.41 | 5.42 | 5.00 | |||||||||||||||||||||||||||||||||||
|
|
(dollars per barrel of net oil-equivalent production) |
| ||||||||||||||||||||||||||||||||||||||||||||
| Total revenue |
14,283 | 7,050 | 18,293 | 17,522 | 27,108 | 1,819 | 86,075 | 46.53 | 54.18 | 54.59 | 53.04 | |||||||||||||||||||||||||||||||||||
| Less costs: |
||||||||||||||||||||||||||||||||||||||||||||||
| Production costs excluding taxes |
3,275 | 2,612 | 3,011 | 2,215 | 1,628 | 462 | 13,203 | 10.67 | 20.07 | 6.17 | 8.14 | |||||||||||||||||||||||||||||||||||
| Depreciation and depletion |
3,507 | 1,015 | 2,719 | 2,580 | 1,596 | 219 | 11,636 | 11.43 | 7.80 | 6.00 | 7.17 | |||||||||||||||||||||||||||||||||||
| Exploration expenses |
287 | 464 | 413 | 587 | 362 | 56 | 2,169 | 0.94 | 3.57 | 1.20 | 1.34 | |||||||||||||||||||||||||||||||||||
| Taxes other than income |
1,220 | 86 | 2,997 | 1,742 | 5,142 | 204 | 11,391 | 3.96 | 0.67 | 8.49 | 7.02 | |||||||||||||||||||||||||||||||||||
| Related income tax |
2,093 | 715 | 5,543 | 6,068 | 9,147 | 262 | 23,828 | 6.82 | 5.49 | 17.73 | 14.68 | |||||||||||||||||||||||||||||||||||
| Results of producing activities |
3,901 | 2,158 | 3,610 | 4,330 | 9,233 | 616 | 23,848 | 12.71 | 16.58 | 15.00 | 14.69 | |||||||||||||||||||||||||||||||||||
| Other earnings(2) |
379 | (538 | ) | 216 | 96 | (120 | ) | (15 | ) | 18 | 1.23 | (4.13 | ) | 0.15 | 0.02 | |||||||||||||||||||||||||||||||
| Total earnings, excluding power and coal |
4,280 | 1,620 | 3,826 | 4,426 | 9,113 | 601 | 23,866 | 13.94 | 12.45 | 15.15 | 14.71 | |||||||||||||||||||||||||||||||||||
| Power and coal |
(8 | ) | – | – | – | 239 | – | 231 | ||||||||||||||||||||||||||||||||||||||
| Total earnings |
4,272 | 1,620 | 3,826 | 4,426 | 9,352 | 601 | 24,097 | 13.91 | 12.45 | 15.35 | 14.85 | |||||||||||||||||||||||||||||||||||
| |
Unit Earnings Excluding NCI Volumes(3) |
|
15.09 | |||||||||||||||||||||||||||||||||||||||||||
|
|
|
|||||||||||||||||||||||||||||||||||||||||||||
| 2009 |
(millions of dollars) | (dollars per unit of sales) | ||||||||||||||||||||||||||||||||||||||||||||
| Revenue |
||||||||||||||||||||||||||||||||||||||||||||||
| Liquids |
7,573 | 5,135 | 7,739 | 14,868 | 12,941 | 1,311 | 49,567 | 54.02 | 51.88 | 58.53 | 57.04 | |||||||||||||||||||||||||||||||||||
| Natural gas |
1,442 | 748 | 9,080 | 12 | 4,237 | 341 | 15,860 | 3.10 | 3.19 | 5.09 | 4.69 | |||||||||||||||||||||||||||||||||||
|
|
(dollars per barrel of net oil-equivalent production) |
| ||||||||||||||||||||||||||||||||||||||||||||
| Total revenue |
9,015 | 5,883 | 16,819 | 14,880 | 17,178 | 1,652 | 65,427 | 41.41 | 43.02 | 46.74 | 45.58 | |||||||||||||||||||||||||||||||||||
| Less costs: |
||||||||||||||||||||||||||||||||||||||||||||||
| Production costs excluding taxes |
2,736 | 2,428 | 2,923 | 2,027 | 1,498 | 386 | 11,998 | 12.57 | 17.75 | 6.32 | 8.36 | |||||||||||||||||||||||||||||||||||
| Depreciation and depletion |
1,833 | 948 | 2,246 | 2,293 | 1,182 | 195 | 8,697 | 8.42 | 6.93 | 5.47 | 6.06 | |||||||||||||||||||||||||||||||||||
| Exploration expenses |
220 | 339 | 387 | 662 | 393 | 33 | 2,034 | 1.01 | 2.48 | 1.36 | 1.42 | |||||||||||||||||||||||||||||||||||
| Taxes other than income |
767 | 78 | 2,826 | 1,343 | 3,111 | 252 | 8,377 | 3.52 | 0.57 | 6.97 | 5.83 | |||||||||||||||||||||||||||||||||||
| Related income tax |
1,127 | 597 | 5,179 | 4,667 | 5,943 | 237 | 17,750 | 5.18 | 4.37 | 14.83 | 12.37 | |||||||||||||||||||||||||||||||||||
| Results of producing activities |
2,332 | 1,493 | 3,258 | 3,888 | 5,051 | 549 | 16,571 | 10.71 | 10.92 | 11.79 | 11.54 | |||||||||||||||||||||||||||||||||||
| Other earnings(2) |
565 | (605 | ) | 325 | 81 | (86 | ) | 36 | 316 | 2.60 | (4.43 | ) | 0.33 | 0.22 | ||||||||||||||||||||||||||||||||
| Total earnings, excluding power and coal |
2,897 | 888 | 3,583 | 3,969 | 4,965 | 585 | 16,887 | 13.31 | 6.49 | 12.12 | 11.76 | |||||||||||||||||||||||||||||||||||
| Power and coal |
(4 | ) | – | – | – | 224 | – | 220 | ||||||||||||||||||||||||||||||||||||||
| Total earnings |
2,893 | 888 | 3,583 | 3,969 | 5,189 | 585 | 17,107 | 13.29 | 6.49 | 12.33 | 11.92 | |||||||||||||||||||||||||||||||||||
| Unit Earnings Excluding NCI Volumes(3) | 12.15 | |||||||||||||||||||||||||||||||||||||||||||||
See footnotes on page 56.
|
| ||
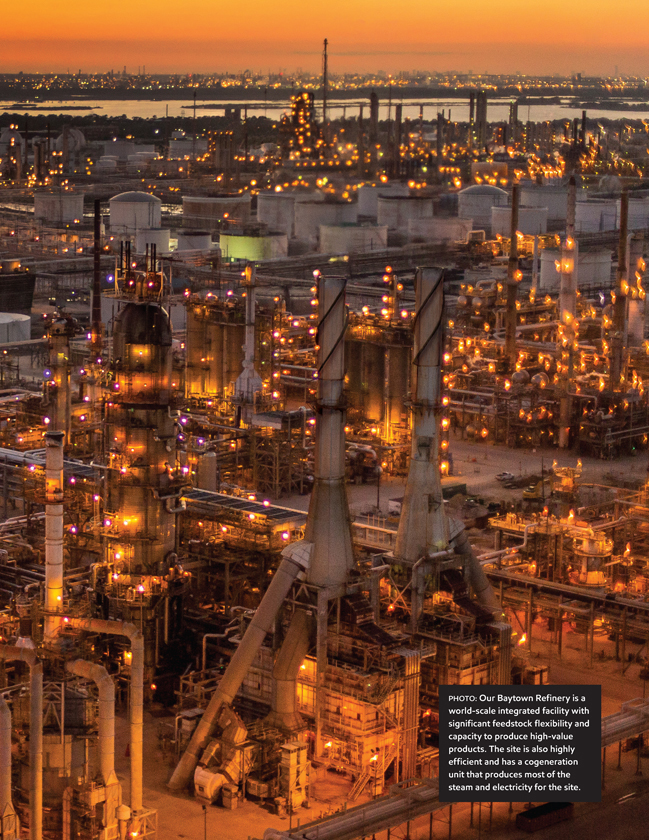
|
|
EXXONMOBIL 2013 FINANCIAL & OPERATING REVIEW | |
| Downstream
| ||||||||||||||||
| ExxonMobil’s premier Downstream business comprises Refining & Supply; Fuels, Lubricants & Specialties Marketing; and a world-class Research and Engineering organization. Our integrated business model and strategies underpin our continued success throughout the business cycle. | STRATEGIES
• Maintain best-in-class operations
• Provide quality,
valued products and services
• Lead industry in efficiency and effectiveness
• Capitalize on integration across ExxonMobil
• Maintain capital discipline
• Maximize value from leading-edge technologies | |||||||||||||||
|
RESULTS & HIGHLIGHTS
• Strong safety and operational performance
• Reduced flaring by more than 50 percent since 2006, our best-ever flaring performance
• Record sales of our industry-leading lubricants Mobil 1, Mobil Delvac 1, and Mobil SHC
• Expanded U.S. branded retail site network, including completion of multiyear
conversion to a
• Earnings of nearly $3.5 billion enabled by continued margin and efficiency capture, and
• Return on
average capital employed of 14.1 percent, consistently leading industry throughout
• Downstream capital expenditures of $2.4 billion, including investments in feedstock
flexibility,
• Commissioned a new diesel hydrotreater in Singapore to increase ultra-low sulfur
diesel
| ||||||||||||||||
|
DOWNSTREAM STATISTICAL RECAP
|
2013
|
2012
|
2011
|
2010
|
2009
|
|||||||||||
| Earnings (millions of dollars) |
3,449 | 13,190 | 4,459 | 3,567 | 1,781 | |||||||||||
| Refinery throughput (thousands of barrels per day) |
4,585 | 5,014 | 5,214 | 5,253 | 5,350 | |||||||||||
| Petroleum product sales (thousands of barrels per day) |
5,887 | 6,174 | 6,413 | 6,414 | 6,428 | |||||||||||
| Average capital employed(1) (millions of dollars) |
24,430 | 24,031 | 23,388 | 24,130 | 25,099 | |||||||||||
| Return on average capital employed(1) (percent) |
14.1 | 54.9 | 19.1 | 14.8 | 7.1 | |||||||||||
| Capital expenditures(1) (millions of dollars) |
2,413 | 2,262 | 2,120 | 2,505 | 3,196 | |||||||||||
|
(1) See Frequently Used Terms on pages 90 through 93.
| ||||||||||||||||
|
| ||
BUSINESS OVERVIEW
ExxonMobil Downstream is a diverse business with a global portfolio of world-class refining and distribution facilities, lube oil blend plants, marketing operations, and brands. We are the world’s largest refiner and lube basestock manufacturer, with a balanced set of assets and flexible operations that position us to capture opportunities in the high-growth Asia Pacific region as well as in the mature North American and European markets.
We hold an ownership interest in 31 refineries with distillation capacity of 5.3 million barrels per day and lubricant basestock capacity of 126 thousand barrels per day. We are an industry leader in integration with more than 75 percent of our refining operations integrated with chemical or lubricant production, which provides unique optimization capability across the entire value chain.
Our fuels and lubricants marketing businesses have global reach and a portfolio of world-renowned brands, including Exxon, Mobil, and Esso. Our long-standing record of technology leadership underpins the innovative products and services that deliver superior performance for consumers and long-term value for shareholders.
BUSINESS ENVIRONMENT
By 2040, demand for transportation fuel is expected to increase by more than 40 percent versus 2010, driven by growth in developing markets such as China, India, and Latin America. Transportation fuel mix will continue to shift from gasoline to diesel with the expansion of commercial transportation, primarily in developing countries. Gasoline demand growth is expected to flatten with improved passenger vehicle efficiency while diesel demand is expected to grow in all regions.
Natural gas is also likely to grow in use as a transportation fuel, with its attractiveness enhanced by its relatively low emissions and its affordability relative to oil in many parts of the world. In 2010, natural gas accounted for about 1 percent of all transportation fuels, with about 45 percent of that demand concentrated in Asia Pacific. By 2040, the share of natural gas as a transportation fuel will likely rise to 5 percent, with growth driven by Asia Pacific and North America.
Lubricant demand is also expected to grow on increased industrial activity, particularly in Asia. Within the high-value synthetic lubricants sector where ExxonMobil has a leading market position, demand is growing significantly faster at 5 percent per year.
The addition of new refining capacity is currently outpacing global demand growth, resulting in a challenging business environment. Additionally, the increase in crude oil and natural gas production in the United States and Canada is resulting in a shift in crude oil and product trade flows, and refineries in North America are benefiting from lower feedstock and energy prices. With our integrated business model, world-class assets, and feedstock flexibility, we are able to capture strong margins at the top of the cycle while still outperforming competition at the bottom of the cycle.
Transportation Fuel Mix by Region
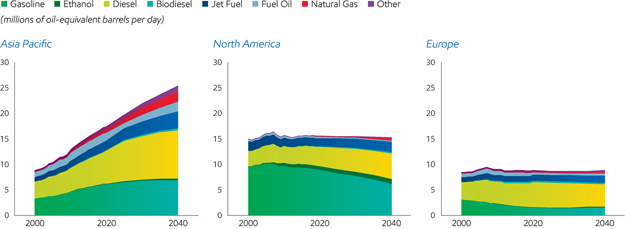
Source: ExxonMobil, 2014 The Outlook for Energy: A View to 2040
|
|
EXXONMOBIL 2013 FINANCIAL & OPERATING REVIEW | |
Global Downstream Portfolio
ExxonMobil is the world’s largest integrated refiner and manufacturer of lube basestocks and a leading marketer of petroleum products. The quality, size, and diversity of our Downstream portfolio are unparalleled and lead to strong financial and operating results in a wide range of market conditions.
With a network of 31 refineries, we are one of the most geographically balanced petroleum refiners in the world. This diversity provides flexibility in acquiring advantaged feedstocks and supplying refined products to major markets. Our lube oil blend plants are equally well located across the globe to support demand in key markets.
We sell a wide range of petroleum products in more than 120 countries, including transportation fuels such as gasoline and diesel that are sold under our global brands Exxon, Mobil, and Esso. We are a market leader in high-value synthetic lubricants, including our Mobil 1 product line, and we continue to grow the business in key markets at rates considerably faster than that of industry. Our strong refining and distribution network, combined with high-quality products and marketing expertise, position us as a leading supplier around the world.
UNITED STATES
ExxonMobil operates seven refineries in the United States with a total processing capacity of nearly 2 million barrels per day, representing approximately 35 percent of our global refining capacity. These world-class facilities have flexibility to process a wide variety of different feedstocks, and many are highly integrated with chemical and lubes manufacturing.
Additionally, we have a major presence in the logistics and distribution sector, including thousands of miles of operated pipeline that transport more than 3 million barrels per day of crude oil, refined products, liquefied petroleum gases, natural gas liquids, and chemical feedstocks. We also operate 22 distribution terminals and three salt dome storage facilities.
In the lubricants business, ExxonMobil operates five lube oil blend plants in the United States, which supply high-quality finished lubricants, including our Mobil 1 product line, to customers around the world. Lubricant basestocks are primarily sourced from our refineries and chemical plants. Our fuels marketing operations in the United States include a mix of more than 9,000 branded retail sites and business-to-business relationships, serving the needs of a diverse range of consumers while providing secure, ratable outlets for our refineries.
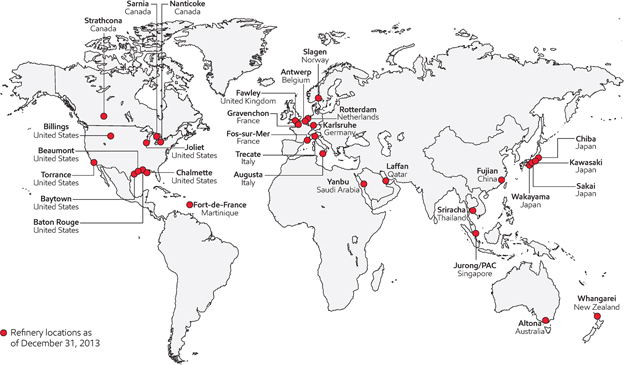
|
| ||
A key factor behind the success of our U.S. retail business is our conversion to a branded wholesaler model that was completed last year. This conversion entailed selling our company-owned retail sites to independent branded wholesalers who specialize in operating retail sites and convenience stores, while allowing ExxonMobil to focus on supplying the highest-quality fuels supported by innovative brand marketing and technology.
CANADA
With more than 400 thousand barrels per day of refining capacity, ExxonMobil is Canada’s largest refiner of petroleum products through our majority-owned affiliate Imperial Oil (ExxonMobil interest, 69.6 percent). In our fuels marketing business, we sell high-quality products through approximately 1,700 Esso-branded retail service stations, the largest network of service stations in Canada. We also market quality fuels and lubricants to a wide range of commercial customers, including those in the mining, manufacturing, forestry, construction, agriculture, and transportation industries.
EUROPE
European operations represent about 30 percent of ExxonMobil’s global refining capacity. Our integrated manufacturing circuit and business approach, including world-scale refineries in Antwerp, Fawley, Gravenchon, and Rotterdam, allow us to optimize our operations and maximize value in a competitive marketplace. We continue to invest in resilient and advantaged projects – including the installation of new facilities and the upgrade of existing facilities – to increase the production of high-value products such as ultra-low sulfur diesel.
We market fuels products across the region through a retail network of more than 6,000 service stations. We also market fuels and lubricant products directly to commercial segments, such as aviation, industrial, wholesale, equipment manufacturers, and marine. We are expanding our high-performance lube manufacturing capacity to serve growing demand across Europe and Russia.
ASIA PACIFIC
Approximately 20 percent of ExxonMobil’s global refining capacity is located in the Asia Pacific region. Our network of five lube oil blend plants supplies products throughout the region, including key growth markets such as China and India.
Singapore serves as the Asia Pacific hub for our Downstream and Chemical businesses. Our Singapore Refinery, the largest in our global network, has nearly 600 thousand barrels per day of crude distillation capacity and is the largest lubricant basestock refinery in the region. The site produces a range of products as well as feedstocks for our integrated chemical manufacturing facilities. In 2013, we commissioned a new diesel hydrotreater at the Singapore Refinery, which increased the site’s ultra-low sulfur diesel production capacity to meet increasing demand in the region.
Exxon, Mobil, and Esso-branded retail sites around the world serve growing consumer demand in places like Fuzhou, China, while providing ratable outlets for our refineries.

|
|
EXXONMOBIL 2013 FINANCIAL & OPERATING REVIEW | |
Enhancing Shareholder Value
| Our Downstream business enhances shareholder value by leveraging integration and technology to minimize raw material cost, maximize product value, and improve operating efficiency.
THE VALUE OF THE INTEGRATED MODEL
We derive significant value from our globally integrated business model, which enables us to maximize the value of every molecule that we produce from the wellhead to the consumer. More than 75 percent of our refining operations are integrated with chemical or lubes manufacturing. At these integrated sites, complex models are used to decide in real time whether molecules should be manufactured into gasoline, diesel, jet fuel, chemicals, lubricants, or other products based on current market conditions. Fully integrated marketing and sales teams generate consumer demand and ensure that we maximize the value of our products.
Integration also maximizes value during Upstream resource evaluation and development. During the early stages of an Upstream project, our Downstream business provides technical and commercial expertise as well as world-class refining and logistics assets to develop market outlets, identify and resolve challenging crude properties, and optimize logistics.
Our integrated organizational structure also minimizes cost and improves operations. For example, at each of our integrated sites, we have a shared site management and support services structure, which reduces overhead and administrative cost. We also leverage common utilities and infrastructure to reduce our energy and maintenance expense. |
Shared site management, support services, utilities, and infrastructure lead to lower cost at integrated refining, chemical, and lubricant manufacturing complexes such as our Fawley Refinery.
Refining Integration with Chemicals and Lubes
(percent)
Source: Parpinelli Tecnon, PIRA data |
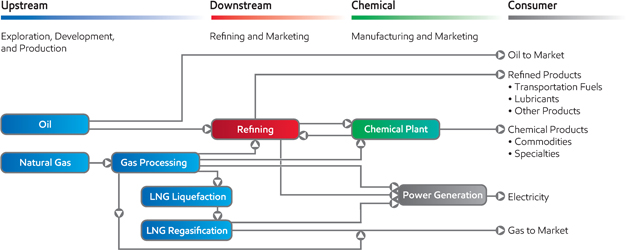
|
| ||
| MINIMIZING RAW MATERIAL COST
Leading-edge technology platforms enable us to minimize raw material cost to our refineries. We leverage our expertise in process technology, catalysts, modeling, and optimization to increase the flexibility of our facilities and allow us to process the lowest cost feedstock available. Improved understanding of the molecular properties of potential feedstock sources allows us to both optimize raw material selection and maximize high-value product yields.
Our industry leadership in the processing of challenged crudes illustrates our technological advantage. Challenged crudes are more difficult to process, mainly due to their chemical properties, and thus, are typically sold at a discount. Due in large part to our technology, ExxonMobil is able to process about 55-percent more challenged crudes than industry, which provides a significant cost advantage and higher margins.
Another example of how ExxonMobil’s technology results in lower raw material cost is our proprietary compositional lubes crude approval system, which significantly increases the mix of crudes available for lubes manufacturing. On average, ExxonMobil refineries are able to produce conventional lubricant basestocks from 15 different types of crude oil per site, three times higher than the industry average, which results in lower costs and higher margins.
Advantaged logistics also play a key role in minimizing raw material cost. ExxonMobil has a strong network of pipeline, rail, ship, and barge logistics capabilities that are continuously optimized in order to supply the most economical raw materials to our facilities. |
ExxonMobil is an industry leader in feedstock flexibility and challenged crude processing. For example, our Joliet Refinery is able to process significant volumes of lower cost, heavy Canadian crude. | |
|
Our network of pipeline, rail, ship, and barge logistics is continuously optimized in order to minimize raw material cost at facilities such as our Strathcona Refinery. |
Challenged Crudes
(1) ExxonMobil estimate based on public information. | |

|
EXXONMOBIL 2013 FINANCIAL & OPERATING REVIEW | |
Enhancing Shareholder Value, continued
| MAXIMIZING PRODUCT VALUE
We combined our Fuels Marketing and Lubricants & Petroleum Specialties divisions in 2012 to create a truly world-class, integrated Fuels, Lubricants and Specialties Marketing company. The combined organization is leveraging industry-leading marketing and sales expertise to maximize shareholder value by profitably growing the highest-value marketing channels. For example, retail sales through Exxon, Mobil, and Esso-branded stations represent the highest-value channel for our fuel products, and we are expanding our U.S. branded retail site network. Our store count increased in 2013, and further growth is expected in the future. To support our technologically advantaged products, new brand loyalty programs such as our partnerships with leading grocery chains, and innovative technology such as smartphone mobile payments, are aimed at delivering superior customer value.
Integrated, cross-functional business teams evaluate refinery product placement alternatives in each market around the world to optimize sales and maximize the value of every molecule that we produce. These teams |
Advantaged facilities such as our finished lubricants filling line in Singapore are ideally located to serve high-growth markets in that region.
| |
| combine expertise in manufacturing, supply chain, technology, logistics, marketing, and sales to develop and execute strategies that maximize earnings. | ||
Leading-edge product technology platforms also contribute to maximizing product value. Our advanced analytical and modeling capabilities generate a molecular-level understanding of our products, enabling the development of new technologies to further improve value to our customers. For example, in our industry-leading Mobil 1 AFE product line, application of our advanced research and development programs has yielded enhanced fuel economy while simultaneously lowering emissions, improving
|
Ongoing research and development by scientists at locations such as our Paulsboro research lab in New Jersey underpins the development of technological breakthroughs that improve the value of our products. |
engine protection, and extending equipment life. Endorsements by the makers of premier brands such as Porsche, Bentley, Mercedes AMG, Corvette, and Lexus are a testament to our lubricant technology leadership. | |
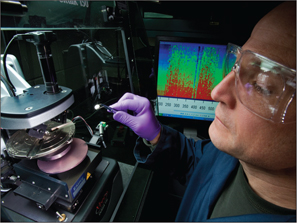
|
Mobil 1 Sales Growth
(volume, indexed)
| |
|
| ||
| IMPROVING OPERATING EFFICIENCY
Driven by our talented and dedicated workforce, the disciplined execution of our proven management systems leads to best-in-class operational performance and efficiency.
We have a relentless focus on maintaining best-in-class operational efficiency. Worldwide cash operating cost for our portfolio of refineries has been well below the industry average and consistently outperforms major competitors. Our refineries are more than 75-percent larger than the industry average, enabling us to reduce unit production costs by sharing services and capitalizing on operational synergies at sites integrated with chemical facilities.
Maximizing energy efficiency is vital to our success. With energy representing as much as 60 percent of the operating cost of a refinery, even small efficiency improvements can make a significant difference.
Since 2002, we have improved our energy efficiency by 10 percent, enabled by the application of our proven Global Energy Management System (GEMS) and strategic investments. Rigorously and consistently deployed around the globe, GEMS defines the standards by which our facilities are operated in order to achieve best-in-class energy efficiency. Also, building on our leadership position in cogeneration, in 2013 we commissioned a new project at our refinery in Augusta, Italy, which increased the efficiency of the site by 6 percent. We are progressing plans for the next project at our refinery in Singapore. |
Our newest cogeneration facility at our Augusta Refinery in Italy was commissioned in 2013. These highly efficient facilities provide a significant portion of the energy to our refineries. | |
| Average Refinery Size(1)
Source: Oil & Gas Journal (1) ExxonMobil average global refinery distillation capacity compared to industry equity share capacity (year-end 2013). Equity share capacity calculated on consistent basis using public information. |
Refinery Unit Cash Operating Expenses(2)(3)(4)
Source: Solomon Associates (2) Solomon Associates fuels refining data available for even years only. (3) 2013 data estimated by ExxonMobil. (4) Constant foreign exchange rates and energy price. (5) Constant year-end 2013 portfolio. | |
|
|
EXXONMOBIL 2013 FINANCIAL & OPERATING REVIEW | |
DOWNSTREAM OPERATING STATISTICS
| THROUGHPUT, CAPACITY, AND UTILIZATION(1) | ||||||||||||||||||||
| 2013 | 2012 | 2011 | 2010 | 2009 | ||||||||||||||||
|
Refinery Throughput(2) (thousands of barrels per day) |
| |||||||||||||||||||
| United States |
1,819 | 1,816 | 1,784 | 1,753 | 1,767 | |||||||||||||||
| Canada |
426 | 435 | 430 | 444 | 413 | |||||||||||||||
| Europe |
1,400 | 1,504 | 1,528 | 1,538 | 1,548 | |||||||||||||||
| Asia Pacific |
779 | 998 | 1,180 | 1,249 | 1,328 | |||||||||||||||
| Middle East/Other
|
161 | 261 | 292 | 269 | 294 | |||||||||||||||
|
|
|
|
||||||||||||||||||
|
Total worldwide
|
4,585 | 5,014 | 5,214 | 5,253 | 5,350 | |||||||||||||||
|
|
|
|
||||||||||||||||||
|
Average Refining Capacity(3) (thousands of barrels per day) |
| |||||||||||||||||||
| United States |
1,951 | 1,951 | 1,952 | 1,962 | 1,970 | |||||||||||||||
| Canada |
485 | 506 | 506 | 505 | 502 | |||||||||||||||
| Europe |
1,644 | 1,761 | 1,752 | 1,744 | 1,742 | |||||||||||||||
| Asia Pacific |
1,059 | 1,285 | 1,685 | 1,711 | 1,686 | |||||||||||||||
| Middle East/Other
|
202 | 274 | 331 | 331 | 331 | |||||||||||||||
|
|
|
|
||||||||||||||||||
| Total worldwide
|
5,341 | 5,777 | 6,226 | 6,253 | 6,231 | |||||||||||||||
|
|
|
|
||||||||||||||||||
|
Utilization of Refining Capacity (percent) |
| |||||||||||||||||||
| United States |
93 | 93 | 91 | 89 | 90 | |||||||||||||||
| Canada |
88 | 86 | 85 | 88 | 82 | |||||||||||||||
| Europe |
85 | 85 | 87 | 88 | 89 | |||||||||||||||
| Asia Pacific |
74 | 78 | 70 | 73 | 79 | |||||||||||||||
| Middle East/Other
|
80 | 95 | 88 | 81 | 89 | |||||||||||||||
|
|
|
|
||||||||||||||||||
| Total worldwide
|
86 | 87 | 84 | 84 | 86 | |||||||||||||||
|
|
|
|
||||||||||||||||||
| (1) | Excludes ExxonMobil’s interest in the Laffan Refinery in Qatar and ExxonMobil’s minor interests in certain small refineries. |
| (2) | Refinery throughput includes 100 percent of crude oil and feedstocks sent directly to atmospheric distillation units in operations of ExxonMobil and majority-owned subsidiaries. For companies owned 50 percent or less, throughput includes the greater of either crude and feedstocks processed for ExxonMobil or ExxonMobil’s equity interest in raw material inputs. |
| (3) | Refining capacity is the stream-day capability to process inputs to atmospheric distillation units under normal operating conditions, less the impact of shutdowns for regular repair and maintenance activities, averaged over an extended period of time. These annual averages include partial-year impacts for capacity additions or deletions during the year. Any idle capacity that cannot be made operable in a month or less has been excluded. Capacity volumes include 100 percent of the capacity of refinery facilities managed by ExxonMobil or majority-owned subsidiaries. At facilities of companies owned 50 percent or less, the greater of either that portion of capacity normally available to ExxonMobil or ExxonMobil’s equity interest is included. |
| Distillation Capacity by Region
(percent, year-end 2013)
|
Conversion Capacity by Region
(percent, year-end 2013)
|
|
| ||
| REFINING CAPACITY AT YEAR-END 2013(1) | ||||||||||||||||||||||||||||||||||||
|
(thousands of barrels per day) |
Capacity at 100% |
|||||||||||||||||||||||||||||||||||
|
|
Exxon Mobil Share |
(2) |
|
Atmospheric Distillation |
|
Catalytic Cracking |
Hydrocracking | Residuum Conversion(3) |
Lubricants | (4) |
|
ExxonMobil Interest % |
| |||||||||||||||||||||||
| United States |
||||||||||||||||||||||||||||||||||||
| Torrance |
California | l | 150 | 150 | 83 | 21 | 50 | 0 | 100 | |||||||||||||||||||||||||||
| Joliet |
Illinois | l | 238 | 238 | 94 | 0 | 56 | 0 | 100 | |||||||||||||||||||||||||||
| Baton Rouge |
Louisiana | n | l | 502 | 502 | 232 | 25 | 117 | 16 | 100 | ||||||||||||||||||||||||||
| Chalmette |
Louisiana | l | p | 95 | 189 | 72 | 0 | 29 | 0 | 50 | ||||||||||||||||||||||||||
| Billings |
Montana | l | 60 | 60 | 19 | 6 | 10 | 0 | 100 | |||||||||||||||||||||||||||
| Baytown |
Texas | n | l | 561 | 561 | 204 | 27 | 90 | 22 | 100 | ||||||||||||||||||||||||||
| Beaumont |
Texas | n | l | 345 | 345 | 113 | 60 | 46 | 10 | 100 | ||||||||||||||||||||||||||
| Total United States |
1,951 | 2,045 | 817 | 139 | 398 | 48 | ||||||||||||||||||||||||||||||
| Canada |
||||||||||||||||||||||||||||||||||||
| Strathcona |
Alberta | 189 | 189 | 64 | 0 | 0 | 2 | 69.6 | ||||||||||||||||||||||||||||
| Nanticoke |
Ontario | p | 113 | 113 | 48 | 0 | 0 | 0 | 69.6 | |||||||||||||||||||||||||||
| Sarnia |
Ontario | n | l | 119 | 119 | 30 | 18 | 25 | 0 | 69.6 | ||||||||||||||||||||||||||
| Total Canada |
421 | 421 | 142 | 18 | 25 | 2 | ||||||||||||||||||||||||||||||
| Europe |
||||||||||||||||||||||||||||||||||||
| Antwerp |
Belgium | n | l | 307 | 307 | 35 | 0 | 0 | 0 | 100 | ||||||||||||||||||||||||||
| Fos-sur-Mer |
France | l | p | 133 | 133 | 31 | 0 | 0 | 0 | 82.9 | ||||||||||||||||||||||||||
| Gravenchon |
France | n | l | 236 | 236 | 41 | 0 | 0 | 13 | 82.9 | ||||||||||||||||||||||||||
| Karlsruhe |
Germany | l | p | 78 | 310 | 86 | 0 | 30 | 0 | 25 | ||||||||||||||||||||||||||
| Augusta |
Italy | l | p | 198 | 198 | 50 | 0 | 0 | 14 | 100 | ||||||||||||||||||||||||||
| Trecate |
Italy | l | p | 127 | 127 | 35 | 0 | 0 | 0 | 75.5 | ||||||||||||||||||||||||||
| Rotterdam |
Netherlands | n | l | 191 | 191 | 0 | 52 | 41 | 0 | 100 | ||||||||||||||||||||||||||
| Slagen |
Norway | 116 | 116 | 0 | 0 | 32 | 0 | 100 | ||||||||||||||||||||||||||||
| Fawley |
United Kingdom | n | l | 260 | 260 | 89 | 0 | 37 | 9 | 100 | ||||||||||||||||||||||||||
| Total Europe |
1,646 | 1,878 | 367 | 52 | 140 | 36 | ||||||||||||||||||||||||||||||
| Refining Capacity at Year-End 2013, continued on page 70 |
||||||||||||||||||||||||||||||||||||
|
n Integrated Refinery and Chemical Complex l Cogeneration Capacity p Refineries with Some Chemical Production |
| |||||||||||||||||||||||||||||||||||
| (1) | Capacity data is based on 100 percent of rated refinery process unit stream-day capacities under normal operating conditions, less the impact of shutdowns for regular repair and maintenance activities, averaged over an extended period of time. |
| (2) | ExxonMobil share reflects 100 percent of atmospheric distillation capacity in operations of ExxonMobil and majority-owned subsidiaries. For companies owned 50 percent or less, ExxonMobil share is the greater of ExxonMobil’s equity interest or that portion of distillation capacity normally available to ExxonMobil. |
| (3) | Includes thermal cracking, visbreaking, coking, and hydrorefining processes. |
| (4) | Lubricant capacity based on dewaxed oil production. |
| (5) | Financial results incorporated into Upstream business. |
|
|
EXXONMOBIL 2013 FINANCIAL & OPERATING REVIEW | |
Downstream Operating Statistics, continued
| REFINING CAPACITY AT YEAR-END 2013(1) | ||||||||||||||||||||||||||||||||||||
| (thousands of barrels per day) |
Capacity at 100% |
|||||||||||||||||||||||||||||||||||
| |
ExxonMobil Share |
(2) |
|
Atmospheric Distillation |
|
Catalytic Cracking |
Hydrocracking | Residuum Conversion(3) |
Lubricants | (4) |
|
ExxonMobil Interest % |
| |||||||||||||||||||||||
| Asia Pacific |
||||||||||||||||||||||||||||||||||||
| Altona |
Australia | p | 77 | 77 | 27 | 0 | 0 | 0 | 100 | |||||||||||||||||||||||||||
| Fujian |
China | n | l | 63 | 252 | 37 | 41 | 10 | 0 | 25 | ||||||||||||||||||||||||||
| Chiba |
Japan | l | p | 19 | 172 | 33 | 39 | 0 | 0 | 11 | ||||||||||||||||||||||||||
| Kawasaki |
Japan | n | l | 53 | 240 | 87 | 23 | 0 | 0 | 21.9 | ||||||||||||||||||||||||||
| Sakai |
Japan | l | p | 30 | 139 | 40 | 0 | 0 | 0 | 21.9 | ||||||||||||||||||||||||||
| Wakayama |
Japan | l | p | 28 | 127 | 37 | 0 | 0 | 7 | 21.9 | ||||||||||||||||||||||||||
| Whangarei |
New Zealand | 27 | 134 | 0 | 31 | 0 | 0 | 19.2 | ||||||||||||||||||||||||||||
| Jurong/PAC |
Singapore | n | l | 592 | 592 | 0 | 35 | 103 | 38 | 100 | ||||||||||||||||||||||||||
| Sriracha |
Thailand | n | l | 167 | 167 | 41 | 0 | 0 | 0 | 66 | ||||||||||||||||||||||||||
| Total Asia Pacific |
1,056 | 1,900 | 302 | 169 | 113 | 45 | ||||||||||||||||||||||||||||||
| Middle East/Other |
||||||||||||||||||||||||||||||||||||
| Fort-de-France |
Martinique | 2 | 17 | 0 | 0 | 0 | 0 | 14.5 | ||||||||||||||||||||||||||||
| Laffan(5) |
Qatar | 15 | 153 | 0 | 0 | 0 | 0 | 10 | ||||||||||||||||||||||||||||
| Yanbu |
Saudi Arabia | 200 | 400 | 96 | 0 | 51 | 0 | 50 | ||||||||||||||||||||||||||||
| Total Middle East/Other
|
217 | 570 | 96 | 0 | 51 | 0 | ||||||||||||||||||||||||||||||
|
Total worldwide
|
5,291 | 6,814 | 1,724 | 378 | 727 | 131 | ||||||||||||||||||||||||||||||
|
n Integrated Refinery and Chemical Complex l Cogeneration Capacity p Refineries with Some Chemical Production |
| |||||||||||||||||||||||||||||||||||
| See footnotes on page 69. |
| |||||||||||||||||||||||||||||||||||
| RETAIL SITES | ||||||||||||||||||||||
| (number of sites at year end) | ||||||||||||||||||||||
| 2013 | 2012 | 2011 | 2010 | 2009 | ||||||||||||||||||
| Worldwide |
||||||||||||||||||||||
| Owned/leased |
5,072 | 5,593 | 7,753 | 8,710 | 9,965 | |||||||||||||||||
| Distributors/resellers |
14,482 | 13,789 | 17,267 | 17,568 | 17,755 | |||||||||||||||||
|
Total worldwide
|
19,554 | 19,382 | 25,020 | 26,278 | 27,720 | |||||||||||||||||
|
ExxonMobil offers consumers premium products carrying the branding of Exxon, Mobil, and Esso. Additional lines include our industry-leading family of lubricant products Mobil 1, Mobil SHC, and Mobil Delvac 1. |
Global Fuels Marketing Sales(1)
(percent) | |
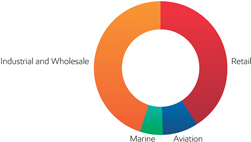
| ||
| (1) Fuels marketing petroleum product sales are to retail sites as well as commercial and wholesale accounts. |
|
| ||
| PETROLEUM PRODUCT SALES(1) BY GEOGRAPHIC AREA | ||||||||||||||||||||
| (thousands of barrels per day) | 2013 | 2012 | 2011 | 2010 | 2009 | |||||||||||||||
| United States |
||||||||||||||||||||
| Motor gasoline, naphthas |
1,467 | 1,416 | 1,372 | 1,445 | 1,425 | |||||||||||||||
| Heating oils, kerosene, diesel oils |
570 | 565 | 564 | 480 | 517 | |||||||||||||||
| Aviation fuels |
195 | 184 | 178 | 181 | 207 | |||||||||||||||
| Heavy fuels |
90 | 113 | 129 | 122 | 106 | |||||||||||||||
| Lubricants, specialty, and other petroleum products |
287 | 291 | 287 | 283 | 268 | |||||||||||||||
| Total United States |
2,609 | 2,569 | 2,530 | 2,511 | 2,523 | |||||||||||||||
|
|
|
|
||||||||||||||||||
| Canada |
||||||||||||||||||||
| Motor gasoline, naphthas |
222 | 219 | 219 | 217 | 199 | |||||||||||||||
| Heating oils, kerosene, diesel oils |
124 | 121 | 126 | 125 | 119 | |||||||||||||||
| Aviation fuels |
37 | 31 | 31 | 27 | 23 | |||||||||||||||
| Heavy fuels |
28 | 30 | 29 | 27 | 27 | |||||||||||||||
| Lubricants, specialty, and other petroleum products |
53 | 52 | 50 | 54 | 45 | |||||||||||||||
| Total Canada |
464 | 453 | 455 | 450 | 413 | |||||||||||||||
|
|
|
|
||||||||||||||||||
| Europe |
||||||||||||||||||||
| Motor gasoline, naphthas |
414 | 423 | 433 | 423 | 409 | |||||||||||||||
| Heating oils, kerosene, diesel oils |
712 | 722 | 706 | 707 | 710 | |||||||||||||||
| Aviation fuels |
98 | 106 | 116 | 116 | 127 | |||||||||||||||
| Heavy fuels |
129 | 158 | 166 | 179 | 175 | |||||||||||||||
| Lubricants, specialty, and other petroleum products |
144 | 162 | 175 | 186 | 204 | |||||||||||||||
| Total Europe |
1,497 | 1,571 | 1,596 | 1,611 | 1,625 | |||||||||||||||
|
|
|
|
||||||||||||||||||
| Asia Pacific |
||||||||||||||||||||
| Motor gasoline, naphthas |
193 | 269 | 347 | 365 | 379 | |||||||||||||||
| Heating oils, kerosene, diesel oils |
295 | 345 | 405 | 432 | 455 | |||||||||||||||
| Aviation fuels |
82 | 91 | 102 | 95 | 116 | |||||||||||||||
| Heavy fuels |
159 | 172 | 213 | 209 | 234 | |||||||||||||||
| Lubricants, specialty, and other petroleum products |
149 | 139 | 137 | 140 | 145 | |||||||||||||||
| Total Asia Pacific |
878 | 1,016 | 1,204 | 1,241 | 1,329 | |||||||||||||||
|
|
|
|
||||||||||||||||||
| Latin America |
||||||||||||||||||||
| Motor gasoline, naphthas |
36 | 60 | 79 | 80 | 83 | |||||||||||||||
| Heating oils, kerosene, diesel oils |
40 | 80 | 111 | 113 | 113 | |||||||||||||||
| Aviation fuels |
18 | 24 | 31 | 29 | 28 | |||||||||||||||
| Heavy fuels |
6 | 16 | 31 | 34 | 33 | |||||||||||||||
| Lubricants, specialty, and other petroleum products |
11 | 20 | 24 | 24 | 22 | |||||||||||||||
| Total Latin America |
111 | 200 | 276 | 280 | 279 | |||||||||||||||
|
|
|
|
||||||||||||||||||
| Middle East/Africa |
||||||||||||||||||||
| Motor gasoline, naphthas |
86 | 102 | 91 | 81 | 78 | |||||||||||||||
| Heating oils, kerosene, diesel oils |
97 | 114 | 107 | 94 | 99 | |||||||||||||||
| Aviation fuels |
32 | 37 | 34 | 28 | 35 | |||||||||||||||
| Heavy fuels |
19 | 26 | 20 | 32 | 23 | |||||||||||||||
| Lubricants, specialty, and other petroleum products |
94 | 86 | 100 | 86 | 24 | |||||||||||||||
| Total Middle East/Africa |
328 | 365 | 352 | 321 | 259 | |||||||||||||||
|
|
|
|
||||||||||||||||||
| Worldwide |
||||||||||||||||||||
| Motor gasoline, naphthas |
2,418 | 2,489 | 2,541 | 2,611 | 2,573 | |||||||||||||||
| Heating oils, kerosene, diesel oils |
1,838 | 1,947 | 2,019 | 1,951 | 2,013 | |||||||||||||||
| Aviation fuels |
462 | 473 | 492 | 476 | 536 | |||||||||||||||
| Heavy fuels |
431 | 515 | 588 | 603 | 598 | |||||||||||||||
| Lubricants, specialty, and other petroleum products |
738 | 750 | 773 | 773 | 708 | |||||||||||||||
|
|
|
|
||||||||||||||||||
|
Total worldwide
|
5,887 | 6,174 | 6,413 | 6,414 | 6,428 | |||||||||||||||
|
|
|
|
||||||||||||||||||
| (1) | Petroleum product sales include 100 percent of the sales of ExxonMobil and majority-owned subsidiaries, and the ExxonMobil equity interest in sales by companies owned 50 percent or less. |
|
| ||

|
|
EXXONMOBIL 2013 FINANCIAL & OPERATING REVIEW | |
| Chemical
| ||||||||||||||||
| ExxonMobil Chemical has highly competitive assets, proprietary technologies, and a unique and balanced global business portfolio. Additionally, integration with ExxonMobil’s Upstream and Downstream businesses is a key differentiator that allows us to consistently outperform competition, as demonstrated by our 2013 results. |
STRATEGIES
• Consistently deliver best-in-class
• Focus on businesses
that capitalize
• Build proprietary technology
• Capture full benefits of integration
• Selectively invest
in advantaged | |||||||||||||||
| RESULTS & HIGHLIGHTS
• Industry-leading safety performance, including an exemplary record at our Singapore Chemical Expansion project
• Earnings of $3.8 billion, supported by our capacity to capture low-cost feedstock
and energy
• Return on average capital employed of 18.5 percent, averaging 24 percent over the
last 10 years,
• Prime product sales of 24.1 million tonnes, including record sales of metallocene
products that
• Capital expenditures of $1.8 billion, with selective investments in specialty
business growth,
• Started up our Singapore Chemical Expansion project, more than doubling
steam-cracking
• Progressed construction of a 400,000-tonnes-per-year specialty elastomers project in
Saudi Arabia,
• Advanced plans
for a major expansion at our Texas facilities, including a new world-scale ethane
| ||||||||||||||||
|
CHEMICAL STATISTICAL RECAP
|
2013 | 2012 | 2011 | 2010 | 2009 | |||||||||||
| Earnings (millions of dollars) |
3,828 | 3,898 | 4,383 | 4,913 | 2,309 | |||||||||||
| Prime product sales(1) (thousands of tonnes) |
24,063 | 24,157 | 25,006 | 25,891 | 24,825 | |||||||||||
| Average capital employed(1) (millions of dollars) |
20,665 | 20,148 | 19,798 | 18,680 | 16,560 | |||||||||||
| Return on average capital employed(1) (percent) |
18.5 | 19.3 | 22.1 | 26.3 | 13.9 | |||||||||||
| Capital expenditures(1) (millions of dollars) |
1,832 | 1,418 | 1,450 | 2,215 | 3,148 | |||||||||||
|
(1) See Frequently Used Terms on pages 90 through 93.
| ||||||||||||||||
|
| ||
BUSINESS OVERVIEW
ExxonMobil Chemical is one of the largest chemical companies in the world, with a unique portfolio of commodity and specialty businesses with annual sales of more than 24 million tonnes. We have world-scale manufacturing facilities in all major regions of the world, and our products serve as the building blocks for a wide variety of everyday consumer and industrial products.
We process feedstocks from ExxonMobil’s Upstream and Downstream operations, supplemented with market sources, to manufacture chemical products for higher-value end uses. We focus on product lines that capitalize on scale and technology advantages, building on our strengths in advantaged feedstocks, lower-cost processes, and premium products. As a result, we have strong positions in the markets we serve, and we generate industry-leading returns throughout the business cycle.
BUSINESS ENVIRONMENT
Worldwide chemical demand growth improved in 2013, and we anticipate further strengthening in 2014, linked to growth of the broader economy. Most chemical demand growth is in Asia Pacific, driven by manufacturing of industrial and consumer products both for worldwide export and to serve the growing Asian middle class. As middle-class consumers seek higher standards of living, they are expected to purchase more packaged goods, appliances, cars, tires, and clothing, many of which are manufactured from the chemicals produced by ExxonMobil. Asia Pacific has accounted for more than two-thirds of global chemical demand growth since 2000, and we expect this trend to continue. Over the next decade, we expect global chemical demand to grow by 50 percent, driven by improving prosperity in developing countries.
Growing chemical demand is spurring new capacity investments around the globe, particularly in North America with its abundant supplies of natural gas liquids. Over the last five years, unconventional natural gas development in North America has brought significant benefits to domestic chemical producers by providing both low-cost feedstock and energy savings. This has greatly improved the global competitiveness of existing assets, enabling North American producers to export chemical products competitively to growth markets around the world.
With our global network of highly competitive world-scale facilities, ExxonMobil Chemical is well positioned to meet the needs of Asia, Africa, Latin America, and other growth markets. While the relative attractiveness of feedstocks changes over time, our feed flexibility, global supply capability, and integration across ExxonMobil operations allow us to quickly adapt to changing market conditions and consistently outperform competition.
| Industry Global Chemical Demand(1)
Source: IHS Chemical and ExxonMobil estimates (1) Includes polyethylene, polypropylene, and paraxylene. |
U.S. Ethylene from Ethane(2)
Source: Jacobs Consultancy The Hodson Report (2) Includes ethane and ethane equivalent. |
|
|
EXXONMOBIL 2013 FINANCIAL & OPERATING REVIEW | |
Global Chemical Portfolio
ExxonMobil Chemical has both specialty and commodity manufacturing capacity in every major region of the world to serve large and growing markets. These world-scale assets, supported by common best practices and a global supply chain, afford us significant competitive advantages.
BALANCED GLOBAL PORTFOLIO OF COMMODITY AND SPECIALTY PRODUCTS
| Efficiently produced, high-volume commodity chemicals, such as many general-purpose plastics, capture upside earnings when margins are strong and provide a low-cost structure for co-located specialties production. Specialty products, including high-end polymers and synthetic lubricant basestocks, command a market premium due to their attributes in higher-value applications. They also provide a stable earnings base.
Our Chemical manufacturing operations are geographically diverse. This diversity provides us with access to a wide variety of feedstocks, and enables us to competitively supply the global market. |
Chemical Segment Earnings
|
NORTH AMERICA – PREMIUM PRODUCTS FROM ADVANTAGED FEEDS
Nearly half of our global capacity is located in North America, where we manufacture products for all of our business lines. Our three largest U.S. chemical plants in Baytown and Beaumont, Texas, and Baton Rouge, Louisiana, are integrated with co-located refineries and have access to feedstocks ranging from light gases to heavy liquids. These plants are also tied into the region’s natural gas liquid supply hubs, giving us industry-leading capability to process low-cost ethane in the United States. This level of Downstream and Upstream integration maximizes our flexibility to process advantaged feeds into premium products. Our U.S. Gulf Coast plants are well positioned to competitively supply high-demand growth markets around the world.
Baytown and Mont Belvieu • Our Baytown facility is the largest integrated refining and petrochemical complex in the United States. It is also our largest ethylene production facility in the world, and is closely integrated with our nearby Mont Belvieu Plastics Plant that produces premium metallocene polyolefins.
|
Baytown also produces aromatics, polypropylene, halobutyl rubber, and a wide range of premium hydrocarbon fluids for use in applications such as drilling, water treatment, and agriculture. Our newest unit will produce synthetic basestocks for industrial lubricant applications. The complex generates its own low-cost electricity and high-pressure steam via high-efficiency cogeneration plants.
Beaumont • Our Beaumont plant is a large producer of aromatics, with significant steam-cracking and derivatives capacity. Beaumont also produces proprietary synthetic basestocks used in top-tier motor oils and industrial lubricants.
Baton Rouge • Our Baton Rouge plant has world-scale manufacturing capacity supporting nearly all of our commodity and specialty businesses. It is home to the world’s largest production facilities for halobutyl rubber and isopropyl alcohol. The complex also includes two nearby polymer plants and is located at the northernmost point in the Mississippi River accessible to large vessels, giving the site protection from Gulf of Mexico storm activity.
Our Baton Rouge Plastics Plant is capable of producing a wide range of specialty polymers. |
|
| ||
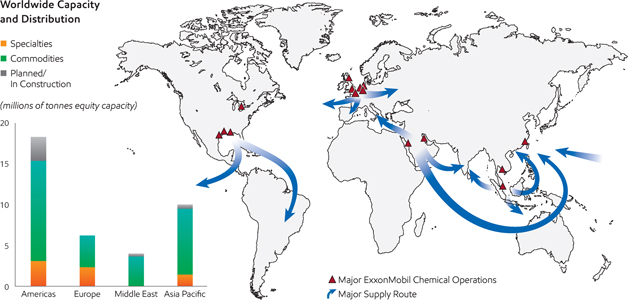
Our global footprint serves major growth markets and provides supply flexibility.
EUROPE – UNIQUE REGIONAL INTEGRATION
Europe represents approximately 20 percent of our global capacity. Major facilities in Scotland, the Channel Zone, and northwest France are highly integrated with ExxonMobil refineries, chemical plants, and upstream facilities across the region. This level of integration provides economies of scale, access to low-cost feedstock, and logistics advantages.
Rotterdam, Netherlands • Our Rotterdam plant processes feedstocks from ExxonMobil’s European refineries, and is the largest producer of aromatics in Europe. In addition, the site manufactures oxo alcohol-based specialty products.
Fife, United Kingdom • Our Upstream business supplies natural gas liquids from North Sea gas fields as feedstock to our Fife Ethylene Plant. Ethylene produced at Fife is transported to our polyethylene plants at Antwerp and Meerhout, Belgium, where premium polyolefins account for a large share of production.
ASIA PACIFIC / MIDDLE EAST – POSITIONED TO SERVE GROWTH MARKETS
Our Asia Pacific and Middle East facilities are positioned to serve growth markets with plants in Singapore, Saudi Arabia, Thailand, and China. Our joint venture Fujian facility is China’s first fully integrated refining, petrochemical, and fuels marketing complex with foreign company participation. An expansion is being progressed that will increase the site’s ethylene and polymer capacity, and add ethylene glycol production. Our Shanghai Technology Center supports premium product sales throughout the region.
Singapore • Singapore is now our largest integrated petrochemical complex and accounts for about one-fourth of ExxonMobil’s global chemical capacity. Our new steam cracker can process an unprecedented range of feedstocks, including crude oil, and employs our suite of energy-efficient best practices. The recent expansion project also added production capacity across six product lines, including premium products such as oxo alcohol, metallocene elastomers, and metallocene polyethylene.
Saudi Arabia • Together with our joint venture partner, Saudi Basic Industries Corporation, we have two chemical facilities in Saudi Arabia that utilize local ethane and other feedstocks to produce chemical products for local demand and export. Manufacturing units at these sites include steam crackers and derivative units that produce polyethylene, polypropylene, and ethylene glycol.
|
|
EXXONMOBIL 2013 FINANCIAL & OPERATING REVIEW | |
Enhancing Shareholder Value
We enhance shareholder value through our proprietary technology and integration with ExxonMobil’s Downstream and Upstream operations. This unmatched combination enables optimization of our manufacturing processes and delivers breakthrough products that command a premium in growth markets around the globe. We accomplish this by focusing on advantaged feedstock, lower-cost processes, and premium product developments that maximize the value of our integrated business model.
| ADVANTAGED FEEDSTOCK
Our proprietary technology enables us to process the broadest range of feedstocks in industry, from light feeds such as ethane to heavy liquids like crude oil. The combination of our integration, advanced optimization tools, and flexible process designs allows our plants to respond quickly to changes in feedstock quality, availability, and cost to maximize value across the entire conversion chain.
LOWER-COST PROCESSES
Shareholder value is further improved through process innovation that enables lower-cost production. We utilize our advanced technologies to enhance energy efficiency, achieve greater reliability, and produce higher yields. For example, our recently expanded aromatics facility in Singapore employs a new process design that utilizes waste heat to significantly reduce energy consumption. Investments in our aromatics plants around the world have enabled us to reduce energy intensity by greater than 10 percent since 2004. |
Our Singapore Expansion project installed extensive heat integration to improve energy efficiency and lower cost. |
METALLOCENE-BASED PREMIUM PRODUCTS
We were a pioneer in metallocene catalyst technology in the 1980s. Through consistent investment in metallocene research over the last 30 years, we now deploy this technology to produce an industry-leading range of plastics, elastomers, and synthetic basestocks. These premium products are produced by upgrading a range of commodity petrochemicals typically produced at the same manufacturing site. This long-term approach to building an advanced technology platform allows us to efficiently and reliably produce high-value products that grow faster than gross domestic product (GDP) rates.
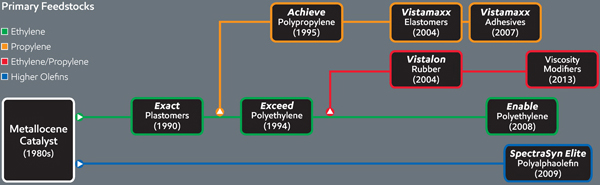
|
| ||
| PREMIUM PRODUCTS
Breakthroughs in catalyst and product technologies help us to deliver new, higher-value, and more sustainable products that provide superior performance advantages and cost savings to our customers. Our expertise in end-use application technologies, supported by premier technology centers around the world, equips us to tailor innovative solutions that allow our customers to realize the full value and performance attributes of our products. These benefits include increased strength, ease of processing, lower raw material usage, and improved energy efficiency.
INTEGRATED PRODUCT DEVELOPMENT
As part of an integrated company, we work with the Downstream and Upstream to develop premium products for the industries they serve. By working across businesses to leverage our market and technology expertise, we are uniquely qualified to develop high- performance products that allow ExxonMobil to capture the full value from the wellhead to the finished product.
Downstream • ExxonMobil Chemical supplies the ExxonMobil Fuels and Lubricants business with synthetic basestocks to support the growth of their flagship finished lubricants brands Mobil 1, Mobil Delvac 1, and Mobil SHC. Many third-party customers also rely on ExxonMobil Chemical to supply them with synthetic basestocks to meet their performance goals, such as improved energy efficiency and wear protection. With our half century of technology leadership, we have developed the broadest portfolio of synthetic basestocks in the industry to meet the increasing performance requirements and robust demand for advanced lubricants. |
Our new facility in Baytown, Texas, is expected to start up in 2014 and produce metallocene-based synthetic basestocks that enable lubricants to provide longer service life between oil changes and improved energy efficiency. | |
|
Upstream • Working with the Upstream, we have developed Escaid fluids that improve performance in extended-reach drilling and hydraulic fracturing applications while minimizing environmental impact and enhancing worker safety. | ||
|
|
As a fully integrated company, we are ideally positioned to upgrade by-product molecules from our refineries into chemical products that can be tailored for use in these demanding and rapidly growing resource extraction applications.
Our high-impact technologies, combined with our scale and integrated business model, provide a structural advantage that is difficult for competitors to replicate. This advantage enables us to reliably offer customers safe, cost-effective, and sustainable solutions. This drives growth in high-margin premium products and enhances shareholder value in the process.
Escaid products, used in drilling fluids that remove rocks from the wellbore, provide superior technical performance without compromising sustainable oil and gas development. | |
|
|
EXXONMOBIL 2013 FINANCIAL & OPERATING REVIEW | |
CHEMICAL OPERATING STATISTICS
| LARGE/INTEGRATED PRODUCTION COMPLEX CAPACITY – AT YEAR-END 2013(1)(2) | ||||||||||||||||||||||||||||||||||
| (millions of tonnes per year)
|
Ethylene | Polyethylene | Polypropylene | Paraxylene | Additional Products | |||||||||||||||||||||||||||||
| North America |
||||||||||||||||||||||||||||||||||
|
Baton Rouge, Louisiana |
1.0 | 1.3 | 0.4 | – | P | B | E | A | F | O | ||||||||||||||||||||||||
|
Baytown, Texas |
2.2 | – | 0.7 | 0.6 | P | B | F | |||||||||||||||||||||||||||
|
Beaumont, Texas |
0.9 | 1.0 | – | 0.3 | P | S | ||||||||||||||||||||||||||||
|
Mont Belvieu, Texas |
– | 1.0 | – | – | ||||||||||||||||||||||||||||||
|
Sarnia, Ontario |
0.3 | 0.5 | – | – | P | F | O | |||||||||||||||||||||||||||
| Europe |
||||||||||||||||||||||||||||||||||
|
Antwerp, Belgium |
– | 0.4 | – | – | F | O | ||||||||||||||||||||||||||||
|
Fawley, United Kingdom |
– | – | – | – | B | F | O | |||||||||||||||||||||||||||
|
Fife, United Kingdom |
0.4 | – | – | – | ||||||||||||||||||||||||||||||
|
Meerhout, Belgium |
– | 0.5 | – | – | ||||||||||||||||||||||||||||||
|
Gravenchon, France |
0.4 | 0.4 | 0.3 | – | P | B | E | A | O | S | Z | |||||||||||||||||||||||
|
Rotterdam, Netherlands |
– | – | – | 0.7 | O | |||||||||||||||||||||||||||||
| Middle East |
||||||||||||||||||||||||||||||||||
|
Al Jubail, Saudi Arabia |
0.6 | 0.7 | – | – | ||||||||||||||||||||||||||||||
|
Yanbu, Saudi Arabia |
1.0 | 0.7 | 0.2 | – | P | |||||||||||||||||||||||||||||
| Asia Pacific |
||||||||||||||||||||||||||||||||||
|
Fujian, China |
0.2 | 0.2 | 0.1 | 0.2 | P | |||||||||||||||||||||||||||||
|
Kawasaki, Japan |
0.1 | – | – | – | P | B | A | F | ||||||||||||||||||||||||||
|
Singapore |
1.9 | 1.9 | 0.9 | 0.9 | P | E | F | O | Z | |||||||||||||||||||||||||
|
Sriracha, Thailand |
– | – | – | 0.5 | F | |||||||||||||||||||||||||||||
|
All other |
– | – | – | 0.2 | ||||||||||||||||||||||||||||||
|
| ||||||||||||||||||||||||||||||||||
|
Total worldwide
|
9.0 | 8.6 | 2.6 | 3.4 | ||||||||||||||||||||||||||||||
|
| ||||||||||||||||||||||||||||||||||
P Propylene B Butyl E Specialty Elastomers A Adhesive Polymers F Fluids O Oxo Alcohols S Synthetics Z Petroleum Additives
| (1) | Based on size or breadth of product slate. |
| (2) | Capacity reflects 100 percent for operations of ExxonMobil and majority-owned subsidiaries. For companies owned 50 percent or less, capacity is ExxonMobil’s interest. |
| OTHER MANUFACTURING LOCATIONS – AT YEAR-END 2013(1) | ||||||||||
| Location | Product | Location | Product | Location | Product | |||||
|
|
|
| ||||||||
| North America |
Europe |
Asia Pacific |
||||||||
| Bayway, New Jersey |
pl |
Augusta, Italy |
n |
Altona, Australia |
n | |||||
| Chalmette, Louisiana |
n |
Berre, France |
l |
Chiba, Japan |
n | |||||
| Edison, New Jersey |
l |
Cologne, Germany |
pl |
Jinshan, China |
p | |||||
| Pensacola, Florida |
p |
Fos-sur-Mer, France |
n |
Kashima, Japan |
p | |||||
| Karlsruhe, Germany |
n |
Panyu, China |
l | |||||||
| Newport, United Kingdom |
p |
Sakai, Japan |
n l | |||||||
| n Olefins/Aromatics |
Trecate, Italy |
l |
Wakayama, Japan |
n | ||||||
| p Polymers |
Vado Ligure, Italy |
l |
Latin America |
|||||||
| l Other Chemicals |
Paulinia, Brazil |
l | ||||||||
| Rio de Janeiro, Brazil |
l | |||||||||
| (1) | Includes joint venture plants. |
|
| ||
| VOLUMES | ||||||||||||||||||||
| Includes ExxonMobil’s share of equity companies | 2013 | 2012 | 2011 | 2010 | 2009 | |||||||||||||||
| Worldwide Production Volumes (thousands of tonnes) |
| |||||||||||||||||||
| Ethylene |
7,586 | 6,911 | 7,855 | 7,973 | 7,381 | |||||||||||||||
| Polyethylene |
6,906 | 6,572 | 6,482 | 6,506 | 6,120 | |||||||||||||||
| Polypropylene |
2,040 | 1,937 | 1,870 | 1,945 | 1,864 | |||||||||||||||
| Paraxylene |
2,668 | 2,875 | 2,935 | 2,973 | 2,758 | |||||||||||||||
|
|
|
|
||||||||||||||||||
| Prime Product Sales Volumes(1) by Region (thousands of tonnes) |
| |||||||||||||||||||
| Americas(2) |
10,675 | 10,450 | 10,268 | 10,826 | 10,665 | |||||||||||||||
| Europe/Middle East/Africa |
6,165 | 6,310 | 6,555 | 6,654 | 6,433 | |||||||||||||||
| Asia Pacific |
7,223 | 7,397 | 8,183 | 8,411 | 7,727 | |||||||||||||||
|
|
|
|
||||||||||||||||||
| Total worldwide |
24,063 | 24,157 | 25,006 | 25,891 | 24,825 | |||||||||||||||
|
|
|
|
||||||||||||||||||
| Prime Product Sales Volumes(1) by Business (thousands of tonnes) |
| |||||||||||||||||||
| Specialties |
5,090 | 5,219 | 5,471 | 5,586 | 5,183 | |||||||||||||||
| Commodities |
18,973 | 18,938 | 19,535 | 20,305 | 19,642 | |||||||||||||||
|
|
|
|
||||||||||||||||||
| Total |
24,063 | 24,157 | 25,006 | 25,891 | 24,825 | |||||||||||||||
|
|
|
|
||||||||||||||||||
| (1) | See Frequently Used Terms on pages 90 through 93. |
| (2) | Includes North America and Latin America. |
|
|
EXXONMOBIL 2013 FINANCIAL & OPERATING REVIEW | |
|
|
||||||||||||||||||||||||||
| FINANCIAL HIGHLIGHTS | ||||||||||||||||||||||||||
| (millions of dollars, unless noted) | 2013 | 2012 | 2011 | 2010 | 2009 | |||||||||||||||||||||
| Net income attributable to ExxonMobil |
32,580 | 44,880 | 41,060 | 30,460 | 19,280 | |||||||||||||||||||||
| Cash flow from operations and asset sales(1) |
47,621 | 63,825 | 66,478 | 51,674 | 29,983 | |||||||||||||||||||||
| Capital and exploration expenditures(1) |
42,489 | 39,799 | 36,766 | 32,226 | 27,092 | |||||||||||||||||||||
| Research and development costs |
1,044 | 1,042 | 1,044 | 1,012 | 1,050 | |||||||||||||||||||||
| Total debt at year end |
22,699 | 11,581 | 17,033 | 15,014 | 9,605 | |||||||||||||||||||||
| Average capital employed(1) |
191,575 | 179,094 | 170,721 | 145,217 | 125,050 | |||||||||||||||||||||
| Market valuation at year end |
438,684 | 389,680 | 401,249 | 364,035 | 322,329 | |||||||||||||||||||||
| Regular employees at year end (thousands) |
75.0 | 76.9 | 82.1 | 83.6 | 80.7 | |||||||||||||||||||||
|
|
|
|
||||||||||||||||||||||||
| KEY FINANCIAL RATIOS | ||||||||||||||||||||||||||
| 2013 | 2012 | 2011 | 2010 | 2009 | ||||||||||||||||||||||
| Return on average capital employed(1) (percent) |
17.2 | 25.4 | 24.2 | 21.7 | 16.3 | |||||||||||||||||||||
| Earnings to average ExxonMobil share of equity (percent) |
19.2 | 28.0 | 27.3 | 23.7 | 17.3 | |||||||||||||||||||||
| Debt to capital(2) (percent) |
11.2 | 6.3 | 9.6 | 9.0 | 7.7 | |||||||||||||||||||||
| Net debt to capital(3) (percent) |
9.1 | 1.2 | 2.6 | 4.5 | (1.0 | ) | ||||||||||||||||||||
| Current assets to current liabilities (times) |
0.83 | 1.01 | 0.94 | 0.94 | 1.06 | |||||||||||||||||||||
| Fixed charge coverage (times) |
55.7 | 62.4 | 53.4 | 42.2 | 25.8 | |||||||||||||||||||||
|
|
|
|
||||||||||||||||||||||||
| DIVIDEND AND SHAREHOLDER RETURN INFORMATION | ||||||||||||||||||||||||||
| 2013 | 2012 | 2011 | 2010 | 2009 | ||||||||||||||||||||||
| Dividends per common share (dollars) |
2.46 | 2.18 | 1.85 | 1.74 | 1.66 | |||||||||||||||||||||
|
|
|
|
||||||||||||||||||||||||
| Dividends per share growth (annual percent) |
12.8 | 17.8 | 6.3 | 4.8 | 7.1 | |||||||||||||||||||||
|
|
|
|
||||||||||||||||||||||||
| Number of common shares outstanding (millions) |
||||||||||||||||||||||||||
| Average |
4,419 | 4,628 | 4,870 | 4,885 | 4,832 | |||||||||||||||||||||
| Average – assuming dilution |
4,419 | 4,628 | 4,875 | 4,897 | 4,848 | |||||||||||||||||||||
| Year end |
4,335 | 4,502 | 4,734 | 4,979 | 4,727 | |||||||||||||||||||||
|
|
|
|
||||||||||||||||||||||||
| Total shareholder return(1) (annual percent) |
20.1 | 4.7 | 18.7 | 10.1 | (12.6 | ) | ||||||||||||||||||||
|
|
|
|
||||||||||||||||||||||||
| Common stock purchases (millions of dollars) |
15,998 | 21,068 | 22,055 | 13,093 | 19,703 | |||||||||||||||||||||
|
|
|
|
||||||||||||||||||||||||
| Market quotations for common stock (dollars) |
||||||||||||||||||||||||||
| High |
101.74 | 93.67 | 88.23 | 73.69 | 82.73 | |||||||||||||||||||||
| Low |
84.79 | 77.13 | 67.03 | 55.94 | 61.86 | |||||||||||||||||||||
| Average daily close |
90.51 | 86.53 | 79.71 | 64.99 | 70.95 | |||||||||||||||||||||
| Year-end close |
101.20 | 86.55 | 84.76 | 73.12 | 68.19 | |||||||||||||||||||||
|
|
|
|
||||||||||||||||||||||||
|
(1) See Frequently Used Terms on pages 90 through 93. (2) Debt includes short-term and long-term debt. Capital includes short-term and long-term debt and total equity. (3) Debt net of cash and cash equivalents, excluding restricted cash.
|
| |||||||||||||||||||||||||
|
| ||
| FUNCTIONAL EARNINGS(1) | ||||||||||||||||||||||||||||||||||||
| (millions of dollars) | 2013 Quarters | |||||||||||||||||||||||||||||||||||
|
|
|
|||||||||||||||||||||||||||||||||||
| First | Second | Third | Fourth | 2013 | 2012 | 2011 | 2010 | 2009 | ||||||||||||||||||||||||||||
| Earnings (U.S. GAAP) |
||||||||||||||||||||||||||||||||||||
| Upstream |
||||||||||||||||||||||||||||||||||||
| United States |
859 | 1,096 | 1,050 | 1,186 | 4,191 | 3,925 | 5,096 | 4,272 | 2,893 | |||||||||||||||||||||||||||
| Non-U.S. |
6,178 | 5,209 | 5,663 | 5,600 | 22,650 | 25,970 | 29,343 | 19,825 | 14,214 | |||||||||||||||||||||||||||
| Total |
7,037 | 6,305 | 6,713 | 6,786 | 26,841 | 29,895 | 34,439 | 24,097 | 17,107 | |||||||||||||||||||||||||||
|
|
|
|
||||||||||||||||||||||||||||||||||
| Downstream |
||||||||||||||||||||||||||||||||||||
| United States |
1,039 | 248 | 315 | 597 | 2,199 | 3,575 | 2,268 | 770 | (153 | ) | ||||||||||||||||||||||||||
| Non-U.S. |
506 | 148 | 277 | 319 | 1,250 | 9,615 | 2,191 | 2,797 | 1,934 | |||||||||||||||||||||||||||
| Total |
1,545 | 396 | 592 | 916 | 3,449 | 13,190 | 4,459 | 3,567 | 1,781 | |||||||||||||||||||||||||||
|
|
|
|
||||||||||||||||||||||||||||||||||
| Chemical |
||||||||||||||||||||||||||||||||||||
| United States |
752 | 515 | 680 | 808 | 2,755 | 2,220 | 2,215 | 2,422 | 769 | |||||||||||||||||||||||||||
| Non-U.S. |
385 | 241 | 345 | 102 | 1,073 | 1,678 | 2,168 | 2,491 | 1,540 | |||||||||||||||||||||||||||
| Total |
1,137 | 756 | 1,025 | 910 | 3,828 | 3,898 | 4,383 | 4,913 | 2,309 | |||||||||||||||||||||||||||
|
|
|
|
||||||||||||||||||||||||||||||||||
| Corporate and financing |
(219 | ) | (597 | ) | (460 | ) | (262 | ) | (1,538 | ) | (2,103 | ) | (2,221 | ) | (2,117 | ) | (1,917 | ) | ||||||||||||||||||
|
|
|
|
||||||||||||||||||||||||||||||||||
| Net income attributable to |
9,500 | 6,860 | 7,870 | 8,350 | 32,580 | 44,880 | 41,060 | 30,460 | 19,280 | |||||||||||||||||||||||||||
|
|
|
|
||||||||||||||||||||||||||||||||||
| AVERAGE CAPITAL EMPLOYED(2) BY BUSINESS | ||||||||||||||||||||
| (millions of dollars) | 2013 | 2012 | 2011 | 2010 | 2009 | |||||||||||||||
| Upstream |
||||||||||||||||||||
| United States |
59,898 | 57,631 | 54,994 | 34,969 | 15,865 | |||||||||||||||
| Non-U.S. |
93,071 | 81,811 | 74,813 | 68,318 | 57,336 | |||||||||||||||
| Total |
152,969 | 139,442 | 129,807 | 103,287 | 73,201 | |||||||||||||||
|
|
|
|
||||||||||||||||||
| Downstream |
||||||||||||||||||||
| United States |
4,757 | 4,630 | 5,340 | 6,154 | 7,306 | |||||||||||||||
| Non-U.S. |
19,673 | 19,401 | 18,048 | 17,976 | 17,793 | |||||||||||||||
| Total |
24,430 | 24,031 | 23,388 | 24,130 | 25,099 | |||||||||||||||
|
|
|
|
||||||||||||||||||
| Chemical |
||||||||||||||||||||
| United States |
4,872 | 4,671 | 4,791 | 4,566 | 4,370 | |||||||||||||||
| Non-U.S. |
15,793 | 15,477 | 15,007 | 14,114 | 12,190 | |||||||||||||||
| Total |
20,665 | 20,148 | 19,798 | 18,680 | 16,560 | |||||||||||||||
|
|
|
|
||||||||||||||||||
| Corporate and financing |
(6,489 | ) | (4,527 | ) | (2,272 | ) | (880 | ) | 10,190 | |||||||||||
|
|
|
|
||||||||||||||||||
| Corporate total |
191,575 | 179,094 | 170,721 | 145,217 | 125,050 | |||||||||||||||
|
|
|
|
||||||||||||||||||
| Average capital employed applicable to equity companies included above |
35,234 | 32,962 | 31,626 | 30,524 | 27,684 | |||||||||||||||
|
|
|
|
||||||||||||||||||
| RETURN ON AVERAGE CAPITAL EMPLOYED(3) BY BUSINESS | ||||||||||||||||||||
| (percent) | 2013 | 2012 | 2011 | 2010 | 2009 | |||||||||||||||
| Upstream |
||||||||||||||||||||
| United States |
7.0 | 6.8 | 9.3 | 12.2 | 18.2 | |||||||||||||||
| Non-U.S. |
24.3 | 31.7 | 39.2 | 29.0 | 24.8 | |||||||||||||||
| Total |
17.5 | 21.4 | 26.5 | 23.3 | 23.4 | |||||||||||||||
|
|
|
|
||||||||||||||||||
| Downstream |
||||||||||||||||||||
| United States |
46.2 | 77.2 | 42.5 | 12.5 | (2.1 | ) | ||||||||||||||
| Non-U.S. |
6.4 | 49.6 | 12.1 | 15.6 | 10.9 | |||||||||||||||
| Total |
14.1 | 54.9 | 19.1 | 14.8 | 7.1 | |||||||||||||||
|
|
|
|
||||||||||||||||||
| Chemical |
||||||||||||||||||||
| United States |
56.5 | 47.5 | 46.2 | 53.0 | 17.6 | |||||||||||||||
| Non-U.S. |
6.8 | 10.8 | 14.4 | 17.6 | 12.6 | |||||||||||||||
| Total |
18.5 | 19.3 | 22.1 | 26.3 | 13.9 | |||||||||||||||
|
|
|
|
||||||||||||||||||
| Corporate and financing |
N.A. | N.A. | N.A. | N.A. | N.A. | |||||||||||||||
|
|
|
|
||||||||||||||||||
| Corporate total |
17.2 | 25.4 | 24.2 | 21.7 | 16.3 | |||||||||||||||
|
|
|
|
||||||||||||||||||
| (1) | Total corporate earnings means net income attributable to ExxonMobil (U.S. GAAP) from the consolidated income statement. Unless indicated, references to earnings, Upstream, Downstream, Chemical, and Corporate and Financing segment earnings, and earnings per share are ExxonMobil’s share after excluding amounts attributable to noncontrolling interests. |
| (2) | Average capital employed is the average of beginning-of-year and end-of-year business segment capital employed, including ExxonMobil’s share of amounts applicable to equity companies. See Frequently Used Terms on pages 90 through 93. |
| (3) | Capital employed consists of ExxonMobil’s share of equity and consolidated debt, including ExxonMobil’s share of amounts applicable to equity companies. See Frequently Used Terms on pages 90 through 93. |
|
|
EXXONMOBIL 2013 FINANCIAL & OPERATING REVIEW | |
Financial Information, continued
| CAPITAL AND EXPLORATION EXPENDITURES(1) | ||||||||||||||||||||
| (millions of dollars) | 2013 | 2012 | 2011 | 2010 | 2009 | |||||||||||||||
| Upstream |
||||||||||||||||||||
| Exploration |
||||||||||||||||||||
| United States |
1,032 | 2,386 | 2,720 | 1,607 | 735 | |||||||||||||||
| Non-U.S. |
6,123 | 2,354 | 2,744 | 2,514 | 2,983 | |||||||||||||||
| Total |
7,155 | 4,740 | 5,464 | 4,121 | 3,718 | |||||||||||||||
|
|
|
|
||||||||||||||||||
| Production(2) |
||||||||||||||||||||
| United States |
8,113 | 8,694 | 8,021 | 4,742 | 2,850 | |||||||||||||||
| Non-U.S. |
22,826 | 22,395 | 19,387 | 18,214 | 13,877 | |||||||||||||||
| Total |
30,939 | 31,089 | 27,408 | 22,956 | 16,727 | |||||||||||||||
|
|
|
|
||||||||||||||||||
| Power and Coal |
||||||||||||||||||||
| United States |
– | – | – | – | – | |||||||||||||||
| Non-U.S. |
137 | 255 | 219 | 242 | 259 | |||||||||||||||
| Total |
137 | 255 | 219 | 242 | 259 | |||||||||||||||
|
|
|
|
||||||||||||||||||
| Total Upstream |
38,231 | 36,084 | 33,091 | 27,319 | 20,704 | |||||||||||||||
|
|
|
|
||||||||||||||||||
| Downstream |
||||||||||||||||||||
| Refining |
||||||||||||||||||||
| United States |
651 | 482 | 370 | 833 | 1,300 | |||||||||||||||
| Non-U.S. |
1,046 | 1,233 | 1,088 | 1,000 | 1,146 | |||||||||||||||
| Total |
1,697 | 1,715 | 1,458 | 1,833 | 2,446 | |||||||||||||||
|
|
|
|
||||||||||||||||||
| Marketing |
||||||||||||||||||||
| United States |
159 | 118 | 117 | 98 | 171 | |||||||||||||||
| Non-U.S. |
413 | 385 | 514 | 520 | 536 | |||||||||||||||
| Total |
572 | 503 | 631 | 618 | 707 | |||||||||||||||
|
|
|
|
||||||||||||||||||
| Pipeline/Marine |
||||||||||||||||||||
| United States |
141 | 34 | 31 | 51 | 40 | |||||||||||||||
| Non-U.S. |
3 | 10 | – | 3 | 3 | |||||||||||||||
| Total |
144 | 44 | 31 | 54 | 43 | |||||||||||||||
|
|
|
|
||||||||||||||||||
| Total Downstream |
2,413 | 2,262 | 2,120 | 2,505 | 3,196 | |||||||||||||||
|
|
|
|
||||||||||||||||||
| Chemical |
||||||||||||||||||||
| United States |
963 | 408 | 290 | 279 | 319 | |||||||||||||||
| Non-U.S. |
869 | 1,010 | 1,160 | 1,936 | 2,829 | |||||||||||||||
|
|
|
|
||||||||||||||||||
| Total Chemical |
1,832 | 1,418 | 1,450 | 2,215 | 3,148 | |||||||||||||||
|
|
|
|
||||||||||||||||||
| Other |
||||||||||||||||||||
| United States |
13 | 35 | 105 | 187 | 44 | |||||||||||||||
| Non-U.S. |
– | – | – | – | – | |||||||||||||||
|
|
|
|
||||||||||||||||||
| Total other |
13 | 35 | 105 | 187 | 44 | |||||||||||||||
|
|
|
|
||||||||||||||||||
| Total capital and exploration expenditures |
42,489 | 39,799 | 36,766 | 32,226 | 27,092 | |||||||||||||||
|
|
|
|
||||||||||||||||||
| (1) | See Frequently Used Terms on pages 90 through 93. |
| (2) | Including related transportation. |
|
| ||
| TOTAL CAPITAL AND EXPLORATION EXPENDITURES BY GEOGRAPHY | ||||||||||||||||||||
| (millions of dollars) | 2013 | 2012 | 2011 | 2010 | 2009 | |||||||||||||||
| United States |
11,072 | 12,157 | 11,654 | 7,797 | 5,459 | |||||||||||||||
| Canada/Latin America |
12,838 | 8,616 | 6,186 | 5,732 | 3,448 | |||||||||||||||
| Europe |
3,045 | 3,111 | 2,914 | 3,901 | 3,251 | |||||||||||||||
| Africa |
4,220 | 3,907 | 4,291 | 4,915 | 6,182 | |||||||||||||||
| Asia |
6,734 | 6,704 | 7,066 | 6,693 | 7,535 | |||||||||||||||
| Australia/Oceania |
4,580 | 5,304 | 4,655 | 3,188 | 1,217 | |||||||||||||||
|
|
|
|
||||||||||||||||||
| Total worldwide |
42,489 | 39,799 | 36,766 | 32,226 | 27,092 | |||||||||||||||
|
|
|
|
||||||||||||||||||
| DISTRIBUTION OF CAPITAL AND EXPLORATION EXPENDITURES | ||||||||||||||||||||
| (millions of dollars) | 2013 | 2012 | 2011 | 2010 | 2009 | |||||||||||||||
| Consolidated Companies’ Expenditures |
||||||||||||||||||||
| Capital expenditures |
36,862 | 35,375 | 32,425 | 27,343 | 22,441 | |||||||||||||||
| Exploration costs charged to expense |
||||||||||||||||||||
| United States |
395 | 392 | 268 | 283 | 219 | |||||||||||||||
| Non-U.S. |
1,573 | 1,441 | 1,802 | 1,855 | 1,795 | |||||||||||||||
| Depreciation on support equipment(1) |
8 | 7 | 11 | 6 | 7 | |||||||||||||||
| Total exploration expenses |
1,976 | 1,840 | 2,081 | 2,144 | 2,021 | |||||||||||||||
|
|
|
|
||||||||||||||||||
| Total consolidated companies’ capital and exploration expenditures |
38,830 | 37,208 | 34,495 | 29,481 | 24,455 | |||||||||||||||
| ExxonMobil’s Share of Non-Consolidated |
||||||||||||||||||||
| Companies’ Expenditures |
||||||||||||||||||||
| Capital expenditures |
3,199 | 2,565 | 2,248 | 2,720 | 2,624 | |||||||||||||||
| Exploration costs charged to expense |
460 | 26 | 23 | 25 | 13 | |||||||||||||||
| Total non-consolidated companies’ capital and exploration expenditures |
3,659 | 2,591 | 2,271 | 2,745 | 2,637 | |||||||||||||||
|
|
|
|
||||||||||||||||||
| Total capital and exploration expenditures |
42,489 | 39,799 | 36,766 | 32,226 | 27,092 | |||||||||||||||
|
|
|
|
||||||||||||||||||
| (1) | Not included as part of total capital and exploration expenditures, but included as part of exploration expenses, including dry holes, in the Summary Statement of Income, page 87. |
|
|
EXXONMOBIL 2013 FINANCIAL & OPERATING REVIEW | |
Financial Information, continued
| NET INVESTMENT IN PROPERTY, PLANT AND EQUIPMENT AT YEAR END | ||||||||||||||||||||
| (millions of dollars) | 2013 | 2012 | 2011 | 2010 | 2009 | |||||||||||||||
| Upstream |
||||||||||||||||||||
| United States |
80,176 | 78,352 | 75,140 | 69,003 | 19,601 | |||||||||||||||
| Non-U.S. |
117,378 | 103,443 | 88,835 | 79,149 | 68,718 | |||||||||||||||
| Total |
197,554 | 181,795 | 163,975 | 148,152 | 88,319 | |||||||||||||||
|
|
|
|
||||||||||||||||||
| Downstream |
||||||||||||||||||||
| United States |
9,955 | 9,119 | 9,516 | 10,585 | 11,013 | |||||||||||||||
| Non-U.S. |
13,264 | 13,934 | 19,285 | 19,510 | 19,486 | |||||||||||||||
| Total |
23,219 | 23,053 | 28,801 | 30,095 | 30,499 | |||||||||||||||
|
|
|
|
||||||||||||||||||
| Chemical |
||||||||||||||||||||
| United States |
4,179 | 3,846 | 3,928 | 4,068 | 4,274 | |||||||||||||||
| Non-U.S. |
9,786 | 10,239 | 10,541 | 10,187 | 9,237 | |||||||||||||||
| Total |
13,965 | 14,085 | 14,469 | 14,255 | 13,511 | |||||||||||||||
|
|
|
|
||||||||||||||||||
| Other |
8,912 | 8,016 | 7,419 | 7,046 | 6,787 | |||||||||||||||
|
|
|
|
||||||||||||||||||
| Total net investment |
243,650 | 226,949 | 214,664 | 199,548 | 139,116 | |||||||||||||||
|
|
|
|
||||||||||||||||||
| DEPRECIATION AND DEPLETION EXPENSES | ||||||||||||||||||||
| (millions of dollars) | 2013 | 2012 | 2011 | 2010 | 2009 | |||||||||||||||
| Upstream |
||||||||||||||||||||
| United States |
5,170 | 5,104 | 4,879 | 3,506 | 1,768 | |||||||||||||||
| Non-U.S. |
8,277 | 7,340 | 7,021 | 7,574 | 6,376 | |||||||||||||||
| Total |
13,447 | 12,444 | 11,900 | 11,080 | 8,144 | |||||||||||||||
|
|
|
|
||||||||||||||||||
| Downstream |
||||||||||||||||||||
| United States |
633 | 594 | 650 | 681 | 687 | |||||||||||||||
| Non-U.S. |
1,390 | 1,280 | 1,560 | 1,565 | 1,665 | |||||||||||||||
| Total |
2,023 | 1,874 | 2,210 | 2,246 | 2,352 | |||||||||||||||
|
|
|
|
||||||||||||||||||
| Chemical |
||||||||||||||||||||
| United States |
378 | 376 | 380 | 421 | 400 | |||||||||||||||
| Non-U.S. |
632 | 508 | 458 | 432 | 457 | |||||||||||||||
| Total |
1,010 | 884 | 838 | 853 | 857 | |||||||||||||||
|
|
|
|
||||||||||||||||||
| Other |
702 | 686 | 635 | 581 | 564 | |||||||||||||||
|
|
|
|
||||||||||||||||||
| Total depreciation and depletion expenses |
17,182 | 15,888 | 15,583 | 14,760 | 11,917 | |||||||||||||||
|
|
|
|
||||||||||||||||||
| OPERATING COSTS(1) | ||||||||||||||||||||
| (millions of dollars) | 2013 | 2012 | 2011 | 2010 | 2009 | |||||||||||||||
| Production and manufacturing expenses |
40,525 | 38,521 | 40,268 | 35,792 | 33,027 | |||||||||||||||
| Selling, general, and administrative |
12,877 | 13,877 | 14,983 | 14,683 | 14,735 | |||||||||||||||
| Depreciation and depletion |
17,182 | 15,888 | 15,583 | 14,760 | 11,917 | |||||||||||||||
| Exploration |
1,976 | 1,840 | 2,081 | 2,144 | 2,021 | |||||||||||||||
|
|
|
|
||||||||||||||||||
| Subtotal |
72,560 | 70,126 | 72,915 | 67,379 | 61,700 | |||||||||||||||
| ExxonMobil’s share of equity company expenses |
14,531 | 12,239 | 11,401 | 9,049 | 6,670 | |||||||||||||||
|
|
|
|
||||||||||||||||||
| Total operating costs |
87,091 | 82,365 | 84,316 | 76,428 | 68,370 | |||||||||||||||
|
|
|
|
||||||||||||||||||
| (1) | See Frequently Used Terms on pages 90 through 93. |
|
| ||
| SUMMARY STATEMENT OF INCOME | ||||||||||||||||||||
| (millions of dollars) | 2013 | 2012 | 2011 | 2010 | 2009 | |||||||||||||||
| Revenues and Other Income |
||||||||||||||||||||
| Sales and other operating revenue(1) |
420,836 | 451,509 | 467,029 | 370,125 | 301,500 | |||||||||||||||
| Income from equity affiliates |
13,927 | 15,010 | 15,289 | 10,677 | 7,143 | |||||||||||||||
| Other income |
3,492 | 14,162 | 4,111 | 2,419 | 1,943 | |||||||||||||||
|
|
|
|
||||||||||||||||||
| Total revenues and other income |
438,255 | 480,681 | 486,429 | 383,221 | 310,586 | |||||||||||||||
|
|
|
|
||||||||||||||||||
| Costs and Other Deductions |
||||||||||||||||||||
| Crude oil and product purchases |
244,156 | 263,535 | 266,534 | 197,959 | 152,806 | |||||||||||||||
| Production and manufacturing expenses |
40,525 | 38,521 | 40,268 | 35,792 | 33,027 | |||||||||||||||
| Selling, general, and administrative expenses |
12,877 | 13,877 | 14,983 | 14,683 | 14,735 | |||||||||||||||
| Depreciation and depletion |
17,182 | 15,888 | 15,583 | 14,760 | 11,917 | |||||||||||||||
| Exploration expenses, including dry holes |
1,976 | 1,840 | 2,081 | 2,144 | 2,021 | |||||||||||||||
| Interest expense |
9 | 327 | 247 | 259 | 548 | |||||||||||||||
| Sales-based taxes(1) |
30,589 | 32,409 | 33,503 | 28,547 | 25,936 | |||||||||||||||
| Other taxes and duties |
33,230 | 35,558 | 39,973 | 36,118 | 34,819 | |||||||||||||||
|
|
|
|
||||||||||||||||||
| Total costs and other deductions |
380,544 | 401,955 | 413,172 | 330,262 | 275,809 | |||||||||||||||
|
|
|
|
||||||||||||||||||
| Income before income taxes |
57,711 | 78,726 | 73,257 | 52,959 | 34,777 | |||||||||||||||
| Income taxes |
24,263 | 31,045 | 31,051 | 21,561 | 15,119 | |||||||||||||||
|
|
|
|
||||||||||||||||||
| Net income including noncontrolling interests |
33,448 | 47,681 | 42,206 | 31,398 | 19,658 | |||||||||||||||
|
|
|
|
||||||||||||||||||
| Net income attributable to noncontrolling interests |
868 | 2,801 | 1,146 | 938 | 378 | |||||||||||||||
| Net income attributable to ExxonMobil |
32,580 | 44,880 | 41,060 | 30,460 | 19,280 | |||||||||||||||
|
|
|
|
||||||||||||||||||
| Earnings per common share (dollars) |
7.37 | 9.70 | 8.43 | 6.24 | 3.99 | |||||||||||||||
| Earnings per common share – assuming dilution (dollars) |
7.37 | 9.70 | 8.42 | 6.22 | 3.98 | |||||||||||||||
|
|
|
|
||||||||||||||||||
| (1) | Sales and other operating revenue includes sales-based taxes of $30,589 million for 2013, $32,409 million for 2012, $33,503 million for 2011, $28,547 million for 2010, and $25,936 million for 2009. |
The information in the Summary Statement of Income (for 2011 to 2013), the Summary Balance Sheet (for 2012 and 2013), and the Summary Statement of Cash Flows (for 2011 to 2013), shown on pages 87 through 89, corresponds to the information in the Consolidated Statement of Income, the Consolidated Balance Sheet, and the Consolidated Statement of Cash Flows in the financial statements of ExxonMobil’s 2013 Form 10-K. See also Management’s Discussion and Analysis of Financial Condition and Results of Operations and other information in the Financial Section of the 2013 Form 10-K.
|
|
EXXONMOBIL 2013 FINANCIAL & OPERATING REVIEW | |
Financial Information, continued
| SUMMARY BALANCE SHEET AT YEAR END | ||||||||||||||||||||
| (millions of dollars) | 2013 | 2012 | 2011 | 2010 | 2009 | |||||||||||||||
| Assets |
||||||||||||||||||||
| Current assets |
||||||||||||||||||||
| Cash and cash equivalents |
4,644 | 9,582 | 12,664 | 7,825 | 10,693 | |||||||||||||||
| Cash and cash equivalents – restricted |
269 | 341 | 404 | 628 | – | |||||||||||||||
| Notes and accounts receivable, less estimated doubtful amounts |
33,152 | 34,987 | 38,642 | 32,284 | 27,645 | |||||||||||||||
| Inventories |
||||||||||||||||||||
| Crude oil, products and merchandise |
12,117 | 10,836 | 11,665 | 9,852 | 8,718 | |||||||||||||||
| Materials and supplies |
4,018 | 3,706 | 3,359 | 3,124 | 2,835 | |||||||||||||||
| Other current assets |
5,108 | 5,008 | 6,229 | 5,271 | 5,344 | |||||||||||||||
|
|
|
|
||||||||||||||||||
| Total current assets |
59,308 | 64,460 | 72,963 | 58,984 | 55,235 | |||||||||||||||
|
|
|
|
||||||||||||||||||
| Investments, advances and long-term receivables |
36,328 | 34,718 | 34,333 | 35,338 | 31,665 | |||||||||||||||
| Property, plant and equipment, at cost, less accumulated depreciation and depletion |
243,650 | 226,949 | 214,664 | 199,548 | 139,116 | |||||||||||||||
| Other assets, including intangibles, net |
7,522 | 7,668 | 9,092 | 8,640 | 7,307 | |||||||||||||||
|
|
|
|
||||||||||||||||||
| Total assets |
346,808 | 333,795 | 331,052 | 302,510 | 233,323 | |||||||||||||||
|
|
|
|
||||||||||||||||||
| Liabilities |
||||||||||||||||||||
| Current liabilities |
||||||||||||||||||||
| Notes and loans payable |
15,808 | 3,653 | 7,711 | 2,787 | 2,476 | |||||||||||||||
| Accounts payable and accrued liabilities |
48,085 | 50,728 | 57,067 | 50,034 | 41,275 | |||||||||||||||
| Income taxes payable |
7,831 | 9,758 | 12,727 | 9,812 | 8,310 | |||||||||||||||
|
|
|
|
||||||||||||||||||
| Total current liabilities |
71,724 | 64,139 | 77,505 | 62,633 | 52,061 | |||||||||||||||
|
|
|
|
||||||||||||||||||
| Long-term debt |
6,891 | 7,928 | 9,322 | 12,227 | 7,129 | |||||||||||||||
| Postretirement benefits reserves |
20,646 | 25,267 | 24,994 | 19,367 | 17,942 | |||||||||||||||
| Deferred income tax liabilities |
40,530 | 37,570 | 36,618 | 35,150 | 23,148 | |||||||||||||||
| Long-term obligations to equity companies |
4,742 | 3,555 | 1,808 | 962 | 65 | |||||||||||||||
| Other long-term obligations |
21,780 | 23,676 | 20,061 | 19,492 | 17,586 | |||||||||||||||
|
|
|
|
||||||||||||||||||
| Total liabilities |
166,313 | 162,135 | 170,308 | 149,831 | 117,931 | |||||||||||||||
|
|
|
|
||||||||||||||||||
| Commitments and contingencies |
See footnote 1 | |||||||||||||||||||
| Equity |
||||||||||||||||||||
| Common stock without par value |
10,077 | 9,653 | 9,512 | 9,371 | 5,503 | |||||||||||||||
| Earnings reinvested |
387,432 | 365,727 | 330,939 | 298,899 | 276,937 | |||||||||||||||
| Accumulated other comprehensive income |
(10,725 | ) | (12,184 | ) | (9,123 | ) | (4,823 | ) | (5,461 | ) | ||||||||||
| Common stock held in treasury |
(212,781 | ) | (197,333 | ) | (176,932 | ) | (156,608 | ) | (166,410 | ) | ||||||||||
|
|
|
|
||||||||||||||||||
| ExxonMobil share of equity |
174,003 | 165,863 | 154,396 | 146,839 | 110,569 | |||||||||||||||
|
|
|
|
||||||||||||||||||
| Noncontrolling interests |
6,492 | 5,797 | 6,348 | 5,840 | 4,823 | |||||||||||||||
|
|
|
|
||||||||||||||||||
| Total equity |
180,495 | 171,660 | 160,744 | 152,679 | 115,392 | |||||||||||||||
|
|
|
|
||||||||||||||||||
| Total liabilities and equity |
346,808 | 333,795 | 331,052 | 302,510 | 233,323 | |||||||||||||||
|
|
|
|
||||||||||||||||||
| (1) | For more information, please refer to Note 16 in the Financial Section of ExxonMobil’s 2013 Form 10-K. |
The information in the Summary Statement of Income (for 2011 to 2013), the Summary Balance Sheet (for 2012 and 2013), and the Summary Statement of Cash Flows (for 2011 to 2013), shown on pages 87 through 89, corresponds to the information in the Consolidated Statement of Income, the Consolidated Balance Sheet, and the Consolidated Statement of Cash Flows in the financial statements of ExxonMobil’s 2013 Form 10-K. See also Management’s Discussion and Analysis of Financial Condition and Results of Operations and other information in the Financial Section of the 2013 Form 10-K.
|
| ||
| SUMMARY STATEMENT OF CASH FLOWS | ||||||||||||||||||||
| (millions of dollars) | 2013 | 2012 | 2011 | 2010 | 2009 | |||||||||||||||
| Cash Flows from Operating Activities |
||||||||||||||||||||
| Net income including noncontrolling interests |
33,448 | 47,681 | 42,206 | 31,398 | 19,658 | |||||||||||||||
| Adjustments for noncash transactions |
||||||||||||||||||||
| Depreciation and depletion |
17,182 | 15,888 | 15,583 | 14,760 | 11,917 | |||||||||||||||
| Deferred income tax charges/(credits) |
754 | 3,142 | 142 | (1,135 | ) | – | ||||||||||||||
| Postretirement benefits expense in excess of/ (less than) net payments |
2,291 | (315 | ) | 544 | 1,700 | (1,722 | ) | |||||||||||||
| Other long-term obligation provisions in excess of/(less than) payments |
(2,566 | ) | 1,643 | (151 | ) | 160 | 731 | |||||||||||||
| Dividends received greater than/(less than) equity in current earnings of equity companies |
3 | (1,157 | ) | (273 | ) | (596 | ) | (483 | ) | |||||||||||
| Changes in operational working capital, excluding cash and debt |
||||||||||||||||||||
| Reduction/(increase) – Notes and accounts receivable |
(305 | ) | (1,082 | ) | (7,906 | ) | (5,863 | ) | (3,170 | ) | ||||||||||
| – Inventories |
(1,812 | ) | (1,873 | ) | (2,208 | ) | (1,148 | ) | 459 | |||||||||||
| – Other current assets |
(105 | ) | (42 | ) | 222 | 913 | 132 | |||||||||||||
| Increase/(reduction) – Accounts and other payables |
(2,498 | ) | 3,624 | 8,880 | 9,943 | 1,420 | ||||||||||||||
| Net (gain) on asset sales |
(1,828 | ) | (13,018 | ) | (2,842 | ) | (1,401 | ) | (488 | ) | ||||||||||
| All other items – net |
350 | 1,679 | 1,148 | (318 | ) | (16 | ) | |||||||||||||
|
|
|
|
||||||||||||||||||
| Net cash provided by operating activities |
44,914 | 56,170 | 55,345 | 48,413 | 28,438 | |||||||||||||||
|
|
|
|
||||||||||||||||||
| Cash Flows from Investing Activities |
||||||||||||||||||||
| Additions to property, plant and equipment |
(33,669 | ) | (34,271 | ) | (30,975 | ) | (26,871 | ) | (22,491 | ) | ||||||||||
| Proceeds associated with sales of subsidiaries, property, plant and equipment, and sales and returns of investments |
2,707 | 7,655 | 11,133 | 3,261 | 1,545 | |||||||||||||||
| Decrease/(increase) in restricted cash and cash equivalents |
72 | 63 | 224 | (628 | ) | – | ||||||||||||||
| Additional investments and advances |
(4,435 | ) | (598 | ) | (3,586 | ) | (1,239 | ) | (2,752 | ) | ||||||||||
| Collection of advances |
1,124 | 1,550 | 1,119 | 1,133 | 724 | |||||||||||||||
| Additions to marketable securities |
– | – | (1,754 | ) | (15 | ) | (16 | ) | ||||||||||||
| Sales of marketable securities |
– | – | 1,674 | 155 | 571 | |||||||||||||||
|
|
|
|
||||||||||||||||||
| Net cash used in investing activities |
(34,201 | ) | (25,601 | ) | (22,165 | ) | (24,204 | ) | (22,419 | ) | ||||||||||
|
|
|
|
||||||||||||||||||
| Cash Flows from Financing Activities |
||||||||||||||||||||
| Additions to long-term debt |
345 | 995 | 702 | 1,143 | 225 | |||||||||||||||
| Reductions in long-term debt |
(13 | ) | (147 | ) | (266 | ) | (6,224 | ) | (68 | ) | ||||||||||
| Additions to short-term debt |
16 | 958 | 1,063 | 598 | 1,336 | |||||||||||||||
| Reductions in short-term debt |
(756 | ) | (4,488 | ) | (1,103 | ) | (2,436 | ) | (1,575 | ) | ||||||||||
| Additions/(reductions) in debt with three months or less maturity |
12,012 | (226 | ) | 1,561 | 709 | (71 | ) | |||||||||||||
| Cash dividends to ExxonMobil shareholders |
(10,875 | ) | (10,092 | ) | (9,020 | ) | (8,498 | ) | (8,023 | ) | ||||||||||
| Cash dividends to noncontrolling interests |
(304 | ) | (327 | ) | (306 | ) | (281 | ) | (280 | ) | ||||||||||
| Changes in noncontrolling interests |
(1 | ) | 204 | (16 | ) | (7 | ) | (113 | ) | |||||||||||
| Tax benefits related to stock-based awards |
48 | 130 | 260 | 122 | 237 | |||||||||||||||
| Common stock acquired |
(15,998 | ) | (21,068 | ) | (22,055 | ) | (13,093 | ) | (19,703 | ) | ||||||||||
| Common stock sold |
50 | 193 | 924 | 1,043 | 752 | |||||||||||||||
|
|
|
|
||||||||||||||||||
| Net cash used in financing activities |
(15,476 | ) | (33,868 | ) | (28,256 | ) | (26,924 | ) | (27,283 | ) | ||||||||||
|
|
|
|
||||||||||||||||||
| Effects of exchange rate changes on cash |
(175 | ) | 217 | (85 | ) | (153 | ) | 520 | ||||||||||||
|
|
|
|
||||||||||||||||||
| Increase/(decrease) in cash and cash equivalents |
(4,938 | ) | (3,082 | ) | 4,839 | (2,868 | ) | (20,744 | ) | |||||||||||
| Cash and cash equivalents at beginning of year |
9,582 | 12,664 | 7,825 | 10,693 | 31,437 | |||||||||||||||
|
|
|
|
||||||||||||||||||
| Cash and cash equivalents at end of year |
4,644 | 9,582 | 12,664 | 7,825 | 10,693 | |||||||||||||||
|
|
|
|
||||||||||||||||||
The information in the Summary Statement of Income (for 2011 to 2013), the Summary Balance Sheet (for 2012 and 2013), and the Summary Statement of Cash Flows (for 2011 to 2013), shown on pages 87 through 89, corresponds to the information in the Consolidated Statement of Income, the Consolidated Balance Sheet, and the Consolidated Statement of Cash Flows in the financial statements of ExxonMobil’s 2013 Form 10-K. See also Management’s Discussion and Analysis of Financial Condition and Results of Operations and other information in the Financial Section of the 2013 Form 10-K.
|
|
EXXONMOBIL 2013 FINANCIAL & OPERATING REVIEW | |
Listed below are definitions of several of ExxonMobil’s key business and financial performance measures and other terms. These definitions are provided to facilitate understanding of the terms and their calculation. In the case of financial measures that we believe constitute “non-GAAP financial measures” under Securities and Exchange Commission Regulation G, we provide a reconciliation to the most comparable Generally Accepted Accounting Principles (GAAP) measure and other information required by that rule.
Total Shareholder Return • Measures the change in value of an investment in stock over a specified period of time, assuming dividend reinvestment. We calculate shareholder return over a particular measurement period by: dividing (1) the sum of (a) the cumulative value of dividends received during the measurement period, assuming reinvestment, plus (b) the difference between the stock price at the end and at the beginning of the measurement period; by (2) the stock price at the beginning of the measurement period. For this purpose, we assume dividends are reinvested in stock at market prices at approximately the same time actual dividends are paid. Shareholder return is usually quoted on an annualized basis.
Capital and Exploration Expenditures (Capex) • Represents the combined total of additions at cost to property, plant and equipment and exploration expenses on a before-tax basis from the Summary Statement of Income. ExxonMobil’s Capex includes its share of similar costs for equity companies. Capex excludes assets acquired in nonmonetary exchanges (effective 2013) and depreciation on the cost of exploration support equipment and facilities recorded to property, plant and equipment when acquired. While ExxonMobil’s management is responsible for all investments and elements of net income, particular focus is placed on managing the controllable aspects of this group of expenditures.
Entitlement Volume Effects • Production Sharing Contract (PSC) net interest reductions are contractual reductions in ExxonMobil’s share of production volumes covered by PSCs. These reductions typically occur when cumulative investment returns or production volumes achieve thresholds as specified in the PSCs. Once a net interest reduction has occurred, it typically will not be reversed by subsequent events, such as lower crude oil prices. Price and Spend Impacts on Volumes are fluctuations in ExxonMobil’s share of production volumes caused by changes in oil and gas prices or spending levels from one period to another. For example, at higher prices, fewer barrels are required for ExxonMobil to recover its costs. According to the terms of contractual arrangements or government royalty regimes, price or spending variability can increase or decrease royalty burdens and/or volumes attributable to ExxonMobil. These effects generally vary from period to period with field spending patterns or market prices for crude oil or natural gas.
Heavy Oil and Oil Sands • Heavy oil, for the purpose of this report, includes heavy oil, extra heavy oil, and bitumen, as defined by the World Petroleum Congress in 1987 based on American Petroleum Institute (API) gravity and viscosity at reservoir conditions. Heavy oil has an API gravity between 10 and 22.3 degrees. The API gravity of extra heavy oil and bitumen is less than 10 degrees. Extra heavy oil has a viscosity less than 10 thousand centipoise, whereas the viscosity of bitumen is greater than 10 thousand centipoise. The term “oil sands” is used to indicate heavy oil (generally bitumen) that is recovered in a mining operation.
Proved Reserves • Proved reserve figures in this publication are determined in accordance with current SEC definitions. In statements covering reserve replacement for years prior to 2009, reserves were determined using the price and cost assumptions we used in managing the business, not the historical prices used in SEC definitions. The pre-2009 reserves also included oil sands and equity company reserves which at the time were excluded from SEC reserves.
Resources, Resource Base, and Recoverable Resources • Along with similar terms used in this report, refers to the total remaining estimated quantities of oil and gas that are expected to be ultimately recoverable. ExxonMobil refers to new discoveries and acquisitions of discovered resources as resource additions. The resource base includes quantities of oil and gas that are not yet classified as proved reserves, but which ExxonMobil believes will likely be moved into the proved reserves category and produced in the future. The term “resource base” is not intended to correspond to SEC definitions such as “probable” or “possible” reserves.
|
| ||
Proved Reserves Replacement Ratio • The reserves replacement ratio is calculated for a specified period utilizing the applicable proved oil-equivalent reserves additions divided by oil-equivalent production. See “Proved Reserves” on previous page.
Prime Product Sales • Prime product sales are total product sales excluding carbon black oil and sulfur. Prime product sales include ExxonMobil’s share of equity company volumes and finished product transfers to the Downstream.
| PROVED RESERVES REPLACEMENT COSTS | 2013 | 2012 | 2011 | 2010 | 2009 | |||||||||||||||
| Costs incurred (millions of dollars) |
||||||||||||||||||||
| Property acquisition costs |
5,186 | 2,207 | 3,787 | 45,461 | 1,285 | |||||||||||||||
| Exploration costs |
2,972 | 2,861 | 2,503 | 3,055 | 3,111 | |||||||||||||||
| Development costs |
27,807 | 27,482 | 25,690 | 23,210 | 17,130 | |||||||||||||||
|
|
|
|
||||||||||||||||||
| Total costs incurred |
35,965 | 32,550 | 31,980 | 71,726 | 21,526 | |||||||||||||||
| Proved oil-equivalent reserves additions |
|
|||||||||||||||||||
| Revisions |
770 | 159 | 281 | 505 | 383 | |||||||||||||||
| Improved recovery |
– | 23 | – | 5 | 15 | |||||||||||||||
| Extensions/discoveries |
726 | 1,490 | 1,613 | 516 | 1,091 | |||||||||||||||
| Purchases |
170 | 304 | 67 | 2,510 | 1 | |||||||||||||||
|
|
|
|
||||||||||||||||||
| Total oil-equivalent reserves additions |
1,666 | 1,976 | 1,961 | 3,536 | 1,490 | |||||||||||||||
|
|
|
|
||||||||||||||||||
| Proved reserves replacement costs (dollars per barrel) |
21.59 | 16.47 | 16.31 | 20.28 | 14.45 | |||||||||||||||
|
|
|
|
||||||||||||||||||
Proved reserves replacement costs per oil-equivalent barrel is a performance measure ratio and includes costs incurred in property acquisition and exploration, plus costs incurred in development activities, divided by proved oil-equivalent reserves additions, excluding sales. ExxonMobil reports these costs based on proved reserves in accordance with current SEC definitions. See “Proved Reserves” on previous page.
| EXPLORATION RESOURCE ADDITION COST | 2013 | 2012 | 2011 | 2010 | 2009 | |||||||||||||||
| Exploration portion of Upstream Capex (millions of dollars) |
7,155 | 4,740 | 5,464 | 4,121 | 3,718 | |||||||||||||||
| Exploration resource additions (millions of oil-equivalent barrels) |
5,703 | 3,734 | 3,906 | 4,725 | 2,860 | |||||||||||||||
| Exploration resource addition cost per OEB (dollars) |
1.25 | 1.27 | 1.40 | 0.87 | 1.30 | |||||||||||||||
Exploration resource addition cost per oil-equivalent barrel is a performance measure that is calculated using the Exploration portion of Upstream capital and exploration expenditures (Capex) divided by exploration resource additions (in oil-equivalent barrels – OEB). ExxonMobil refers to new discoveries, and the non-proved portion of discovered resources that were acquired, as exploration resource additions. Exploration resource additions include quantities of oil and gas that are not yet classified as proved reserves, but which ExxonMobil believes will likely be moved into the proved reserves category and produced in the future. The impact of the XTO Energy Inc. merger transaction is excluded in 2010.
| CASH FLOW FROM OPERATIONS AND ASSET SALES | 2013 | 2012 | 2011 | 2010 | 2009 | |||||||||||||||
| (millions of dollars) | ||||||||||||||||||||
| Net cash provided by operating activities |
44,914 | 56,170 | 55,345 | 48,413 | 28,438 | |||||||||||||||
| Proceeds associated with sales of subsidiaries, property, plant and equipment, and sales and returns of investments |
2,707 | 7,655 | 11,133 | 3,261 | 1,545 | |||||||||||||||
|
|
|
|
||||||||||||||||||
| Cash flow from operations and asset sales |
47,621 | 63,825 | 66,478 | 51,674 | 29,983 | |||||||||||||||
|
|
|
|
||||||||||||||||||
Cash flow from operations and asset sales is the sum of the net cash provided by operating activities and proceeds associated with sales of subsidiaries, property, plant and equipment, and sales and returns of investments from the Summary Statement of Cash Flows. This cash flow is the total sources of cash from both operating the Corporation’s assets and from the divesting of assets. The Corporation employs a long-standing and regular disciplined review process to ensure that all assets are contributing to the Corporation’s strategic objectives. Assets are divested when they are no longer meeting these objectives or are worth considerably more to others. Because of the regular nature of this activity, we believe it is useful for investors to consider proceeds associated with asset sales together with cash provided by operating activities when evaluating cash available for investment in the business and financing activities, including shareholder distributions.
|
|
EXXONMOBIL 2013 FINANCIAL & OPERATING REVIEW | |
Frequently Used Terms, continued
| FREE CASH FLOW | 2013 | 2012 | 2011 | 2010 | 2009 | |||||||||||||||
| (millions of dollars) | ||||||||||||||||||||
| Net cash provided by operating activities |
44,914 | 56,170 | 55,345 | 48,413 | 28,438 | |||||||||||||||
| Additions to property, plant and equipment |
(33,669 | ) | (34,271 | ) | (30,975 | ) | (26,871 | ) | (22,491 | ) | ||||||||||
| Proceeds associated with sales of subsidiaries, property, plant and equipment, and sales and returns of investments |
2,707 | 7,655 | 11,133 | 3,261 | 1,545 | |||||||||||||||
| Additional investments and advances |
(4,435 | ) | (598 | ) | (3,586 | ) | (1,239 | ) | (2,752 | ) | ||||||||||
| Collection of advances |
1,124 | 1,550 | 1,119 | 1,133 | 724 | |||||||||||||||
|
|
|
|
||||||||||||||||||
| Free cash flow |
10,641 | 30,506 | 33,036 | 24,697 | 5,464 | |||||||||||||||
|
|
|
|
||||||||||||||||||
Free cash flow is cash flow from operations and asset sales less additions to property, plant and equipment, and additional investments and advances, plus collection of advances. This measure is useful when evaluating cash available for financing activities, including shareholder distributions, after investment in the business.
| OPERATING COSTS | 2013 | 2012 | 2011 | 2010 | 2009 | |||||||||||||||
| (millions of dollars) | ||||||||||||||||||||
| Reconciliation of Operating Costs |
||||||||||||||||||||
| From ExxonMobil’s Consolidated Statement of Income |
||||||||||||||||||||
| Total costs and other deductions |
380,544 | 401,955 | 413,172 | 330,262 | 275,809 | |||||||||||||||
| Less: |
||||||||||||||||||||
| Crude oil and product purchases |
244,156 | 263,535 | 266,534 | 197,959 | 152,806 | |||||||||||||||
| Interest expense |
9 | 327 | 247 | 259 | 548 | |||||||||||||||
| Sales-based taxes |
30,589 | 32,409 | 33,503 | 28,547 | 25,936 | |||||||||||||||
| Other taxes and duties |
33,230 | 35,558 | 39,973 | 36,118 | 34,819 | |||||||||||||||
|
|
|
|
||||||||||||||||||
| Subtotal |
72,560 | 70,126 | 72,915 | 67,379 | 61,700 | |||||||||||||||
| ExxonMobil’s share of equity company expenses |
14,531 | 12,239 | 11,401 | 9,049 | 6,670 | |||||||||||||||
|
|
|
|
||||||||||||||||||
| Total operating costs |
87,091 | 82,365 | 84,316 | 76,428 | 68,370 | |||||||||||||||
|
|
|
|
||||||||||||||||||
| Components of Operating Costs |
||||||||||||||||||||
| From ExxonMobil’s Consolidated Statement of Income |
||||||||||||||||||||
| Production and manufacturing expenses |
40,525 | 38,521 | 40,268 | 35,792 | 33,027 | |||||||||||||||
| Selling, general, and administrative expenses |
12,877 | 13,877 | 14,983 | 14,683 | 14,735 | |||||||||||||||
| Depreciation and depletion |
17,182 | 15,888 | 15,583 | 14,760 | 11,917 | |||||||||||||||
| Exploration expenses, including dry holes |
1,976 | 1,840 | 2,081 | 2,144 | 2,021 | |||||||||||||||
|
|
|
|
||||||||||||||||||
| Subtotal |
72,560 | 70,126 | 72,915 | 67,379 | 61,700 | |||||||||||||||
| ExxonMobil’s share of equity company expenses |
14,531 | 12,239 | 11,401 | 9,049 | 6,670 | |||||||||||||||
|
|
|
|
||||||||||||||||||
| Total operating costs |
87,091 | 82,365 | 84,316 | 76,428 | 68,370 | |||||||||||||||
|
|
|
|
||||||||||||||||||
Operating costs are the costs during the period to produce, manufacture, and otherwise prepare the company’s products for sale – including energy, staffing, and maintenance costs. They exclude the cost of raw materials, taxes, and interest expense and are on a before-tax basis. While ExxonMobil’s management is responsible for all revenue and expense elements of net income, operating costs, as defined above, represent the expenses most directly under management’s control and therefore, are useful for investors and ExxonMobil management in evaluating management’s performance.
| DISTRIBUTIONS TO SHAREHOLDERS | 2013 | 2012 | 2011 | 2010 | 2009 | |||||||||||||||
| (millions of dollars) | ||||||||||||||||||||
| Dividends paid to ExxonMobil shareholders |
10,875 | 10,092 | 9,020 | 8,498 | 8,023 | |||||||||||||||
| Cost of shares purchased to reduce shares outstanding |
15,000 | 20,000 | 20,000 | 11,200 | 18,000 | |||||||||||||||
|
|
|
|
||||||||||||||||||
| Distributions to ExxonMobil shareholders |
25,875 | 30,092 | 29,020 | 19,698 | 26,023 | |||||||||||||||
|
|
|
|
||||||||||||||||||
| Memo: Gross cost of shares purchased to offset shares issued under benefit plans and programs |
998 | 1,068 | 2,055 | 1,893 | 1,703 | |||||||||||||||
The Corporation distributes cash to shareholders in the form of both dividends and share purchases. Shares are purchased both to reduce shares outstanding and to offset shares issued in conjunction with company benefit plans and programs. For purposes of calculating distributions to shareholders, the Corporation only includes the cost of those shares purchased to reduce shares outstanding.
|
| ||
| CAPITAL EMPLOYED | 2013 | 2012 | 2011 | 2010 | 2009 | |||||||||||||||
| (millions of dollars) | ||||||||||||||||||||
| Business Uses: Asset and Liability Perspective |
||||||||||||||||||||
| Total assets |
346,808 | 333,795 | 331,052 | 302,510 | 233,323 | |||||||||||||||
| Less liabilities and noncontrolling interests share of assets and liabilities |
||||||||||||||||||||
| Total current liabilities excluding notes and loans payable |
(55,916 | ) | (60,486 | ) | (69,794 | ) | (59,846 | ) | (49,585 | ) | ||||||||||
| Total long-term liabilities excluding long-term debt |
(87,698 | ) | (90,068 | ) | (83,481 | ) | (74,971 | ) | (58,741 | ) | ||||||||||
| Noncontrolling interests share of assets and liabilities |
(8,935 | ) | (6,235 | ) | (7,314 | ) | (6,532 | ) | (5,642 | ) | ||||||||||
| Add ExxonMobil share of debt-financed equity company net assets |
6,109 | 5,775 | 4,943 | 4,875 | 5,043 | |||||||||||||||
|
|
|
|
||||||||||||||||||
| Total capital employed |
200,368 | 182,781 | 175,406 | 166,036 | 124,398 | |||||||||||||||
|
|
|
|
||||||||||||||||||
| Total Corporate Sources: Debt and Equity Perspective |
||||||||||||||||||||
| Notes and loans payable |
15,808 | 3,653 | 7,711 | 2,787 | 2,476 | |||||||||||||||
| Long-term debt |
6,891 | 7,928 | 9,322 | 12,227 | 7,129 | |||||||||||||||
| ExxonMobil share of equity |
174,003 | 165,863 | 154,396 | 146,839 | 110,569 | |||||||||||||||
| Less noncontrolling interests share of total debt |
(2,443 | ) | (438 | ) | (966 | ) | (692 | ) | (819 | ) | ||||||||||
| Add ExxonMobil share of equity company debt |
6,109 | 5,775 | 4,943 | 4,875 | 5,043 | |||||||||||||||
|
|
|
|
||||||||||||||||||
| Total capital employed |
200,368 | 182,781 | 175,406 | 166,036 | 124,398 | |||||||||||||||
|
|
|
|
||||||||||||||||||
Capital employed is a measure of net investment. When viewed from the perspective of how the capital is used by the businesses, it includes ExxonMobil’s net share of property, plant and equipment and other assets less liabilities, excluding both short-term and long-term debt. When viewed from the perspective of the sources of capital employed in total for the Corporation, it includes ExxonMobil’s share of total debt and equity. Both of these views include ExxonMobil’s share of amounts applicable to equity companies, which the Corporation believes should be included to provide a more comprehensive measure of capital employed.
| RETURN ON AVERAGE CAPITAL EMPLOYED (ROCE) | 2013 | 2012 | 2011 | 2010 | 2009 | |||||||||||||||
| (millions of dollars) | ||||||||||||||||||||
| Net income attributable to ExxonMobil |
32,580 | 44,880 | 41,060 | 30,460 | 19,280 | |||||||||||||||
| Financing costs (after tax) |
||||||||||||||||||||
| Gross third-party debt |
(163 | ) | (401 | ) | (153 | ) | (803 | ) | (303 | ) | ||||||||||
| ExxonMobil share of equity companies |
(239 | ) | (257 | ) | (219 | ) | (333 | ) | (285 | ) | ||||||||||
| All other financing costs – net |
83 | 100 | 116 | 35 | (483 | ) | ||||||||||||||
|
|
|
|
||||||||||||||||||
| Total financing costs |
(319 | ) | (558 | ) | (256 | ) | (1,101 | ) | (1,071 | ) | ||||||||||
|
|
|
|
||||||||||||||||||
| Earnings excluding financing costs |
32,899 | 45,438 | 41,316 | 31,561 | 20,351 | |||||||||||||||
|
|
|
|
||||||||||||||||||
| Average capital employed |
191,575 | 179,094 | 170,721 | 145,217 | 125,050 | |||||||||||||||
| Return on average capital employed – corporate total |
17.2% | 25.4% | 24.2% | 21.7% | 16.3% | |||||||||||||||
ROCE is a performance measure ratio. From the perspective of the business segments, ROCE is annual business segment earnings divided by average business segment capital employed (average of beginning and end-of-year amounts). These segment earnings include ExxonMobil’s share of segment earnings of equity companies, consistent with our capital employed definition, and exclude the cost of financing. The Corporation’s total ROCE is net income attributable to ExxonMobil excluding the after-tax cost of financing, divided by total corporate average capital employed. The Corporation has consistently applied its ROCE definition for many years and views it as the best measure of historical capital productivity in our capital-intensive, long-term industry, both to evaluate management’s performance and to demonstrate to shareholders that capital has been used wisely over the long term. Additional measures, which are more cash flow based, are used to make investment decisions. See page 83 for segment information relevant to ROCE.
|
|
EXXONMOBIL 2013 FINANCIAL & OPERATING REVIEW | |
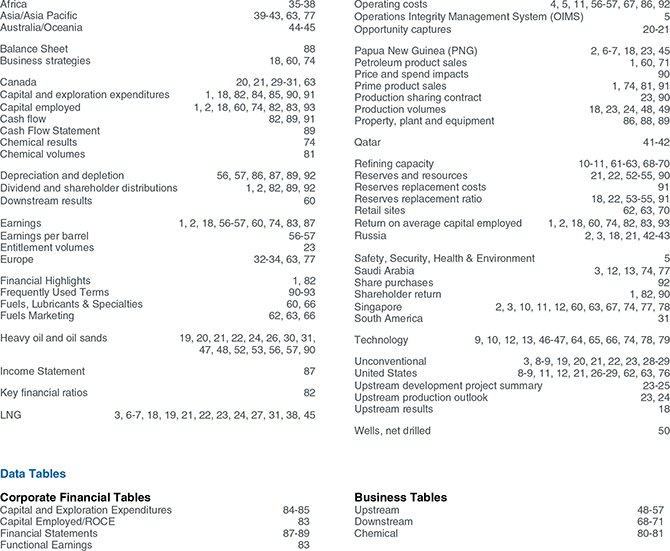
Exxon Mobil Corporation has numerous affiliates, many with names that include ExxonMobil, Exxon, Mobil, Esso, and XTO. For convenience and simplicity, those terms and terms such as Corporation, company, our, we, and its are sometimes used as abbreviated references to specific affiliates or affiliate groups. Abbreviated references describing global or regional operational organizations, and global or regional business lines are also sometimes used for convenience and simplicity. Similarly, ExxonMobil has business relationships with thousands of customers, suppliers, governments, and others. For convenience and simplicity, words such as venture, joint venture, partnership, co-venturer, and partner are used to indicate business and other relationships involving common activities and interests, and those words may not indicate precise legal relationships.
The following are trademarks, service marks, or proprietary process names of Exxon Mobil Corporation or one of its affiliates: ExxonMobil, Esso, Exxon, Mobil, Mobil 1, Mobil 1 AFE, Mobil Delvac 1, Mobil SHC, Controlled Freeze Zone, Achieve, Enable, Escaid, Exact, Exceed, SpectraSyn Elite, Vistalon, Vistamaxx, and XFrac. The following third-party trademarks or service marks referenced in the text of the report are owned by the entities indicated: Porsche (Dr. Ing. H.c.F. Porsche AG), Bentley (Bentley Motors Limited), Mercedes AMG (Daimler AG), Corvette (General Motors LLC), and Lexus (Toyota Jidosha KK).

Corporate Headquarters
Exxon Mobil Corporation
5959 Las Colinas Boulevard
Irving, TX 75039-2298
Additional copies may be
obtained by writing or phoning:
Phone: 972-444-1000
Fax: 972-444-1505
Shareholder Relations
Exxon Mobil Corporation
P.O. Box 140369
Irving, TX 75014-0369
Market Information
The New York Stock Exchange is the principal exchange
on which Exxon Mobil Corporation common stock
(symbol XOM) is traded.
Annual Meeting
The 2014 Annual Meeting of Shareholders will be held at
9:30 a.m. Central Time on Wednesday, May 28, 2014, at:
The Morton H. Meyerson Symphony Center
2301 Flora Street
Dallas, TX 75201
An audio webcast with a slide presentation will be provided
on the Internet at exxonmobil.com. Information about the
webcast will be available one week prior to the event.

EXXONMOBIL ON THE INTERNET
A quick, easy way to get information about ExxonMobil
ExxonMobil publications and important shareholder
information are available on the Internet
at exxonmobil.com:
• Publications
• Stock Quote
• Dividend Information
• Contact Information
• Speeches
• News Releases
• Investor Presentations
• Corporate Governance