Exhibit 99.2
2014 Analyst Meeting
New York Stock Exchange
March 5, 2014
Exxon Mobil
Energy lives hereTM
Cautionary Statement
“ Forward-Looking Statements. Outlooks, projections, estimates, targets, business plans, and other statements of future events or conditions in this presentation or the subsequent discussion period are forward-looking statements. Actual future results, including financial and operating performance; demand growth and mix; ExxonMobil’s production growth and mix; the amount and mix of capital expenditures; future distributions; resource additions and recoveries; finding and development costs; project plans, timing, costs, and capacities; efficiency gains; cost efficiencies; integration benefits; product sales and mix; and the impact of technology could differ materially due to a number of factors. These include changes in oil or gas prices or other market conditions affecting the oil, gas, and petrochemical industries; reservoir performance; timely completion of development projects; war and other political or security disturbances; changes in law or government regulation; the outcome of commercial negotiations; the actions of competitors and customers; unexpected technological developments; the occurrence and duration of economic recessions; unforeseen technical difficulties; and other factors discussed here and under the heading “Factors Affecting Future Results” in the Investors section of our Web site at exxonmobil.com. See also Item 1A of ExxonMobil’s 2013 Form 10-K. Forward-looking statements are based on management’s knowledge and reasonable expectations on the date hereof, and we assume no duty to update these statements as of any future date.
“ Frequently Used Terms. References to resources, resource base, recoverable resources, and similar terms include quantities of oil and gas that are not yet classified as proved reserves but that we believe will likely be moved into the proved reserves category and produced in the future. “Proved reserves” in this presentation are presented using the SEC pricing basis in effect for the year presented, except for the calculation of 20 straight years of at least 100-percent replacement; oil sands and equity company reserves are included for all periods. For definitions of, and information regarding, reserves, return on average capital employed, cash flow from operations and asset sales, free cash flow, and other terms used in this presentation, including information required by SEC Regulation G, see the “Frequently Used Terms” posted on the Investors section of our Web site. The Financial and Operating Review on our Web site also shows ExxonMobil’s net interest in specific projects.
The term ‘project’ as used in this presentation can refer to a variety of different activities and does not necessarily have the same meaning as in any government payment transparency reports.
| 2 |
|
Agenda
9am Welcome
David Rosenthal, Vice President, Investor Relations and Secretary Financial & Operating Review Energy Outlook Strategic Overview Rex Tillerson, Chairman and CEO
Risk Management
Delivering Profitable Growth
Upstream Production Growth Mark Albers, Senior Vice President
Upstream Long-Term Opportunity Set Andrew Swiger, Senior Vice President Downstream & Chemical Mike Dolan, Senior Vice President Break Summary Rex Tillerson, Chairman and CEO 11am Q&A
12pm Meeting Concludes
| 3 |
|
Financial & Operating Review
Rex Tillerson
Chairman and CEO
Financial & Operating Review
Key Messages
Maintaining relentless focus on risk management and operational excellence
Major project start-ups delivering production volume growth through 2017
Improving Upstream unit profitability
Developing a unique and balanced set of profitable growth opportunities
Continuing disciplined capital allocation
Growing free cash flow and generating long-term shareholder value
| 5 |
|
Financial & Operating Review
2013 Results
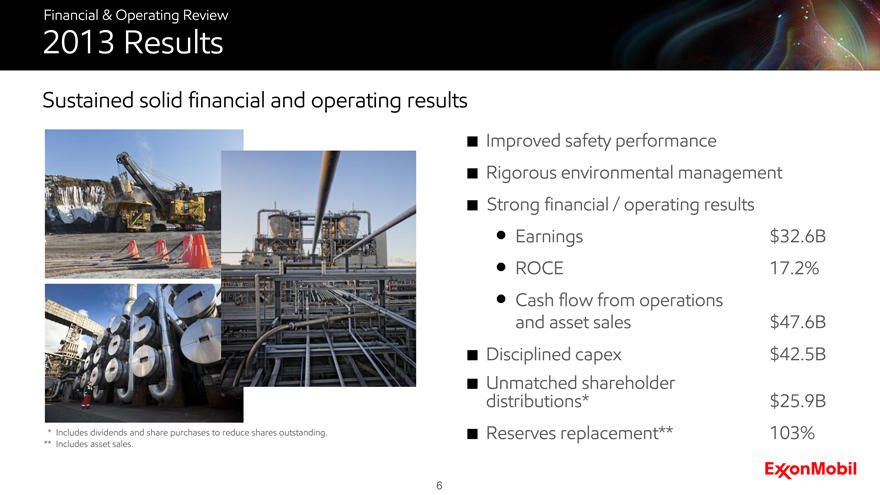
Sustained solid financial and operating results
Improved safety performance
Rigorous environmental management
Strong financial / operating results
Earnings
$32.6B
ROCE
17.2%
Cash flow from operations
| * |
|
Includes dividends and share purchases to reduce shares outstanding. and asset sales |
** Includes asset sales.
| 6 |
|
Disciplined capex
$47.6B
Unmatched shareholder distributions*
$42.5B
$25.9B
Reserves replacement**
103%
Financial & Operating Review
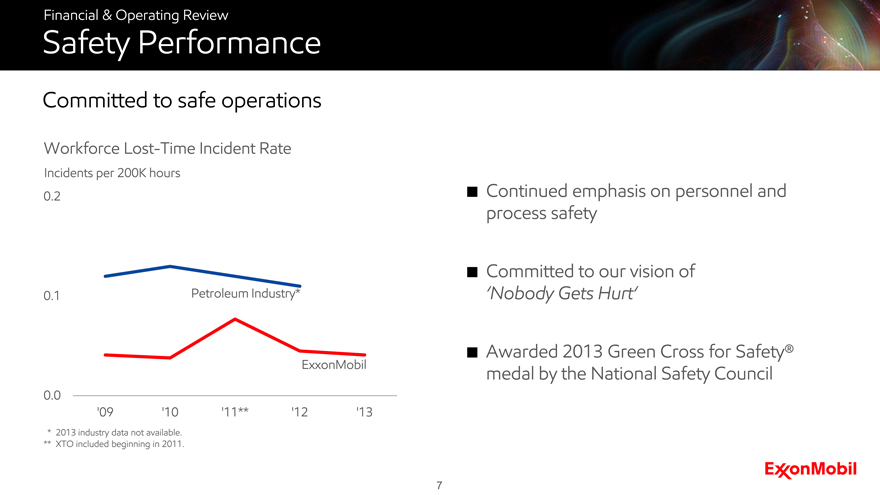
Safety Performance
Committed to safe operations
Workforce Lost-Time Incident Rate
Incidents per 200K hours
Continued emphasis on personnel and process safety
Committed to our vision of
‘Nobody Gets Hurt’
Awarded 2013 Green Cross for Safety® medal by the National Safety Council
| * |
|
2013 industry data not available. |
** XTO included beginning in 2011.
| 7 |
|
Petroleum Industry*
ExxonMobil’09 ‘10 ‘11** ‘12 ‘13
Financial & Operating Review
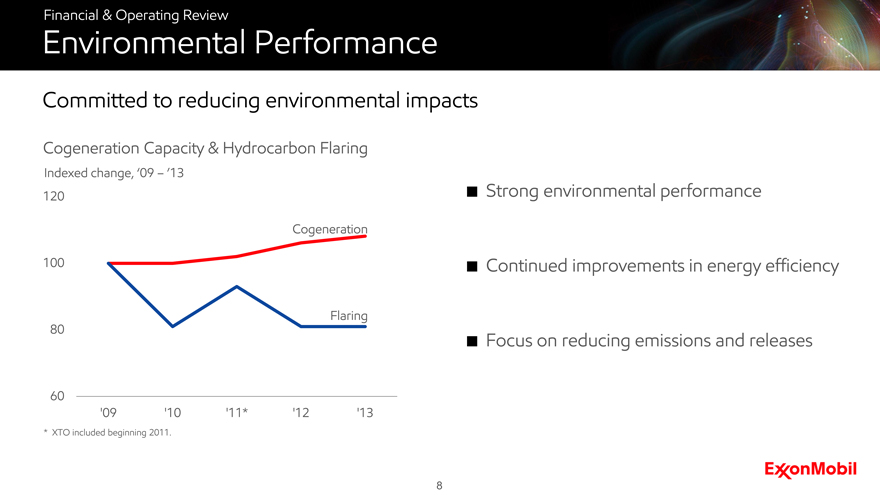
Environmental Performance
Committed to reducing environmental impacts
Cogeneration Capacity & Hydrocarbon Flaring
Indexed change, ‘09 -’13
‘09 ‘10 ‘11* ‘12 ‘13
| * |
|
XTO included beginning 2011. |
Cogeneration Flaring 120 100 80 60
Strong environmental performance
Continued improvements in energy efficiency
Focus on reducing emissions and releases
| 8 |
|
Financial & Operating Review
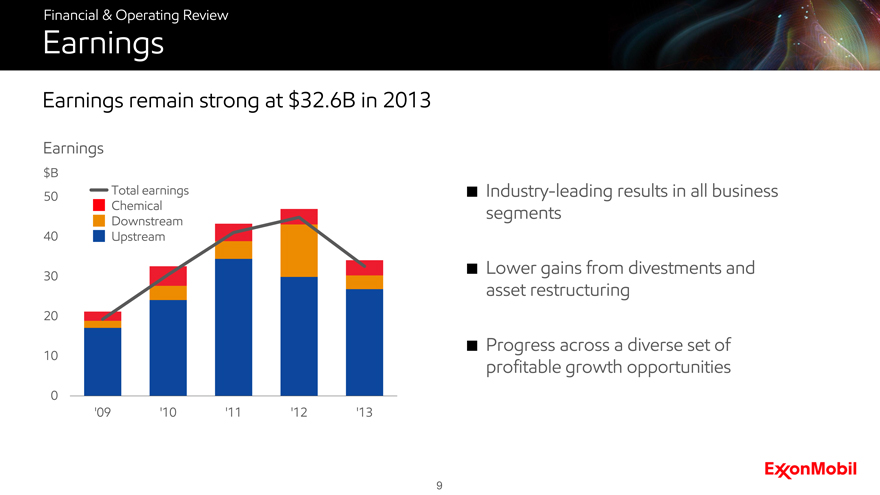
Earnings
Earnings remain strong at $32.6B in 2013
Earnings
$B
50 40
30 20 10 0 ‘09 ‘10 ‘11 ‘12 ‘13
Total earnings
Chemical
Downstream
Upstream
Industry-leading results in all business segments
Lower gains from divestments and asset restructuring
Progress across a diverse set of profitable growth opportunities
| 9 |
|
Financial & Operating Review
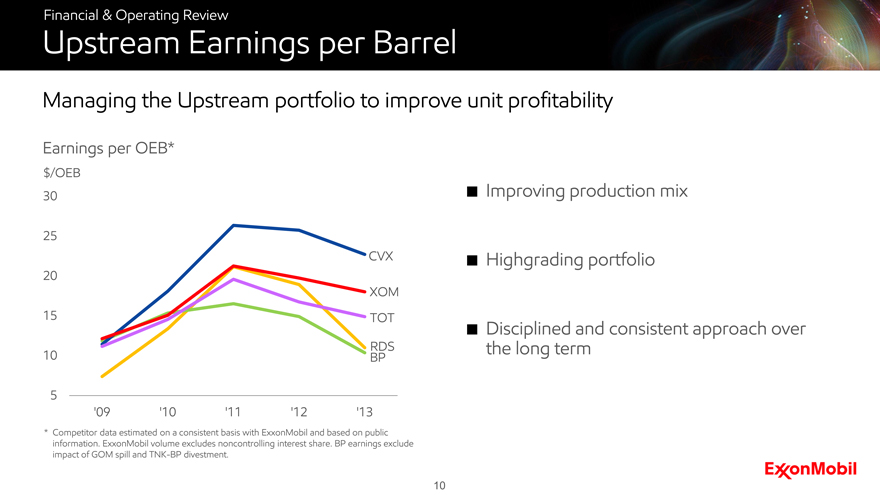
Upstream Earnings per Barrel
Managing the Upstream portfolio to improve unit profitability
Earnings per OEB*
$/OEB
30 25 20 15 10 5 ‘09 ‘10 ‘11 ‘12 ‘13
CVX XOM TOT RDS BP
* Competitor data estimated on a consistent basis with ExxonMobil and based on public information. ExxonMobil volume excludes noncontrolling interest share. BP earnings exclude impact of GOM spill and TNK-BP divestment.
Improving production mix
Highgrading portfolio
Disciplined and consistent approach over the long term
10
Financial & Operating Review
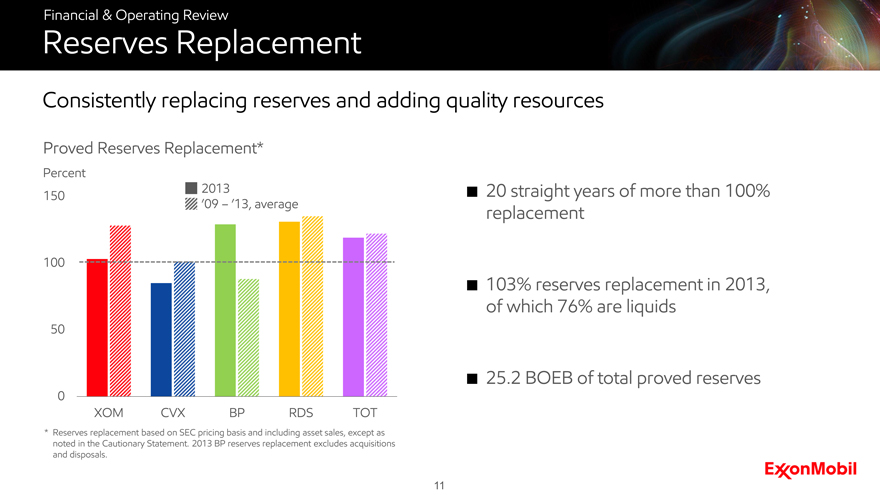
Reserves Replacement
Consistently replacing reserves and adding quality resources
Proved Reserves Replacement*
Percent
* Reserves replacement based on SEC pricing basis and including asset sales, except as noted in the Cautionary Statement. 2013 BP reserves replacement excludes acquisitions and disposals.
20 straight years of more than 100% replacement
103% reserves replacement in 2013, of which 76% are liquids
25.2 BOEB of total proved reserves
11
Financial & Operating Review
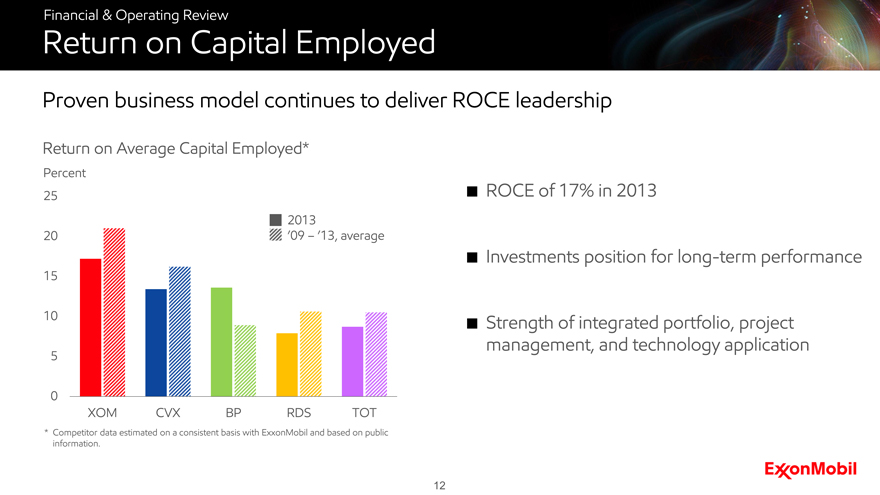
Return on Capital Employed
Proven business model continues to deliver ROCE leadership
Return on Average Capital Employed*
Percent
| * |
|
Competitor data estimated on a consistent basis with ExxonMobil and based on public information. |
ROCE of 17% in 2013
Investments position for long-term performance
Strength of integrated portfolio, project management, and technology application
12
Financial & Operating Review
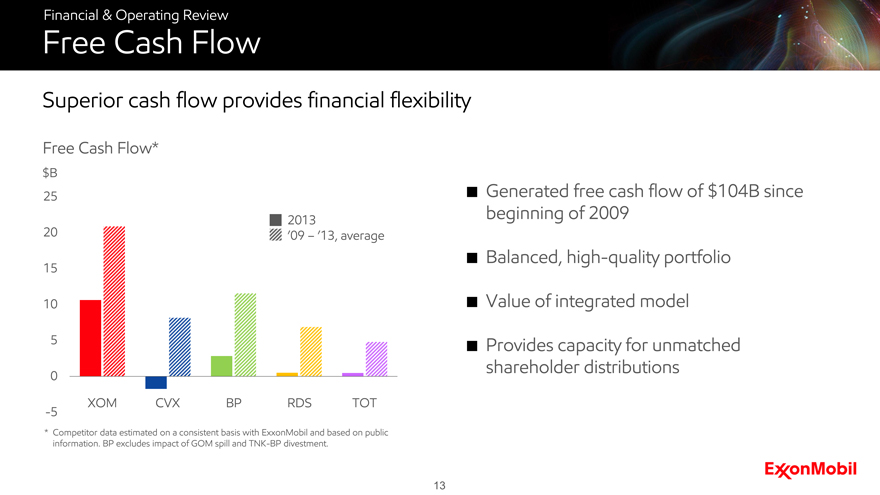
Free Cash Flow
Superior cash flow provides financial flexibility
Free Cash Flow*
$B
XOM CVX BP RDS TOT
Generated free cash flow of $104B since beginning of 2009
Balanced, high-quality portfolio
Value of integrated model
Provides capacity for unmatched shareholder distributions
* Competitor data estimated on a consistent basis with ExxonMobil and based on public information. BP excludes impact of GOM spill and TNK-BP divestment.
$B 25 20 15 10 5 0 -5 XOM CVX BP RDS TOT 2013 ‘09- ‘13, average
13
Financial & Operating Review
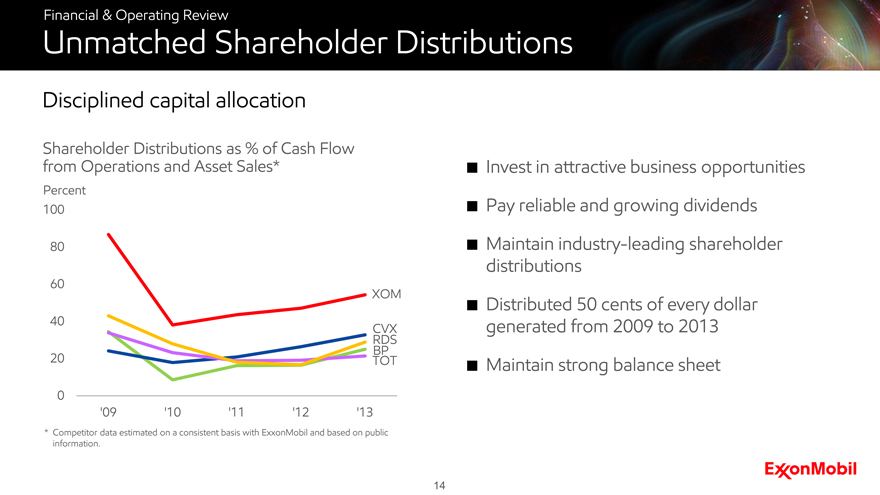
Unmatched Shareholder Distributions
Disciplined capital allocation
Shareholder Distributions as % of Cash Flow from Operations and Asset Sales*
Percent
| * |
|
Competitor data estimated on a consistent basis with ExxonMobil and based on public information. |
Invest in attractive business opportunities
Pay reliable and growing dividends
Maintain industry-leading shareholder distributions
Distributed 50 cents of every dollar generated from 2009 to 2013
Maintain strong balance sheet
14
Financial & Operating Review
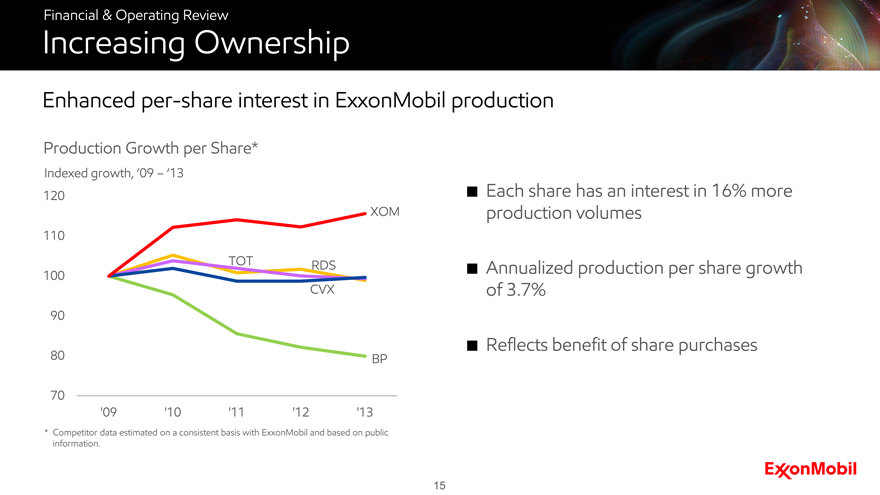
Increasing Ownership
Enhanced per-share interest in ExxonMobil production
Production Growth per Share*
Indexed growth, ‘09 - ‘13
| * |
|
Competitor data estimated on a consistent basis with ExxonMobil and based on public information. |
Each share has an interest in 16% more production volumes
Annualized production per share growth of 3.7%
Reflects benefit of share purchases
120 110 100 90 80 70 ‘09 ‘10 ‘11 ‘12 ‘13 BP CVX RDS TOT XOM
15
Financial & Operating Review
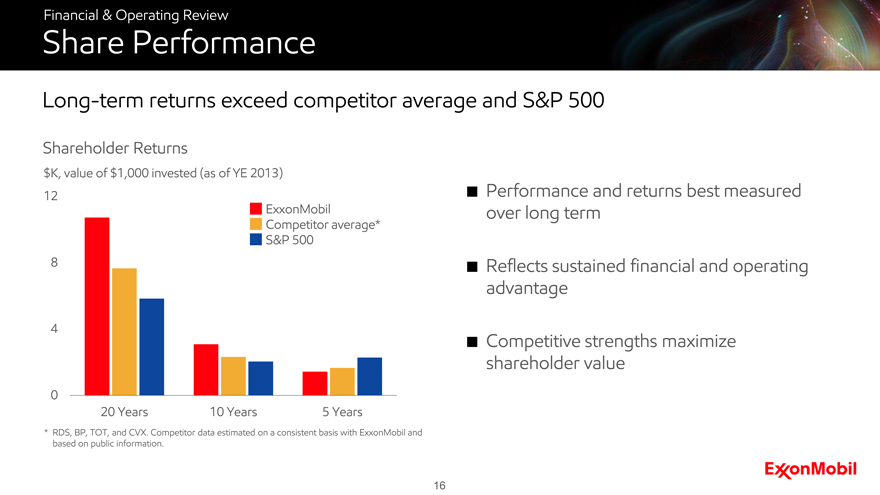
Share Performance
Long-term returns exceed competitor average and S&P 500
Shareholder Returns
$K, value of $1,000 invested (as of YE 2013)
ExxonMobil Competitor average* S&P 500
* RDS, BP, TOT, and CVX. Competitor data estimated on a consistent basis with ExxonMobil and based on public information.
Performance and returns best measured over long term
Reflects sustained financial and operating advantage
Competitive strengths maximize shareholder value
12 8 4 0 20 Years 10 Years 5 Years
16

Energy Outlook
Rex Tillerson
Chairman and CEO
Energy Outlook
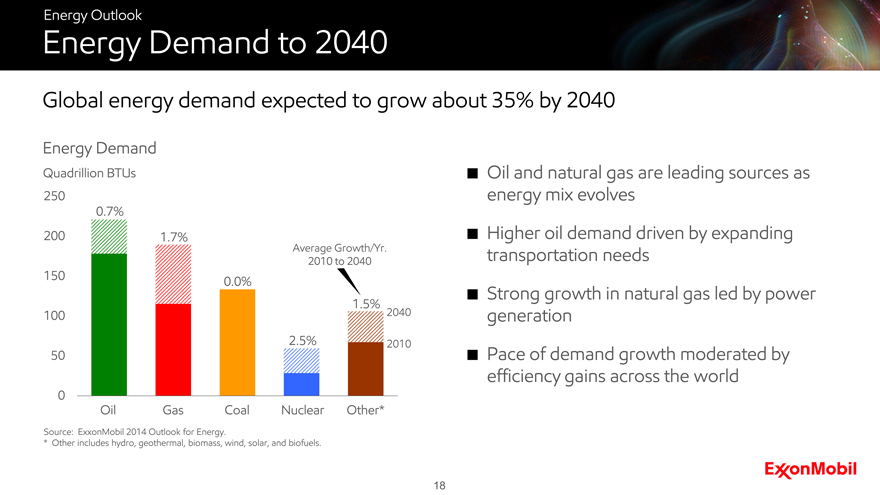
Energy Demand to 2040
Global energy demand expected to grow about 35% by 2040
Energy Demand
Quadrillion BTUs Oil and natural gas are leading sources as energy mix evolves
Higher oil demand driven by expanding transportation needs
Strong growth in natural gas led by power generation
Pace of demand growth moderated by efficiency gains across the world
Source: ExxonMobil 2014 Outlook for Energy.
| * |
|
Other includes hydro, geothermal, biomass, wind, solar, and biofuels. |
250 200 150 100 50 0 Oil Gas Coal Nuclear Other* 0.7% 1.7% 0.0% 2.5% 1.5% 2040 2010
Average Growth/Yr. 2010 to 2040
18
Energy Outlook
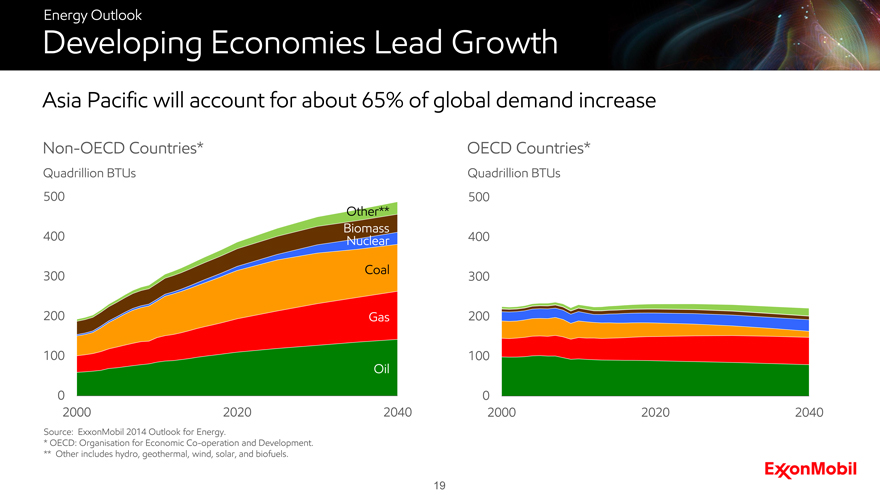
Developing Economies Lead Growth
Asia Pacific will account for about 65% of global demand increase
Non-OECD Countries* OECD Countries*
Quadrillion BTUs Quadrillion BTUs
Source: ExxonMobil 2014 Outlook for Energy.
| * |
|
OECD: Organisation for Economic Co-operation and Development. |
** Other includes hydro, geothermal, wind, solar, and biofuels.
19
Energy Outlook
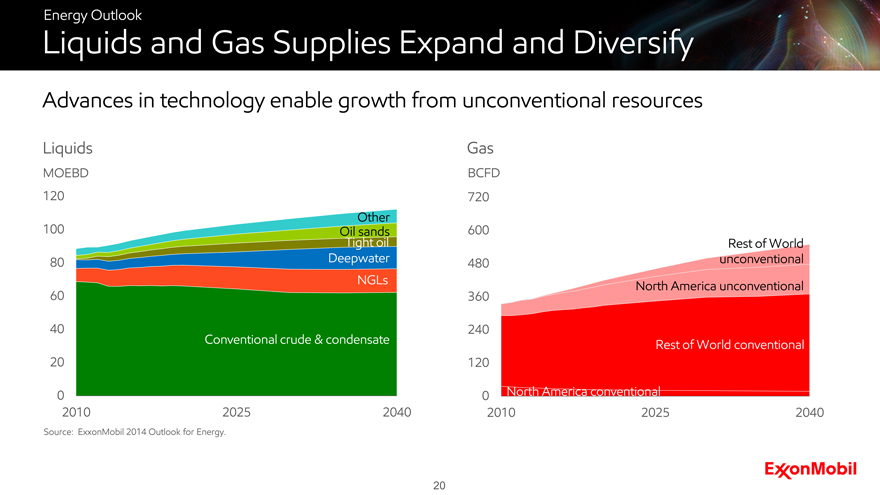
Liquids and Gas Supplies Expand and Diversify
Advances in technology enable growth from unconventional resources
Liquids Gas
MOEBD BCFD
Source: ExxonMobil 2014 Outlook for Energy.
120 100 80 60 40 20 0 2010 2025 2040
Others Oil sands Tight oil Deepwater NGLs Conventional crude & condensate
720 600 480 360 240 120 0 2010 2025 2040
Rest of World unconventional North America unconventional Rest of World conventional North America conventional
20
Energy Outlook
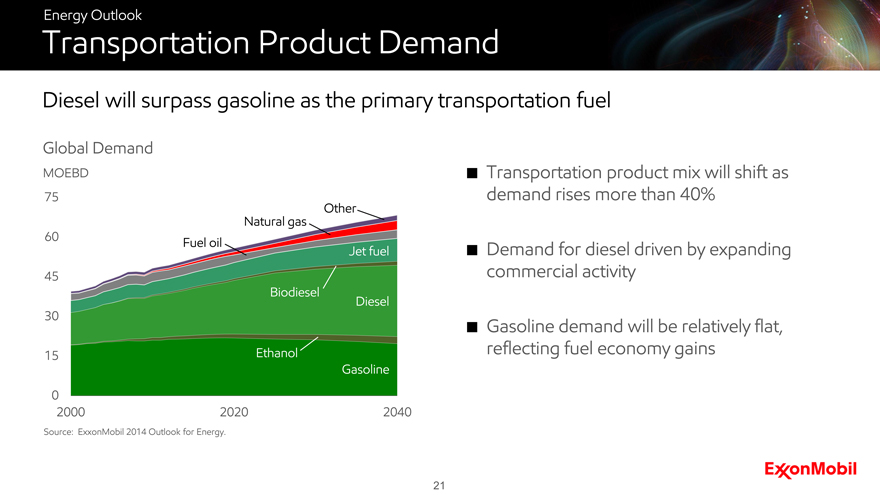
Transportation Product Demand
Diesel will surpass gasoline as the primary transportation fuel
Global Demand
MOEBD Transportation product mix will shift as demand rises more than 40%
Demand for diesel driven by expanding commercial activity
Gasoline demand will be relatively flat, reflecting fuel economy gains
Source: ExxonMobil 2014 Outlook for Energy.
75 60 45 30 15 0 2000 2020 2040
Biodiesel Ethanol Gasoline Diesel Jet fuel Fuel oil Natural gas Other
21
Energy Outlook
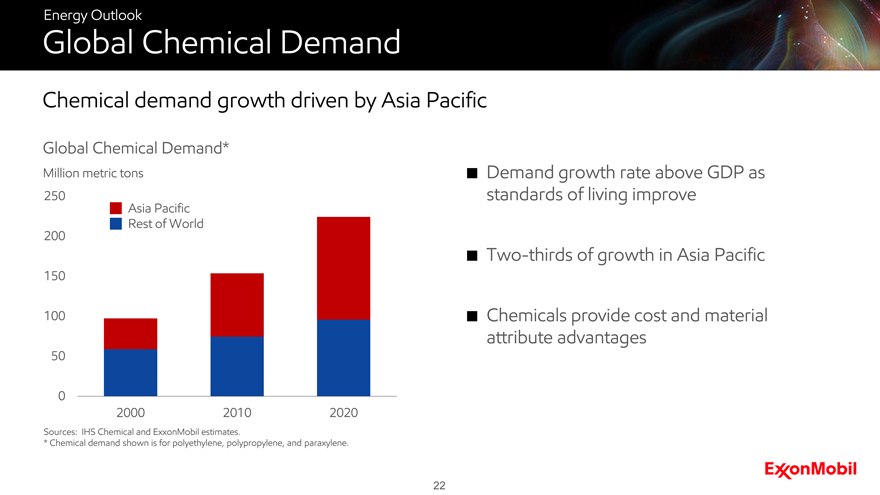
Global Chemical Demand
Chemical demand growth driven by Asia Pacific
Global Chemical Demand*
Million metric tons Demand growth rate above GDP as standards of living improve
Two-thirds of growth in Asia Pacific
Chemicals provide cost and material attribute advantages
Sources: IHS Chemical and ExxonMobil estimates.
| * |
|
Chemical demand shown is for polyethylene, polypropylene, and paraxylene. |
250 200 150 100 50 0 2000 2010 2020
Asia Pacific Rest of World
22
Energy Outlook
Key Perspectives
Outlook guides our business strategy and investment plans
Development of practical, reliable and affordable energy remains paramount
Access to high-quality resources both necessary and challenging
Technology advancements are key enabler to safe and effective development
Substantial investments are required to meet growing demand
Free trade and sound, stable government policies are vital
Long-term investment planning and near-term execution are imperative
23
Strategic Overview
Rex Tillerson
Chairman and CEO
Strategic Overview
Key Elements of ExxonMobil Strategy
Unrelenting focus on creating long-term shareholder value
Employ effective risk management and lead industry in operational excellence
Manage a diversified, balanced portfolio to mitigate risks and optimize profitability
Leverage integration benefits
Select and execute the most attractive investment opportunities
Develop and utilize advanced technologies
Attract and retain a talented, diverse workforce
Deliver superior, long-term total returns to shareholders
25
Risk Management
Rex Tillerson
Chairman and CEO
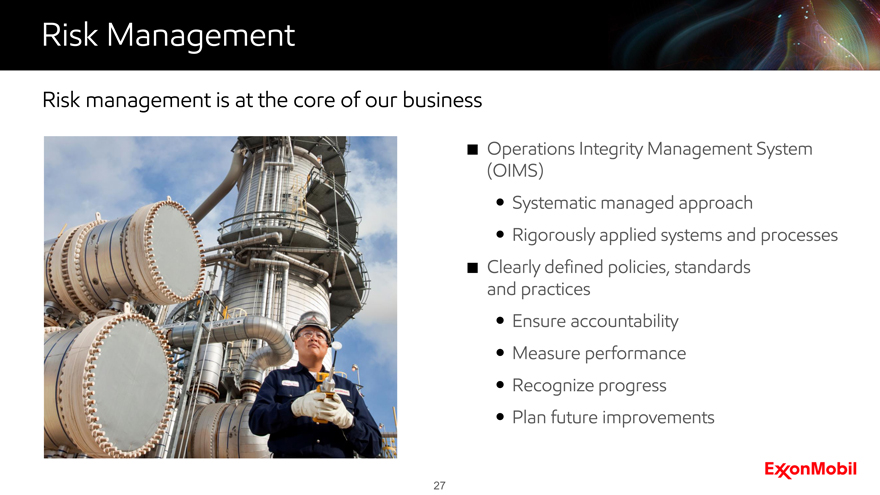
Risk Management
Risk management is at the core of our business
Operations Integrity Management System (OIMS)
Systematic managed approach
Rigorously applied systems and processes
Clearly defined policies, standards and practices Ensure accountability Measure performance Recognize progress
Plan future improvements
27
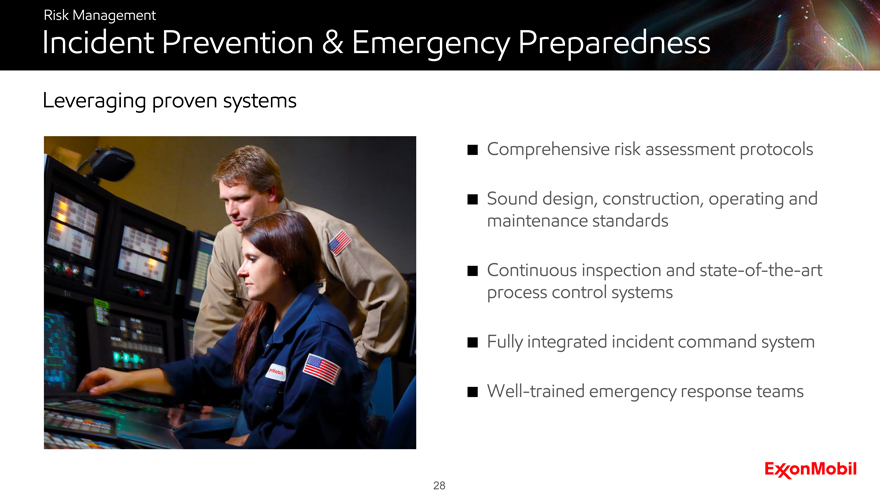
Risk Management
Incident Prevention & Emergency Preparedness
Leveraging proven systems
Comprehensive risk assessment protocols
Sound design, construction, operating and maintenance standards
Continuous inspection and state-of-the-art process control systems
Fully integrated incident command system
Well-trained emergency response teams
28
Delivering Profitable Growth
Rex Tillerson
Chairman and CEO
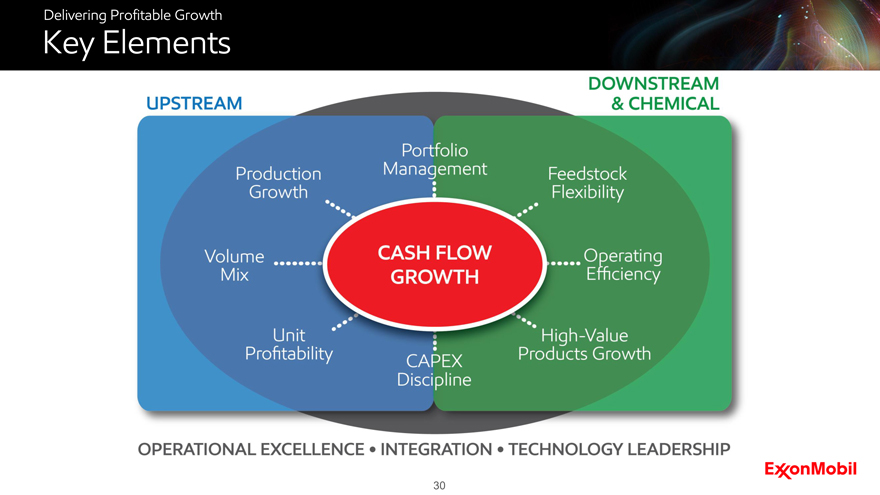
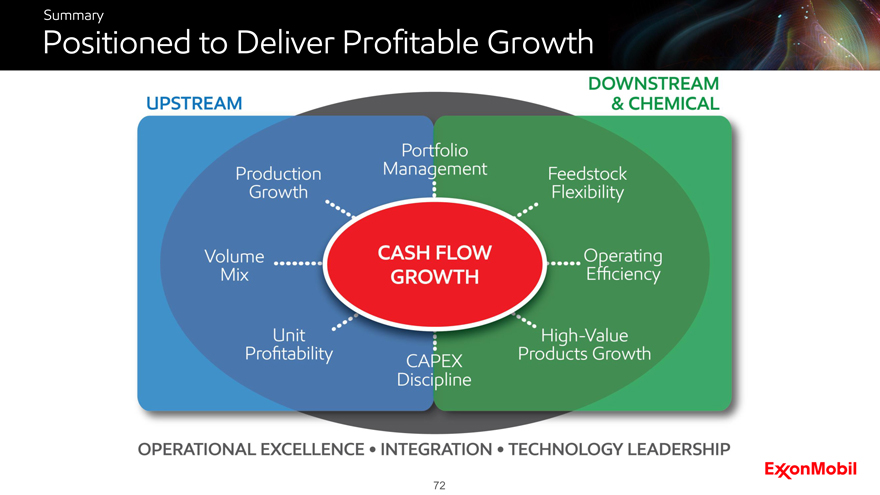
Delivering Profitable Growth
Key Elements
30
Delivering Profitable Growth
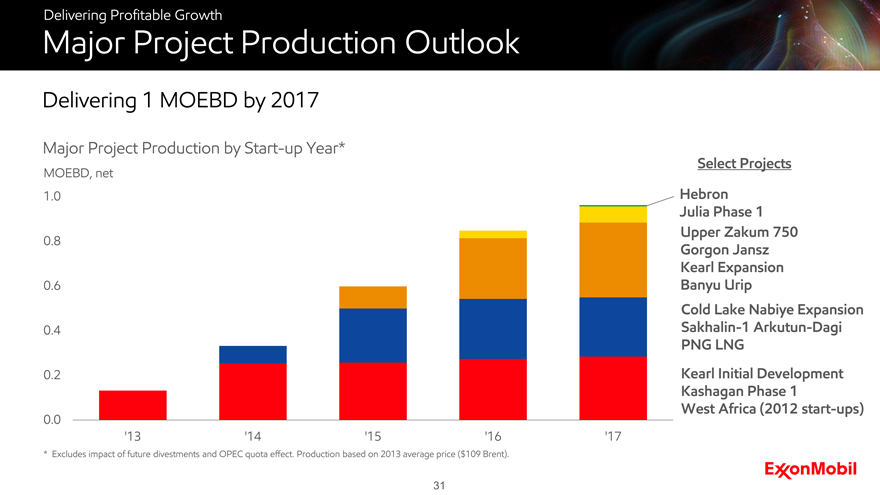
Major Project Production Outlook
Delivering 1 MOEBD by 2017
Major Project Production by Start-up Year*
MOEBD, net
1.0 0.8 0.6 0.4 0.2 0.0
‘13 ‘14 ‘15 ‘16 ‘17
Select Projects
Hebron Julia Phase 1 Upper Zakum 750 Gorgon Jansz
Kearl Expansion Banyu Urip
Cold Lake Nabiye Expansion Sakhalin-1 Arkutun-Dagi
PNG LNG
Kearl Initial Development Kashagan Phase 1
West Africa (2012 start-ups)
| * |
|
Excludes impact of future divestments and OPEC quota effect. Production based on 2013 average price ($109 Brent). |
31
Delivering Profitable Growth
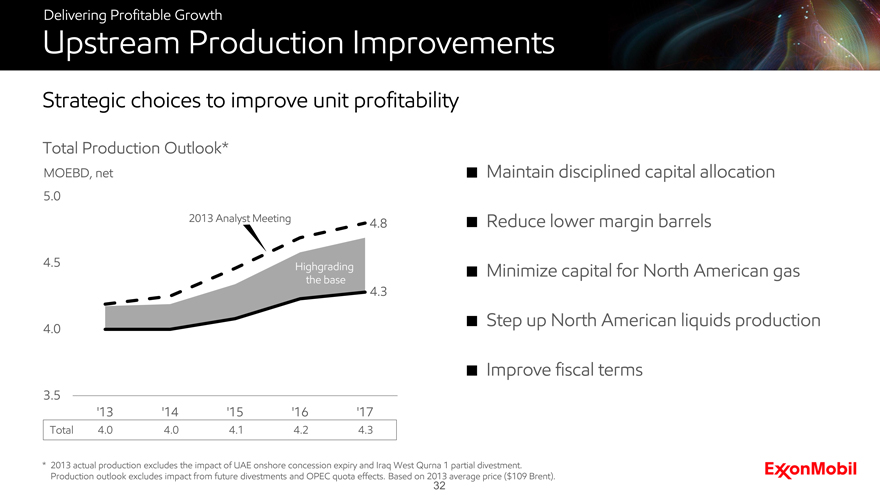
Upstream Production Improvements
Strategic choices to improve unit profitability
Total Production Outlook*
MOEBD, net
Highgrading the base
Maintain disciplined capital allocation
Reduce lower margin barrels
Minimize capital for North American gas
Step up North American liquids production
Improve fiscal terms
* 2013 actual production excludes the impact of UAE onshore concession expiry and Iraq West Qurna 1 partial divestment. Production outlook excludes impact from future divestments and OPEC quota effects. Based on 2013 average price ($109 Brent).
5.0 4.5 4.0 3.5 ‘13 ‘14 ‘15 ‘16 ‘17
Total 4.0 4.0 4.1 4.2 4.3
2013 Analyst Meeting 4.8 4.3
32
Delivering Profitable Growth
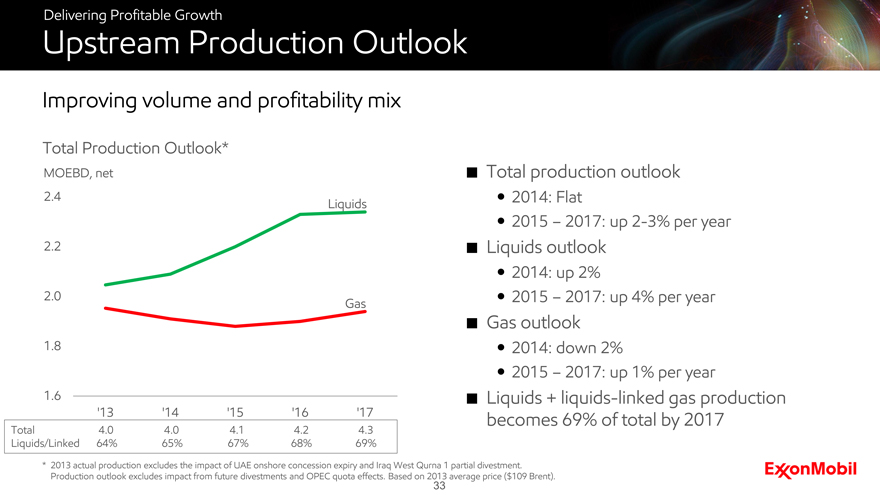
Upstream Production Outlook
Improving volume and profitability mix
Total Production Outlook*
MOEBD, net Total production outlook
2014: Flat
2015 _ 2017: up 2-3% per year
Liquids outlook
2014: up 2%
2015 _ 2017: up 4% per year
Gas outlook
2014: down 2%
2015 _ 2017: up 1% per year
Liquids + liquids-linked gas production becomes 69% of total by 2017
* 2013 actual production excludes the impact of UAE onshore concession expiry and Iraq West Qurna 1 partial divestment. Production outlook excludes impact from future divestments and OPEC quota effects. Based on 2013 average price ($109 Brent).
Total Production Outlook* MOEBD, net
2.4 2.2 1.8 1.6 ,13 ,14 ,15 ,16 ,17
Total 4.0 4.0 4.1 4.2 4.3
Liquids/Linked 64% 65% 67% 68% 69%
Liquids Gas
ExxonMobil
33
Delivering Profitable Growth
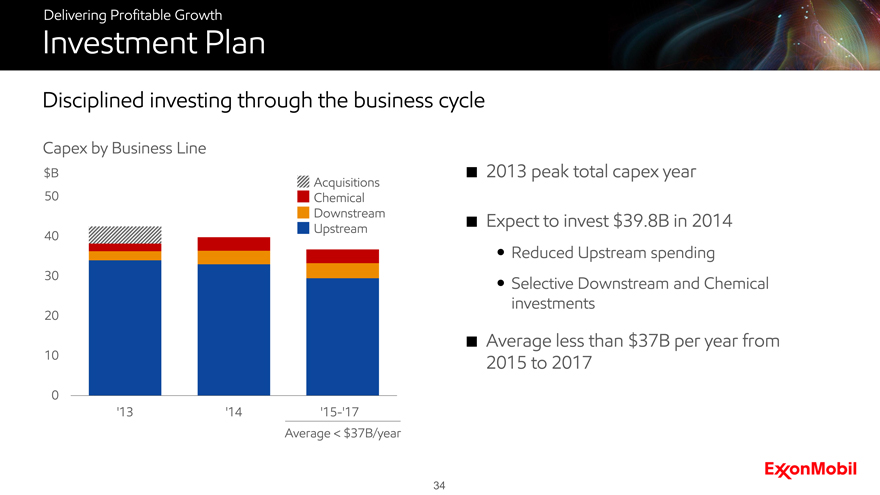
Investment Plan
Disciplined investing through the business cycle
Capex by Business Line
2013 peak total capex year
Expect to invest $39.8B in 2014
Reduced Upstream spending
Selective Downstream and Chemical investments
Average less than $37B per year from 2015 to 2017
$B 50 40 30 20 10 0 ‘13 ‘14 ‘15-’17
Acquisitions Chemical Downstream Upstream
Average < $37B/year
34
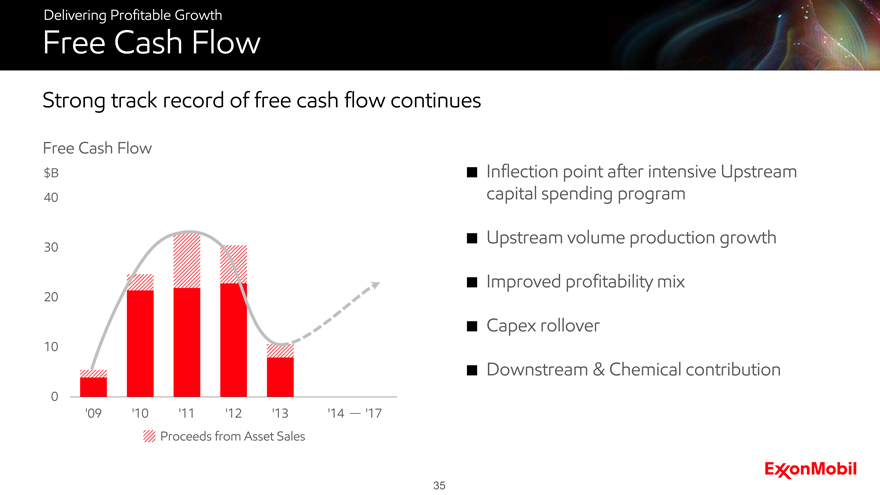
Delivering Profitable Growth
Free Cash Flow
Strong track record of free cash flow continues
Free Cash Flow
$B Inflection point after intensive Upstream capital spending program
Upstream volume production growth
Improved profitability mix
Capex rollover
Downstream & Chemical contribution
40 30 20 10 0
‘09 ‘10 ‘11 ‘12 ‘13 ‘14 - ‘17
Proceeds from Asset Sales
35
Upstream Production Growth through 2017
Mark Albers
Senior Vice President
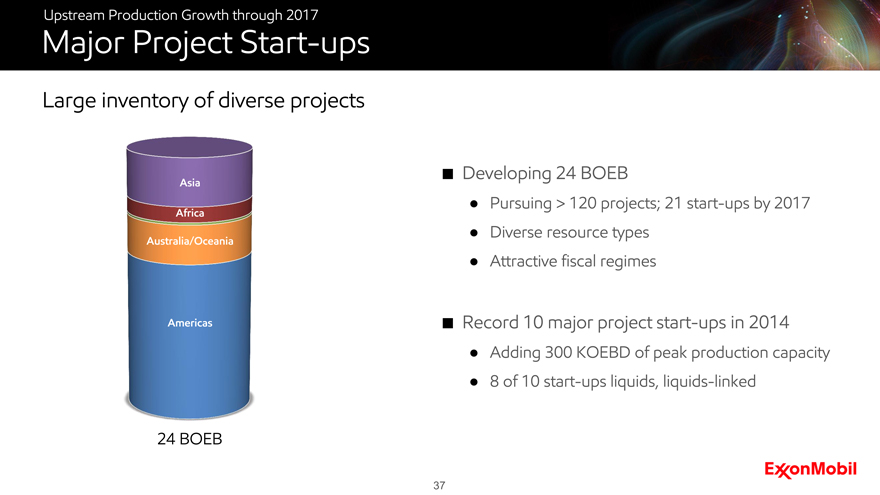
Upstream Production Growth through 2017
Major Project Start-ups
Large inventory of diverse projects
Asia Africa
Australia/Oceania
Americas
24 BOEB
Developing 24 BOEB
Pursuing > 120 projects; 21 start-ups by 2017
Diverse resource types
Attractive fiscal regimes
Record 10 major project start-ups in 2014
Adding 300 KOEBD of peak production capacity
8 of 10 start-ups liquids, liquids-linked
37
Upstream Production Growth through 2017
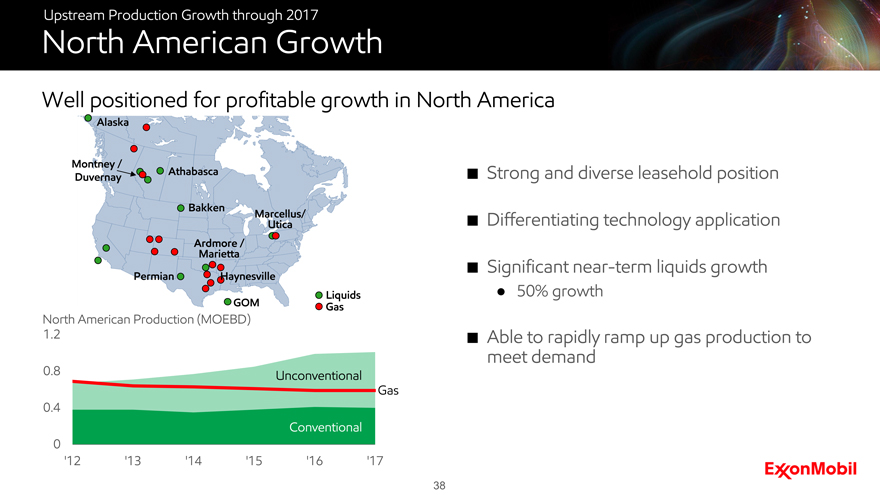
North American Growth
Well positioned for profitable growth in North America
North American Production (MOEBD)
1.2 0.8 0.4 0 ‘12 ‘13 ‘14 ‘15 ‘16 ‘17
Conventional
Unconventional Gas
Liquids
Gas
Strong and diverse leasehold position
Differentiating technology application
Significant near-term liquids growth
50% growth
Able to rapidly ramp up gas production to meet demand
38
Upstream Production Growth through 2017
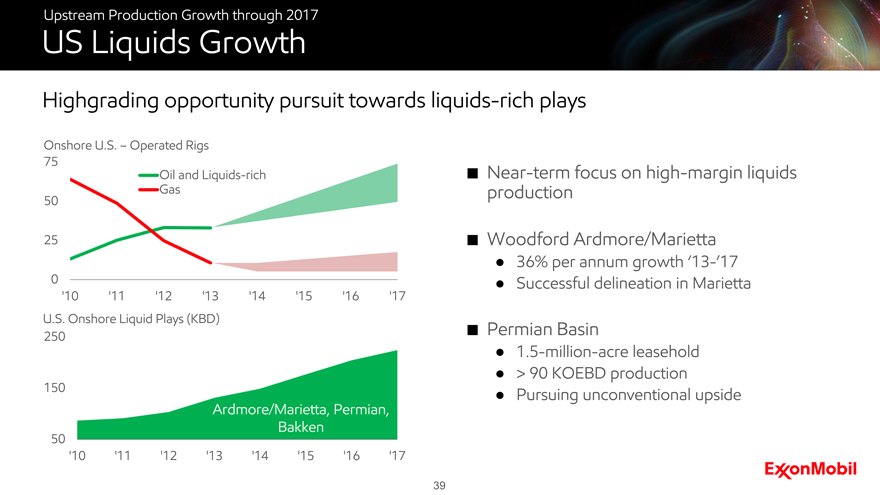
US Liquids Growth
Highgrading opportunity pursuit towards liquids-rich plays
Onshore U.S. - Operated Rigs
75 50 25 0
Oil and Liquid-rich
Gas
‘10 ‘11 ‘12 ‘13 ‘14 ‘15 ‘16 ‘17
U.S. Onshore Liquid Plays (KBD)
250 150 50
Ardmore/Marietta, Permian, Bakken
‘10 ‘11 ‘12 ‘13 ‘14 ‘15 ‘16 ‘17
Near-term focus on high-margin liquids production
Woodford Ardmore/Marietta
36% per annum growth ‘13-’17
Successful delineation in Marietta
Permian Basin
1.5 -million-acre leasehold
> 90 KOEBD production
Pursuing unconventional upside
39
Upstream Production Growth through 2017
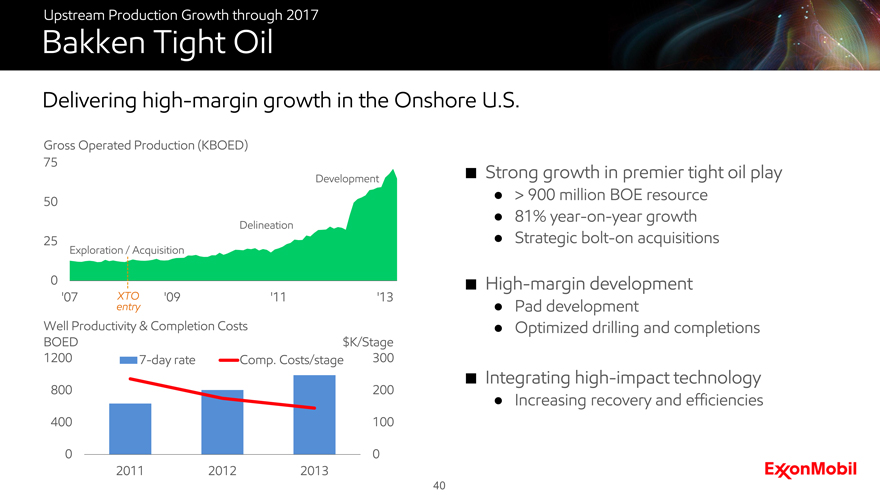
Bakken Tight Oil
Delivering high-margin growth in the Onshore U.S.
Strong growth in premier tight oil play
> 900 million BOE resource
81% year-on-year growth
Strategic bolt-on acquisitions
High-margin development
Pad development
Optimized drilling and completions
Integrating high-impact technology
Increasing recovery and efficiencies
Gross Operated Production (KBOED)
75 50 25 0 ‘07 ‘09 ‘11 ‘13 XTO entry
Well Productivity & Completion Costs
BOED 1200 800 400 0 2011 2012 2013 0 100 200 300 $K/Stage
Delineation Development
40
Upstream Production Growth through 2017
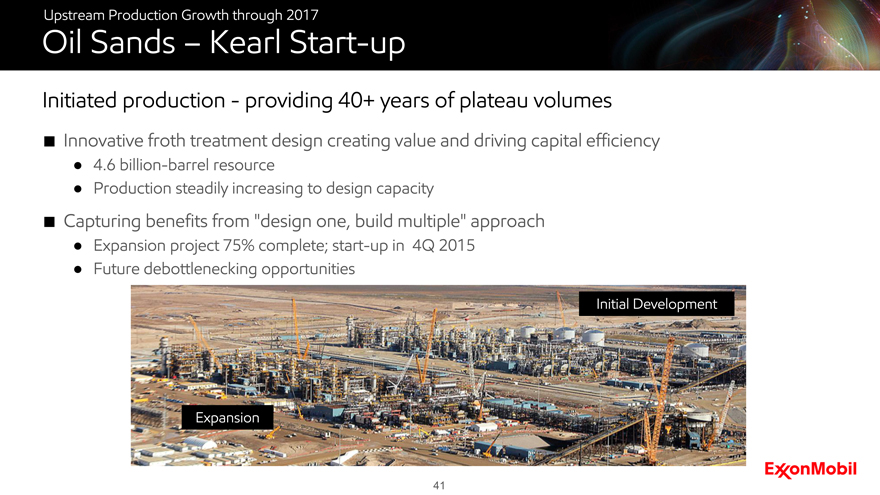
Oil Sands – Kearl Start-up
Initiated production – providing 40+ years of plateau volumes
Innovative froth treatment design creating value and driving capital efficiency
4.6 billion-barrel resource
Production steadily increasing to design capacity
Capturing benefits from “design one, build multiple” approach
Expansion project 75% complete; start-up in 4Q 2015
Future debottlenecking opportunities
Initial Development
Expansion
41
Upstream Production Growth through 2017
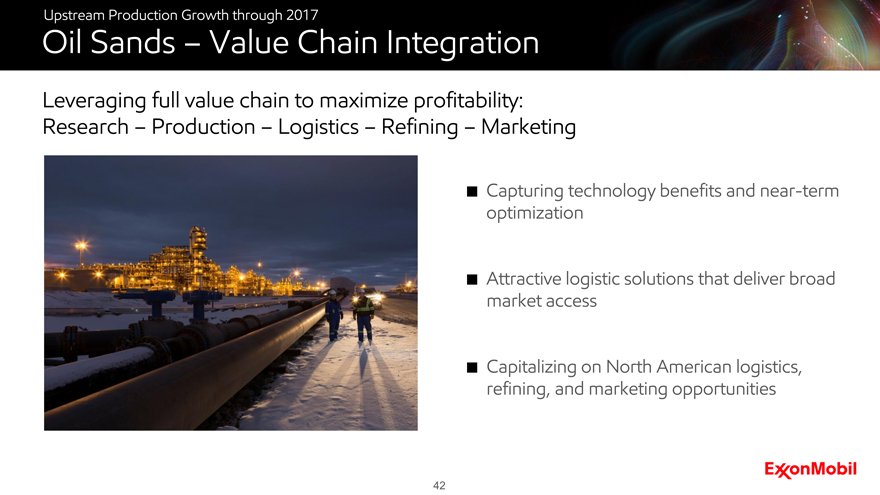
Oil Sands – Value Chain Integration
Leveraging full value chain to maximize profitability:
Research – Production – Logistics – Refining – Marketing
Capturing technology benefits and near-term optimization
Attractive logistic solutions that deliver broad market access
Capitalizing on North American logistics, refining, and marketing opportunities
42
Upstream Production Growth through 2017
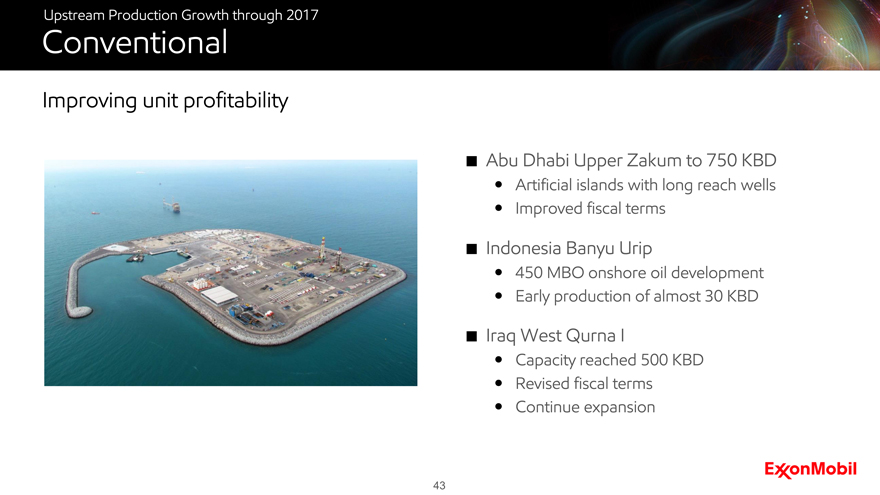
Conventional
Improving unit profitability
Abu Dhabi Upper Zakum to 750 KBD
Artificial islands with long reach wells Improved fiscal terms
Indonesia Banyu Urip
450 MBO onshore oil development Early production of almost 30 KBD
Iraq West Qurna I
Capacity reached 500 KBD Revised fiscal terms Continue expansion
43
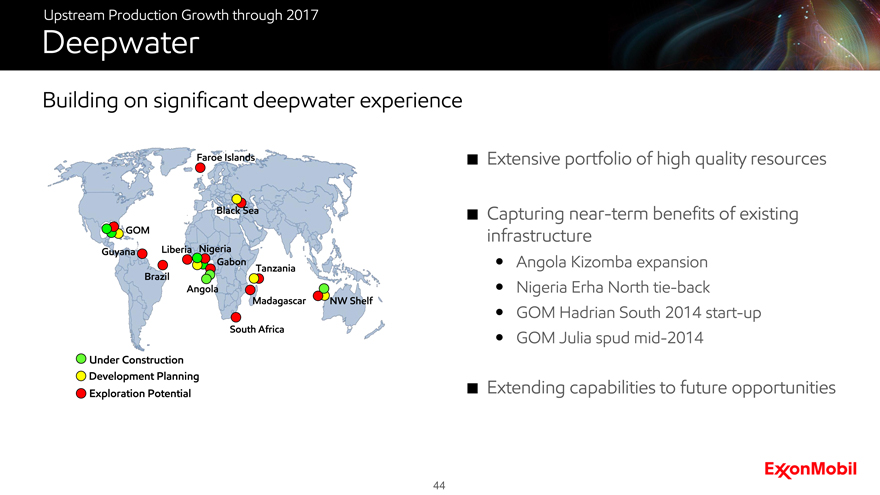
Upstream Production Growth through 2017
Deepwater
Building on significant deepwater experience
Extensive portfolio of high quality resources
Capturing near-term benefits of existing infrastructure
Angola Kizomba expansion Nigeria Erha North tie-back GOM Hadrian South 2014 start-up GOM Julia spud mid-2014
Extending capabilities to future opportunities
Under Construction Development Planning Exploration Potential
44
Upstream Production Growth through 2017
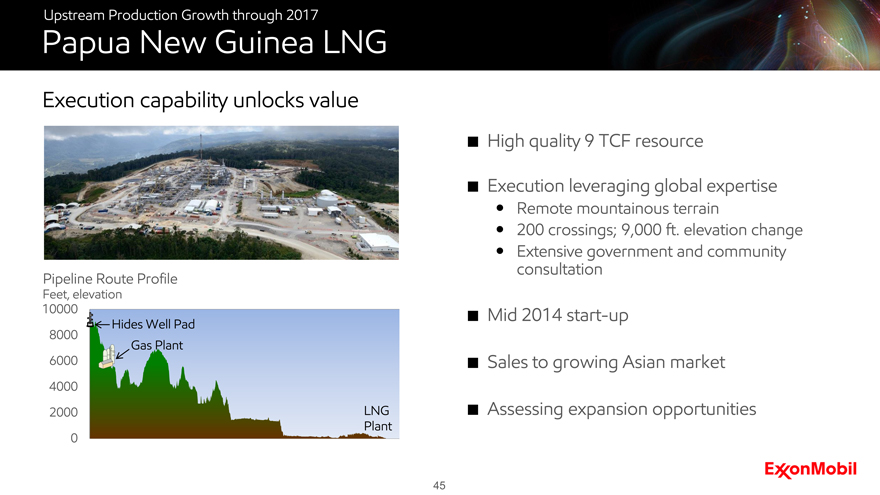
Papua New Guinea LNG
Execution capability unlocks value
High quality 9 TCF resource
Execution leveraging global expertise
Remote mountainous terrain
200 crossings; 9,000 ft. elevation change Extensive government and community consultation
Mid 2014 start-up
Sales to growing Asian market
Assessing expansion opportunities
Pipeline Route Profile
Feet, elevation
10000 8000 6000 4000 2000 0 Hides Well Pad Gas Plant LNG Plant
45
Upstream Production Growth through 2017
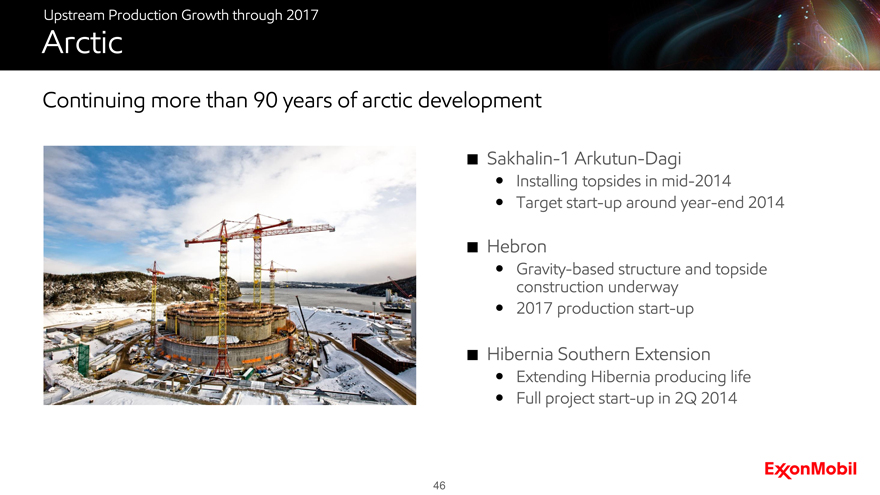
Arctic
Continuing more than 90 years of arctic development
Sakhalin-1 Arkutun-Dagi
Installing topsides in mid-2014 Target start-up around year-end 2014
Hebron
Gravity-based structure and topside construction underway 2017 production start-up
Hibernia Southern Extension
Extending Hibernia producing life Full project start-up in 2Q 2014
46
Upstream Production Growth through 2017
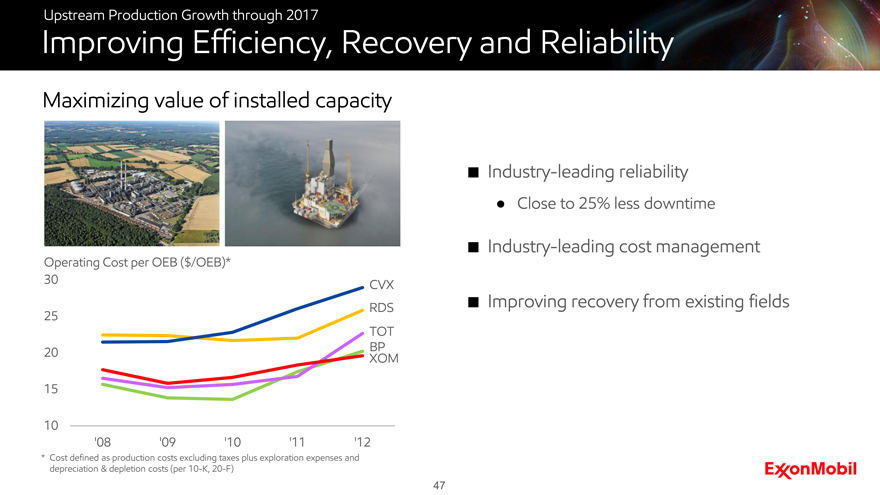
Improving Efficiency, Recovery and Reliability
Maximizing value of installed capacity
Industry-leading reliability
Close to 25% less downtime
Industry-leading cost management
Improving recovery from existing fields
* Cost defined as production costs excluding taxes plus exploration expenses and depreciation & depletion costs (per 10-K, 20-F)
Operating Cost per OEB ($/OEB)* CVX RDS TOT BP XOM
30 25 20 15 10 ‘08 ‘09 ‘10 ‘11 ‘12
47
Upstream Production Growth through 2017
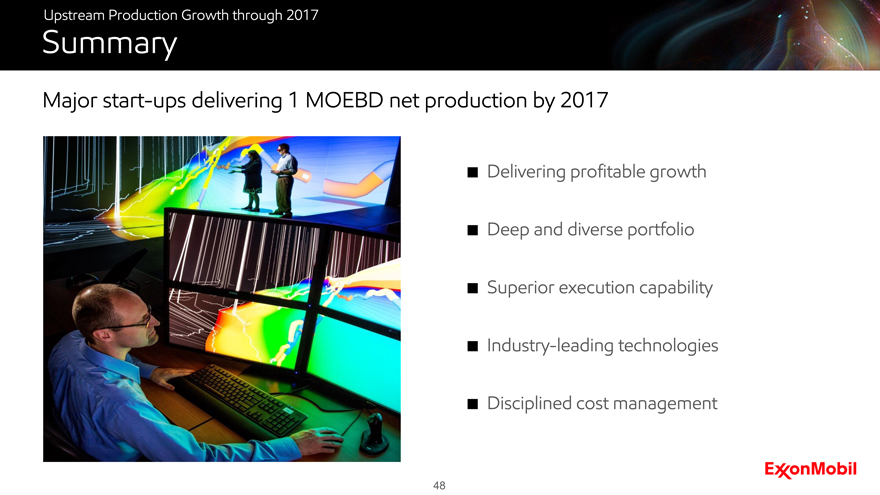
Summary
Major start-ups delivering 1 MOEBD net production by 2017
Delivering profitable growth
Deep and diverse portfolio
Superior execution capability
Industry-leading technologies
Disciplined cost management
48
Upstream Long-Term Opportunity Set
Andrew Swiger
Senior Vice President
Upstream Long-Term Opportunity Set
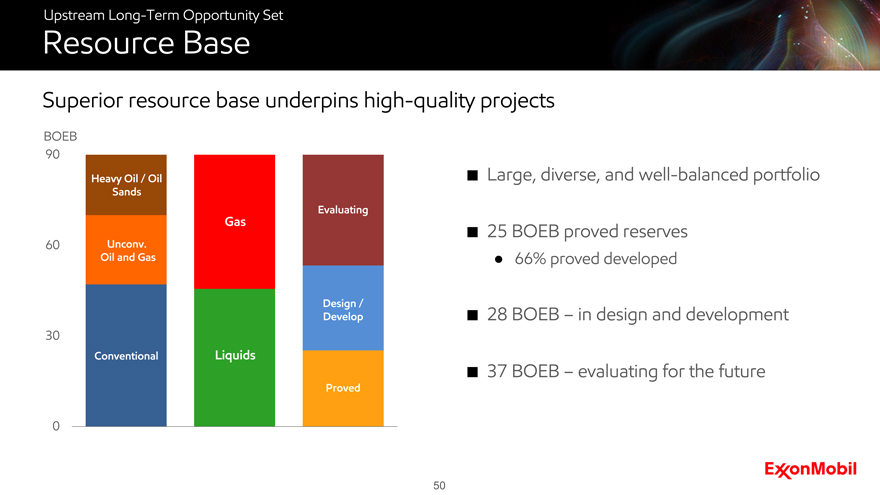
Resource Base
Superior resource base underpins high-quality projects
Large, diverse, and well-balanced portfolio
25 BOEB proved reserves
66% proved developed
28 BOEB – in design and development
37 BOEB – evaluating for the future
BOEB 90 60 30 0 Heavy Oil/ Oil Sands Uncov. Oil and Gas Conventional Gas Liquids Evaluating Design / Develop Proved
50
Upstream Long-Term Opportunity Set
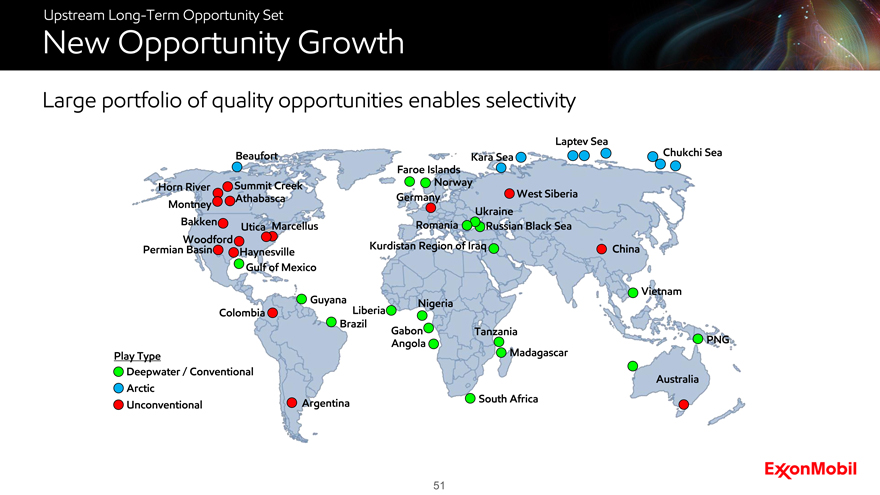
New Opportunity Growth
Large portfolio of quality opportunities enables selectivity
Play Type Deepwater / Conventional Arctic Unconventional
51
Upstream Long-Term Opportunity Set
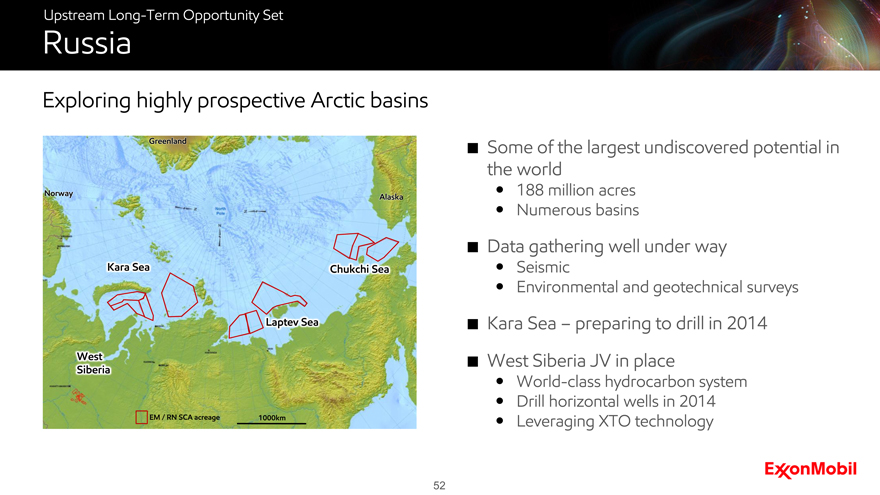
Russia
Exploring highly prospective Arctic basins
Some of the largest undiscovered potential in the world
188 million acres Numerous basins
Data gathering well under way
Seismic
Environmental and geotechnical surveys
Kara Sea - preparing to drill in 2014
West Siberia JV in place
World-class hydrocarbon system Drill horizontal wells in 2014 Leveraging XTO technology
52
Upstream Long-Term Opportunity Set
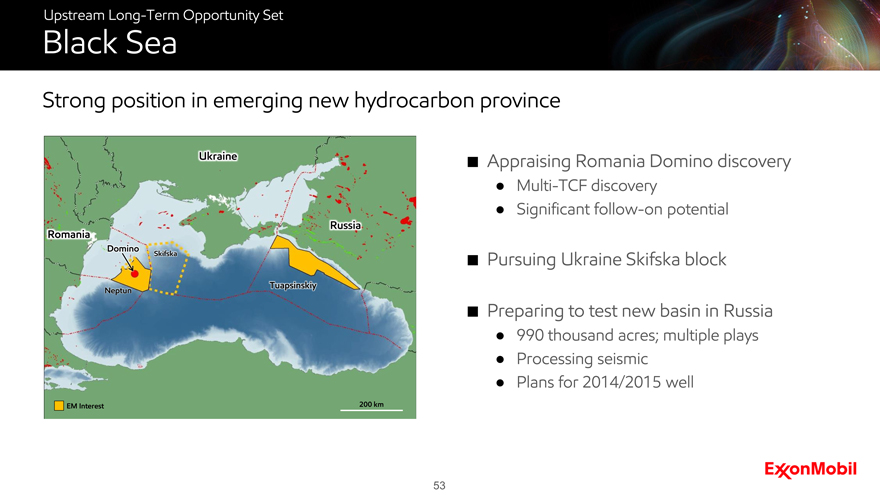
Black Sea
Strong position in emerging new hydrocarbon province
Appraising Romania Domino discovery
Multi-TCF discovery
Significant follow-on potential
Pursuing Ukraine Skifska block
Preparing to test new basin in Russia
990 thousand acres; multiple plays
Processing seismic
Plans for 2014/2015 well
53
Upstream Long-Term Opportunity Set
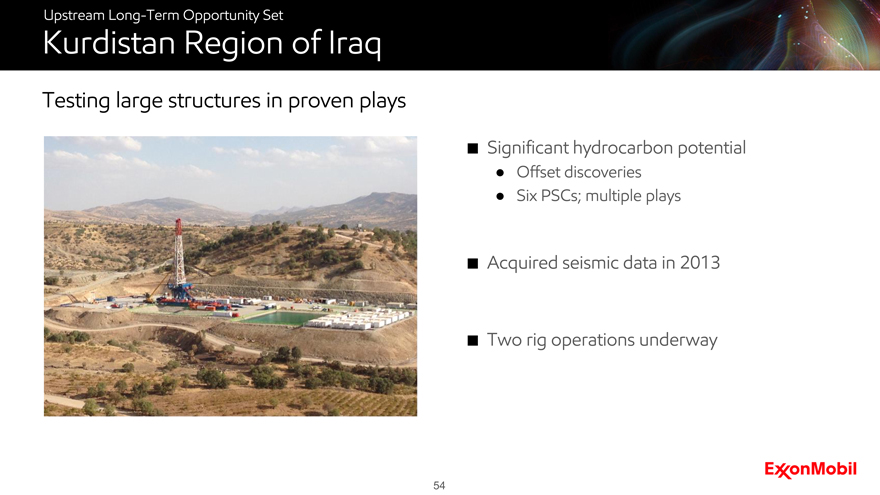
Kurdistan Region of Iraq
Testing large structures in proven plays
Significant hydrocarbon potential
Offset discoveries
Six PSCs; multiple plays
Acquired seismic data in 2013
Two rig operations underway
54
Upstream Long-Term Opportunity Set
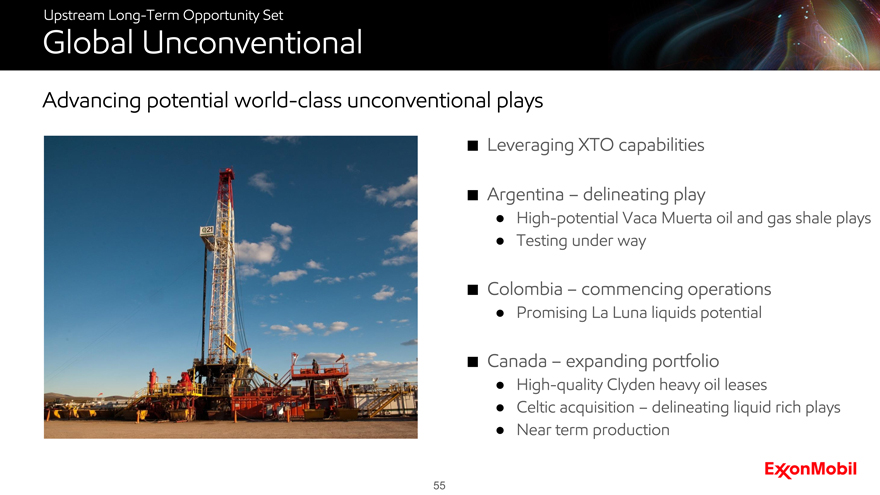
Global Unconventional
Advancing potential world-class unconventional plays
Leveraging XTO capabilities
Argentina – delineating play
High-potential Vaca Muerta oil and gas shale plays
Testing under way
Colombia – commencing operations
Promising La Luna liquids potential
Canada – expanding portfolio
High-quality Clyden heavy oil leases
Celtic acquisition – delineating liquid rich plays
Near term production
55
Upstream Long-Term Opportunity Set
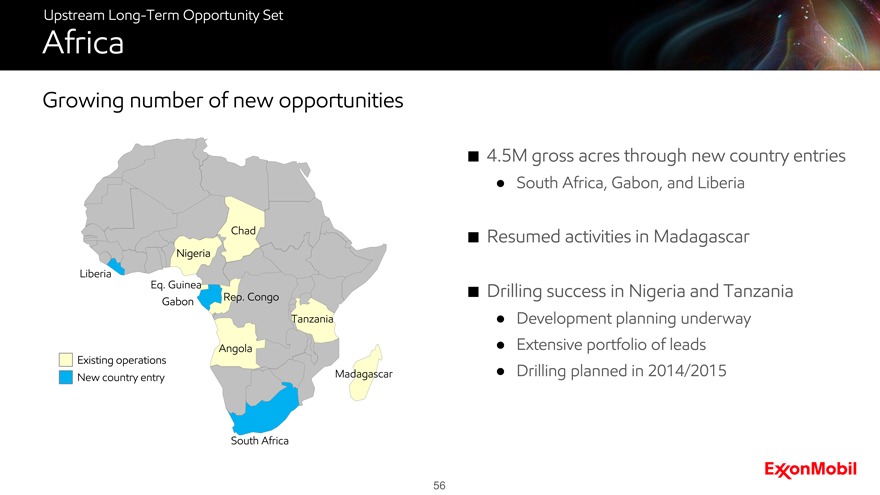
Africa
Growing number of new opportunities
4.5M gross acres through new country entries
South Africa, Gabon, and Liberia
Resumed activities in Madagascar
Drilling success in Nigeria and Tanzania
Development planning underway
Extensive portfolio of leads
Drilling planned in 2014/2015
Existing operations
New country entry
56
Upstream Long-Term Opportunity Set
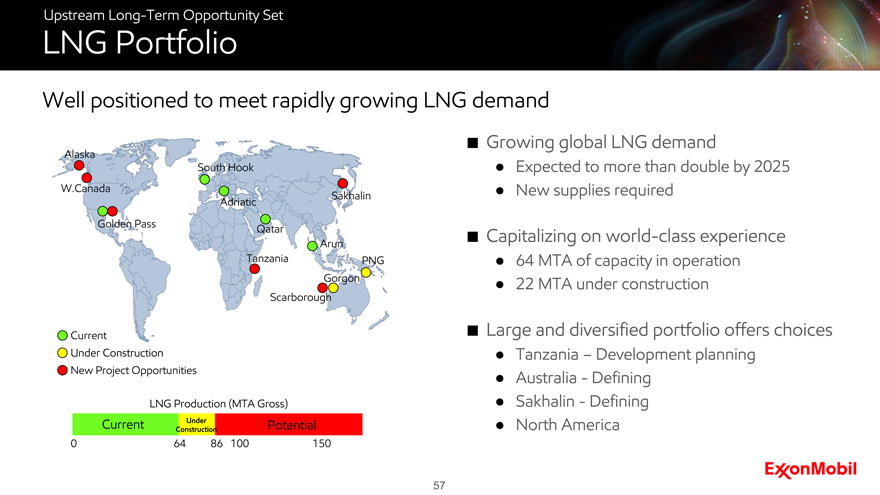
LNG Portfolio
Well positioned to meet rapidly growing LNG demand
Under Construction
New Project Opportunities
LNG Production (MTA Gross)
Current
Under Construction
0 64 86 100 150
Growing global LNG demand
Expected to more than double by 2025
New supplies required
Capitalizing on world-class experience
64 MTA of capacity in operation
22 MTA under construction
Large and diversified portfolio offers choices
Tanzania - Development planning
Australia - Defining
Sakhalin - Defining
North America
57
Upstream Long-Term Opportunity Set
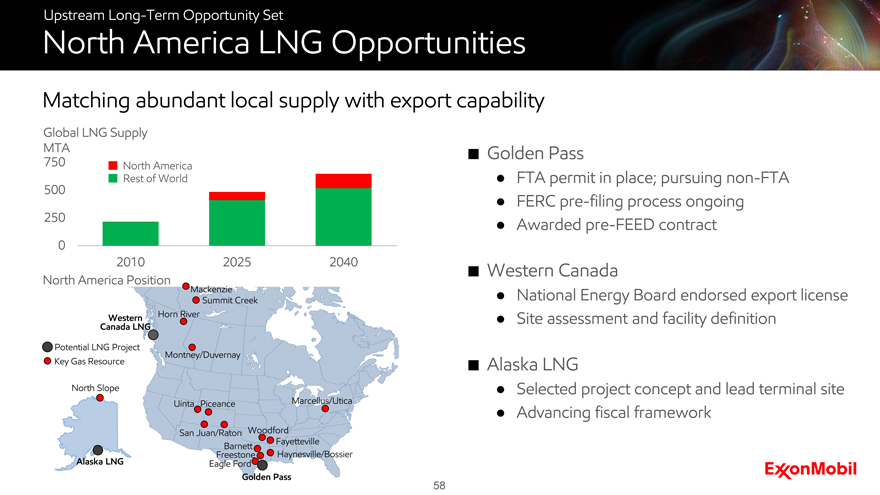
North America LNG Opportunities
Matching abundant local supply with export capability
Global LNG Supply
MTA 750 500 250 0
2010 2025 2040
North America
Rest of world
North America Position
Golden Pass
FTA permit in place; pursuing non-FTA
FERC pre-filing process ongoing
Awarded pre-FEED contract
Western Canada
National Energy Board endorsed export license
Site assessment and facility definition
Alaska LNG
Selected project concept and lead terminal site
Advancing fiscal framework
58
Upstream Long-Term Opportunity Set
Upstream Summary
Well positioned for long-term profitable growth
Superior resource base
Large new opportunity set
Project selectivity and capital efficiency
Unlock potential through capabilities
Leading project development expertise
59
Strengthening the Downstream & Chemical Portfolio
Mike Dolan
Senior Vice President
Strengthening the Downstream and Chemical Portfolio
Premier Businesses
Sustained industry-leading results
Best-in-class operations
Flexibility and optimization tools
Technology-enabled, high-value product growth
Industry-leading portfolio
Pacesetter integrated facilities
Disciplined portfolio management
Robust pipeline of investments
Superior financial performance
Best-in-class returns
Strong cash generation
61
Strengthening the Downstream and Chemical Portfolio
Increasing Advantage in the Downstream
Focus on strategic assets
Lowering raw material cost
Increasing high-value product yield
Expanding logistics capability
Reducing operating cost
Disciplined portfolio management
62
Strengthening the Downstream and Chemical Portfolio
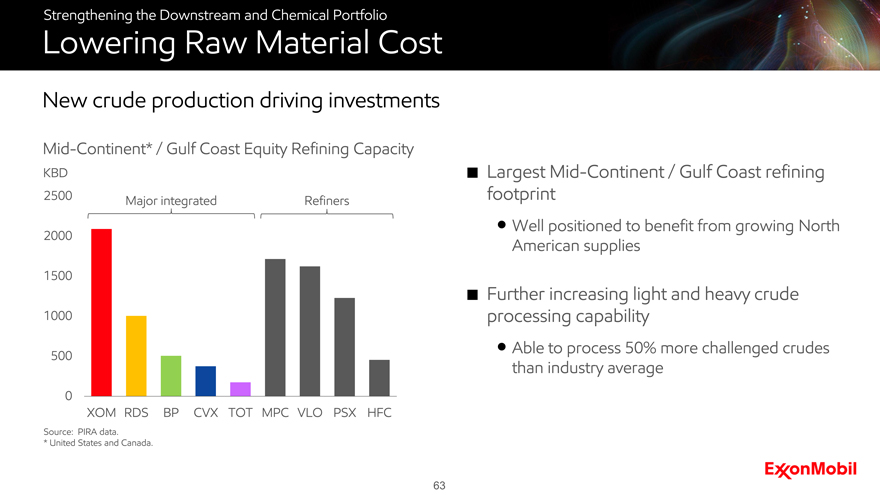
Lowering Raw Material Cost
New crude production driving investments
Mid-Continent* / Gulf Coast Equity Refining Capacity
KBD
Source: PIRA data.
| * |
|
United States and Canada. |
Largest Mid-Continent / Gulf Coast refining footprint
Well positioned to benefit from growing North American supplies
Further increasing light and heavy crude processing capability
Able to process 50% more challenged crudes than industry average
2500 2000 1500 1000 500 0 XOM RDS BP CVX TOT MPC VLO PSX HFC
Major Integrated Refiners
63
Strengthening the Downstream and Chemical Portfolio
Increasing High Value Product Yield
Expanding diesel and lubes production
Increased diesel capacity in Singapore and Saudi Arabia
Developing coker project at Antwerp
Expanding high-performance lube basestock capacity
Blend plant investments support finished lubricant sales growth
64
Strengthening the Downstream and Chemical Portfolio
Strategic Investments in Chemical
Developing major projects in United States, Saudi Arabia, and Singapore
Capture advantaged feedstocks
Reduce production costs
Increase high-value products
Leverage integration
Target growth markets
65
Strengthening the Downstream and Chemical Portfolio
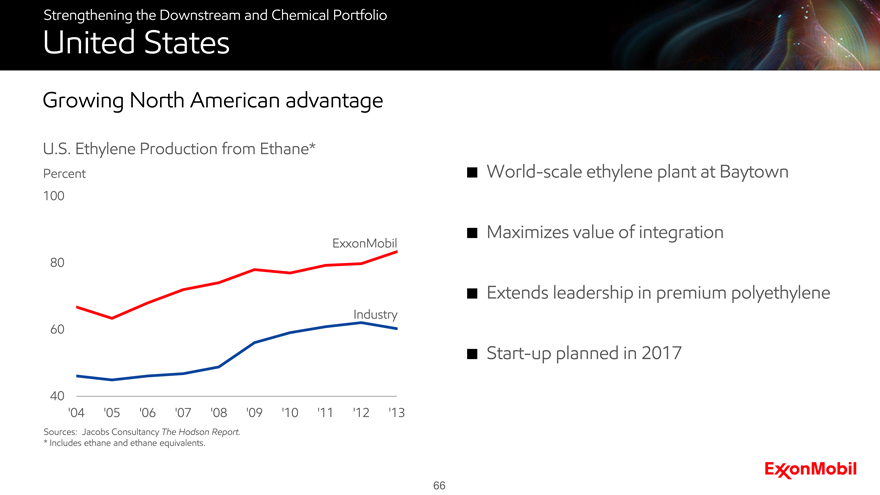
United States
Growing North American advantage
U.S. Ethylene Production from Ethane*
Percent
Sources: Jacobs Consultancy The Hodson Report. * Includes ethane and ethane equivalents.
World-scale ethylene plant at Baytown
Maximizes value of integration
Extends leadership in premium polyethylene
Start-up planned in 2017
Percent 100 80 60 40 ‘04 ‘05 ‘06 ‘07 ‘08 ‘09 ‘10 ‘11 ‘12 ‘13
ExxonMobil Industry
66
Strengthening the Downstream and Chemical Portfolio
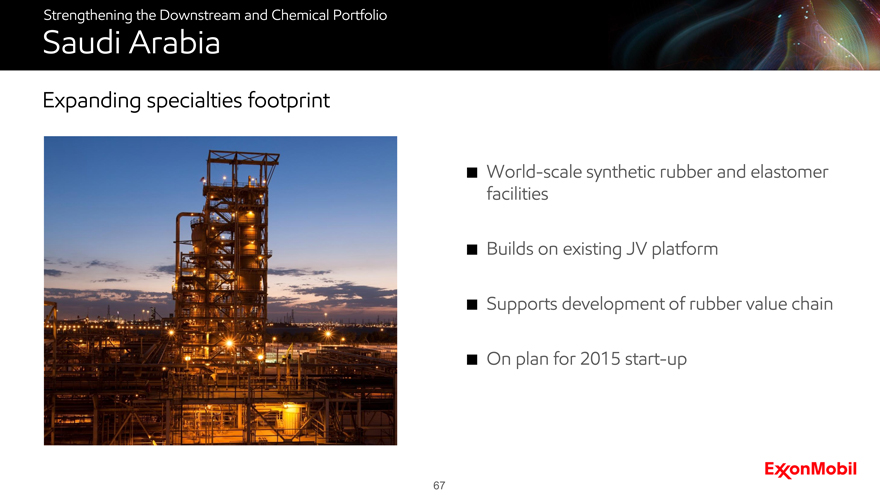
Saudi Arabia
Expanding specialties footprint
World-scale synthetic rubber and elastomer facilities
Builds on existing JV platform
Supports development of rubber value chain
On plan for 2015 start-up
67
Strengthening the Downstream and Chemical Portfolio
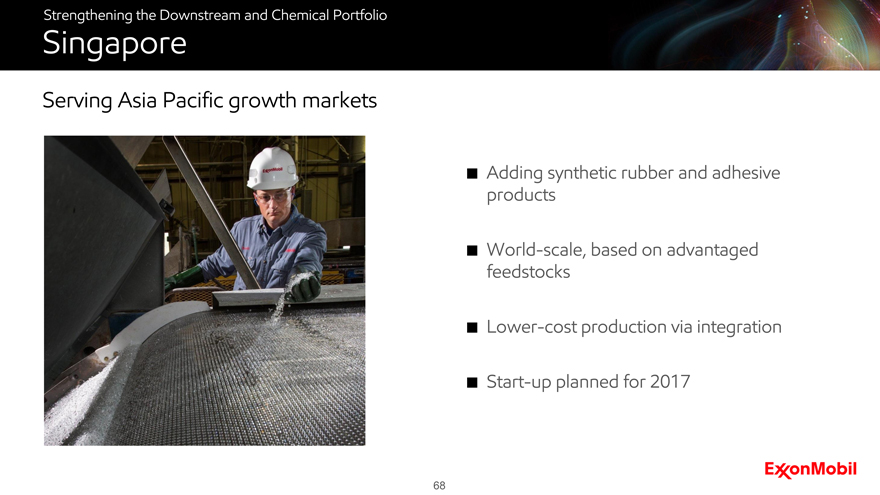
Singapore
Serving Asia Pacific growth markets
Adding synthetic rubber and adhesive products
World-scale, based on advantaged feedstocks
Lower-cost production via integration
Start-up planned for 2017
68
Strengthening the Downstream and Chemical Portfolio
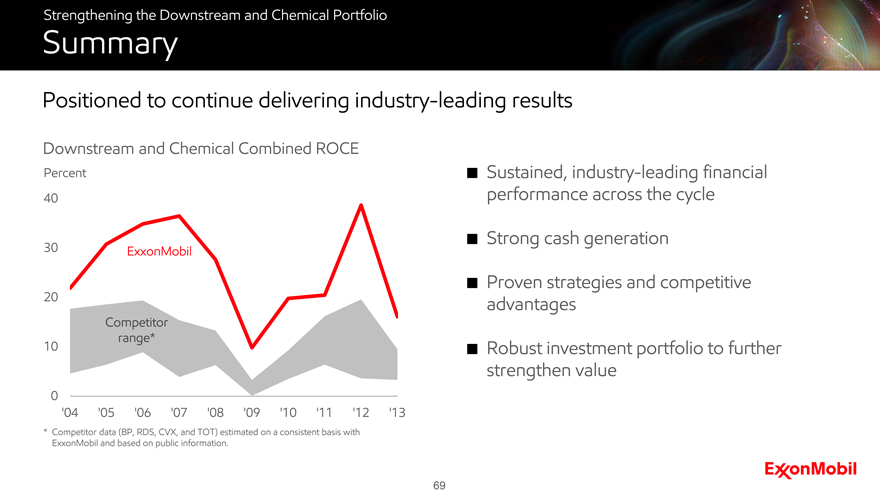
Summary
Positioned to continue delivering industry-leading results
Downstream and Chemical Combined ROCE
Percent
40 30 20 10 0
Exxon Mobil
Competitor range*
‘04 ‘05 ‘06 ‘07 ‘08 ‘09 ‘10 ‘11 ‘12 ‘13
Sustained, industry-leading financial performance across the cycle
Strong cash generation
Proven strategies and competitive advantages
Robust investment portfolio to further strengthen value
* Competitor data (BP, RDS, CVX, and TOT) estimated on a consistent basis with ExxonMobil and based on public information.
69

Break
Summary
Rex Tillerson
Chairman and CEO
Summary
Positioned to Deliver Profitable Growth
72
Summary
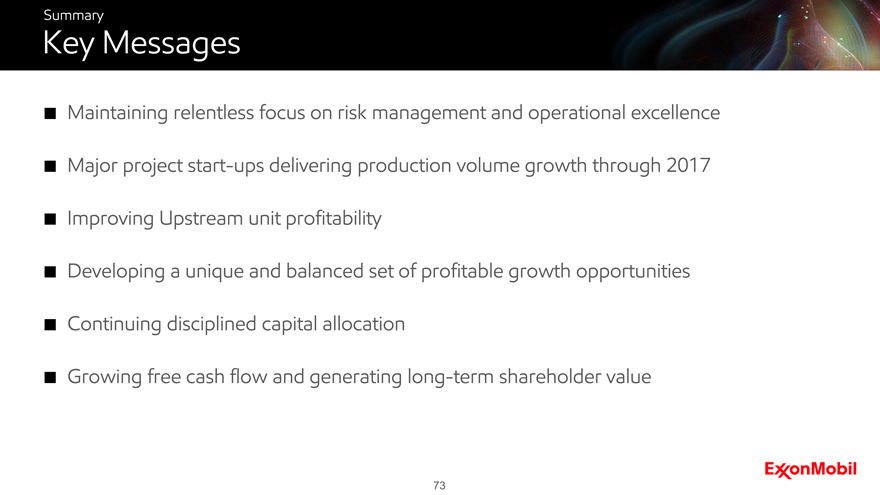
Key Messages
Maintaining relentless focus on risk management and operational excellence
Major project start-ups delivering production volume growth through 2017
Improving Upstream unit profitability
Developing a unique and balanced set of profitable growth opportunities
Continuing disciplined capital allocation
Growing free cash flow and generating long-term shareholder value
73
Q&A