 2013
Analyst Meeting New York Stock Exchange
March 6, 2013
Exhibit 99.2 |
| 2013
Analyst Meeting New York Stock Exchange
March 6, 2013
Exhibit 99.2 |
 Cautionary Statement
Forward-Looking
Statements.
Outlooks,
projections,
estimates,
targets,
business
plans,
and
other
statements
of
future
events
or
conditions in this presentation or the subsequent discussion period are
forward-looking statements. Actual future results, including
financial
and
operating
performance;
demand
growth
and
mix;
ExxonMobil’s
production
growth
and
mix;
the
amount
and mix of capital expenditures; future distributions; resource additions and
recoveries; finding and development costs; project plans, timing, costs, and
capacities; efficiency gains; cost efficiencies; integration benefits; product sales and mix; and the impact
of technology could differ materially due to a number of factors. These include
changes in oil or gas prices or other market conditions affecting the oil,
gas, and petrochemical industries; reservoir performance; timely completion of
development projects; war and other political or security disturbances;
changes in law or government regulation; the outcome of commercial
negotiations; the actions of competitors and customers; unexpected technological
developments; the occurrence and duration of economic recessions; unforeseen
technical difficulties; and other factors discussed here and under the heading "Factors
Affecting
Future
Results"
in
the
Investors
section
of
our
Web
site
at
exxonmobil.com.
See
also
Item
1A
of
ExxonMobil’s
2012
Form 10-K. Forward-looking statements are based on management’s
knowledge and reasonable expectations on the date hereof, and we assume no
duty to update these statements as of any future date. Frequently Used
Terms. References to resources, resource base, recoverable resources,
and
similar
terms
include
quantities
of
oil and gas that are not yet classified as proved reserves but that we believe will
likely be moved into the proved reserves category and produced in the
future. “Proved reserves" in this presentation are presented using the SEC pricing basis in effect
for the year presented, except for the calculation of 19 straight years of at least
100-percent replacement; oil sands and equity company reserves are
included for all periods. For definitions of, and information regarding, reserves, return on average capital
employed, cash flow from operations and asset sales, free cash flow, and other terms
used in this presentation, including information required by SEC Regulation G,
see the "Frequently Used Terms" posted on the Investors
section of our Web site.
The Financial and Operating Review on our Web site also shows ExxonMobil's net
interest in specific projects. The
term
“project”
as
used
in
this
presentation
does
not
necessarily
have
the
same
meaning
as
under
SEC
Rule
13q-1
relating
to
government payment reporting.
For example, a single project for purposes of the rule may encompass numerous
properties, agreements, investments, developments, phases, work efforts,
activities and components, each of which we may also informally describe
herein as a “project.” 2 |
 Agenda
9 AM
Welcome
Corporate Overview
Business Overview
Strategic Overview
Upstream
Downstream and Chemical
Break
Summary
11 AM
Q&A
12 PM
Meeting Concludes
Rex Tillerson, Chairman and CEO
Mike Dolan, Senior Vice President
David Rosenthal, Vice President, Investor Relations
Rex Tillerson, Chairman and CEO
3 |
 Chairman and CEO
Rex Tillerson
Corporate Overview
4 |
 Key
Messages Risk management is fundamental to our business
Continued strong financial and operating results
Major project start-ups drive volume growth for 2013 –
2017
Portfolio of opportunities for long-term profitable growth
ExxonMobil strategy delivers superior returns over the long term
5 |
 2012
Results Strong industry safety performance
Rigorous environmental management
Superior financial / operating results
Disciplined capex
$39.8B
Unmatched shareholder
distributions*
$30.1B
Reserves replacement**
115%
Strong results across key financial and non-financial parameters
*
Includes dividends and share purchases to reduce shares outstanding.
**
Includes asset sales.
6
Earnings
$44.9B
ROCE
25.4%
Cash flow from operations
and assets sales
$63.8B |
 Risk
Management Management accountability
High standards
Employee and contractor training
Operations Integrity Management
Systems (OIMS)
Risk management is fundamental to our business
7
Well-developed and clearly-
defined policies and procedures
Rigorously applied systems |
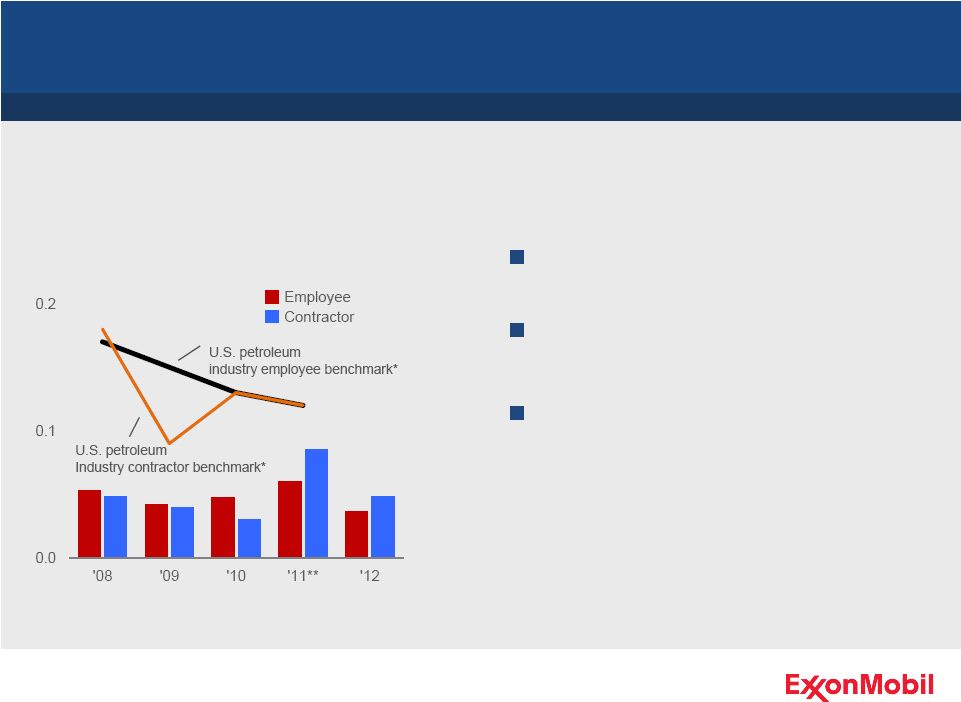 Safety
Our vision: Nobody Gets Hurt
Emphasis on personnel and process
safety risk
Committed to continuously improving
safety performance
Lost Time Incident Rate
Incidents per 200K hours
Safety performance improved versus 2011
*
2012 industry data not available.
**
XTO included beginning in 2011.
8 |
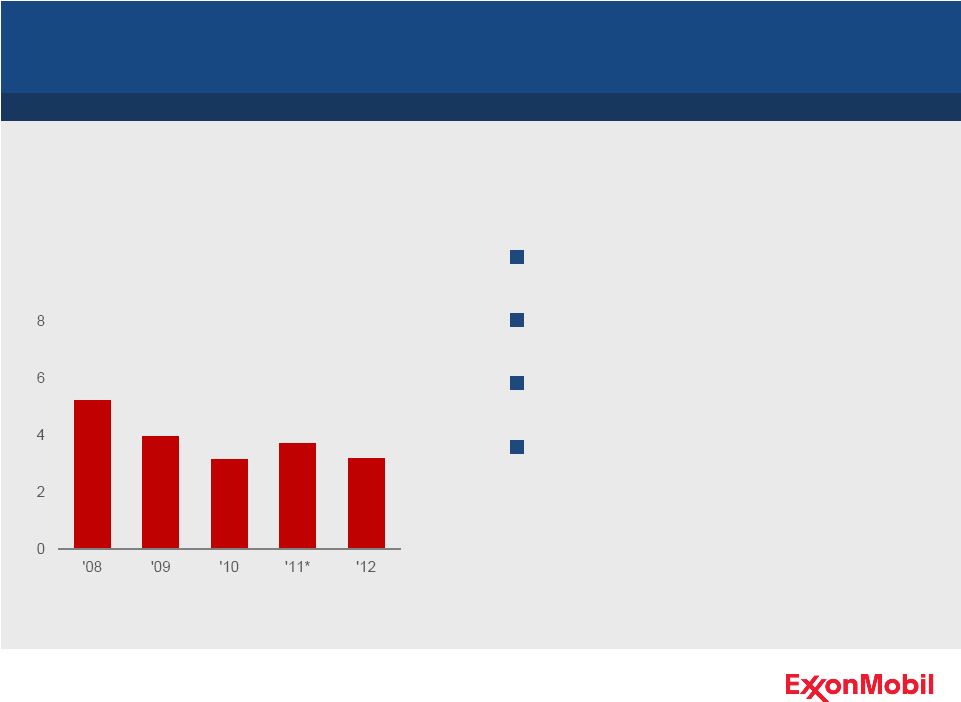 Environmental Performance
Strong environmental management
Improving energy efficiency
Reducing flaring, emissions, releases
Protect Tomorrow. Today.
Hydrocarbon Flaring from
Upstream Oil & Gas Production
Million metric tons
Committed to reducing environmental impact
*
XTO included beginning in 2011.
9 |
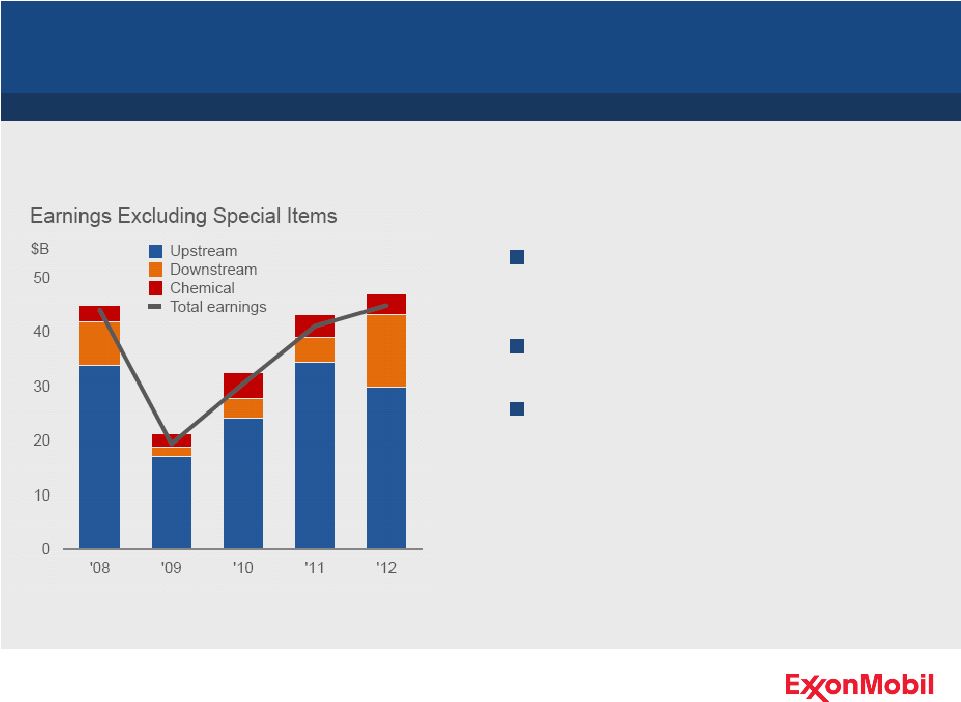 Earnings
 of $44.9B in 2012, an increase of 9% over 2011
Strong performance across all
business lines
Leveraging integration advantages
Maximizing value of asset base
10 |
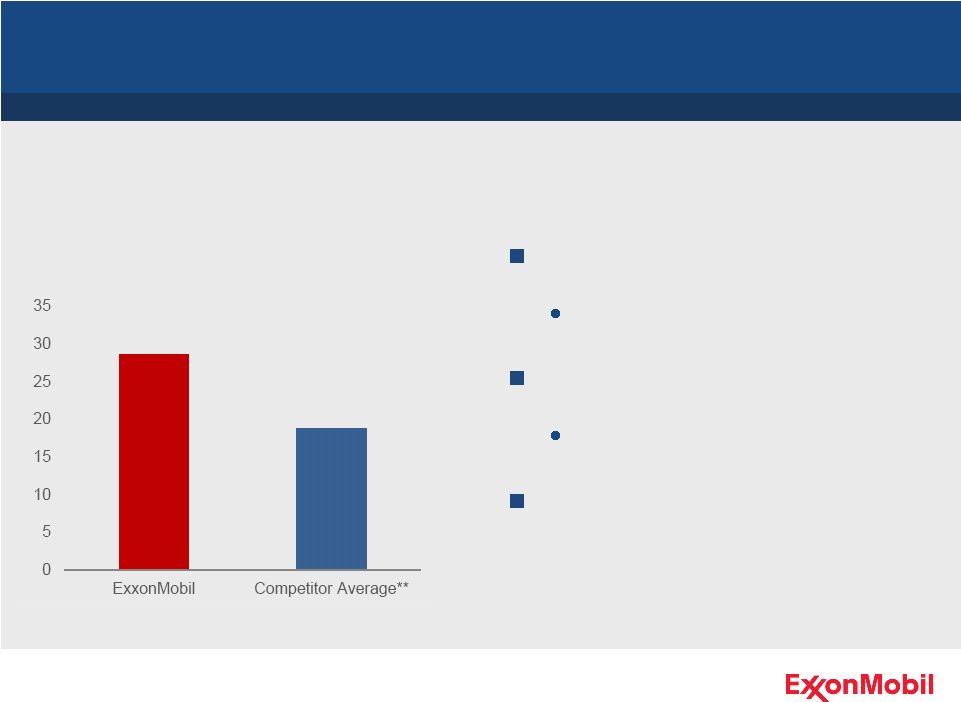
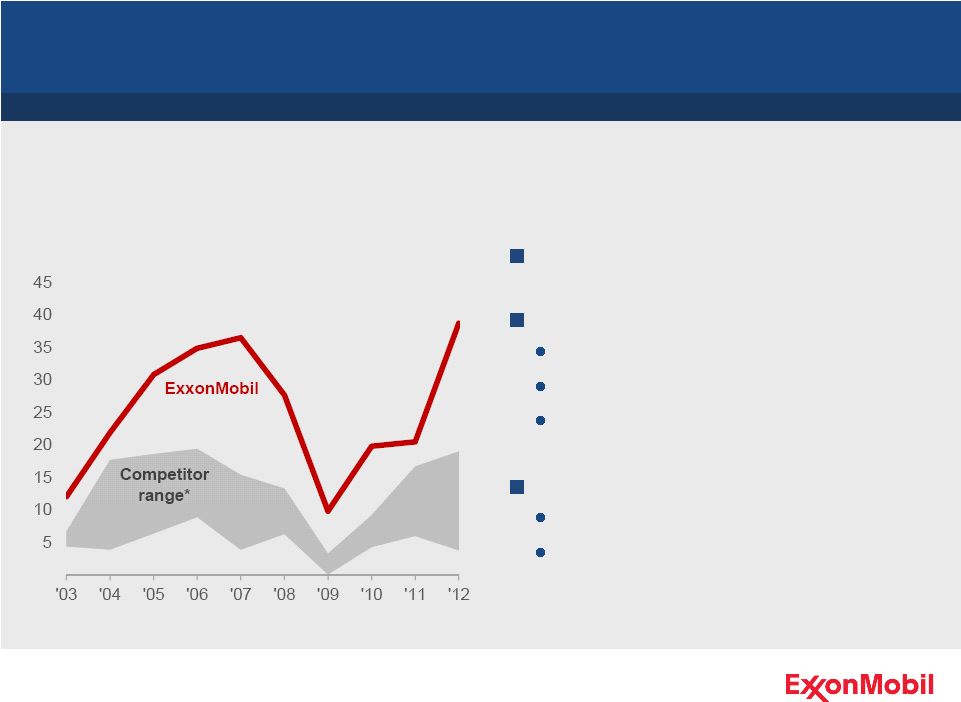
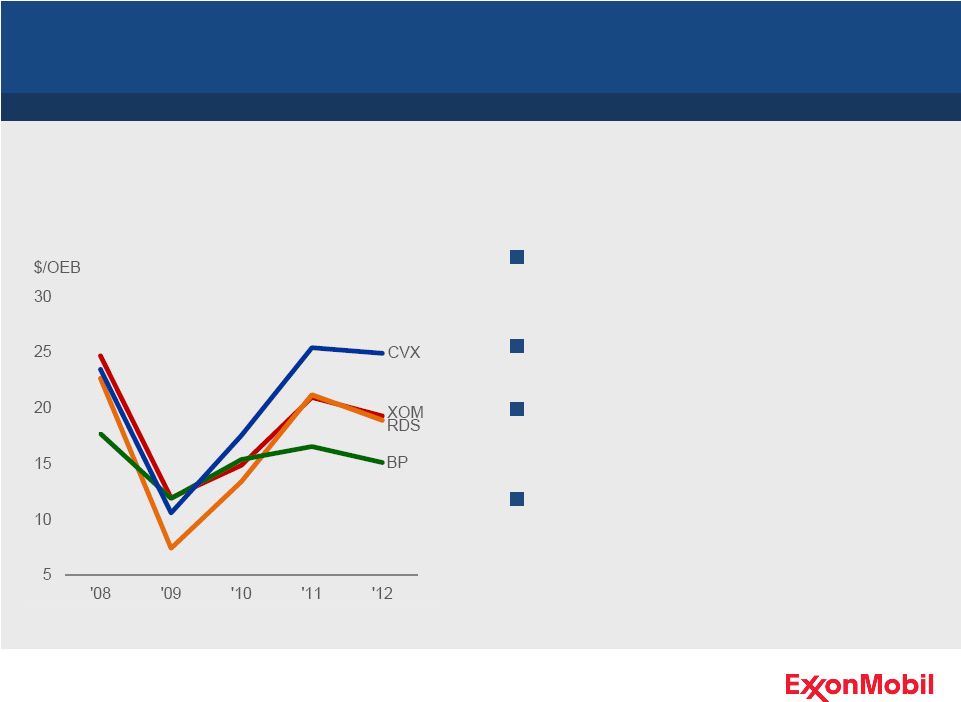 Upstream Earnings per Barrel
Managing the Upstream portfolio to improve earnings per barrel
Current asset mix impacting results
in the short term
Plans in place to maximize value
Disciplined and consistent approach
over the long term
Ongoing portfolio management
Earnings per OEB*
*
Competitor data estimated on a consistent basis with ExxonMobil and based on public
information.
11 |
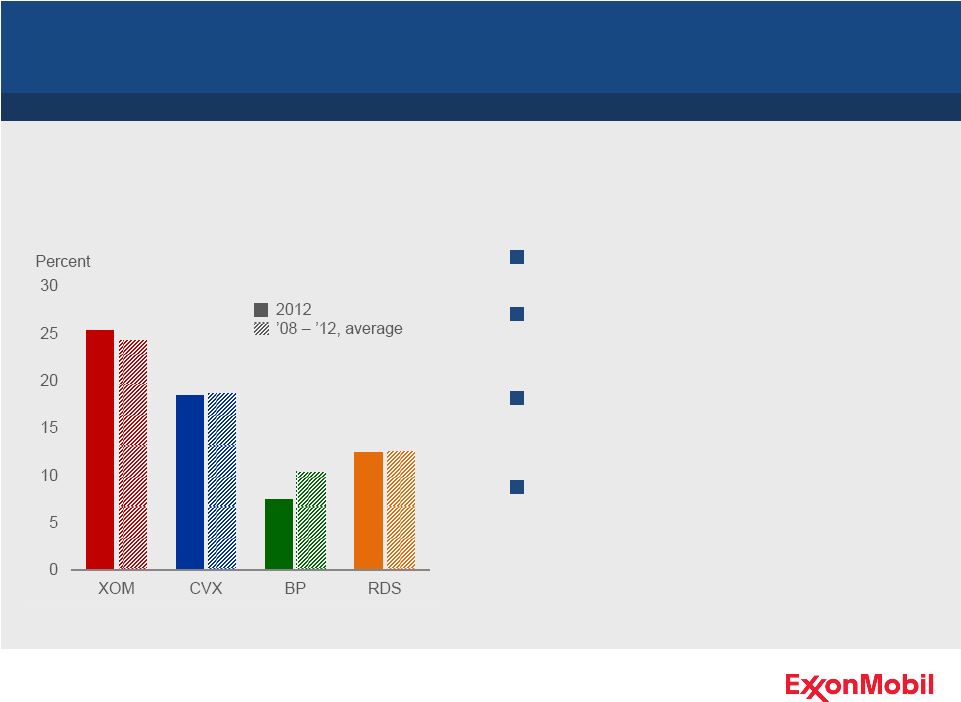 Return on Capital Employed
ROCE of 25.4% in 2012
Investments position long-term
performance
Disciplined investment through the
business cycle
Strength of integrated portfolio,
project management, and
technology application
Return on Average Capital Employed*
Proven business model continues to deliver ROCE leadership
*
Competitor data estimated on a consistent basis with ExxonMobil and based on public
information.
12 |
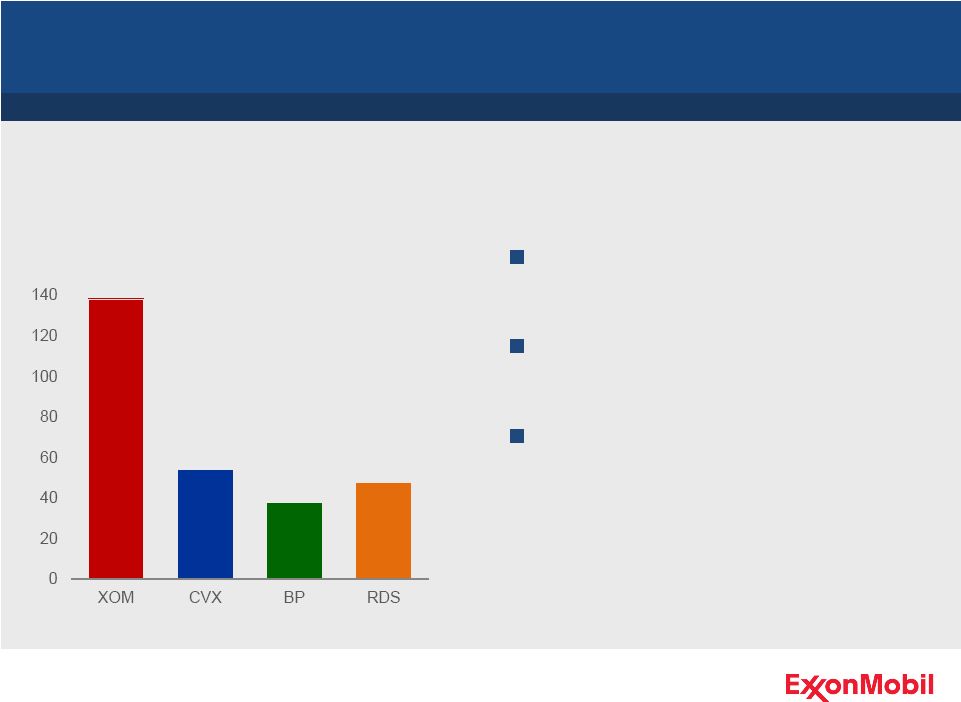 Free Cash Flow
Funded attractive investment
opportunities
Generated free cash flow of $138B
since beginning of 2008
Provides capacity for unmatched
shareholder distributions
Total Free Cash Flow*
$B, cumulative ‘08 –
‘12
Superior cash flow provides investment and distribution flexibility
*
Competitor data estimated on a consistent basis with ExxonMobil and based on public
information.
13 |
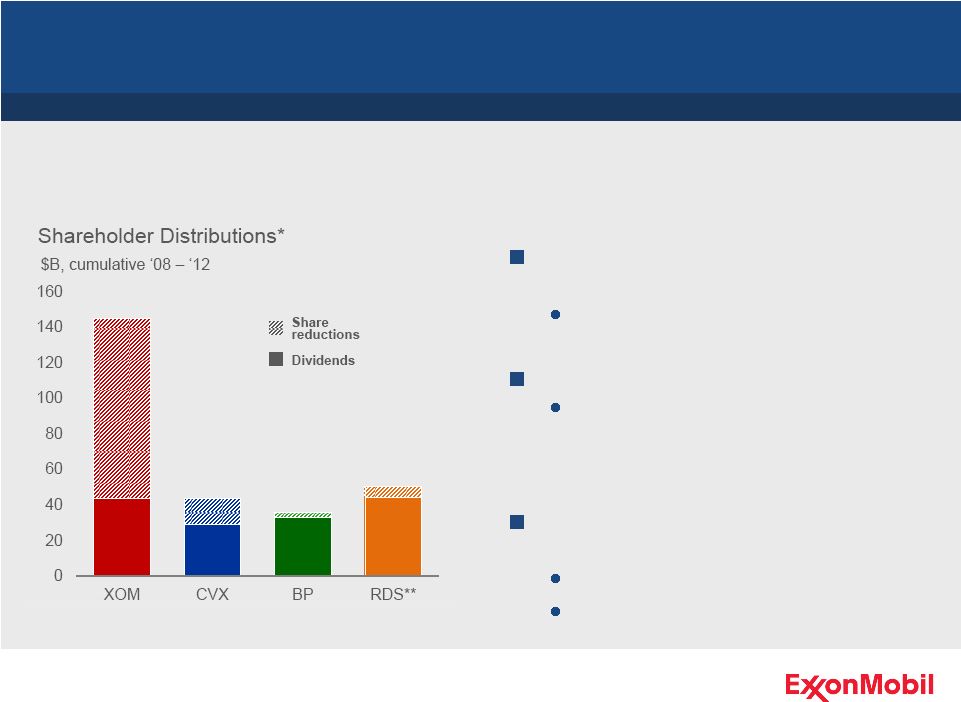 Total shareholder distributions of
$145 billion
Higher than competitors combined
4.5 billion shares outstanding
Reduced from 7.0 billion post
Exxon-Mobil merger and 5.1 billion
post XTO acquisition
Dividends per share increased 59%
since beginning of 2008
21% per-share increase in 2Q ‘12
30 years of consecutive per-share
dividend increases
Unmatched Shareholder Distributions
Industry-leading shareholder distributions
*
Competitor data estimated on a consistent basis with ExxonMobil and based on public
information.
**
Includes share repurchases related to Scrip Dividend Programme.
14 |
 Distribution Yield
Industry-leading shareholder distributions
Total distribution yield of 29%
since beginning of 2008
Nearest competitor at 23%
Average annual distribution yield
of 7.2%
Competitor average of 4.7%
Maintained strong financial
position
Distribution Yield*
Percent, dividends and share repurchases, ‘08 –
‘12
*
Yield based on 2007 year-end market capitalization.
**
RDS, BP, and CVX. Competitor data estimated on a consistent
basis with ExxonMobil and based on
public information. 15 |
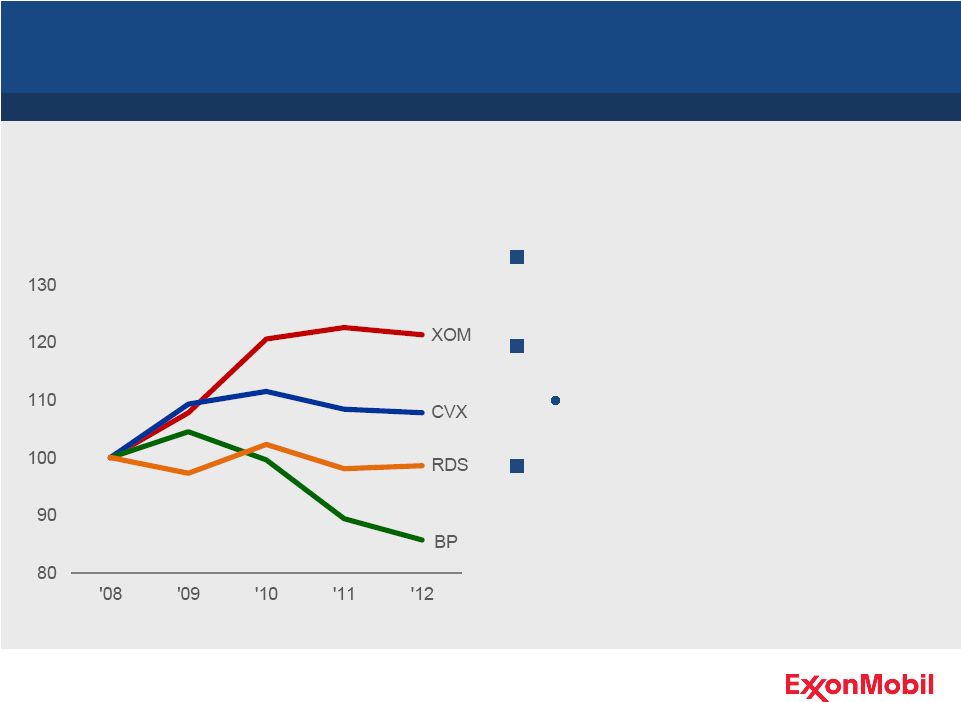 Production Growth per Share*
Indexed growth, ‘08 –
‘12
Each share has an interest in 21%
more production volumes
Annualized production growth per
share of 5%
Nearest competitor at about 2%
Reflects benefit of share purchases
Increasing Ownership
Enhanced per-share interest in ExxonMobil production
*
Competitor data estimated on a consistent basis with ExxonMobil and based on public
information.
16 |
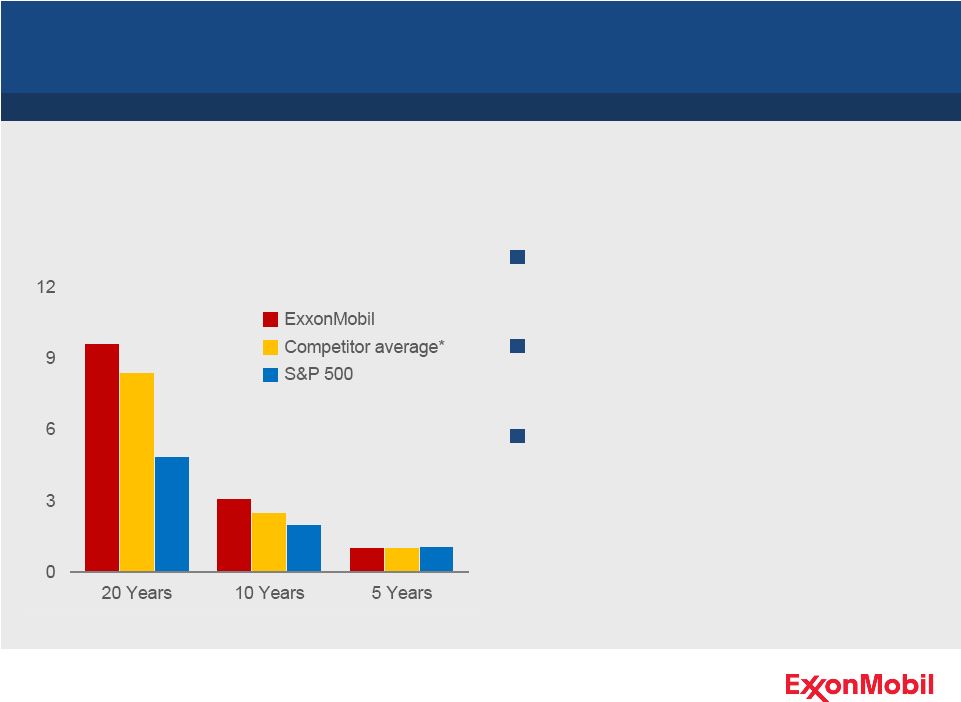 Financial results and stock market
returns best viewed over long term
Reflects strong financial and
operating performance
Competitive advantages maximize
shareholder value
Shareholder Returns
$K, value of $1,000 invested (as of YE 2012)
Share Performance
Long-term performance exceeds competitor average and S&P 500
*
RDS, BP, and CVX. Competitor data estimated on a consistent
basis with ExxonMobil and based on
public information.
17 |
 Chairman and CEO
Rex Tillerson
Business Overview
18 |
 Business Environment
Global environment offers a broad mix of challenges and opportunities
Near-term economic growth remains sluggish with risks persisting in the
OECD Developing economies show signs of stabilizing after slowdown in
2012
Significant regulatory initiatives continue while climate policies remain
uncertain Long-term outlook for energy and petrochemical demand remains
robust 19 |
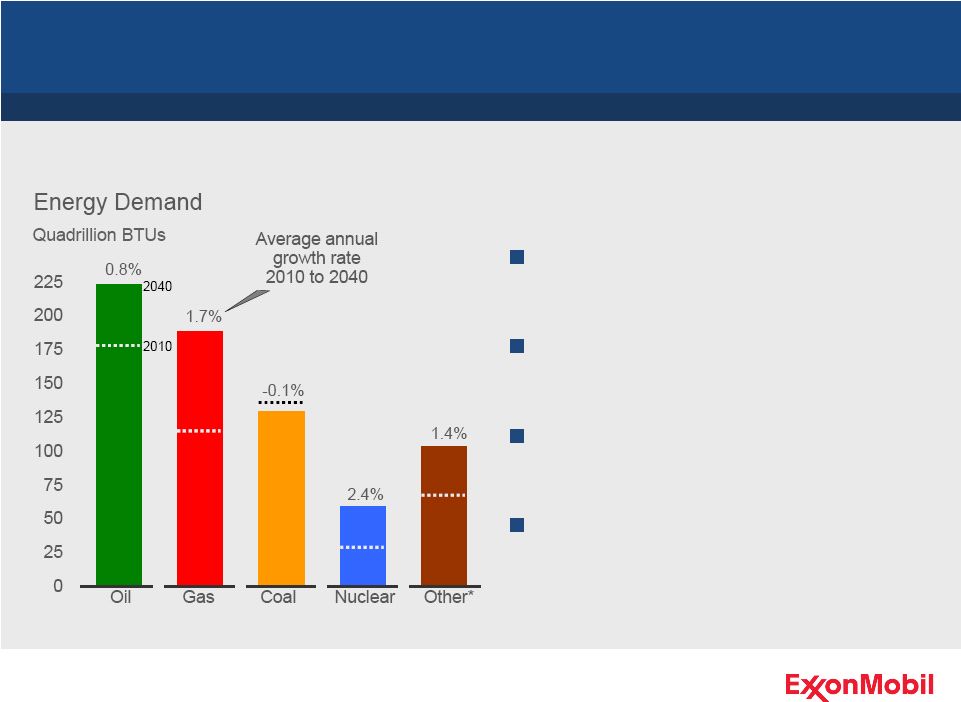 Energy Demand to 2040
Source: ExxonMobil 2013 Outlook for Energy
* Other includes hydro, geothermal, biomass, wind, solar, and biofuels.
Mix gradually shifts with oil and
natural gas remaining prominent
Higher oil demand driven by
expanding transportation needs
Strong growth in natural gas led by
power generation needs
Pace of demand growth
moderated by efficiency gains
across the world
Global energy demand expected to grow about 35% by 2040
20 |
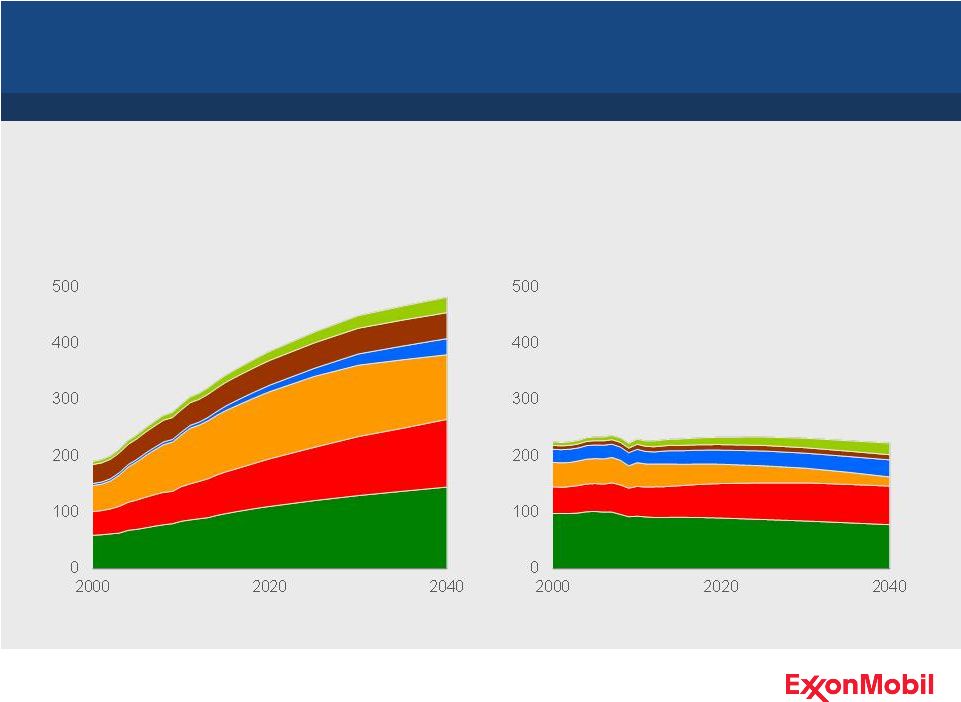 Developing Economies Lead Growth
Source: ExxonMobil 2013 Outlook for Energy
* OECD: Organization for Economic Co-operation and Development
Asia Pacific demand accounts for close to 60% of global increase
21
Non-OECD Countries*
Quadrillion BTUs
Biomass
Other
Oil
Nuclear
OECD Countries
Coal
Gas
Quadrillion BTUs |
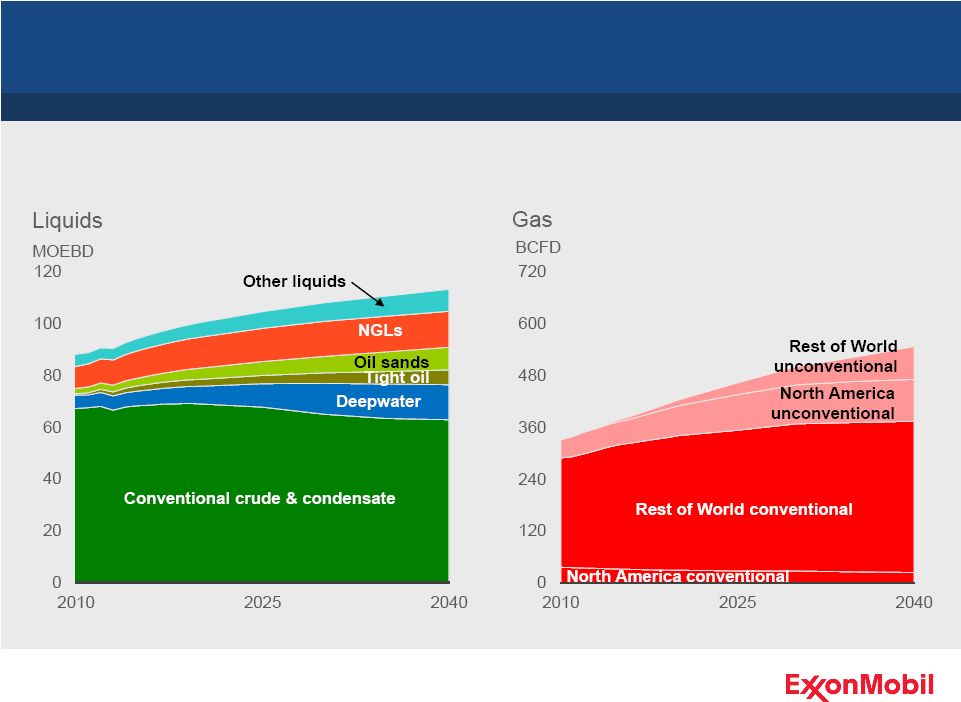 Liquids and Gas Supplies Expand and Diversify
Source: ExxonMobil 2013 Outlook for Energy
Advances in technology enable growth from unconventional resources
22 |
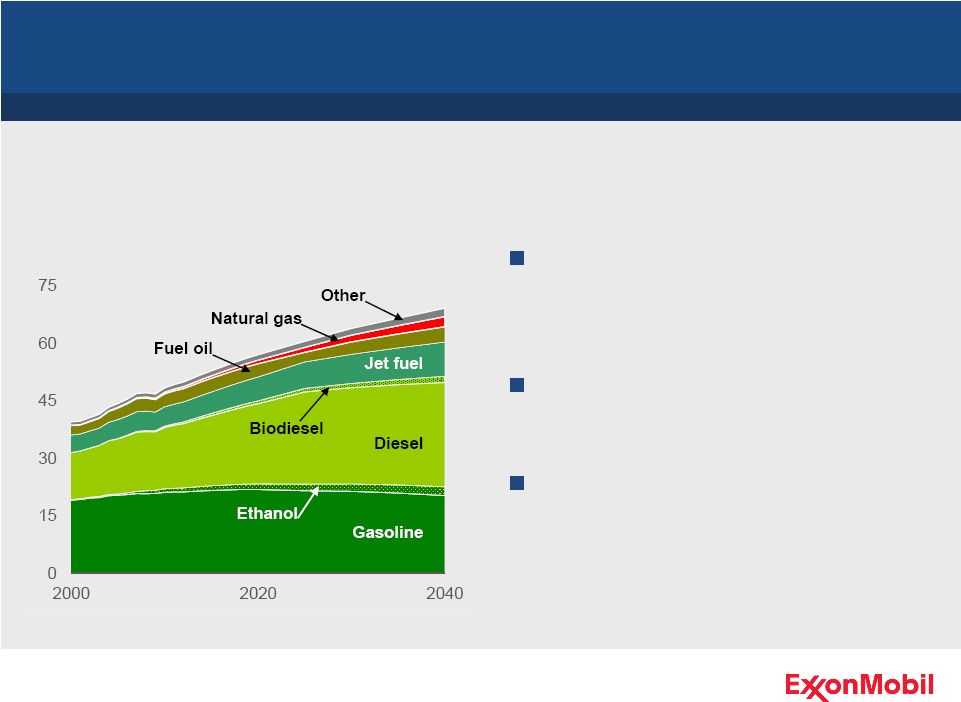 Transportation Product Demand
Transportation product mix will
shift as demand rises more than
40%
Demand for diesel driven by
expanding commercial activity
Gasoline demand will be relatively
flat, reflecting fuel economy gains
Diesel will surpass gasoline as the number one transportation fuel
MOEBD
Global Demand
Source: ExxonMobil 2013 Outlook for Energy
23 |
 Global Chemical Demand
Demand growth above GDP’s as
standards of living improve
Two-thirds of growth in Asia
Pacific
Chemicals provide cost and
material attribute advantages
Sources: IHS Chemical and ExxonMobil estimates
* Chemical demand shown is polyethylene, polypropylene, and paraxylene.
Global Chemical Demand*
Million metric tons
Chemical demand growth driven by Asia Pacific
24 |
 The
Energy Challenge Meeting the world’s growing energy needs safely and
responsibly Requires an abundance of diverse, reliable, and affordable
supplies Demands a commitment to innovation and technology
Requires access to high-quality resources
Calls for unprecedented levels of investment and expanding trade
Requires sound, stable government policies
Demands effective risk management and operational excellence
25 |
 Strategic Overview
Chairman and CEO
Rex Tillerson
26 |
 Key
Elements of ExxonMobil Strategy Best-in-class Upstream, Downstream, and
Chemical businesses Effective risk management, safety, and operational
excellence Integrated business model
Disciplined processes
World-class assets across all business lines
Focus on profitability and returns
Long-term approach
27 |
 Upstream
Chairman and CEO
Rex Tillerson
28 |
 Leading Upstream Business
Consistent execution of strategy delivers long-term value
Industry-leading capabilities
Successful track record of
developing best-in-class resources
Positioned for sustained growth
Intense focus on profitability and
differentiation from competition
29 |
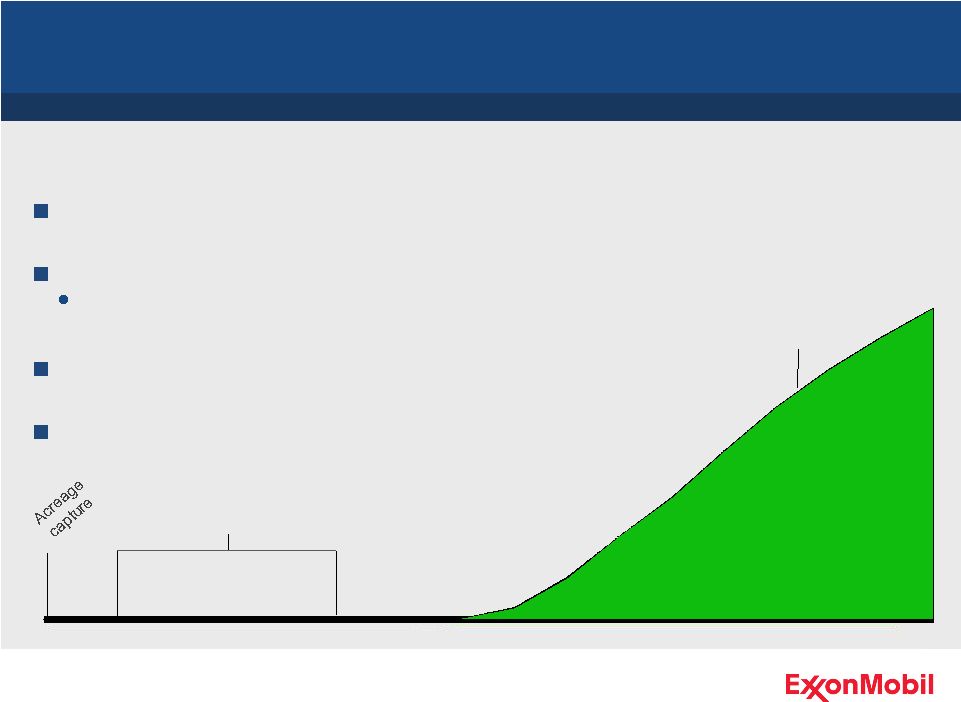 Leading Deepwater Capability
Identified and captured high-quality acreage
Cost-effective hub and satellite development
Operations practices delivering industry leading reliability
Developing and applying high-impact technologies
Transformed frontier acreage to large-scale production
30
Angola-operated
gross cumulative
production
Major exploration
discoveries
Design one, build multiple
1995
2000
2005
2010 |
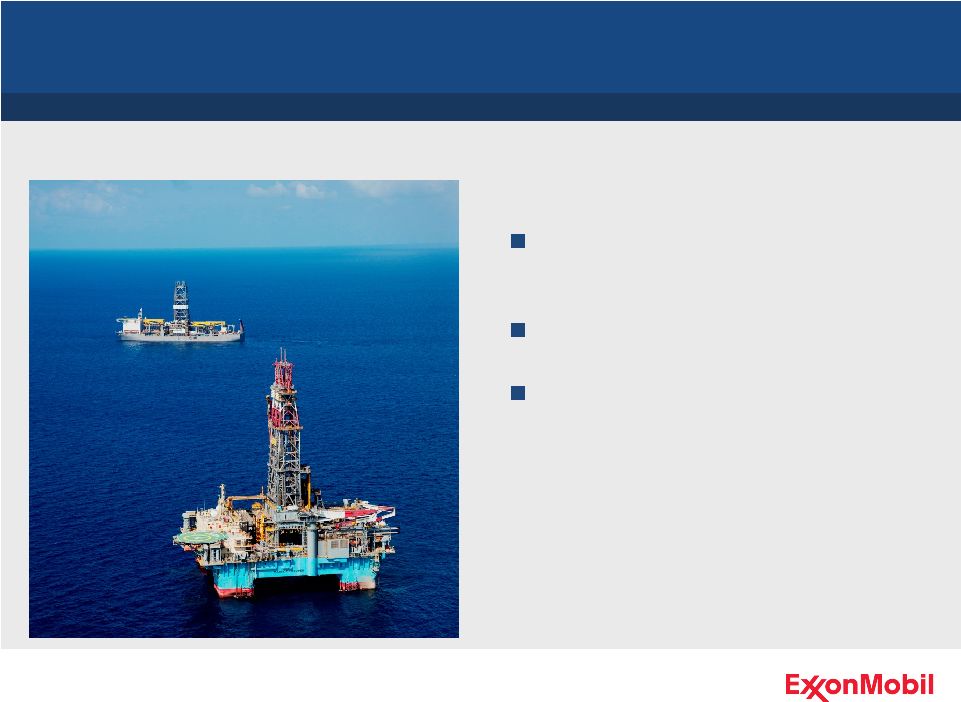
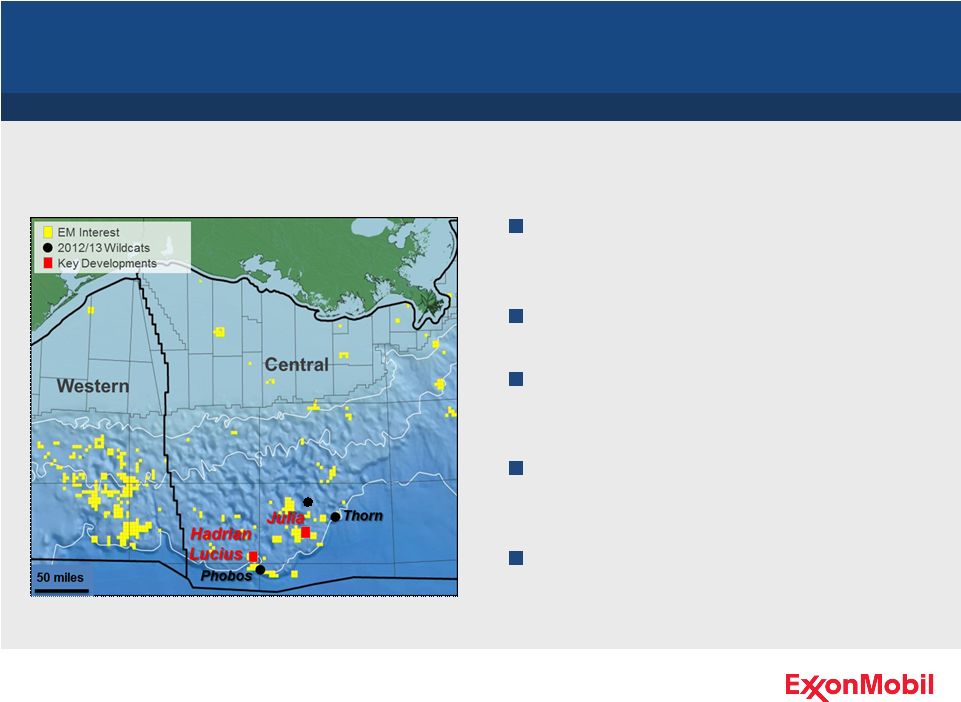 New
Developments - Gulf of Mexico
Leading Deepwater Capability
Lucius and Hadrian South projects
progressing toward 2014 start-up
Hadrian North appraisal drilling
Julia project long-lead items on
order; engineering underway
Exploration drilling and seismic
activity ongoing
Marine Well Containment System
delivery in 2013
Applying expertise to 1.7 million acres in the Gulf of Mexico
Maui
Maui
31 |
 1995
2000
2005
2010
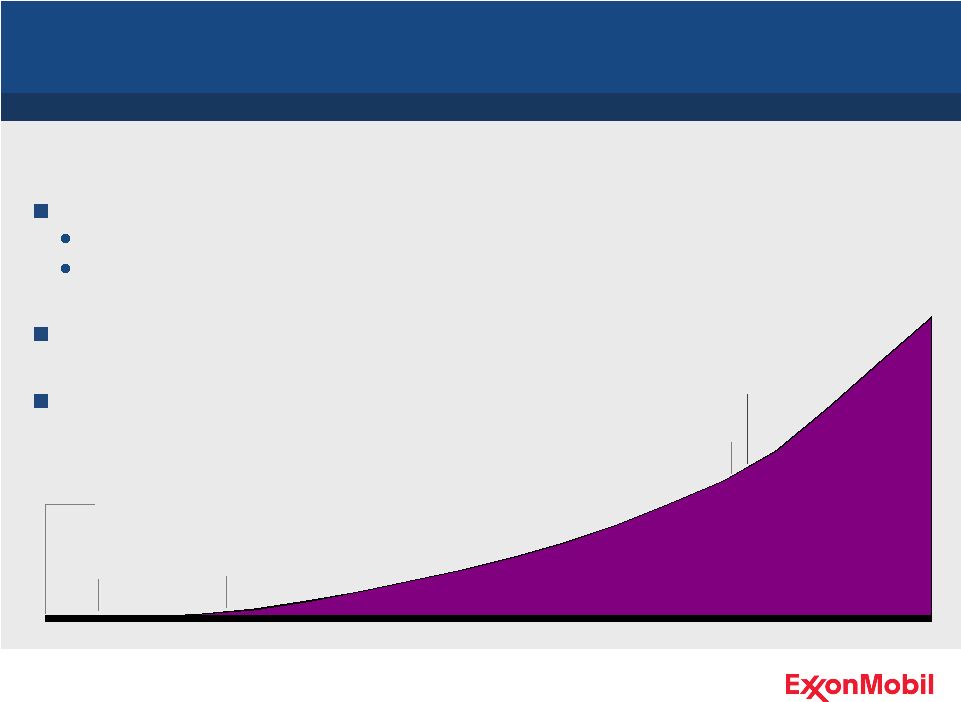
Leading LNG Capability
Qatar joint ventures
gross cumulative
production
Developing and applying high-impact technologies
Developing emerging LNG markets
Extending LNG operating experience and project
execution capabilities globally
1st
LNG cargo
Ras Laffan
JV established
Train 1
Ras Gas
Commercialized world’s largest gas field via LNG with Qatar Petroleum
> 5 BOEB
produced
Train 4
Qatargas II
32
Multiple industry “firsts”
Economies of scale across value chain |
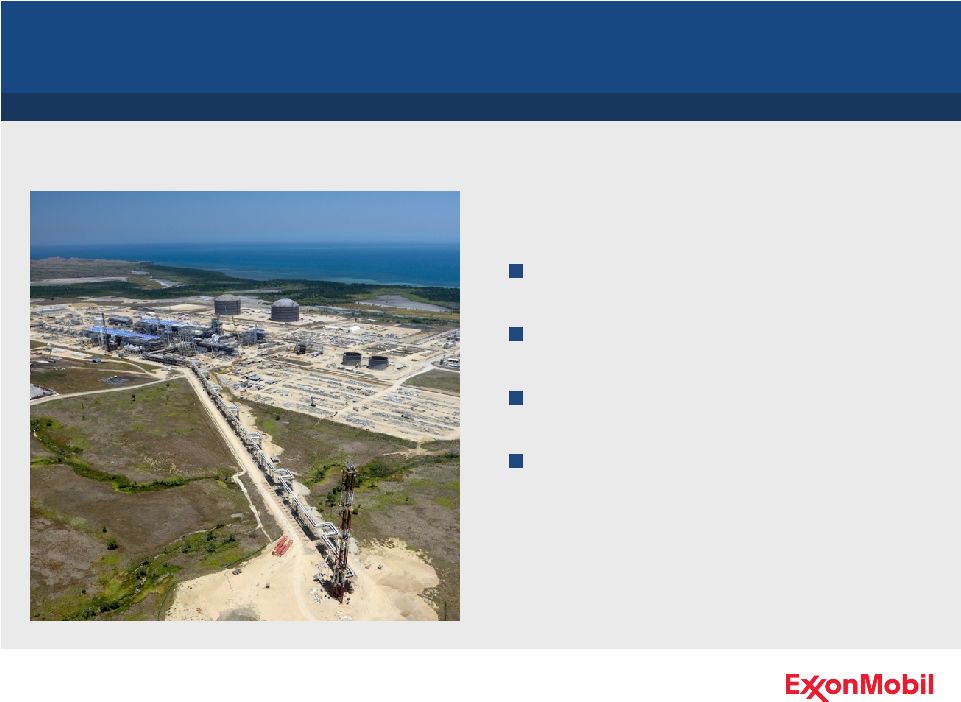 New
Developments - Papua New Guinea
Leading LNG Capability
High-quality 9 TCF resource
Two-train 6.9 MTA LNG plant
On schedule for start-up in 2014
Adding resource for a potential third
train
Applying global LNG experience and project execution capabilities
33 |
 1980
1985
1990
1995
2000
2005
2010
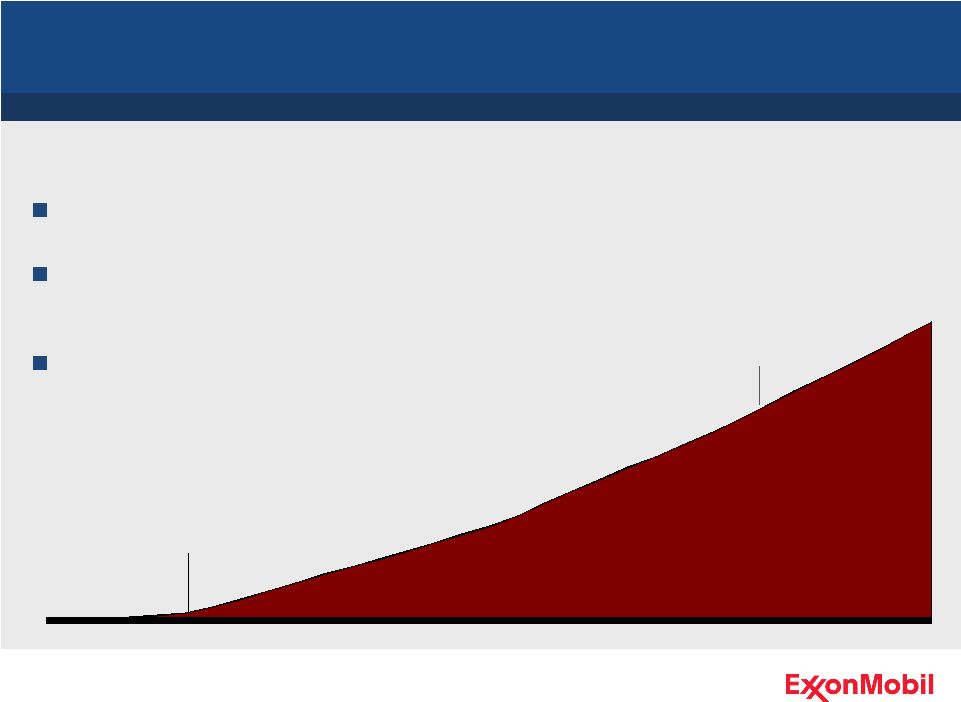
Leading Oil Sands / Heavy Oil Capability
Premier portfolio of long-plateau volumes
Enabling technologies improve recoveries and
reduce environmental impact
Developing projects with strong earnings
Cold Lake
gross cumulative
production
High-quality resources and enabling technologies deliver long-term
value > 1 BOEB
produced
Commercial development
34 |
 Facility start-up 1Q 2013
Proprietary technology
Long-term plateau production
Expansion project execution in
progress ~30% complete
New Developments -
Kearl
Leading Oil Sands Capability
Long-life resource begins production
35 |
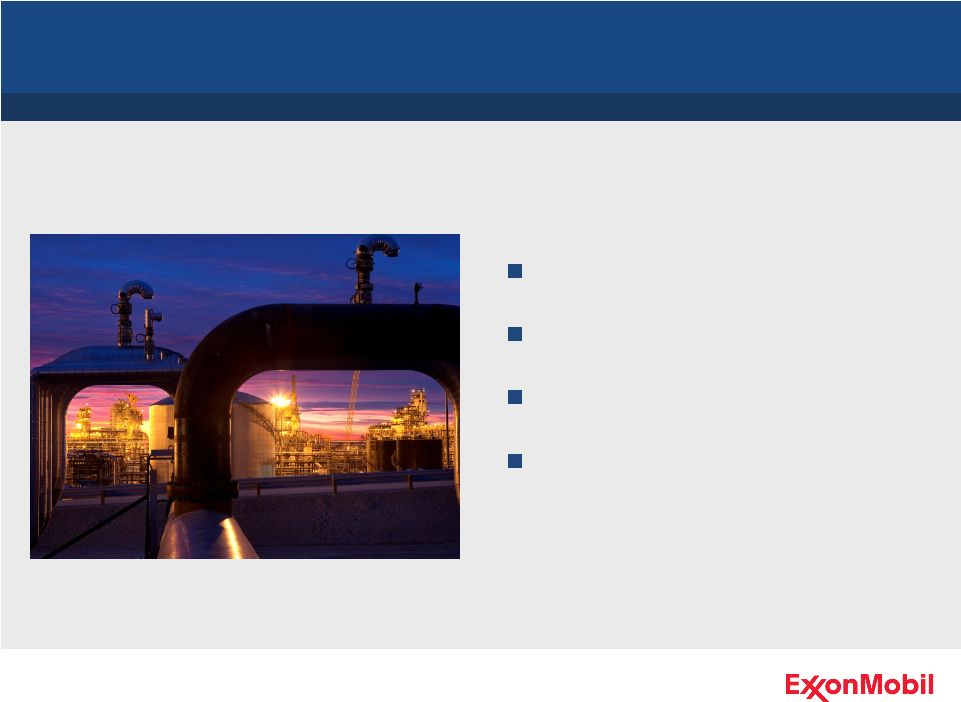
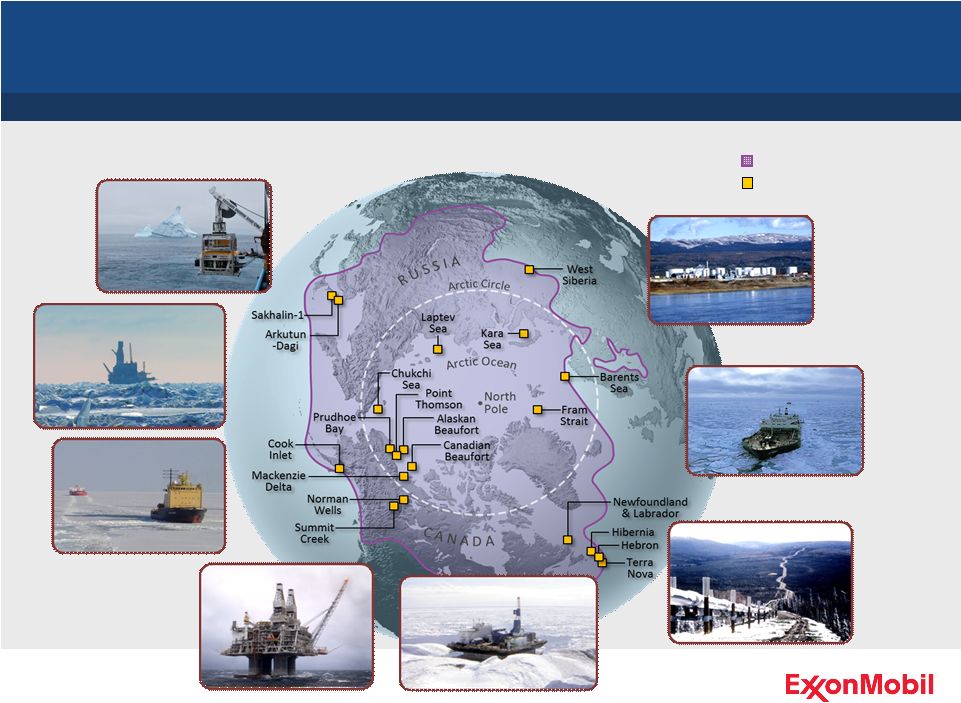 Leading Arctic Capability
ExxonMobil interest & field
program experience
Arctic-like conditions
Over 90 years of technology innovation in the Arctic
1920
1970s
2002
2012
1969
1997
2005
36
1984 |
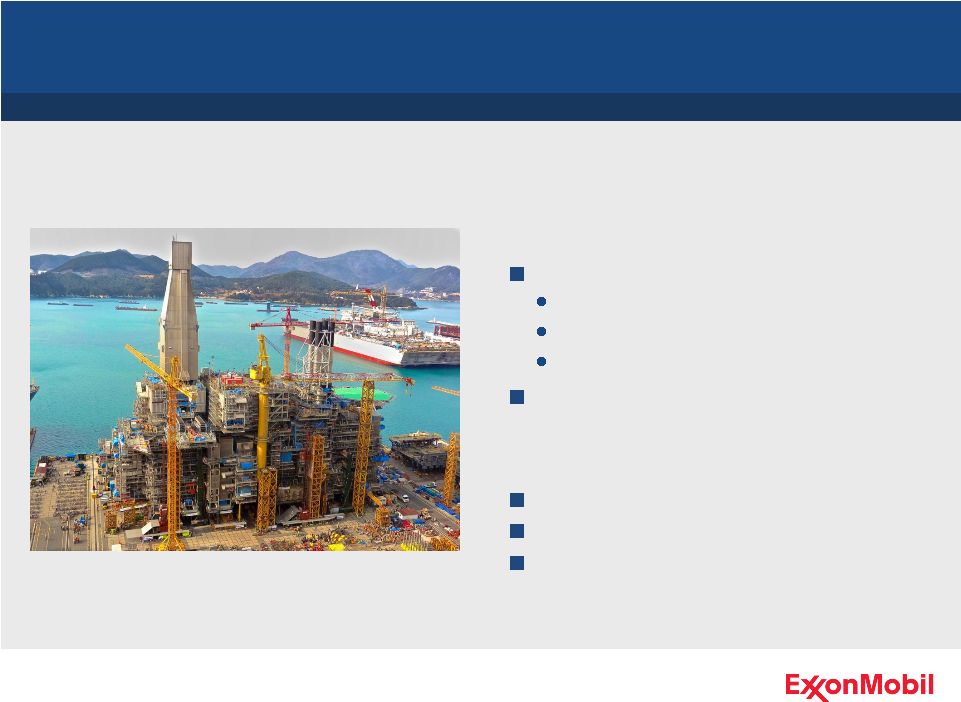 New
Developments - Sakhalin and Hebron
Leading Arctic Capability
Sakhalin
Arkutun-Dagi
Chayvo Onshore Expansion start-up
Hebron
Project sanctioned
Develops 700 MBO
Execution under way
Applying proven arctic capabilities to progress additional developments
37
Gravity-based structure complete
Topsides fabrication in progress
On schedule for 2014 start-up |
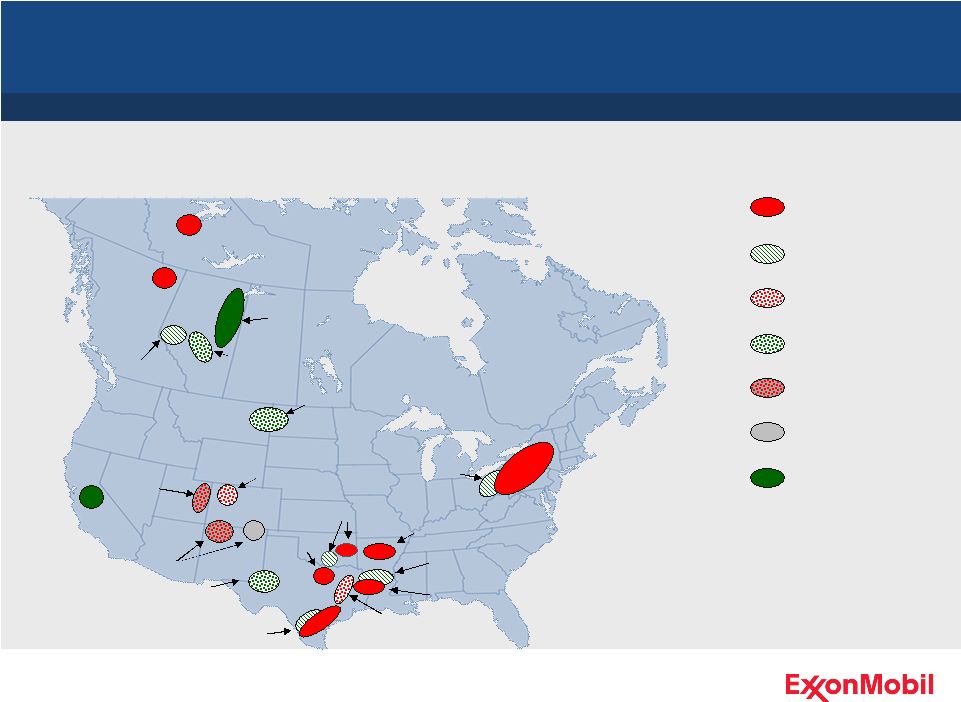 Leading Unconventional Capability
Unmatched position in unconventional plays in North America
Shale gas
Tight oil
Tight gas
CBM
Tight gas / CBM
Heavy oil /
Oil sands
Shale oil
(incl. liquids rich)
Fayetteville
505K
Woodford
385K
Bakken
585K
San Juan / Raton
445K
Uinta
260K
Piceance
320K
Barnett
230K
Haynesville / Bossier
240K
Horn River
340K
Marcellus / Utica
625K
Cardium
235K
San Joaquin
Valley
150K
Utica
90K
Permian
400K
Eagle Ford
90K
Freestone
320K
Athabasca
720K
Summit Creek
445K
Smackover
215K
Montney / Duvernay
650K
38 |
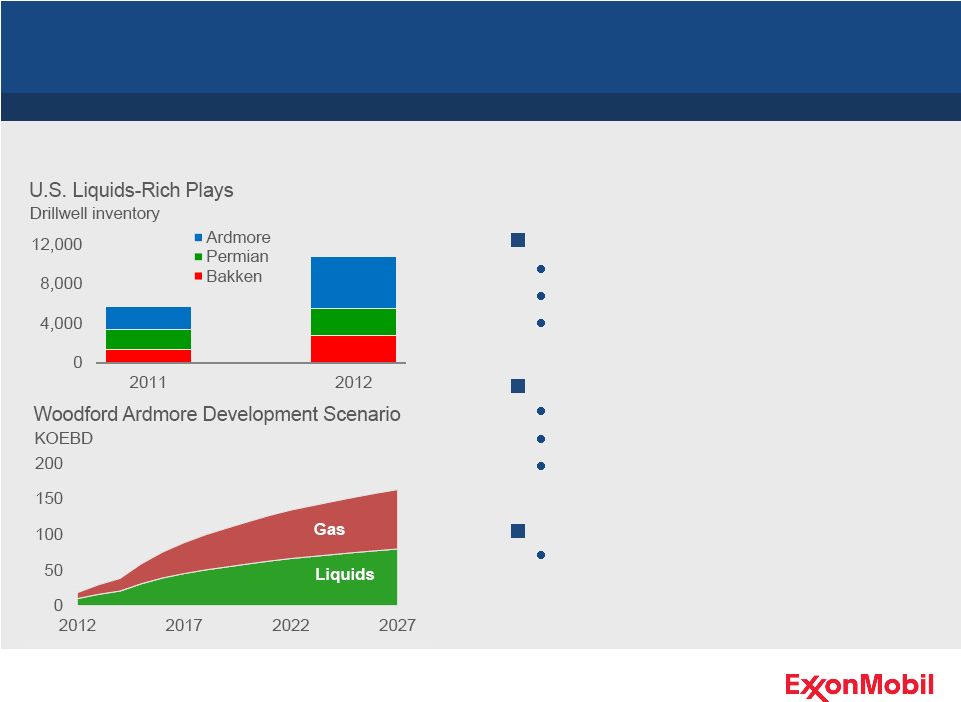 Woodford Ardmore
Bakken
Permian
Expanding Liquids-Rich Position
Leading Unconventional Capability
Leading position in major plays drives significant liquids growth
39
> 1.5 BOEB resource potential
Most active unconventional play
Infrastructure build-out progressing
Growing core liquids position
0.9 BOEB resource
Strategic bolt-on acquisition
Leading producer and acreage holder |
 0
500
1,000
1,500
2,000
0
500
1,000
1,500
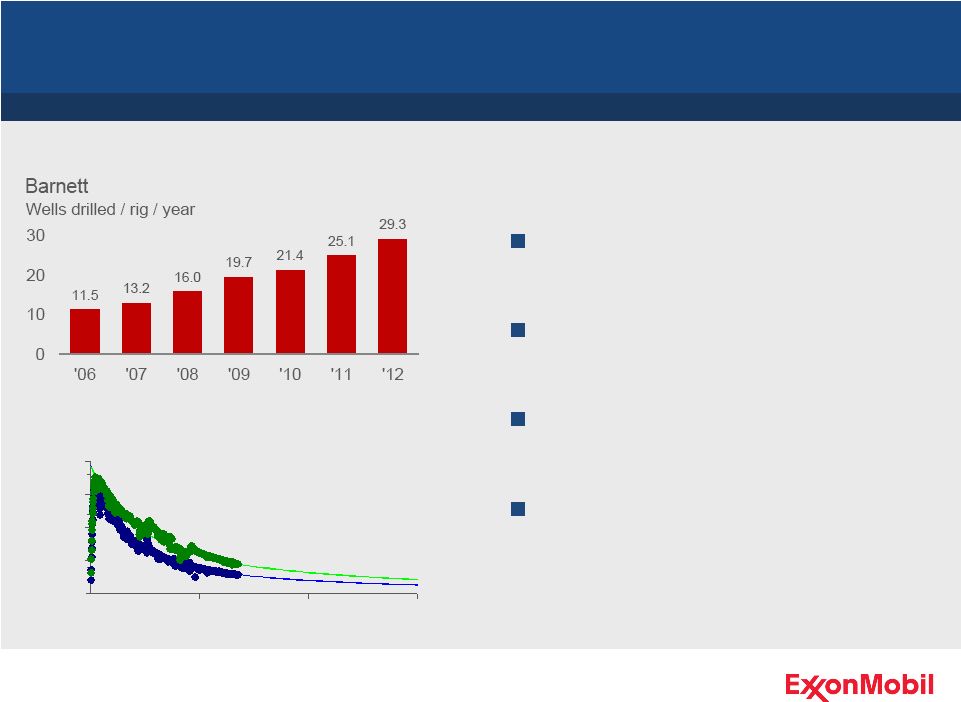
Consistent increase in wells per rig
year yields reduction in drilling costs
Continuing to extract value even with
increasing well complexity
Optimized completions yield higher
recoveries
Approach applied to global portfolio
Operational Excellence
Leading Unconventional Capability
Driving down costs and increasing recovery
Completion Optimization -
Haynesville
Rate, MCF per 1,000 feet
Time (days on production)
Optimized
Traditional
40 |
 2013 –
2017 Production growth
Major project start-ups deliver significant volume growth
Continued development of resource
base
Adding 1 MOEBD net by 2017
Significant growth in liquids and
liquids-linked gas
41 |
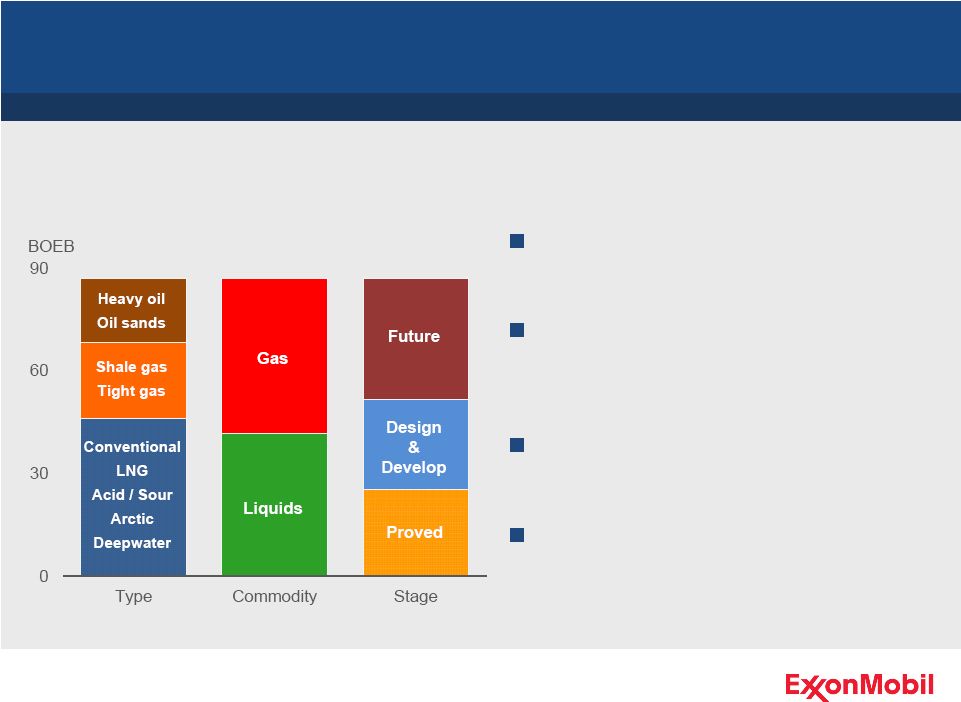 Resource Base
87 BOEB –
delivering today, positioning for tomorrow
Large, diverse, and well-balanced
portfolio of assets
25 BOEB proved reserves –
current
operations and projects in
construction
27 BOEB –
in design and
development stages
35 BOEB –
future development
2013 –
2017 Production Growth
Resource Base
42 |
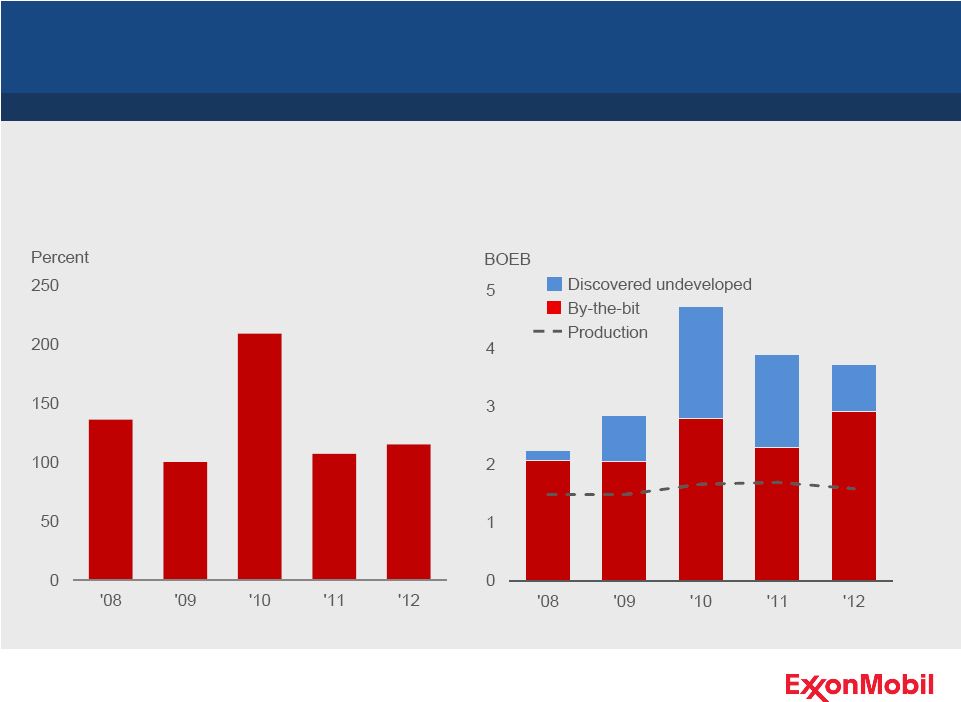 Reserves Replacement & Resource Additions
Proved Reserves Replacement*
Annual Resource Additions**
Consistently replacing reserves and adding quality resources
2013 –
2017 Production Growth
*
Reserves replacement based on SEC pricing bases and including asset sales, except
as noted in the Cautionary Statement.
**
Excludes XTO acquisition and the proved portion of discovered undeveloped
additions. 43 |
 Projects Delivering Volume Growth
2013 –
2017 Production Growth
Oil Sands
Kearl
Conventional
Nigeria Satellites
Arctic
Arkutun-Dagi
Deepwater
Angola Satellites
LNG
Papua New Guinea
Conventional
Banyu Urip
LNG
Gorgon Jansz
31 major project start-ups between 2012 and 2017
Conventional
Telok
44 |
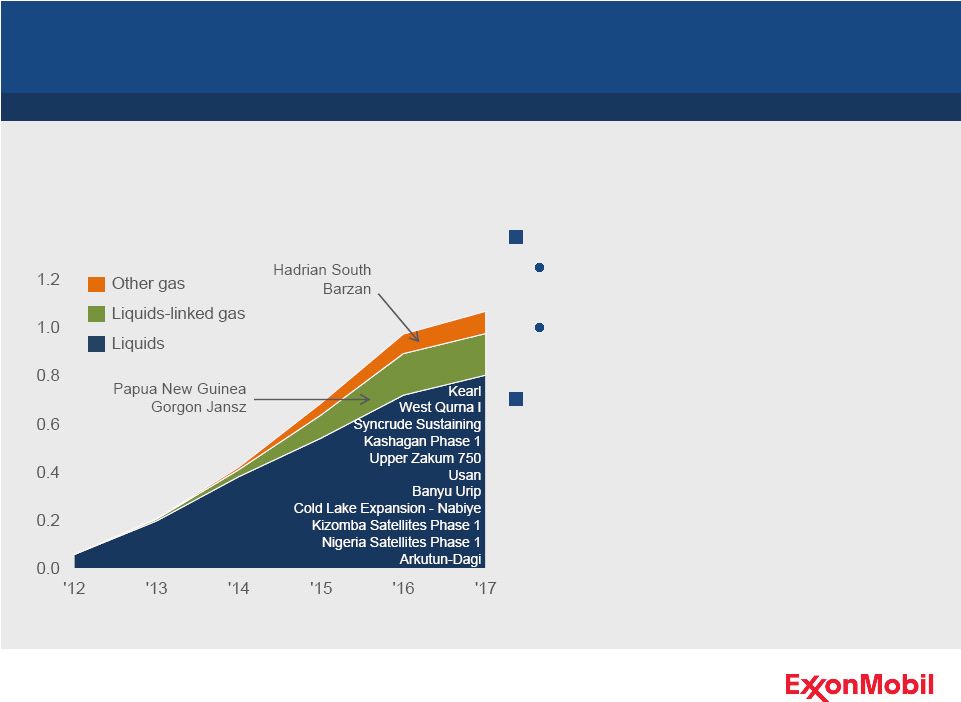 Major Project Production Outlook
2013 –
2017 Production Growth
Major Project Production Outlook*
Over 1 MOEBD net added by 2017
Portfolio supports long-term growth
MOEBD
Major projects deliver liquids and liquids-linked volume growth
*
Excludes impact of future divestments and OPEC quota effects.
Projections based on 2012 average prices ($112/B Brent)
45
> 90% liquids + liquids-linked
volumes
Two-thirds long-plateau volumes |
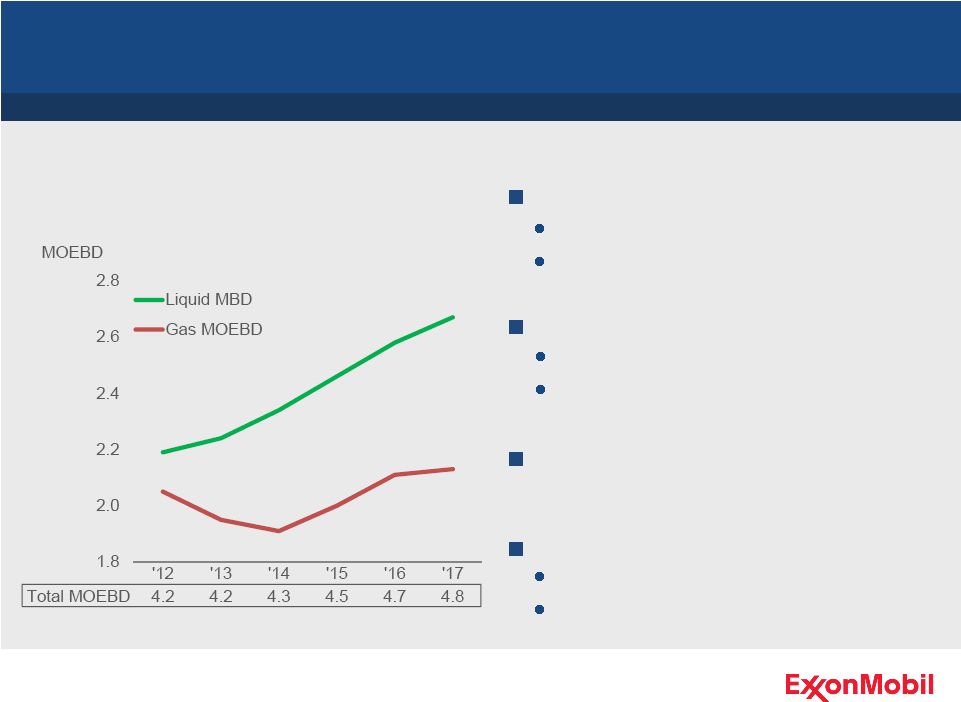 Total Production Outlook*
Upstream Production Outlook
Liquids outlook
Gas outlook
Liquids + liquids-linked outlook:
up 3 –
4% per year
Total production outlook
2013 –
2017 Production Growth
2 –
3% growth per year through 2017 –
strong contribution from liquids
*
Excludes impact of future divestments and OPEC quota effects.
Projections based on 2012 average prices ($112/B Brent)
46
2013: up ~2%
2013 –
2017: up ~4% per year
2013: down ~5%
2013 –
2017: up ~1% per year
2013: down ~1%
2013 –
2017: up 2 –
3% per year |
 Long-Term Growth Opportunities
Well positioned for sustained long-term growth
Successful exploration results
Deep and robust inventory
Adding quality acreage in proven and
emerging plays
47 |
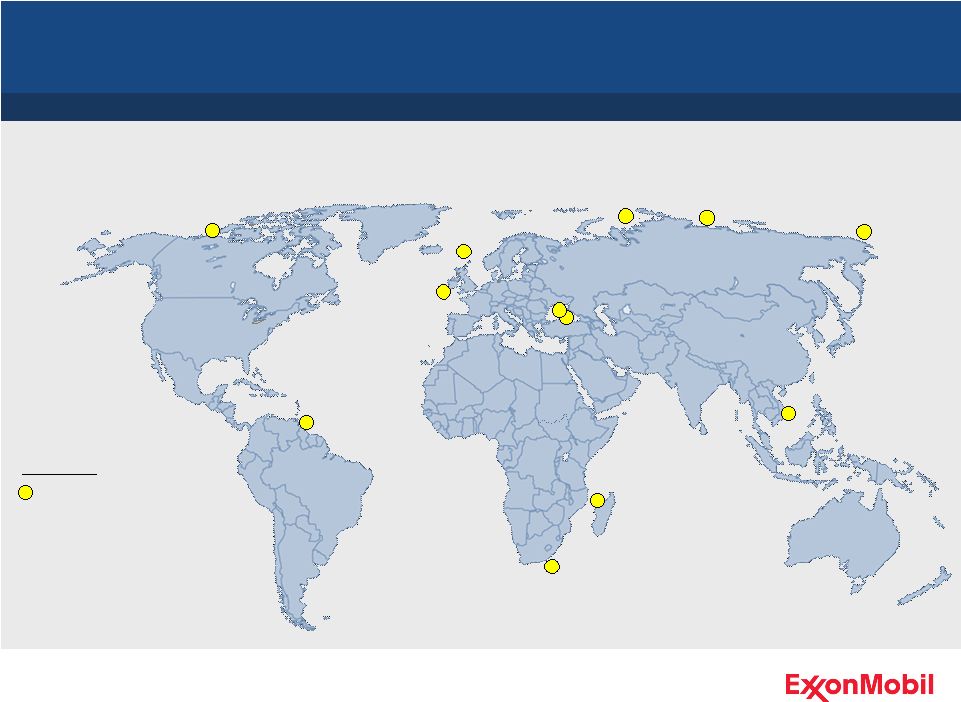 New
Opportunity Growth Growth Opportunities
Vietnam
Beaufort
Faroe Islands
Madagascar
Guyana
Ireland
New play tests
Play Type
Kara Sea
Russian Black Sea
Ukraine
Growing global portfolio of high-quality resource opportunities
South Africa
Chukchi Sea
Laptev Sea
48 |
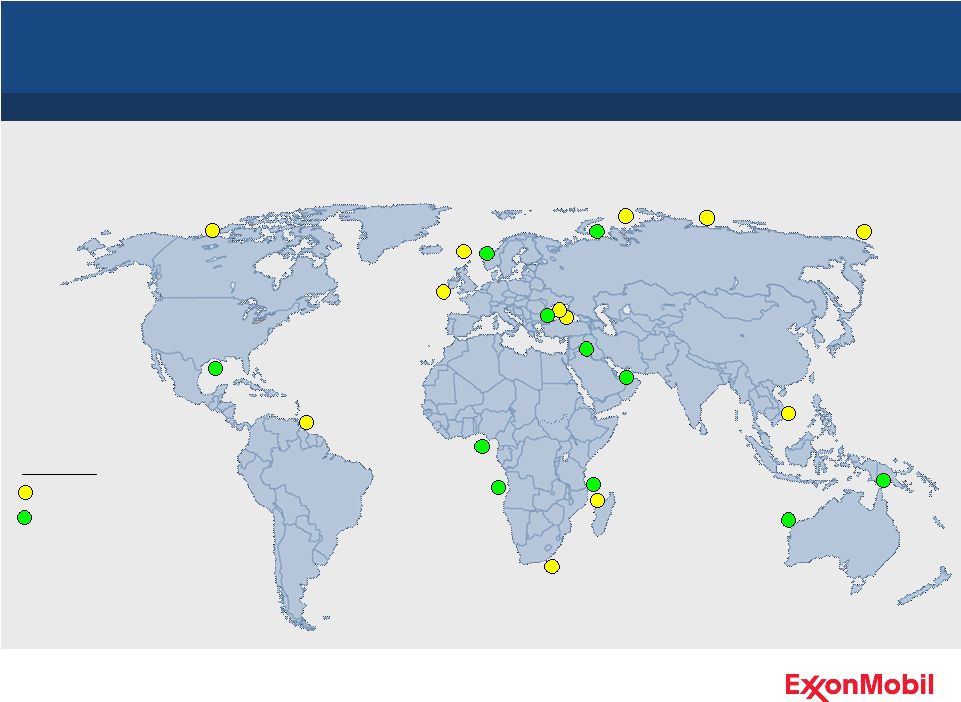 New
Opportunity Growth Growth Opportunities
Vietnam
Norway
Abu Dhabi
Beaufort
Romania
Iraq
Tanzania
Nigeria
PNG
Gulf of Mexico
Australia
Angola
Faroe Islands
Madagascar
Guyana
Ireland
New play tests
Play Type
Proven conventional plays
Kara Sea
Russian Black Sea
Ukraine
Growing global portfolio of high-quality resource opportunities
South Africa
Chukchi Sea
Laptev Sea
49 |
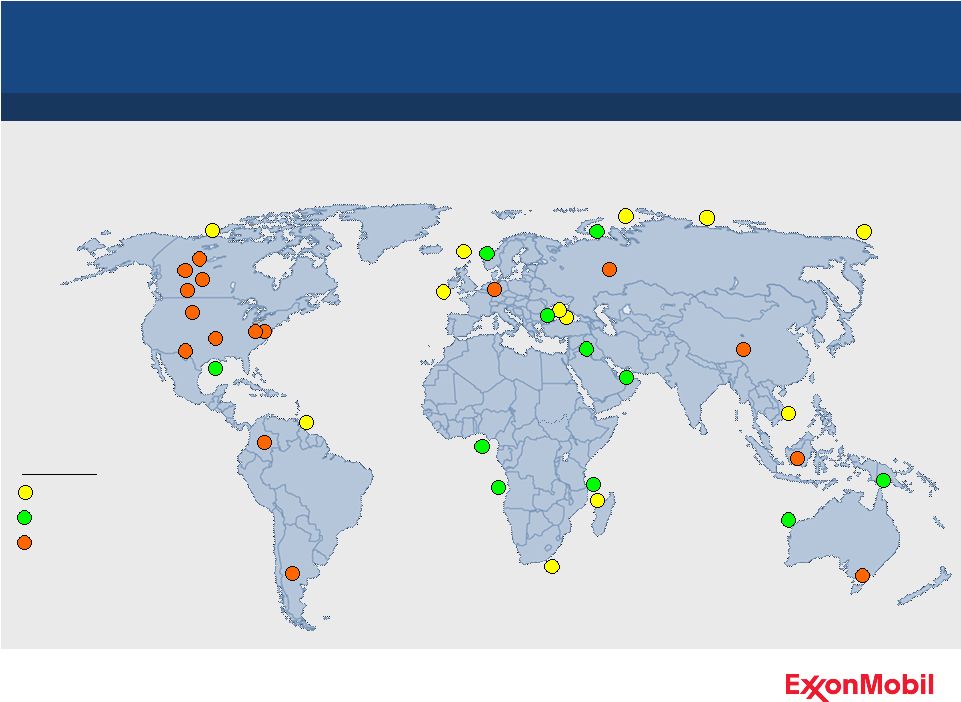 Vietnam
Indonesia
Norway
Abu Dhabi
Horn River
Alberta tight oil
Athabasca
Beaufort
Summit Creek
Romania
Iraq
Tanzania
Nigeria
PNG
Gulf of Mexico
Australia
Angola
Faroe Islands
Madagascar
Guyana
Ireland
Permian Basin
Woodford
Utica
Argentina
Colombia
New play tests
Unconventional
Play Type
Proven conventional plays
Marcellus
Germany
New Opportunity Growth
Kara Sea
West Siberia
Russian Black Sea
Bakken
China
Ukraine
Growth Opportunities
Growing global portfolio of high-quality resource opportunities
South Africa
Chukchi Sea
Laptev Sea
50 |
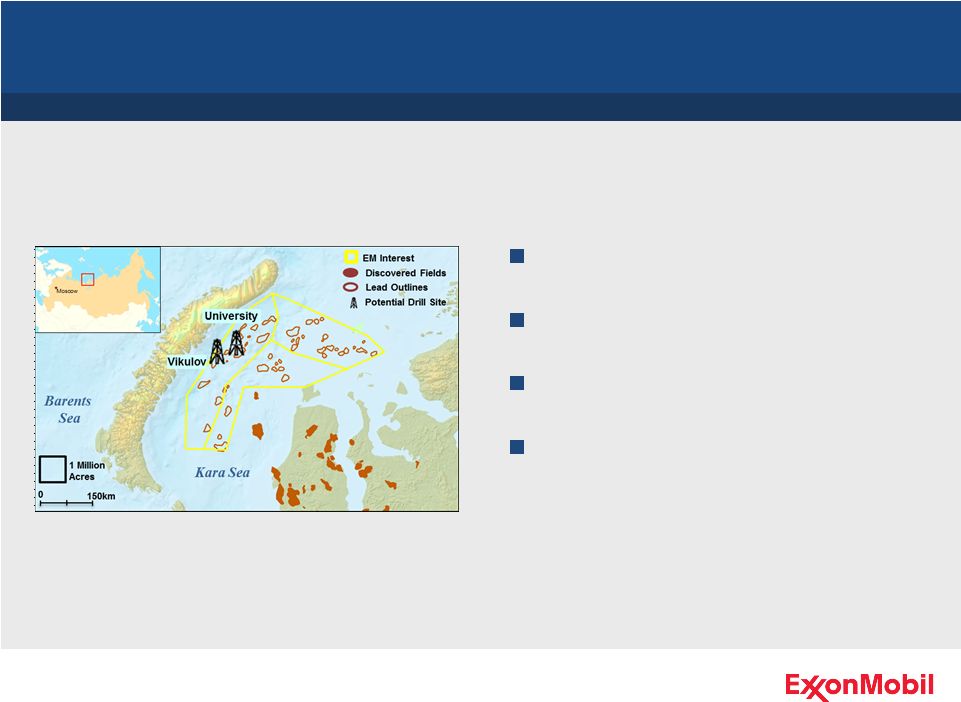 Kara Sea
Growth Opportunities
31 million acres in Kara Sea
Completed large field program
Completed definitive agreements
Expect to start drilling in 2014
Significant new exploration position in prospective Arctic
51 |
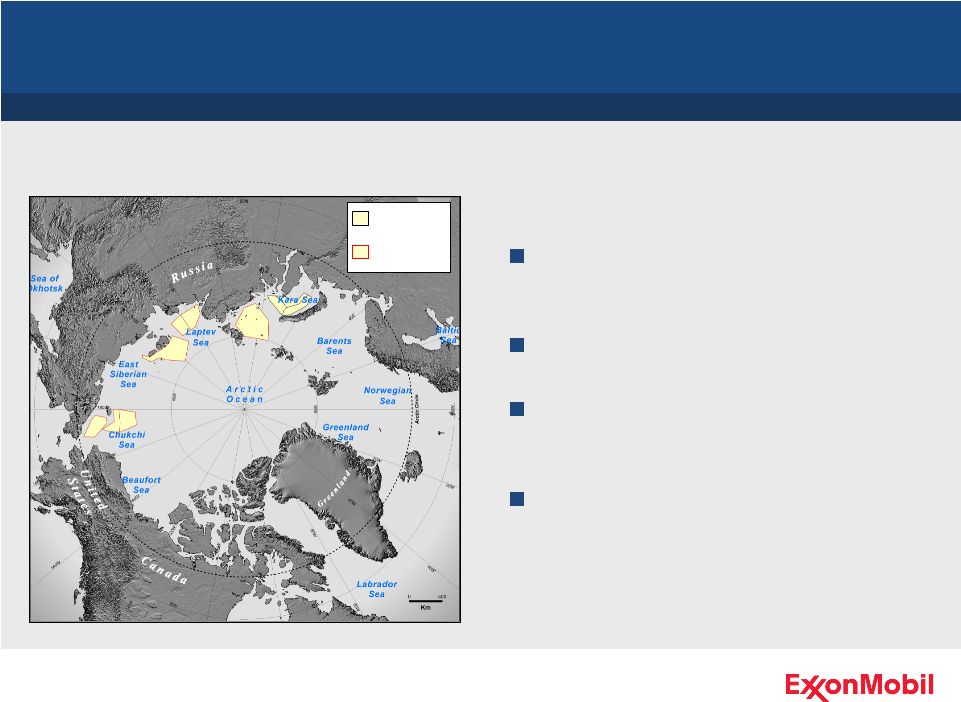 Russian Arctic
Growth Opportunities
Expanding strong partnership between ExxonMobil and Rosneft
SCA licenses
Expanded
SCA licenses
Expansion of Strategic Cooperation
Agreement
Additional 150 million acres
Blocks among most promising
offshore areas globally
Leverages strengths of ExxonMobil
and Rosneft
52 |
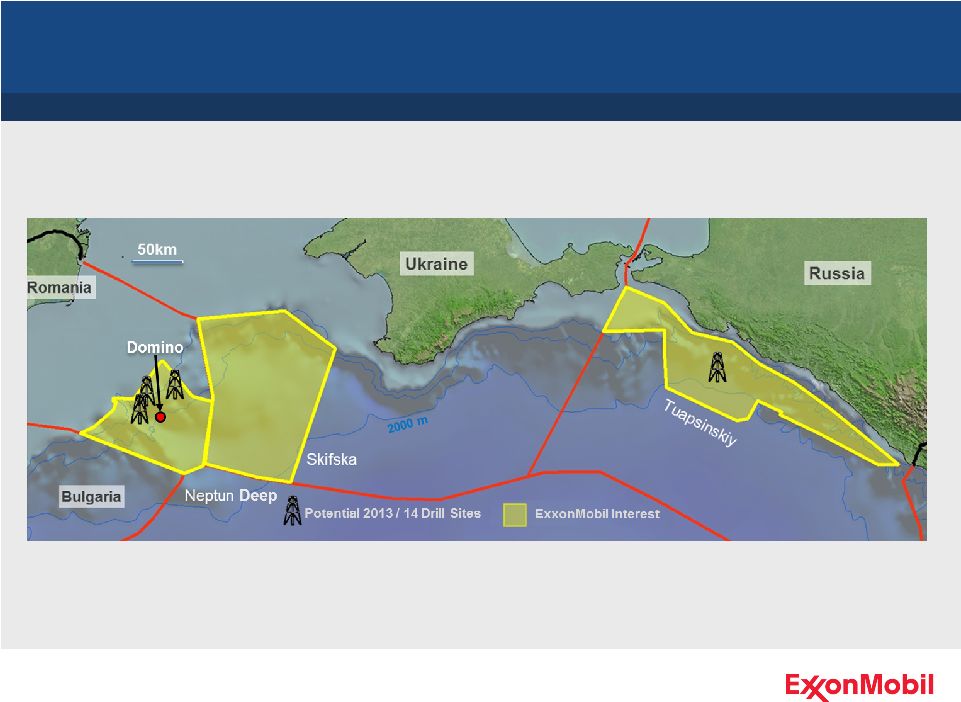 Black Sea
Growth Opportunities
Established strong position in emerging new hydrocarbon province
53 |
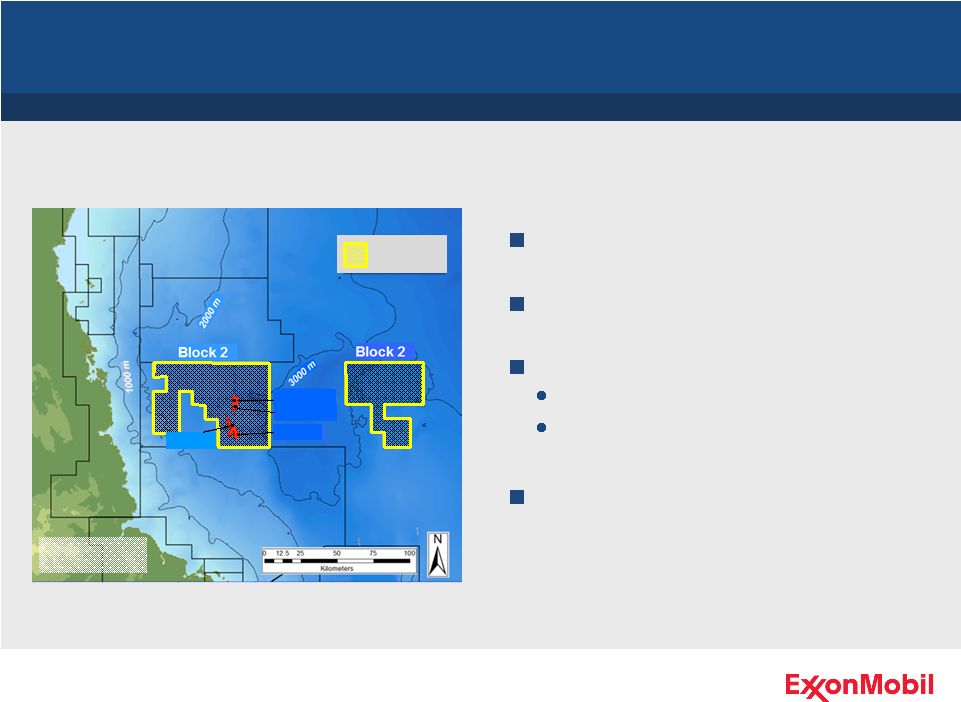     Zafarani-1
Lavani-1
Lavani-2
Zafarani-2
Tanzania
ExxonMobil
interest
Tanzania
Growth Opportunities
Drilled three successful wells in 2012
Appraising Zafarani and Lavani
Continuing exploration activities
Discovered fields in initial
development planning
Bringing industry-leading capability to a new frontier basin
54
Seismic acquisition
Prospect maturation and drilling |
 Upstream Summary
Successful track record of
developing best-in-class resources
and projects
Near-term project start-ups deliver
significant volume growth
Continuing to expand differentiating
capabilities
Strong portfolio of opportunities
Intense focus on profitability and
differentiation from competition
Upstream business is well positioned for sustained growth
55 |
 Senior Vice President
Mike Dolan
Downstream and Chemical
56 |
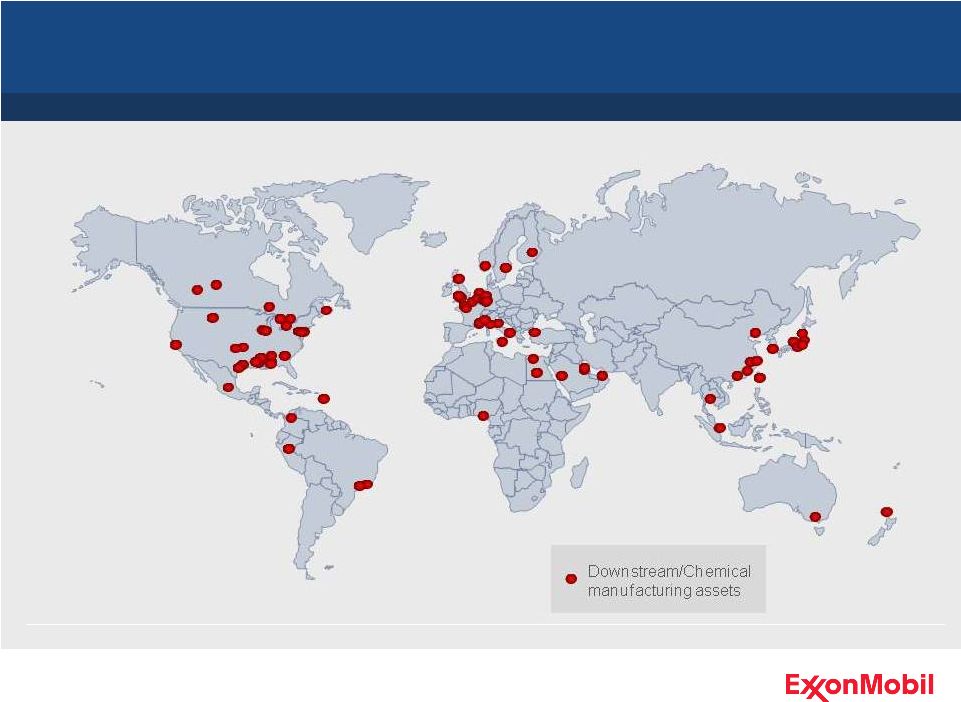 Premier Downstream and Chemical Businesses
57 |
 Premier Downstream and Chemical Businesses
58 |
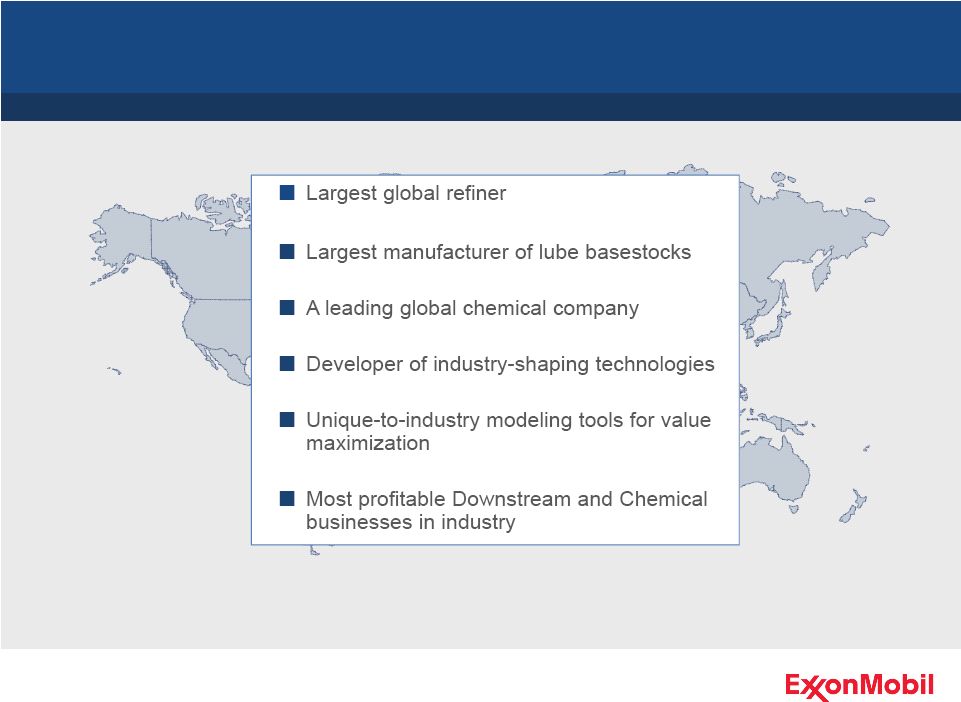
 Premier Downstream and Chemical Businesses
Operational excellence
Industry-leading portfolio
Superior financial performance
59
Best-in-class operations
Operating flexibility and optimization tools
Technology-enabled, high-value product growth
Balanced suite of pacesetter sites
Disciplined portfolio management and highgrading
Robust pipeline of quality investments
Best-in-class returns
Strong cash generation |
 Operational Excellence
Strong reliability
Advantaged cost position
Technology leadership
Operational metrics favorable versus competitors
60
Steam cracker utilizations 1 –
2%
above average
Refining unit costs 10% lower than
average
Aromatics unit energy consumption
20% lower than average |
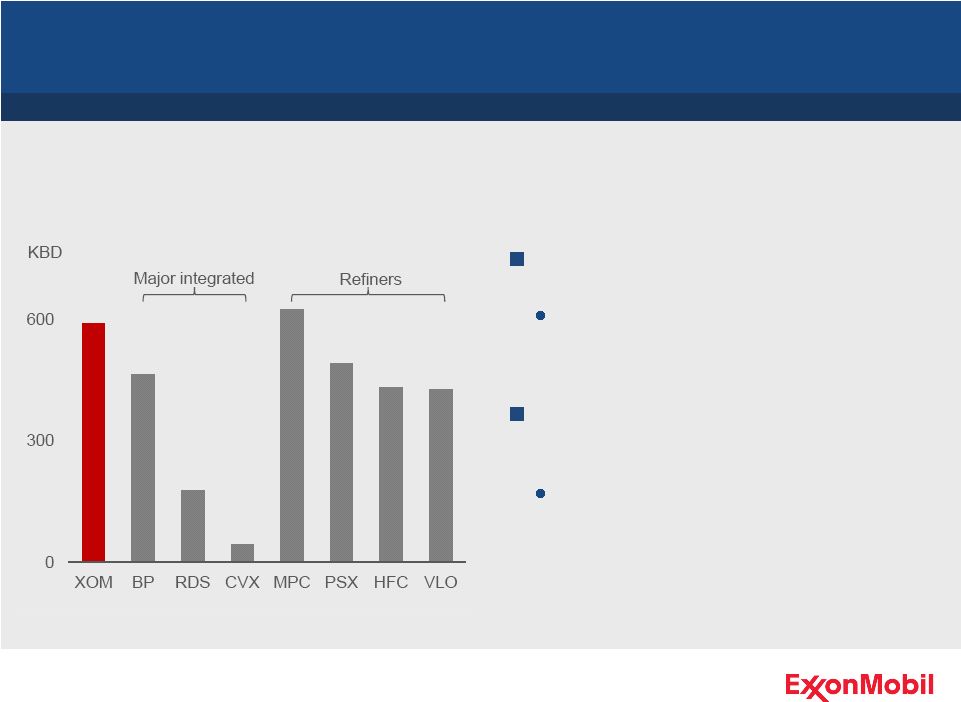 A
leader in mid-continent refining capacity
ExxonMobil mid-continent refineries
processing ~100% advantaged
crudes
North America Mid-Continent Advantage
Maximizing value via integrated and flexible refining circuit
Mid-Continent* Equity Refining Capacity
Source: PIRA data, 3Q12
* United States and Canada
61
Benefiting from North America
unconventional crude growth
Seven-fold earnings increase
since 2010 |
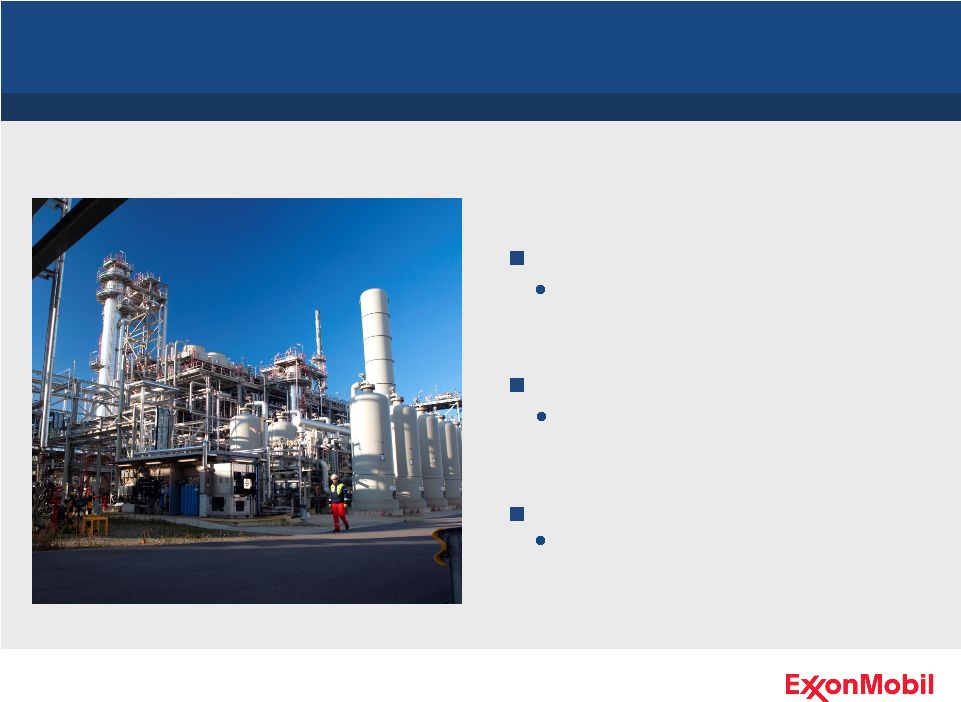
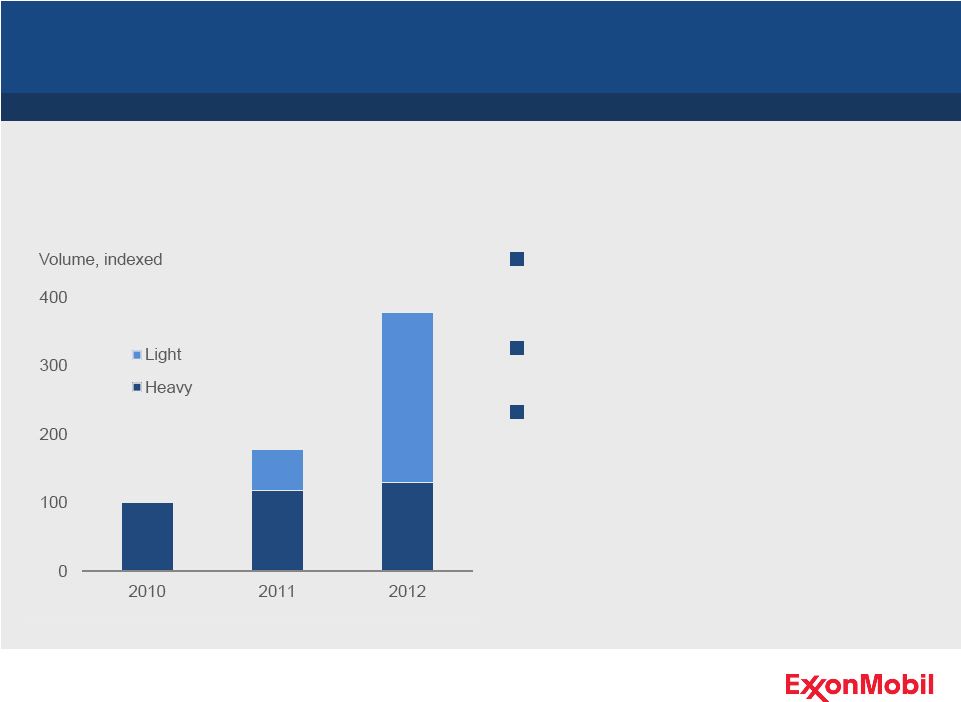 U.S. Gulf Coast Refining Optimization
Flexible integrated circuit capturing
heavy and light crude opportunities
Increasing advantaged crude runs
Well positioned to benefit from
industry logistics enhancements
Advantaged Crude Processing
Maximizing value via integrated and flexible refining circuit
62 |
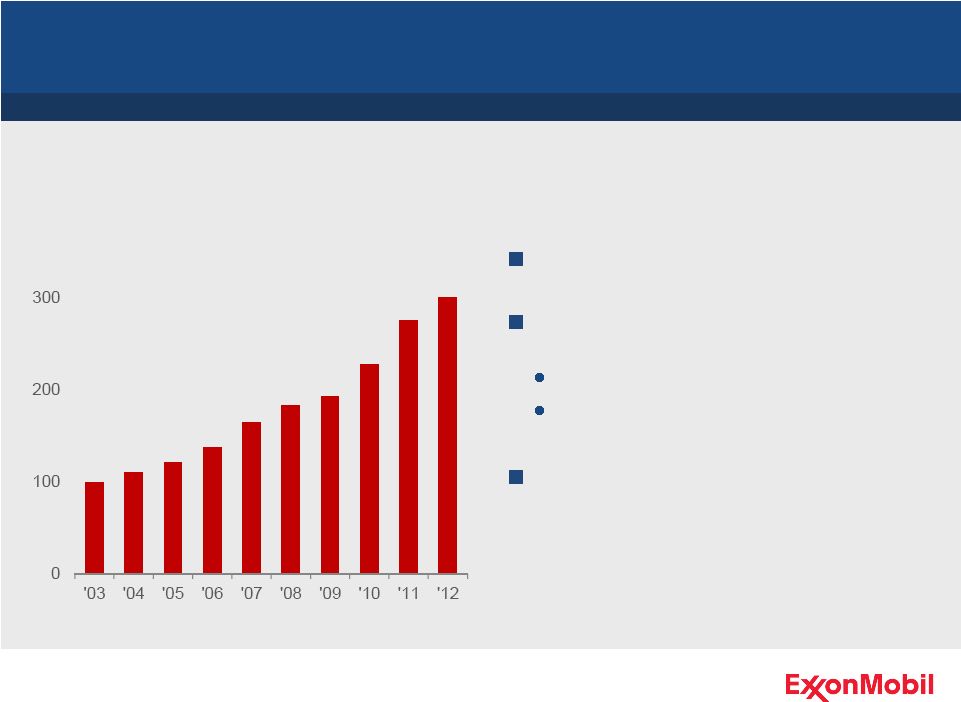
 Chemical Optimization –
Ethane
17-fold increase in earnings
contribution since 2007
Unmatched capacity to feed U.S.
ethane
Robust capability over wide range
of feed price environments
Feedstock flexibility capitalizes on changing price environment
ExxonMobil U.S. Ethane Earnings Contribution
Earnings, indexed
63
Proprietary technology
Integration |
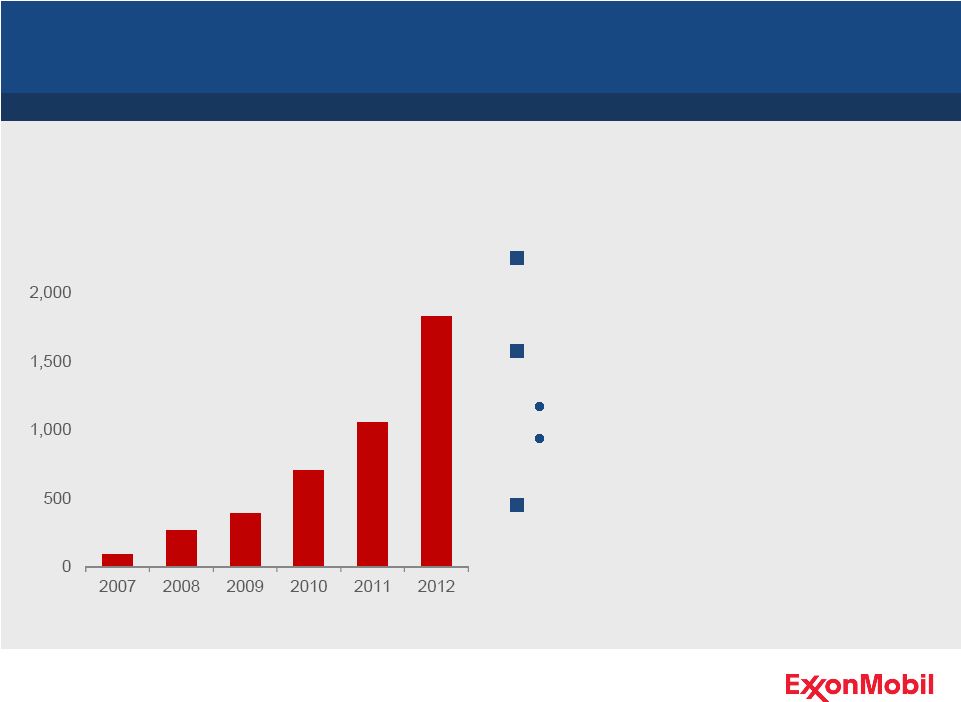
 Industry leader in basestocks and
synthetic lubricants
Pioneered synthetic lubricant
technology with premier Mobil 1
Doubled high-value synthetic lubes
sales in the last decade
High-Value Product Growth
Continual pursuit of high-value growth
Mobil 1 Sales
Volume, indexed
64
Faster than industry growth rate |
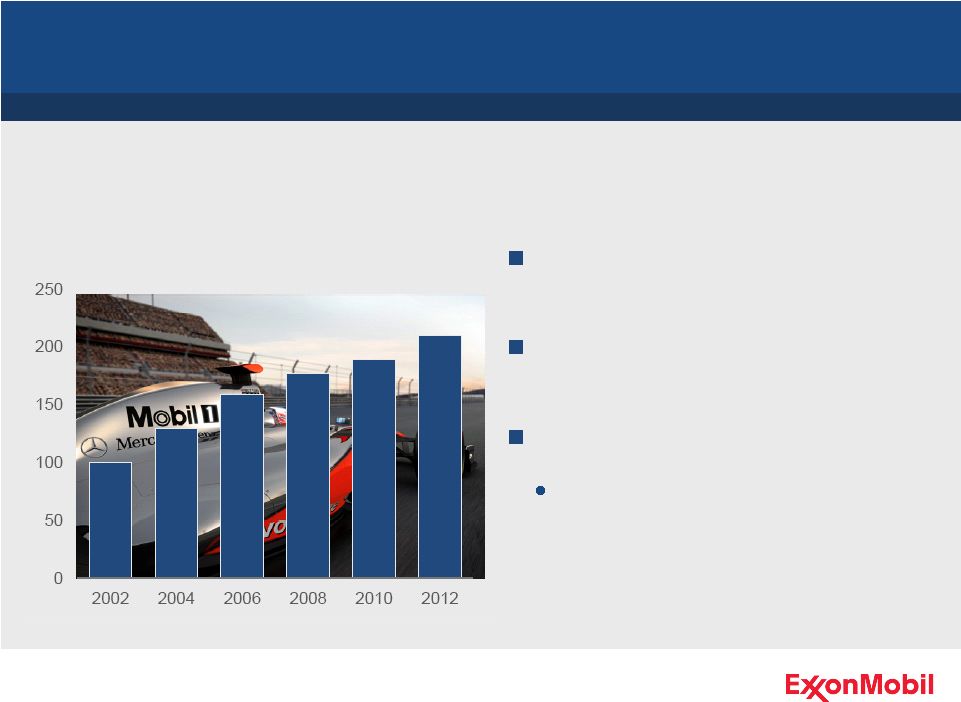
 Premium Chemical Products
Maximizing high-value specialties
Differentiating commodities
through technology
Tripled earnings over the last
decade
High-value product portfolio drives earnings
Premium Product Earnings
3-year moving average, indexed
65
Premium margins
Faster growth than industry |
 Poised to Capture Growth
66 |
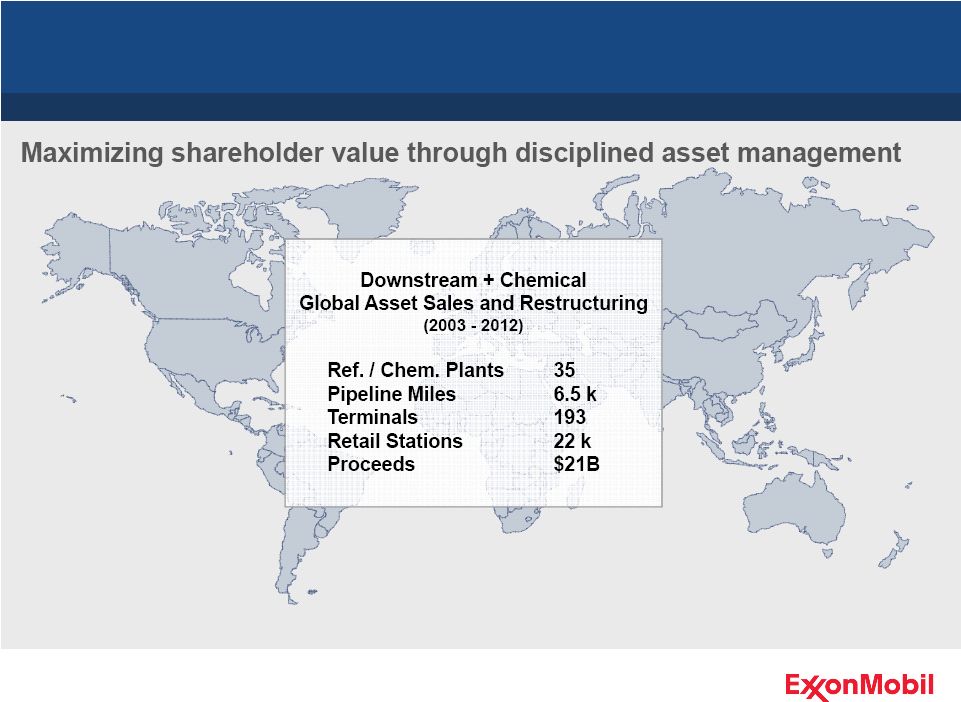 Strengthening the Portfolio
67 |
        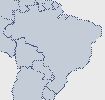     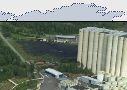          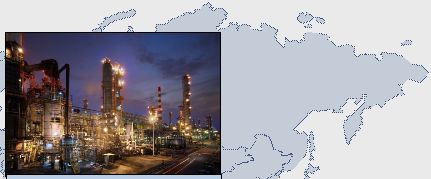    Investing for Growth
Finland Lube Blending
Downstream
Manufacturing
Singapore Hydrotreater
68 |
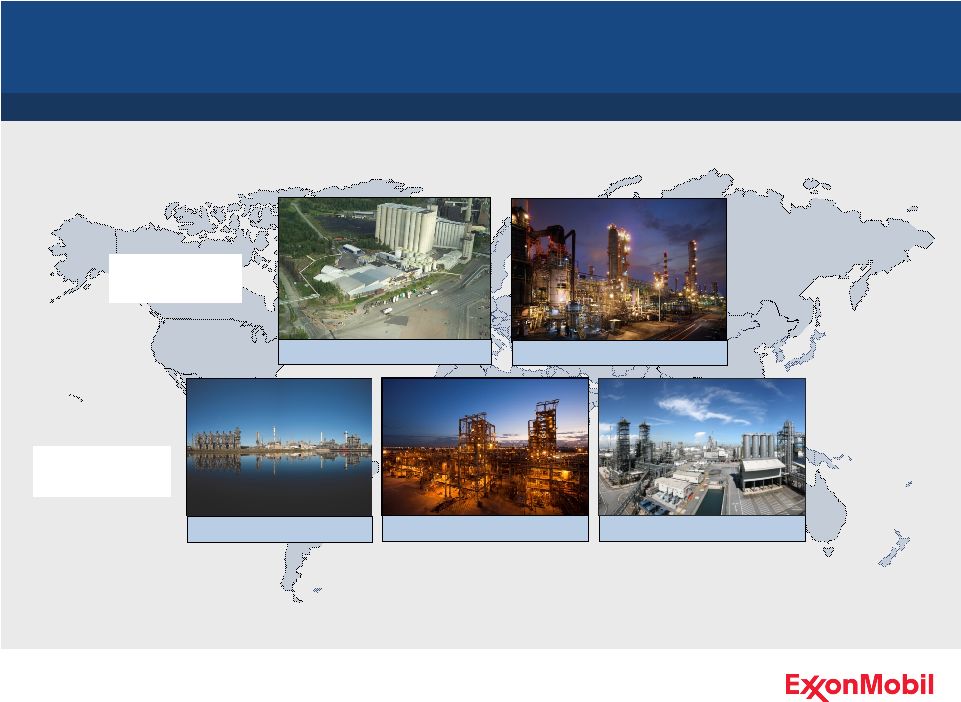                           Investing for Growth
Finland Lube Blending
Downstream
Manufacturing
Singapore Parallel Train
Saudi Elastomers
Baytown Cracker
Chemical
Manufacturing
Singapore Hydrotreater
69 |
 Industry-Leading Returns
Downstream and Chemical businesses outperform across the cycle
Industry-leading financial performance
Operational excellence
Capital discipline
Downstream and Chemical Combined ROCE
*
Competitor data estimated on a consistent basis with ExxonMobil and based on public
information.
Competitors include BP, RDS, and CVX.
Percent
70
Best-in-class operations
Flexibility, optimization
High-value product growth
World-class assets
Continual portfolio highgrading |
 Break
2013 Analyst Meeting
71 |
 Chairman and CEO
Rex Tillerson
Summary
72 |
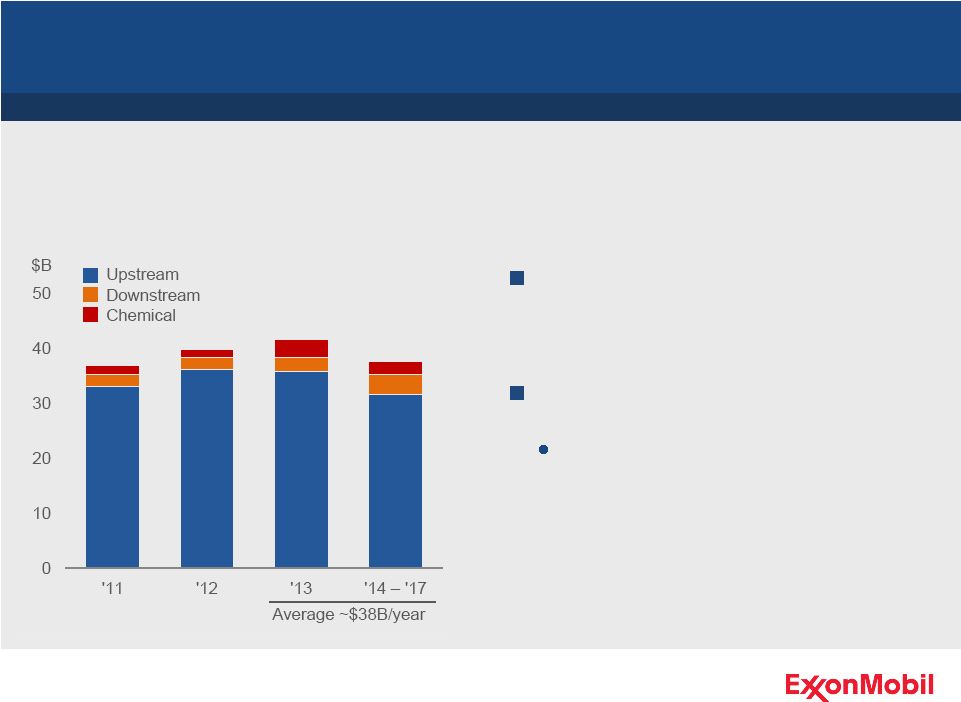 Investment Plan
Capex by Business Line
Expect to spend average of
about $38 billion per year from
2013 to 2017
Plan to invest approximately
$41 billion in 2013
Committed to investing through the business cycle
73
Includes $3.1 billion for
Celtic acquisition |
 ExxonMobil Strengths
Relentless focus on maximizing long-term shareholder value
Strong financial and operating performance
Balanced portfolio
Disciplined investing
High-impact technologies
Operational excellence
Global integration
74 |
 Key
Messages Risk management is fundamental to our business
Continued strong financial and operating results
Major project start-ups drive volume growth for 2013 –
2017
Portfolio of opportunities for long-term profitable growth
ExxonMobil strategy delivers superior returns over the long term
75 |
 Q&A
2013 Analyst Meeting
76 |