Exhibit 99.3
EX-99.3 FREQUENTLY USED TERMS AND ADDITIONAL INFORMATION
EXXON MOBIL CORPORATION • 2010 FINANCIAL & OPERATING REVIEW
Frequently Used Terms
These Frequently Used Terms are as presented consistent with ExxonMobil’s 2010 Financial and Operating Review.
Note: Page numbers referenced in this document refer to ExxonMobil’s 2010 Financial and Operating Review.
Listed below are definitions of several of ExxonMobil’s key business and financial performance measures and other terms. These definitions are provided to facilitate understanding of the terms and their calculation. In the case of financial measures that we believe constitute “non-GAAP financial measures” under Securities and Exchange Commission Regulation G, we provide a reconciliation to the most comparable Generally Accepted Accounting Principles (GAAP) measure and other information required by that rule.
EARNINGS EXCLUDING SPECIAL ITEMS
In addition to reporting U.S. GAAP defined net income, ExxonMobil also presents a measure of earnings that excludes earnings from special items quantified and described in our quarterly and annual earnings press releases. Earnings excluding special items is a non-GAAP financial measure, and is included to facilitate comparisons of base business performance across periods. A reconciliation to net income attributable to ExxonMobil is shown on page 16. We also refer to earnings excluding special items as normalized earnings. Earnings per share amounts use the same average common shares outstanding as used for the calculation of earnings per common share and earnings per common share – assuming dilution.
OPERATING COSTS
Operating costs are the combined total of production, manufacturing, selling, general, administrative, exploration, depreciation, and depletion expenses from the Consolidated Statement of Income and ExxonMobil’s share of similar costs for equity companies. Operating costs are the costs during the period to produce, manufacture, and otherwise prepare the company’s products for sale – including energy costs, staffing, maintenance, and other costs to explore for and produce oil and gas, and operate refining and chemical plants. Distribution and marketing expenses are also included. Operating costs exclude the cost of raw materials, taxes, and interest expense. These expenses are on a before-tax basis. While ExxonMobil’s management is responsible for all revenue and expense elements of net income, operating costs, as defined below, represent the expenses most directly under management’s control. Information regarding these costs is, therefore, useful for investors and ExxonMobil management in evaluating management’s performance.
| (millions of dollars) | 2010 | 2009 | 2008 | 2007 | 2006 | |||||||||||||||
| Reconciliation of Operating Costs | ||||||||||||||||||||
| From ExxonMobil’s Consolidated Statement of Income |
||||||||||||||||||||
| Total costs and other deductions |
330,262 | 275,809 | 393,962 | 333,073 | 309,182 | |||||||||||||||
| Less: |
||||||||||||||||||||
| Crude oil and product purchases |
197,959 | 152,806 | 249,454 | 199,498 | 182,546 | |||||||||||||||
| Interest expense |
259 | 548 | 673 | 400 | 654 | |||||||||||||||
| Sales-based taxes |
28,547 | 25,936 | 34,508 | 31,728 | 30,381 | |||||||||||||||
| Other taxes and duties |
36,118 | 34,819 | 41,719 | 40,953 | 39,203 | |||||||||||||||
| Subtotal |
67,379 | 61,700 | 67,608 | 60,494 | 56,398 | |||||||||||||||
| ExxonMobil’s share of equity-company expenses |
9,049 | 6,670 | 7,204 | 5,619 | 4,947 | |||||||||||||||
| Total operating costs |
76,428 | 68,370 | 74,812 | 66,113 | 61,345 | |||||||||||||||
| (millions of dollars) | 2010 | 2009 | 2008 | 2007 | 2006 | |||||||||||||||
| Components of Operating Costs |
||||||||||||||||||||
| From ExxonMobil’s Consolidated Statement of Income |
||||||||||||||||||||
| Production and manufacturing expenses |
35,792 | 33,027 | 37,905 | 31,885 | 29,528 | |||||||||||||||
| Selling, general, and administrative expenses |
14,683 | 14,735 | 15,873 | 14,890 | 14,273 | |||||||||||||||
| Depreciation and depletion |
14,760 | 11,917 | 12,379 | 12,250 | 11,416 | |||||||||||||||
| Exploration expenses, including dry holes |
2,144 | 2,021 | 1,451 | 1,469 | 1,181 | |||||||||||||||
| Subtotal |
67,379 | 61,700 | 67,608 | 60,494 | 56,398 | |||||||||||||||
| ExxonMobil’s share of equity-company expenses |
9,049 | 6,670 | 7,204 | 5,619 | 4,947 | |||||||||||||||
| Total operating costs |
76,428 | 68,370 | 74,812 | 66,113 | 61,345 | |||||||||||||||
TOTAL SHAREHOLDER RETURN
Shareholder return measures the change in value of an investment in stock over a specified period of time, assuming dividend reinvestment. We calculate shareholder return over a particular measurement period by: dividing (1) the sum of (a) the cumulative value of dividends received during the measurement period, assuming reinvestment, plus (b) the difference between the stock price at the end and at the beginning of the measurement period; by (2) the stock price at the beginning of the measurement period. For this purpose, we assume dividends are reinvested in stock at market prices at approximately the same time actual dividends are paid. Shareholder return is usually quoted on an annualized basis.
1
FREQUENTLY USED TERMS AND ADDITIONAL INFORMATION
EXXON MOBIL CORPORATION • 2010 FINANCIAL & OPERATING REVIEW
CAPITAL AND EXPLORATION EXPENDITURES (Capex)
Capital and exploration expenditures are the combined total of additions at cost to property, plant and equipment and exploration expenses on a before-tax basis from the Summary Statement of Income. ExxonMobil’s Capex includes its share of similar costs for equity companies. Capex excludes depreciation on the cost of exploration support equipment and facilities recorded to property, plant and equipment when acquired. While ExxonMobil’s management is responsible for all investments and elements of net income, particular focus is placed on managing the controllable aspects of this group of expenditures.
CAPITAL EMPLOYED
Capital employed is a measure of net investment. When viewed from the perspective of how the capital is used by the businesses, it includes ExxonMobil’s net share of property, plant and equipment and other assets less liabilities, excluding both short-term and long-term debt. When viewed from the perspective of the sources of capital employed in total for the Corporation, it includes ExxonMobil’s share of total debt and equity. Both of these views include ExxonMobil’s share of amounts applicable to equity companies, which the Corporation believes should be included to provide a more comprehensive measure of capital employed.
| (millions of dollars) | 2010 | 2009 | 2008 | 2007 | 2006 | |||||||||||||||
| Business Uses: Asset and Liability Perspective |
||||||||||||||||||||
| Total assets |
302,510 | 233,323 | 228,052 | 242,082 | 219,015 | |||||||||||||||
| Less liabilities and noncontrolling interests share of assets and liabilities |
||||||||||||||||||||
| Total current liabilities excluding notes and loans payable |
(59,846 | ) | (49,585 | ) | (46,700 | ) | (55,929 | ) | (47,115 | ) | ||||||||||
| Total long-term liabilities excluding long-term debt |
(74,971 | ) | (58,741 | ) | (54,404 | ) | (50,543 | ) | (45,905 | ) | ||||||||||
| Noncontrolling interests share of assets and liabilities |
(6,532 | ) | (5,642 | ) | (6,044 | ) | (5,332 | ) | (4,948 | ) | ||||||||||
| Add ExxonMobil share of debt-financed equity-company net assets |
4,875 | 5,043 | 4,798 | 3,386 | 2,808 | |||||||||||||||
| Total capital employed |
166,036 | 124,398 | 125,702 | 133,664 | 123,855 | |||||||||||||||
| Total Corporate Sources: Debt and Equity Perspective |
||||||||||||||||||||
| Notes and loans payable |
2,787 | 2,476 | 2,400 | 2,383 | 1,702 | |||||||||||||||
| Long-term debt |
12,227 | 7,129 | 7,025 | 7,183 | 6,645 | |||||||||||||||
| ExxonMobil share of equity |
146,839 | 110,569 | 112,965 | 121,762 | 113,844 | |||||||||||||||
| Less noncontrolling interests share of total debt |
(692 | ) | (819 | ) | (1,486 | ) | (1,050 | ) | (1,144 | ) | ||||||||||
| Add ExxonMobil share of equity-company debt |
4,875 | 5,043 | 4,798 | 3,386 | 2,808 | |||||||||||||||
| Total capital employed |
166,036 | 124,398 | 125,702 | 133,664 | 123,855 | |||||||||||||||
RETURN ON AVERAGE CAPITAL EMPLOYED (ROCE)
Return on average capital employed is a performance measure ratio. From the perspective of the business segments, ROCE is annual business segment earnings divided by average business segment capital employed (average of beginning- and end-of-year amounts). These segment earnings include ExxonMobil’s share of segment earnings of equity companies, consistent with our capital employed definition, and exclude the cost of financing. The Corporation’s total ROCE is net income attributable to ExxonMobil excluding the after-tax cost of financing, divided by total corporate average capital employed. The Corporation has consistently applied its ROCE definition for many years and views it as the best measure of historical capital productivity in our capital-intensive, long-term industry, both to evaluate management’s performance and to demonstrate to shareholders that capital has been used wisely over the long term. Additional measures, which are more cash flow-based, are used to make investment decisions.
| (millions of dollars) | 2010 | 2009 | 2008 | 2007 | 2006 | |||||||||||||||
| Return on Average Capital Employed |
||||||||||||||||||||
| Net income attributable to ExxonMobil |
30,460 | 19,280 | 45,220 | 40,610 | 39,500 | |||||||||||||||
| Financing costs (after tax) |
||||||||||||||||||||
| Gross third-party debt |
(803 | ) | (303 | ) | (343 | ) | (339 | ) | (264 | ) | ||||||||||
| ExxonMobil share of equity companies |
(333 | ) | (285 | ) | (325 | ) | (204 | ) | (156 | ) | ||||||||||
| All other financing costs – net |
35 | (483 | ) | 1,485 | 268 | 499 | ||||||||||||||
| Total financing costs |
(1,101 | ) | (1,071 | ) | 817 | (275 | ) | 79 | ||||||||||||
| Earnings excluding financing costs |
31,561 | 20,351 | 44,403 | 40,885 | 39,421 | |||||||||||||||
| Average capital employed |
145,217 | 125,050 | 129,683 | 128,760 | 122,573 | |||||||||||||||
| Return on average capital employed – corporate total |
21.7 | % | 16.3 | % | 34.2 | % | 31.8 | % | 32.2 | % | ||||||||||
2
FREQUENTLY USED TERMS AND ADDITIONAL INFORMATION
EXXON MOBIL CORPORATION • 2010 FINANCIAL & OPERATING REVIEW
ENTITLEMENT VOLUME EFFECTS
PRODUCTION SHARING CONTRACT NET INTEREST REDUCTIONS
Production Sharing Contract (PSC) net interest reductions are contractual reductions in ExxonMobil’s share of production volumes covered by PSCs. These reductions typically occur when cumulative investment returns or production volumes achieve thresholds as specified in the PSCs. Once a net interest reduction has occurred, it typically will not be reversed by subsequent events, such as lower crude oil prices.
PRICE AND SPEND IMPACTS ON VOLUMES
Price and spend impacts on volumes are fluctuations in ExxonMobil’s share of production volumes caused by changes in oil and gas prices or spending levels from one period to another. For example, at higher prices fewer barrels are required for ExxonMobil to recover its costs. According to the terms of contractual arrangements or government royalty regimes, price or spending variability can increase or decrease royalty burdens and/or volumes attributable to ExxonMobil. These effects generally vary from period to period with field spending patterns or market prices for crude oil or natural gas.
HEAVY OIL AND OIL SANDS
Heavy oil, for the purpose of this report, includes heavy oil, extra heavy oil, and bitumen, as defined by the World Petroleum Congress in 1987 based on American Petroleum Institute (API) gravity and viscosity at reservoir conditions. Heavy oil has an API gravity between 10 and 22.3 degrees. The API gravity of extra heavy oil and bitumen is less than 10 degrees. Extra heavy oil has a viscosity less than 10 thousand centipoise, whereas the viscosity of bitumen is greater than 10 thousand centipoise. The term “oil sands” is used to indicate heavy oil (generally bitumen) that is recovered in a mining operation.
EXPLORATION RESOURCE ADDITION COST
Exploration resource addition cost per oil-equivalent barrel is a performance measure that is calculated using the Exploration portion of Upstream capital and exploration expenditures divided by exploration resource additions (in oil-equivalent barrels). ExxonMobil refers to new discoveries, and the non-proved portion of discovered resources that were acquired, as exploration resource additions. Exploration resource additions include quantities of oil and gas that are not yet classified as proved reserves, but which ExxonMobil believes will likely be moved into the proved reserves category and produced in the future. The impact of the XTO Energy Inc. merger transaction is excluded from this calculation.
| 2010 | 2009 | 2008 | 2007 | 2006 | ||||||||||||||||
| Exploration portion of Upstream capital and exploration expenditures (millions of dollars) |
4,121 | 3,718 | 2,871 | 1,909 | 2,044 | |||||||||||||||
| Exploration resource additions (millions of oil-equivalent barrels) |
4,725 | 2,860 | 2,230 | 1,995 | 2,855 | |||||||||||||||
| Exploration resource addition cost per oil-equivalent barrel (dollars) |
0.87 | 1.30 | 1.29 | 0.96 | 0.72 | |||||||||||||||
PROVED RESERVES
Proved reserves in this publication for 2009 and later years are based on current SEC definitions, but for prior years, the referenced proved reserve volumes are determined on bases that differ from SEC definitions in effect at the time. Specifically, for years prior to 2009 included in our five-year average replacement ratio, reserves are determined using the SEC pricing basis but including oil sands and our pro-rata share of equity company reserves for all periods. Prior to 2009, oil sands and equity company reserves were not included in proved oil and gas reserves as defined by the SEC. In addition, prior to 2009, the SEC defined price as the market price on December 31; beginning in 2009, the SEC changed the definition to the average of the market prices on the first day of each calendar month during the year. For years prior to 2009 included in our 17 straight years of at least 100-percent replacement, reserves are determined using the price and cost assumptions we use in managing the business, not the historical prices used in SEC definitions. Reserves determined on ExxonMobil’s pricing basis also include oil sands and equity company reserves for all periods.
RESOURCES, RESOURCE BASE, AND RECOVERABLE RESOURCES
Resources, resource base, recoverable resources, recoverable oil, recoverable hydrocarbons, and similar terms used in this report are the total remaining estimated quantities of oil and gas that are expected to be ultimately recoverable. ExxonMobil refers to new discoveries and acquisitions of discovered resources as resource additions. The resource base includes quantities of oil and gas that are not yet classified as proved reserves, but which ExxonMobil believes will likely be moved into the proved reserves category and produced in the future. The term “resource base” is not intended to correspond to SEC definitions such as “probable” or “possible” reserves.
PROVED RESERVES REPLACEMENT RATIO
The reserves replacement ratio is calculated for a specified period utilizing the applicable proved oil-equivalent reserves additions divided by oil-equivalent production. See “Proved Reserves” above.
3
FREQUENTLY USED TERMS AND ADDITIONAL INFORMATION
EXXON MOBIL CORPORATION • 2010 FINANCIAL & OPERATING REVIEW
PROVED RESERVES REPLACEMENT COSTS
Proved reserves replacement costs per oil-equivalent barrel is a performance measure ratio. Proved reserves replacement costs per barrel are costs incurred in property acquisition and exploration, plus costs incurred in development activities, divided by proved oil-equivalent reserves additions, excluding sales. Unless otherwise specified, ExxonMobil reports these costs based on proved reserves using SEC historical prices and costs. See “Proved Reserves” on previous page.
| (millions of dollars) | 2010 | 2009 | 2008 | 2007 | 2006 | |||||||||||||||
| Costs incurred |
||||||||||||||||||||
| Property acquisition costs |
45,461 | 1,285 | 663 | 194 | 597 | |||||||||||||||
| Exploration costs |
3,055 | 3,111 | 2,272 | 1,762 | 1,685 | |||||||||||||||
| Development costs |
23,210 | 17,130 | 14,633 | 11,570 | 12,103 | |||||||||||||||
| Total costs incurred |
71,726 | 21,526 | 17,568 | 13,526 | 14,385 | |||||||||||||||
| (millions of barrels) | 2010 | 2009 | 2008 | 2007 | 2006 | |||||||||||||||
| Proved oil-equivalent reserves additions |
||||||||||||||||||||
| Revisions |
505 | 383 | 690 | 1,405 | 687 | |||||||||||||||
| Improved recovery |
5 | 15 | 7 | 36 | 29 | |||||||||||||||
| Extensions/discoveries |
516 | 1,091 | 1,423 | 248 | 679 | |||||||||||||||
| Purchases |
2,510 | 1 | — | 2 | 755 | |||||||||||||||
| Total oil-equivalent reserves additions |
3,536 | 1,490 | 2,120 | 1,691 | 2,150 | |||||||||||||||
| Proved reserves replacement costs (dollars per barrel) |
20.28 | 14.45 | 8.29 | 8.00 | 6.69 | |||||||||||||||
CASH FLOW FROM OPERATIONS AND ASSET SALES
Cash flow from operations and asset sales is the sum of the net cash provided by operating activities and proceeds from sales of subsidiaries, investments, and property, plant and equipment from the Summary Statement of Cash Flows. This cash flow is the total sources of cash from both operating the Corporation’s assets and from the divesting of assets. The Corporation employs a long-standing and regular disciplined review process to ensure that all assets are contributing to the Corporation’s strategic objectives. Assets are divested when they are no longer meeting these objectives or are worth considerably more to others. Because of the regular nature of this activity, we believe it is useful for investors to consider sales proceeds together with cash provided by operating activities when evaluating cash available for investment in the business and financing activities, including shareholder distributions.
| (millions of dollars) | 2010 | 2009 | 2008 | 2007 | 2006 | |||||||||||||||
| Net cash provided by operating activities |
48,413 | 28,438 | 59,725 | 52,002 | 49,286 | |||||||||||||||
| Sales of subsidiaries, investments and property, plant and equipment |
3,261 | 1,545 | 5,985 | 4,204 | 3,080 | |||||||||||||||
| Cash flow from operations and asset sales |
51,674 | 29,983 | 65,710 | 56,206 | 52,366 | |||||||||||||||
DISTRIBUTIONS TO SHAREHOLDERS
The Corporation distributes cash to shareholders in the form of both dividends and share purchases. Shares are purchased both to reduce shares outstanding and to offset shares issued in conjunction with company benefit plans and programs. For purposes of calculating distributions to shareholders, the Corporation only includes the cost of those shares purchased to reduce shares outstanding.
| (millions of dollars) | 2010 | 2009 | 2008 | 2007 | 2006 | |||||||||||||||
| Dividends paid to ExxonMobil shareholders |
8,498 | 8,023 | 8,058 | 7,621 | 7,628 | |||||||||||||||
| Cost of shares purchased to reduce shares outstanding |
11,200 | 18,000 | 32,000 | 28,000 | 25,000 | |||||||||||||||
| Distributions to ExxonMobil shareholders |
19,698 | 26,023 | 40,058 | 35,621 | 32,628 | |||||||||||||||
| Memo: Gross cost of shares purchased to offset shares issued under benefit plans and programs |
1,893 | 1,703 | 3,734 | 3,822 | 4,558 | |||||||||||||||
4
FREQUENTLY USED TERMS AND ADDITIONAL INFORMATION
EXXON MOBIL CORPORATION • 2010 FINANCIAL & OPERATING REVIEW
FUNCTIONAL EARNINGS (1)
| 2010 Quarters | ||||||||||||||||||||||||||||||||||||
| (millions of dollars) | First | Second | Third | Fourth | 2010 | 2009 | 2008 | 2007 | 2006 | |||||||||||||||||||||||||||
| Earnings (U.S. GAAP) |
||||||||||||||||||||||||||||||||||||
| Upstream | ||||||||||||||||||||||||||||||||||||
| United States |
1,091 | 865 | 999 | 1,317 | 4,272 | 2,893 | 6,243 | 4,870 | 5,168 | |||||||||||||||||||||||||||
| Non-U.S. |
4,723 | 4,471 | 4,468 | 6,163 | 19,825 | 14,214 | 29,159 | 21,627 | 21,062 | |||||||||||||||||||||||||||
| Total |
5,814 | 5,336 | 5,467 | 7,480 | 24,097 | 17,107 | 35,402 | 26,497 | 26,230 | |||||||||||||||||||||||||||
| Downstream |
||||||||||||||||||||||||||||||||||||
| United States |
(60 | ) | 440 | 164 | 226 | 770 | (153 | ) | 1,649 | 4,120 | 4,250 | |||||||||||||||||||||||||
| Non-U.S. |
97 | 780 | 996 | 924 | 2,797 | 1,934 | 6,502 | 5,453 | 4,204 | |||||||||||||||||||||||||||
| Total |
37 | 1,220 | 1,160 | 1,150 | 3,567 | 1,781 | 8,151 | 9,573 | 8,454 | |||||||||||||||||||||||||||
| Chemical |
||||||||||||||||||||||||||||||||||||
| United States |
539 | 685 | 676 | 522 | 2,422 | 769 | 724 | 1,181 | 1,360 | |||||||||||||||||||||||||||
| Non-U.S. |
710 | 683 | 553 | 545 | 2,491 | 1,540 | 2,233 | 3,382 | 3,022 | |||||||||||||||||||||||||||
| Total |
1,249 | 1,368 | 1,229 | 1,067 | 4,913 | 2,309 | 2,957 | 4,563 | 4,382 | |||||||||||||||||||||||||||
| Corporate and financing |
(800 | ) | (364 | ) | (506 | ) | (447 | ) | (2,117 | ) | (1,917 | ) | (1,290 | ) | (23 | ) | 434 | |||||||||||||||||||
| Net Income attributable to ExxonMobil |
6,300 | 7,560 | 7,350 | 9,250 | 30,460 | 19,280 | 45,220 | 40,610 | 39,500 | |||||||||||||||||||||||||||
| Earnings per common share(2) (dollars) |
1.33 | 1.61 | 1.44 | 1.86 | 6.24 | 3.99 | 8.70 | 7.31 | 6.64 | |||||||||||||||||||||||||||
| Earnings per common share – assuming dilution(2) (dollars) |
1.33 | 1.60 | 1.44 | 1.85 | 6.22 | 3.98 | 8.66 | 7.26 | 6.60 | |||||||||||||||||||||||||||
| Special Items |
||||||||||||||||||||||||||||||||||||
| Upstream |
||||||||||||||||||||||||||||||||||||
| United States |
— | — | — | — | — | — | — | — | — | |||||||||||||||||||||||||||
| Non-U.S. |
— | — | — | — | — | — | 1,620 | — | — | |||||||||||||||||||||||||||
| Total |
— | — | — | — | — | — | 1,620 | — | — | |||||||||||||||||||||||||||
| Downstream |
||||||||||||||||||||||||||||||||||||
| United States |
— | — | — | — | — | — | — | — | — | |||||||||||||||||||||||||||
| Non-U.S. |
— | — | — | — | — | — | — | — | — | |||||||||||||||||||||||||||
| Total |
— | — | — | — | — | — | — | — | — | |||||||||||||||||||||||||||
| Chemical |
||||||||||||||||||||||||||||||||||||
| United States |
— | — | — | — | — | — | — | — | — | |||||||||||||||||||||||||||
| Non-U.S. |
— | — | — | — | — | — | — | — | — | |||||||||||||||||||||||||||
| Total |
— | — | — | — | — | — | — | — | — | |||||||||||||||||||||||||||
| Corporate and financing |
— | — | — | — | — | (140 | ) | (460 | ) | — | 410 | |||||||||||||||||||||||||
| Corporate total |
— | — | — | — | — | (140 | ) | 1,160 | — | 410 | ||||||||||||||||||||||||||
| Earnings Excluding Special Items (3) |
||||||||||||||||||||||||||||||||||||
| Upstream |
||||||||||||||||||||||||||||||||||||
| United States |
1,091 | 865 | 999 | 1,317 | 4,272 | 2,893 | 6,243 | 4,870 | 5,168 | |||||||||||||||||||||||||||
| Non-U.S. |
4,723 | 4,471 | 4,468 | 6,163 | 19,825 | 14,214 | 27,539 | 21,627 | 21,062 | |||||||||||||||||||||||||||
| Total |
5,814 | 5,336 | 5,467 | 7,480 | 24,097 | 17,107 | 33,782 | 26,497 | 26,230 | |||||||||||||||||||||||||||
| Downstream |
||||||||||||||||||||||||||||||||||||
| United States |
(60 | ) | 440 | 164 | 226 | 770 | (153 | ) | 1,649 | 4,120 | 4,250 | |||||||||||||||||||||||||
| Non-U.S. |
97 | 780 | 996 | 924 | 2,797 | 1,934 | 6,502 | 5,453 | 4,204 | |||||||||||||||||||||||||||
| Total |
37 | 1,220 | 1,160 | 1,150 | 3,567 | 1,781 | 8,151 | 9,573 | 8,454 | |||||||||||||||||||||||||||
| Chemical |
||||||||||||||||||||||||||||||||||||
| United States |
539 | 685 | 676 | 522 | 2,422 | 769 | 724 | 1,181 | 1,360 | |||||||||||||||||||||||||||
| Non-U.S. |
710 | 683 | 553 | 545 | 2,491 | 1,540 | 2,233 | 3,382 | 3,022 | |||||||||||||||||||||||||||
| Total |
1,249 | 1,368 | 1,229 | 1,067 | 4,913 | 2,309 | 2,957 | 4,563 | 4,382 | |||||||||||||||||||||||||||
| Corporate and financing |
(800 | ) | (364 | ) | (506 | ) | (447 | ) | (2,117 | ) | (1,777 | ) | (830 | ) | (23 | ) | 24 | |||||||||||||||||||
| Corporate total |
6,300 | 7,560 | 7,350 | 9,250 | 30,460 | 19,420 | 44,060 | 40,610 | 39,090 | |||||||||||||||||||||||||||
| Earnings per common share(2) (dollars) |
1.33 | 1.61 | 1.44 | 1.86 | 6.24 | 4.02 | 8.48 | 7.31 | 6.57 | |||||||||||||||||||||||||||
| Earnings per common share –assuming dilution(2) (dollars) |
1.33 | 1.60 | 1.44 | 1.85 | 6.22 | 4.01 | 8.44 | 7.26 | 6.53 | |||||||||||||||||||||||||||
| (1) | Total corporate earnings means net income attributable to ExxonMobil (U.S. GAAP) from the consolidated income statement. Unless indicated, references to earnings, special items, Upstream, Downstream, Chemical, and Corporate and Financing segment earnings, and earnings per share are ExxonMobil’s share after excluding amounts attributable to noncontrolling interests. |
| (2) | Computed using the average number of shares outstanding during each period. The sum of the four quarters may not add to the full year. |
| (3) | See Frequently Used Terms on pages 98 through 101. |
5
FREQUENTLY USED TERMS AND ADDITIONAL INFORMATION
EXXON MOBIL CORPORATION • 2010 FINANCIAL & OPERATING REVIEW
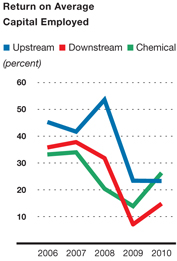
RETURN ON AVERAGE CAPITAL EMPLOYED (1) BY BUSINESS
| (percent) | 2010 | 2009 | 2008 | 2007 | 2006 | |||||||||||||||
| Upstream |
||||||||||||||||||||
| United States |
12.2 | 18.2 | 42.6 | 34.7 | 37.1 | |||||||||||||||
| Non-U.S. |
29.0 | 24.8 | 56.7 | 43.7 | 47.9 | |||||||||||||||
| Total |
23.3 | 23.4 | 53.6 | 41.7 | 45.3 | |||||||||||||||
| Downstream |
||||||||||||||||||||
| United States |
12.5 | (2.1 | ) | 23.7 | 65.1 | 65.8 | ||||||||||||||
| Non-U.S. |
15.6 | 10.9 | 34.8 | 28.7 | 24.5 | |||||||||||||||
| Total |
14.8 | 7.1 | 31.8 | 37.8 | 35.8 | |||||||||||||||
| Chemical |
||||||||||||||||||||
| United States |
53.0 | 17.6 | 16.0 | 24.9 | 27.7 | |||||||||||||||
| Non-U.S. |
17.6 | 12.6 | 22.4 | 39.0 | 36.5 | |||||||||||||||
| Total |
26.3 | 13.9 | 20.4 | 34.0 | 33.2 | |||||||||||||||
| Corporate and financing |
N.A. | N.A. | N.A. | N.A. | N.A. | |||||||||||||||
| Corporate total |
21.7 | 16.3 | 34.2 | 31.8 | 32.2 | |||||||||||||||
| (1) | Capital employed consists of ExxonMobil’s share of equity and consolidated debt, including ExxonMobil’s share of amounts applicable to equity companies. See Frequently Used Terms on pages 98 through 101. |
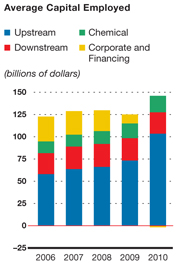
AVERAGE CAPITAL EMPLOYED (1) BY BUSINESS
| (millions of dollars) | 2010 | 2009 | 2008 | 2007 | 2006 | |||||||||||||||
| Upstream |
||||||||||||||||||||
| United States |
34,969 | 15,865 | 14,651 | 14,026 | 13,940 | |||||||||||||||
| Non-U.S. |
68,318 | 57,336 | 51,413 | 49,539 | 43,931 | |||||||||||||||
| Total |
103,287 | 73,201 | 66,064 | 63,565 | 57,871 | |||||||||||||||
| Downstream |
||||||||||||||||||||
| United States |
6,154 | 7,306 | 6,963 | 6,331 | 6,456 | |||||||||||||||
| Non-U.S. |
17,976 | 17,793 | 18,664 | 18,983 | 17,172 | |||||||||||||||
| Total |
24,130 | 25,099 | 25,627 | 25,314 | 23,628 | |||||||||||||||
| Chemical |
||||||||||||||||||||
| United States |
4,566 | 4,370 | 4,535 | 4,748 | 4,911 | |||||||||||||||
| Non-U.S. |
14,114 | 12,190 | 9,990 | 8,682 | 8,272 | |||||||||||||||
| Total |
18,680 | 16,560 | 14,525 | 13,430 | 13,183 | |||||||||||||||
| Corporate and financing |
(880 | ) | 10,190 | 23,467 | 26,451 | 27,891 | ||||||||||||||
| Corporate total |
145,217 | 125,050 | 129,683 | 128,760 | 122,573 | |||||||||||||||
| Average capital employed applicable to equity companies included above |
30,524 | 27,684 | 25,651 | 24,267 | 22,106 | |||||||||||||||
| (1) | Average capital employed is the average of beginning- and end-of-year business segment capital employed, including ExxonMobil’s share of amounts applicable to equity companies. See Frequently Used Terms on pages 98 through 101. |
6