 March 9, 2011
New York Stock Exchange
2011 Analyst Meeting
Exhibit 99.2 |
| March 9, 2011
New York Stock Exchange
2011 Analyst Meeting
Exhibit 99.2 |
 Cautionary Statement
2 |
 9
AM Welcome
David Rosenthal
Vice President, Investor Relations
Business Overview
Rex Tillerson
Chairman and CEO
Financial and Operating Results
Competitive Advantages
Global Exploration &
Mark Albers
Upstream Projects
Senior Vice President
Unconventional Portfolio
Andy Swiger
Senior Vice President
Summary
Rex Tillerson
Chairman and CEO
Break
Q&A
12 PM
Meeting Concludes
Agenda
Agenda
3 |
 Rex
Tillerson Chairman and CEO
Business Overview |
 5
Business Environment
Stabilizing global economy with modest growth in the U.S. and Europe
Stronger economic growth in developing world, especially Asia Pacific region
Increasing regulation and oversight; climate change policies uncertain
Some competitors re-evaluating business model and plans
Long-term forecasts for energy and petrochemical demand remain robust
ExxonMobil is well-positioned for the challenges and opportunities in the
global business environment. |
 6
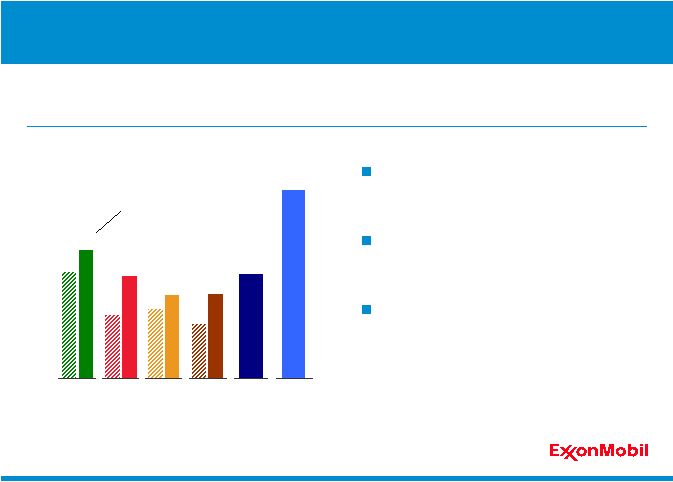
Energy Demand
Quadrillion BTUs
0
50
100
150
200
250
300
Oil
Gas
Coal
Other*
'05–'30
'30
Average Annual Growth
2005 --
2030
2.0%
0.7%
1.2%
1.8%
* Other includes nuclear, hydro, geothermal, biomass, wind, solar, and biofuels.
'30
'05
'30
'05
'30
'05
'30
'05
'30
'05
'30
'05
'30
'05
'30
'05
Total
Energy
Growth
Annual
Energy
Savings
0.7%
Global Energy Demand to 2030
Oil, gas, and coal continue to provide
about 80 percent of world energy
Strong growth in natural gas
•
Driven by power generation
Energy savings in 2030 about twice
the growth in projected energy use
Energy
demand
is
expected
to
grow
about
35
percent
by
2030
–
led
by
economic
progress
in
developing
nations
–
even
with
large
efficiency
gains. |
 7
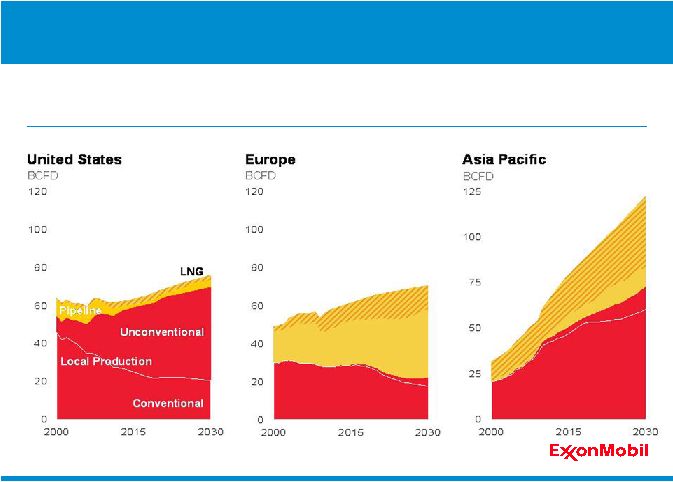
Regional Gas Supply and Demand
Strong
growth
in
global
gas
demand
led
by
Asia
Pacific,
met
with
expanding
supplies of LNG and unconventional gas. |
 8
0
10
20
30
40
50
60
'05
'10
'15
'20
'25
'30
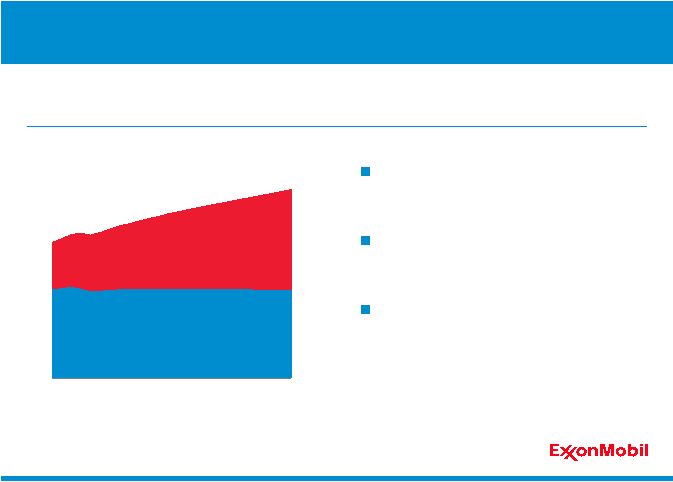
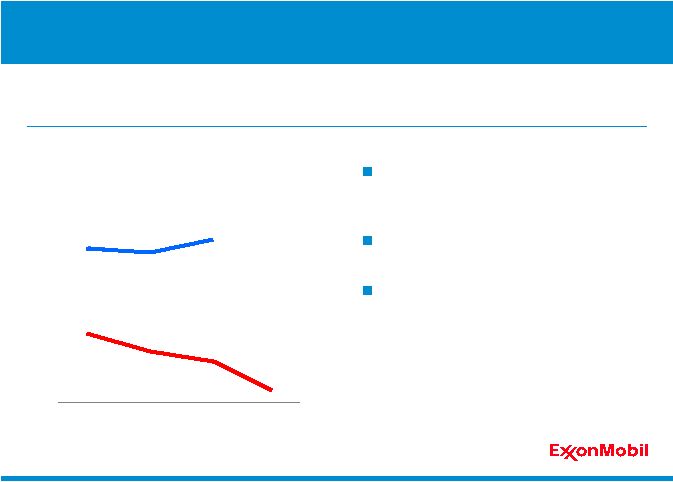
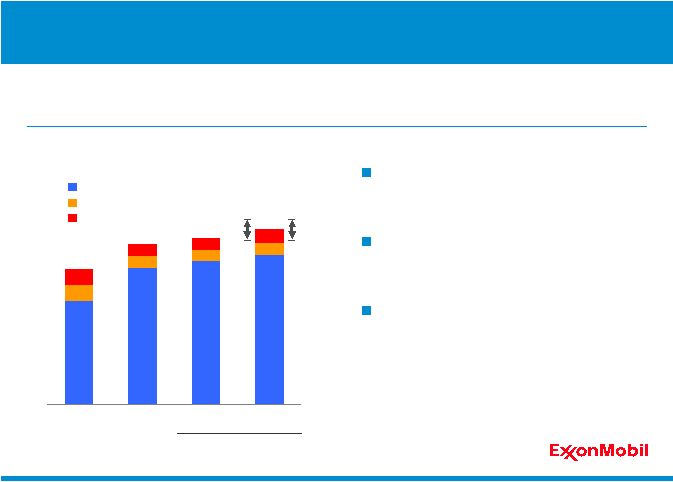
Transportation Energy Demand
MOEBD
OECD*
Non-OECD
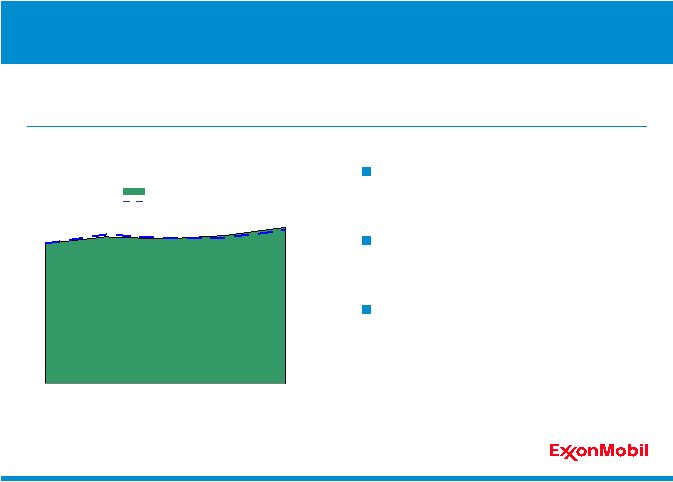
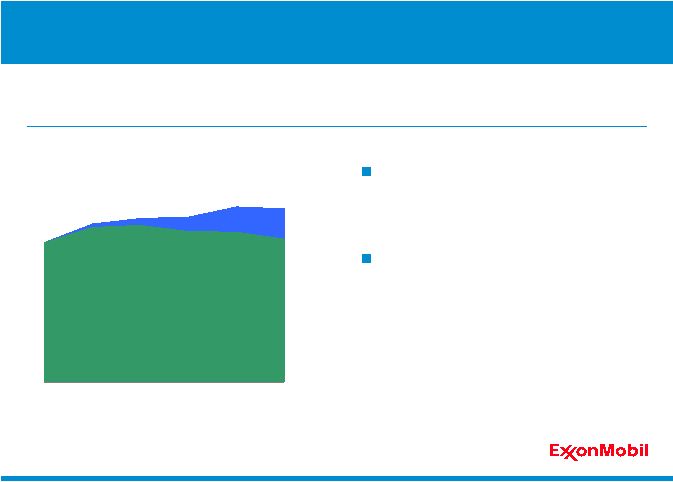
Global Downstream Demand
Long-term transportation energy demand likely to increase almost 40 percent
between 2005 and 2030.
Long-term growth driven by doubling
of demand in developing countries
New capacity impacting supply /
demand balances
Significant regulatory pressures
continue
* OECD –
Organization for Economic Co-operation and Development.
|
 9
-3
0
3
6
9
12
'95
'00
'05
'10
'15
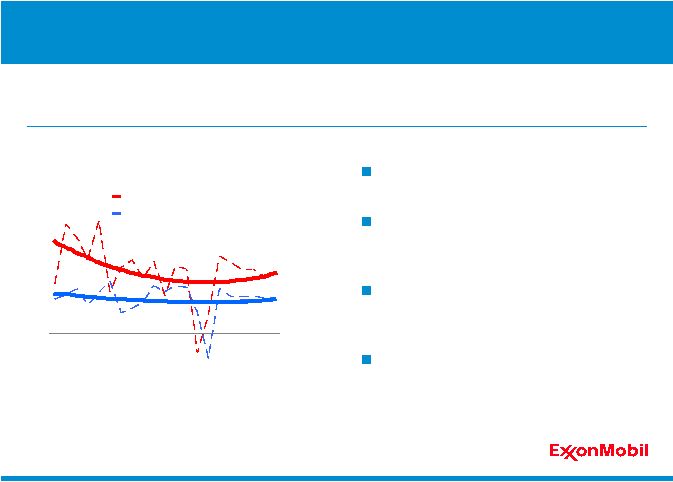
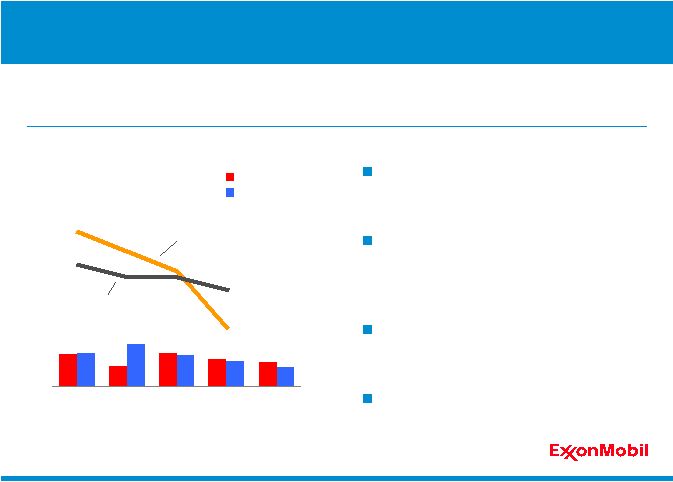
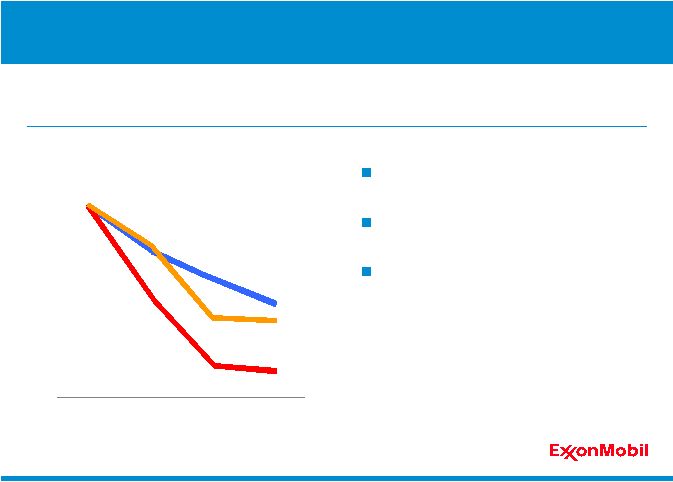
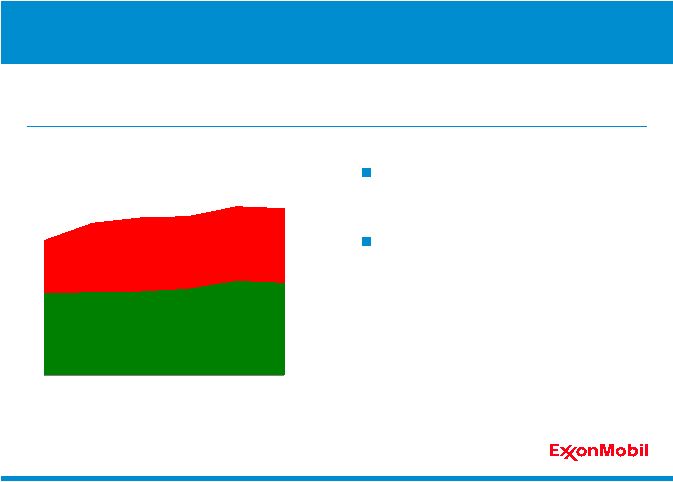
Commodities Demand and Global GDP*
Year-on-Year Percent Change
* ExxonMobil estimates; Chemical commodity demand includes
Polyethylene, Polypropylene, and Paraxylene.
Chemical Commodity Demand
Global GDP
Global Chemical Demand
Global demand growth above GDP
Penetration into new markets and
material substitution
Asia Pacific 60 percent of future
growth
Higher growth potential in specialties
Global demand for commodity chemicals poised to resume growth.
|
 10
The Energy Challenge
The scale of the challenge is enormous –
and growing
Requires an integrated set of solutions and pursuit of all economic options
Demands a commitment to innovation and technology
Calls for unprecedented levels of investment
Requires sound, stable government policies
Involves effective risk management and a relentless focus on operational
excellence
The energy industry must meet the world’s growing energy needs safely while
minimizing the impact on the environment. |
 11
Industry Risks
The energy industry faces multiple uncertainties and risks. Well-developed
processes, procedures, and people are required to manage risks.
Risk
Management
Financial &
Economic
Geopolitical
Technical
Climate
Change
Safety &
Security
Health &
Environment |
 12
Risk Management Approach
ExxonMobil has established common worldwide expectations for
addressing risks inherent in our business.
Capable, committed workforce with clear accountability
Well-developed and clearly-defined policies and procedures
High standards of design to reduce or eliminate risk
Employee and contractor training
Systematic approach to performance metrics and continuous improvement
Rigorously applied management systems |
 13
ExxonMobil employs multiple frameworks to lower risk profiles across the
business, forming the foundation for strong financial and operating results.
Multiple Risks –
Multiple Frameworks
Operations Integrity Management System (OIMS)
Facility Integrity Management Systems
Controls Integrity Management System (CIMS)
ExxonMobil Capital Project Management System (EMCAPS)
Operated-by-Others Management System |
 Rex Tillerson
Chairman and CEO
Financial and Operating Results |
 15
2010 Financial and Operating Results
Industry-Leading Safety Performance
Superior Financial and Operating Results
Unmatched Shareholder Distributions
Disciplined Investments Focused on Long-Term Value
ExxonMobil delivered strong results across all key measures and all
business lines. |
 16
0.0
0.1
0.2
0.3
'06
'07
'08
'09
'10**
Lost Time Incident Rate
U.S. petroleum industry
contractor benchmark*
U.S. petroleum industry
employee benchmark*
Employee
Contractor
Incidents per 200K hours
* 2010 industry data not available.
** Excludes XTO Energy Inc. data.
Safety
Safety performance
continues to lead the industry
Achieved best-ever lost time incident
rates for combined employee and
contractor workforce
Effective risk management and focus
on operational excellence
Committed to maintaining and
improving strong performance
ExxonMobil’s
vision
of
Nobody
Gets
Hurt
is
internalized
in
the
Company’s
culture,
positively
influencing
the
behavior
of
each
employee
and
contractor.
Industry-Leading Safety Performance |
 17
0
2
4
6
8
'06
'07
'08
'09
'10*
Hydrocarbon Flaring from
Upstream Oil and Gas Production
Million Metric Tons
* Excludes XTO Energy Inc. data.
Strong environmental management
Improving energy efficiency
Reducing flaring, spills, and releases
Protect Tomorrow. Today.
Environmental Performance
ExxonMobil
is
committed
to
reducing
the
impact
on
the
environment
while
expanding
energy
supplies
needed
to
fuel
economic
growth.
Industry-Leading Safety Performance |
 18
0
10
20
30
40
50
'06
'07
'08
'09
'10
Earnings Excluding Special Items
$B
Upstream
Downstream
Chemical
Earnings
Upstream
Downstream
Chemical
Earnings
Earnings
57 percent increase over 2009
Industry-leading results
Record earnings for Chemical
business
Maximizing value of asset base
ExxonMobil earned $30.5 billion in 2010 supported by project start-ups and
strong operational performance across all business lines.
Superior Financial and Operating Results |
 19
0
5
10
15
20
XOM
CVX
RDS
BP
Earnings per Barrel*
$ per OEB
2010
'06 -‘10, average
* Competitor data estimated on a consistent basis with ExxonMobil and based on
public information. Profitability ahead of competition
over 5-year period
Benefit of disciplined approach to
cost management
Result of relentless focus on
maximizing value of each asset
Upstream Earnings per Barrel
High-quality Upstream portfolio continues to deliver strong earnings per
barrel.
Superior Financial and Operating Results |
 20
-5
0
5
10
15
XOM
RDS
CVX
2010 Volume Growth
Percent
XTO
BP
Upstream Volumes Growth
Largest independent producer of oil
and gas: 4.45 MOEBD
Most significant annual increase
among competitor group
•
Peer average increase: one percent
Supported by effective risk
management and operational
excellence
Ongoing successful integration of XTO
Upstream volumes grew 13 percent in 2010 driven by project start-ups, the
addition of XTO, and strong operational performance.
Superior Financial and Operating Results |
 21
0
6
12
18
0%
50%
100%
150%
200%
Proved Reserves Replacement
Percent
* vs. Costs**
(‘05 –
‘09 average)
CVX
RDS
BP
XOM
$ per OEB
*
Reserves
replacement
based
on
SEC
pricing
bases,
excluding
asset
sales.
**
Costs incurred in property acquisition & exploration plus development
activities, divided by proved oil-equivalent reserves additions,
including purchases. Competitor data estimated on a consistent basis with ExxonMobil and
based on public information.
ExxonMobil
consistently
replaces
more
reserves
than
it
produces,
at
a
lower
unit cost than competitors.
Reserves Replacement
Replaced 211 percent of reserves
produced in 2010
Additions exceeded production for
the
17
th
consecutive
year
Proved reserves increased by 8
percent from 2009 to 24.8 BOEB
Superior Financial and Operating Results |
 22
Return on Average Capital Employed*
Percent
-5
0
5
10
15
20
25
30
XOM
CVX
RDS
BP
2010
'06 -‘10, average
Return on Capital Employed
ROCE of 22 percent in 2010
Consistent execution of
business model
Strength of integrated portfolio
Disciplined investment through
the business cycle
* Competitor data estimated on a consistent basis with ExxonMobil and based on
public information. ROCE continues to lead industry.
Superior Financial and Operating Results |
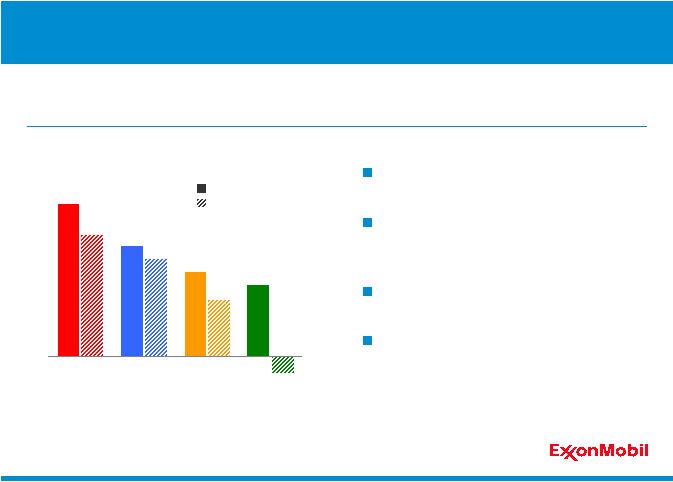
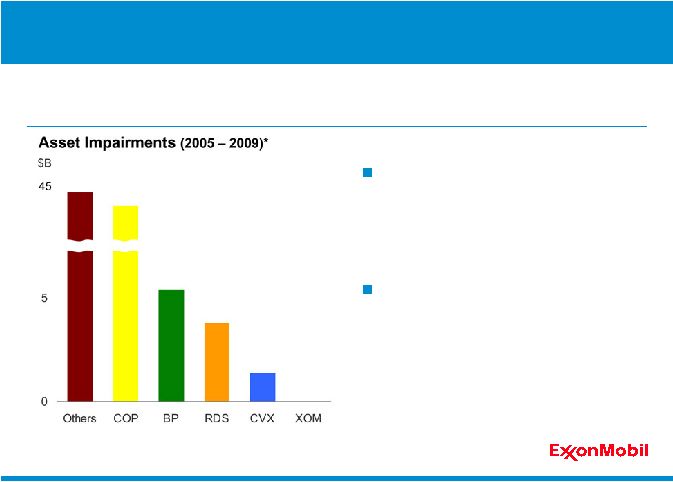 23
Asset Impairments
Industry
•
Asset impairments totaled $96B
from 2005 -
2009
•
Erosion of shareholder value
•
Distortion of returns
ExxonMobil
•
No material impairments
•
Supported by disciplined
investment decision processes
•
Demonstrates strength and
quality of portfolio
•
Highlights ability to generate
value from each dollar invested
ExxonMobil’s industry-leading returns are supported by superior
investment discipline and the efficient use of capital.
Superior Financial and Operating Results
*
Represents
publicly
reported
asset
impairments
on
a
before
tax
basis. |
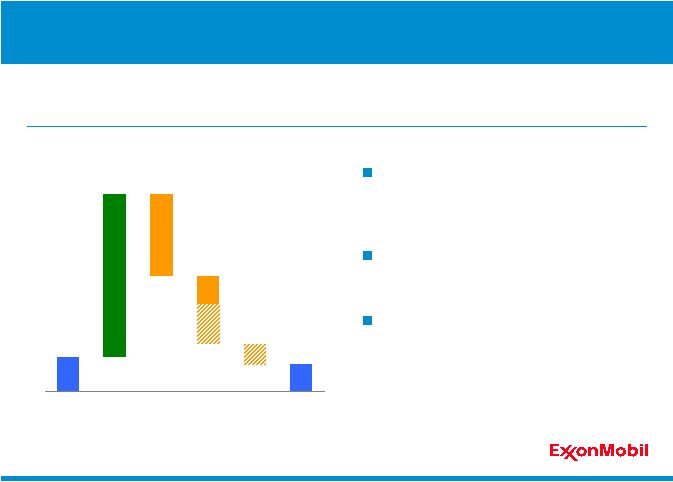 24
0
20
40
60
2010 Cash Flow
$B
Share Purchases
Dividends
11
52
27
21
7
8
YE’09
Cash
Cash
Flow*
Adds
to
PP&E**
Share-
holder
Distributions
Financing/
Other
YE’10
Cash
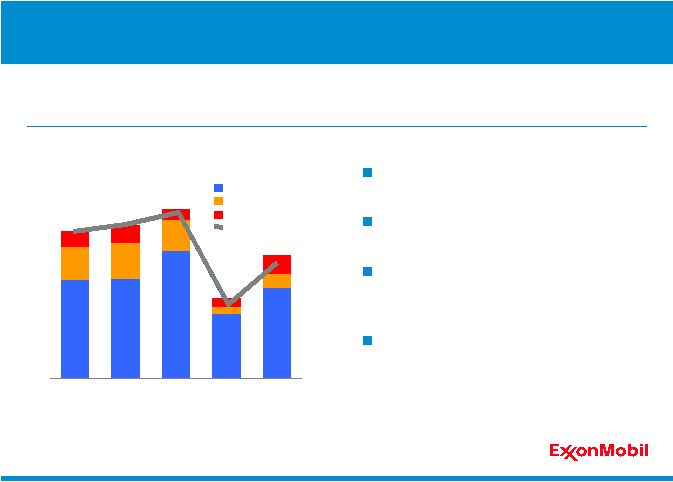
2010 Cash Flow
Cash flow up over 70 percent from
2009; year-end cash balance of over
$8B
Funded all attractive investment
opportunities and growing dividend
Cash flow of $16B available after
investments and dividends
•
Returned cash to shareholders
with flexible share purchases
•
Reduced debt by more than 25
percent since XTO merger
Superior cash generation provides ability to fund profitable projects, return
cash to shareholders, and maintain financial flexibility.
Superior Financial and Operating Results
* Represents cash flow from operations and asset sales of $51.7 billion, including
$3.3 billion from asset sales. ** PP&E –
Property, Plant, and Equipment. |
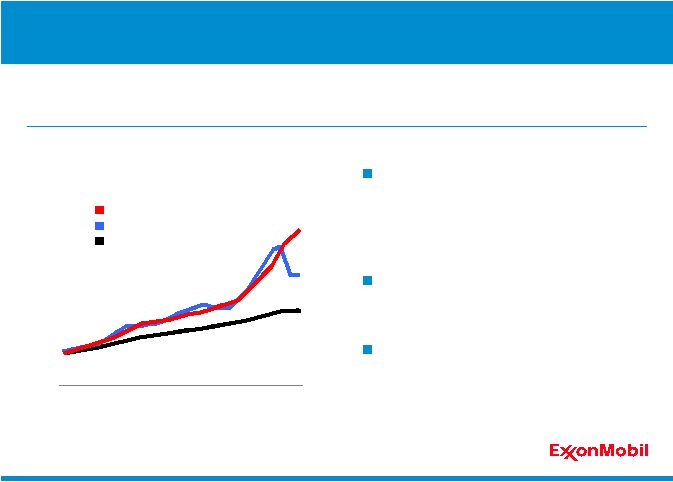 25
Dividend Growth since 1983*
0.00
0.50
1.00
1.50
2.00
'83
$ per share
XOM
S&P 500
CPI**
‘10
‘00
‘90
Dividends
Almost $40B distributed to
shareholders over past five years
•
Per-share dividends increased 53
percent
Dividend has grown every year since
1983
Annualized growth rate of 5.7
percent
•
Almost twice inflation
* S&P and CPI indexed to 1983 Exxon dividend.
Unmatched Shareholder Distributions
ExxonMobil delivers reliable and growing dividends. In 2010, $8.5 billion was
distributed to shareholders.
** CPI based on historical yearly average from Bureau of Labor Statistics.
|
 26
Cumulative Purchases to
Reduce Shares Outstanding
0
40
80
120
'06
'07
'08
'09
'10
$B
XOM
Competitors*
Share Purchases
$114B distributed over the last five
years
•
More than twice competitor total
Average annual yield of 5.6 percent
since beginning of 2006
In 2010, ExxonMobil distributed $11.2 billion to shareholders through share
purchases.
* Combined total for RDS, BP, and CVX.
Unmatched Shareholder Distributions |
 27
Average Annual Distribution Yield*
Dividends & Share Repurchases
0
2
4
6
8
ExxonMobil
Competitors
Percent
XOM
Competitors**
Annual Distribution Yield
Average total distribution yield of 7.6
percent since beginning of 2006
•
Competitors averaged 6 percent
over same period
Consistent, strong payout over time
ExxonMobil shareholder distributions are unmatched in the industry.
* Yield based on previous year-end market capitalization (2006-2010).
** RDS, BP, and CVX.
Unmatched Shareholder Distributions |
 28
0
7
14
21
28
35
'06
'07
'08
'09
'10
Capex by Business Line
$B
Upstream
Downstream
Chemical
Capex
Continued selective investments to enhance long-term value of the asset
base.
Invested over $126B
during the past five years
Completed three major Upstream
projects with 2011 forecasted
production of 120 KOEBD
•
RasGas Train 7
•
Golden Pass Terminal
•
Sakhalin-1 Odoptu
Maintained capital efficiency and
discipline
Disciplined Investments Focused on Long-Term Value |
 29
Cumulative Cash Flow from Asset Sales
since Exxon and Mobil Merger
$B
0
10
20
30
40
'00
'05
'10
Portfolio Management
Active asset management across the business cycle to capture
shareholder value.
Ongoing portfolio management
fundamental to business model
•
Cumulative cash flow from asset
sales of almost $40B
•
Cumulative earnings impact of
approximately $11B
Targeted divestments across all
business lines
Retained assets which hold long-
term shareholder value
Disciplined Investments Focused on Long-Term Value |
 30
2010 Financial and Operating Results
Industry-Leading Safety Performance
Superior Financial and Operating Results
Unmatched Shareholder Distributions
Disciplined Investments Focused on Long-Term Value
ExxonMobil delivered strong results across all key measures and all
business lines. |
 Rex Tillerson
Chairman and CEO
Competitive Advantages |
 32
Competitive Advantages
Balanced Portfolio Quality
Disciplined Investing
High-Impact Technologies
Operational Excellence
Global Integration
ExxonMobil possesses unique competitive advantages which create long-
term shareholder value. |
 33
Competitive Advantages
Balanced Portfolio Quality
Disciplined Investing
High-Impact Technologies
Operational Excellence
Global Integration
ExxonMobil possesses unique competitive advantages which create long-
term shareholder value. |
 34
0
30
60
90
0
30
60
90
0
30
60
90
BOEB
Resource Base
Liquids
Gas
Africa
Australia/Oceania
Asia
Americas
Unconventional
Gas and Oil
Arctic
Conventional
Heavy Oil / Oil Sands
Deepwater
Acid / Sour
Liquefied Natural Gas
BOEB
BOEB
Europe
Type
Geography
Oil / Gas
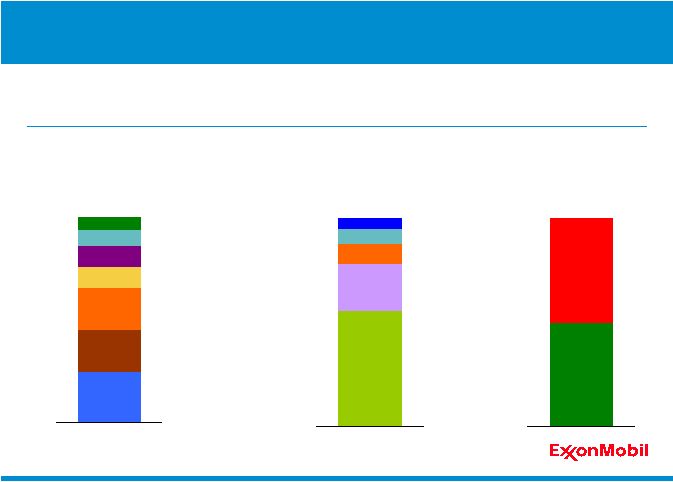
2010 Resource Base
Upstream
Balanced Portfolio Quality
ExxonMobil’s resource base of over 84 billion oil-equivalent barrels is
diverse by resource type, geography, and oil / gas mix.
|
 35
Markets
0
20
40
0
5
10
15
Gas-Indexed
Oil-Indexed
Divertible
Africa
Europe
Asia
Americas
LNG
Shale Gas
Conventional
Deepwater
Acid / Sour
Tight Gas
Arctic
Contract Structures
BOEB
Gas Resource Base
BCFD
CBM
Global Gas Position
Upstream
Balanced Portfolio Quality
A robust gas portfolio of quality operations and advantaged projects spans
all resource types, major markets, and commercial structures.
79 TCF proved gas reserves
Diverse by resource type, major
markets, and commercial structures
Leading unconventional position with
significant growth potential
Wide range of contracts ensures
flexibility and market optionality |
 36
0
1
2
3
4
5
2010 Production
2010 Contract Mix
Gas
Oil
Oil
Oil
Indexed
Gas
Indexed
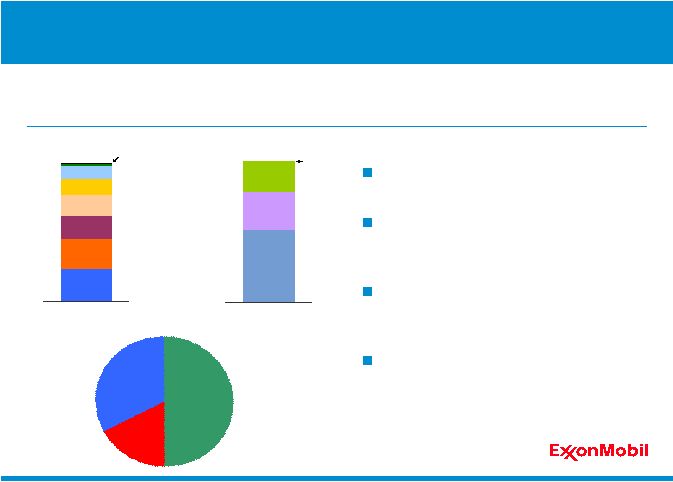
2010 Production by Contract
MOEBD
2010 Production and Contract Mix
Approximately 70 percent of total
2010 production linked to oil pricing
•
One-third of gas sales pricing
linked to oil prices
More flexible contracts also allow
ability to divert gas to the most
attractive markets
Advantaged developments continue
to provide diverse contract structures
A wide range of gas contracts provides ExxonMobil with the flexibility to
maximize the value of a strong global gas position.
Upstream
Balanced Portfolio Quality |
 37
Turkey
Poland
Germany
Nigeria
Romania
Ireland
Norway
Indonesia
Madagascar
Vietnam
Tanzania
PNG
China
West
Greenland
Beaufort
Athabasca
GoM
Horn River
Haynesville /
Bossier
Eagle Ford
Guyana
Argentina
Cardium
Colombia
Marcellus
Angola
Australia
Libya
Unconventional
New Play Tests
Established Basin
Unconventional
New Play Tests
Established Basin
Philippines
Russia
New Opportunity Growth
A diverse global portfolio of high-quality resource opportunities.
Upstream
Balanced Portfolio Quality |
 38
Scale Advantage
Refineries 60 percent larger than
industry
•
Largest lubricant basestock
capacity
Constant focus on cost efficiency,
circuit optimization, and reliability
Feedstock flexibility advantage
•
Challenged crude runs 60 percent
more than industry average
ExxonMobil is the largest global refiner and manufacturer of lube basestocks
as well as a leading marketer of petroleum products.
Downstream
Balanced Portfolio Quality
* ExxonMobil average global refinery distillation capacity compared to industry (YE
2010). Equity share capacity calculated on a consistent basis using public
information. 100
150
200
250
XOM
BP
RDS
Industry
Average
Average Refinery Size*
KBD |
 39
Diverse business channels
Highly integrated with refining
Leveraging our globally recognized
brands
•
Product quality
•
Supply reliability
Global reach, trusted brands, and high-quality products position ExxonMobil
as a reliable supplier to a wide range of customers.
World-class Brands
Downstream
Balanced Portfolio Quality
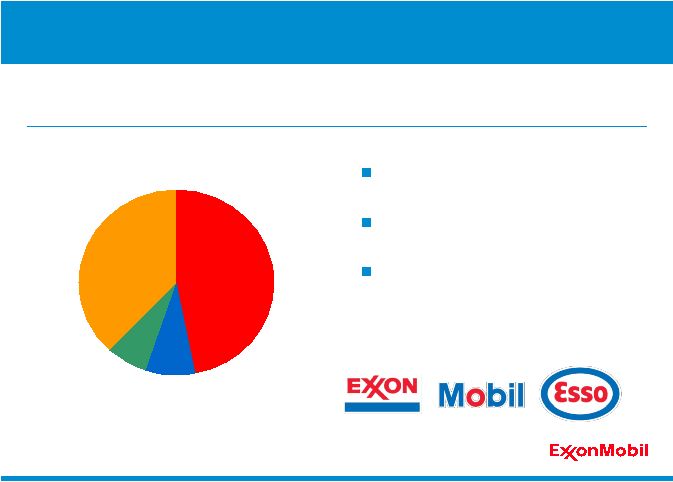
Global Fuels Marketing Sales
Aviation
Marine
Retail
Industrial and
Wholesale
47%
8%
7%
38%
Global Fuels Marketing Sales
Aviation
Marine
Retail
Industrial and
Wholesale
47%
8%
7%
38% |
 40
0
10
20
30
40
50
60
'06
'08
'10
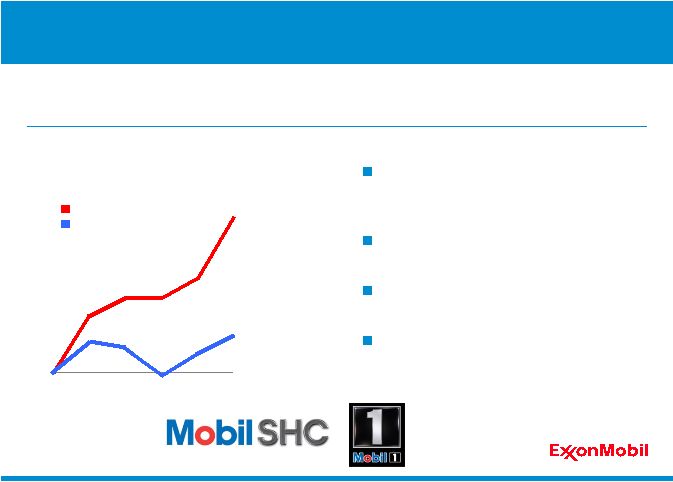
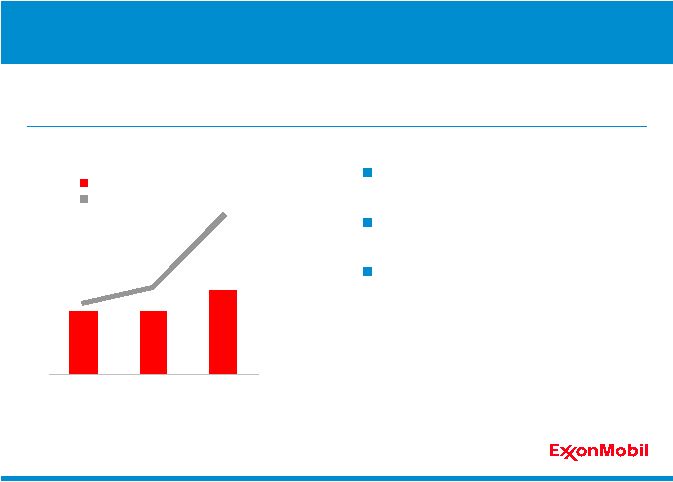
Synthetic Lubricants Sales Growth
Percent Change since 2005
ExxonMobil
Industry
Industry-leading Sales Growth
Continued growth in high-value lubes, well above industry.
Market leader in high-value synthetic
lubes
Legacy of technology leadership
Efficient global business model
Well-positioned to capture superior
growth
Balanced Portfolio Quality
Downstream |
 41
0
1
2
3
4
5
'02
'03
'04
'05
'06
'07
'08
'09
'10
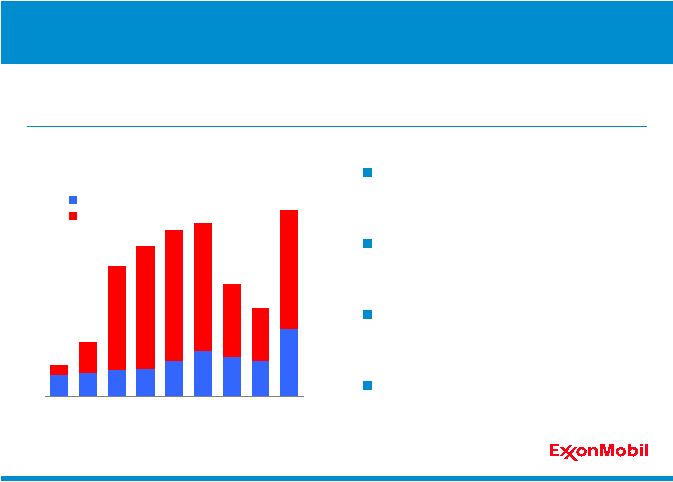
Earnings
$B
Commodity
Specialty
Commodities capture upside earnings
potential
Specialties provide stable yet growing
earnings base
Portfolio backed by proprietary
technology
Both commodities and specialties
delivering strong results
Unique Chemical portfolio captures benefits of scale in commodities while
maximizing value from specialties.
Product Strength and Diversity
Chemical
Balanced Portfolio Quality |
 42
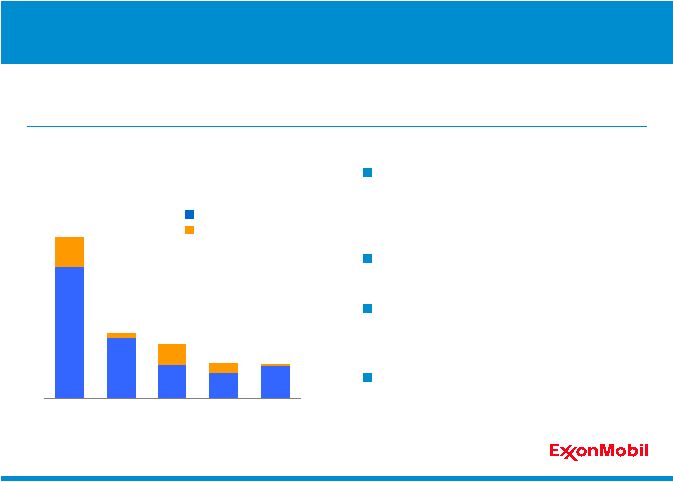
0
2
4
6
XOM
RDS
TOT
CVX
DOW
Asia Pacific / Middle East Capacity
Ethylene & Paraxylene
Million Metric Tons
Existing
Announced
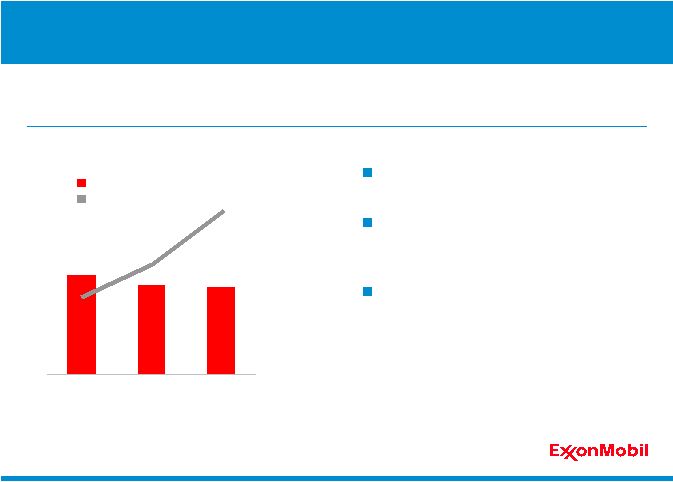
Asia Pacific Growth
Investments in increasing capacity to meet future demand growth in key
Asia Pacific Markets.
Asia Pacific 60 percent of future
growth
•
Supported by Middle East exports
Fujian start-up in 2009
Singapore expansion entering
commissioning and start-up phase
Saudi specialties progressing
Source: Chemical Market Associates, Incorporated.
Chemical
Balanced Portfolio Quality |
 43
Competitive Advantages
Balanced Portfolio Quality
Disciplined Investing
High-Impact Technologies
Operational Excellence
Global Integration
ExxonMobil possesses unique competitive advantages which create long-
term shareholder value. |
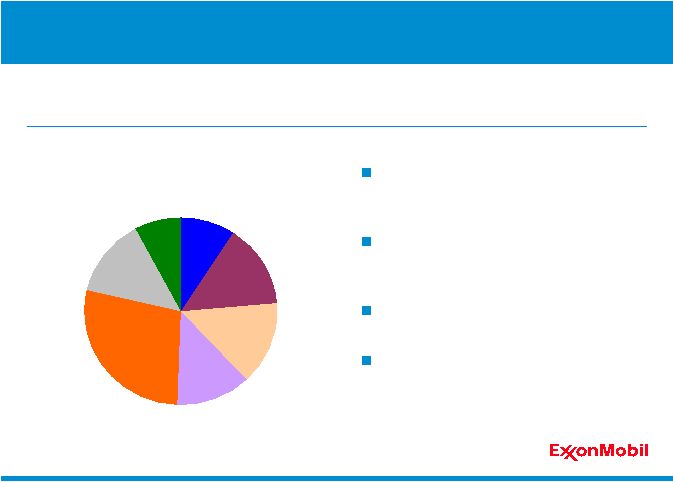 44
Major Project Distribution by Project Type
Percent, resource
Unconventional
Gas and Oil
Heavy Oil /
Oil Sands
Deepwater
Conventional
LNG
Acid /
Sour
Arctic
28%
14%
8%
9%
15%
14%
12%
Developing 26 net BOEB, across all
regions and resource types
Industry-leading project management
processes
High-impact technology
Capital efficient implementation
Extensive Upstream portfolio of 130+ major projects supports selective
investment decisions.
Major Project Inventory
Upstream
Disciplined Investing |
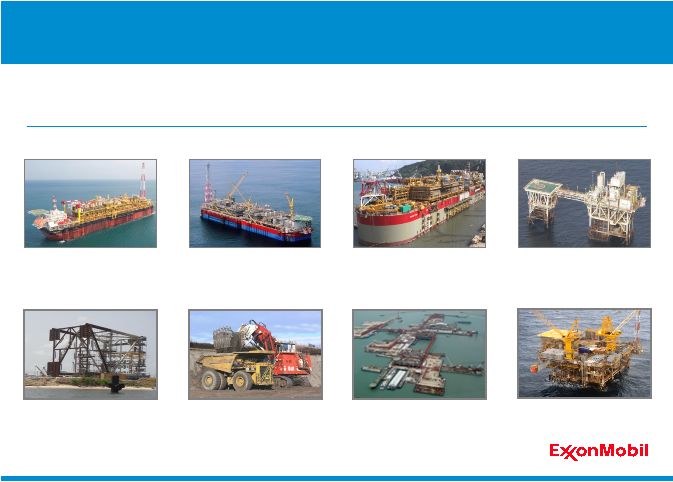 45
Upstream
Disciplined Investing
Eleven major project start-ups are planned between 2011 and 2013.
Near-Term Project Start-Ups
Conventional Etim / Asasa
Pressure Maintenance
Deepwater
Pazflor
Acid / Sour
Kashagan Ph 1
Conventional
Kipper / Tuna
Deepwater
Kizomba Satellites
Deepwater
Usan
Oil Sands
Kearl Initial Development
Conventional
Nigeria Satellites Ph 1
Courtesy of Total
Courtesy of Total |
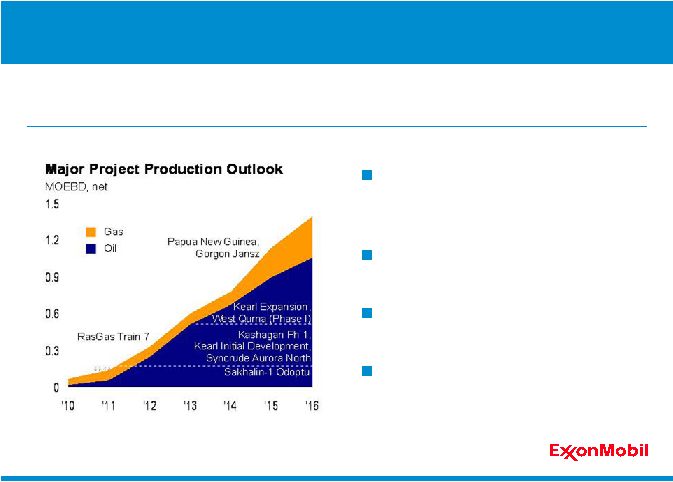 46
Upstream
Disciplined Investing
Major Project Production Outlook
Significant new long-plateau production from major projects supports
long- term volumes.
Nearly 1.4 MOEBD added by
2016
80% oil volumes
Significant long-plateau volumes
Long-term growth supported by
diverse portfolio |
 47
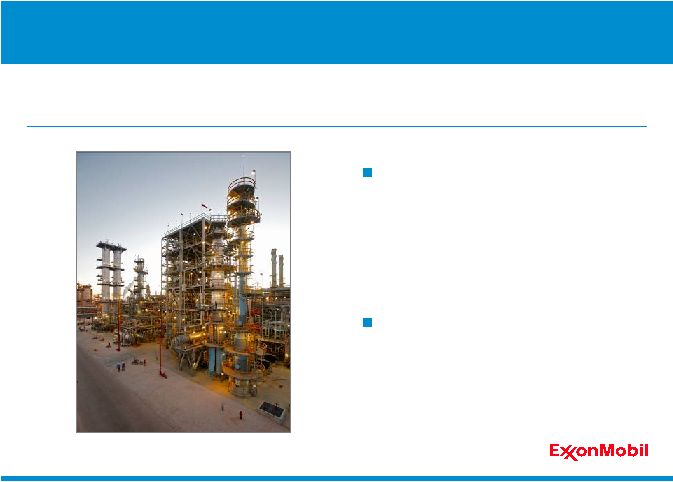
Lower-Sulfur Motor Fuels
ExxonMobil’s global investments continue to expand production
of
lower-sulfur motor fuels.
New ultra-low sulfur diesel (ULSD)
facilities in Baytown, TX; Baton Rouge,
LA; and Antwerp, Belgium
•
More than $1B invested to meet
expanding diesel demand
•
Adds 6 million gallons per day
Additional projects underway
•
Scanfiner unit and distillate
hydrofiner upgrade at Sriracha,
Thailand, refinery
•
Diesel hydrotreater at Singapore
Baytown Refinery, United States
Downstream
Disciplined Investing |
 48
Downstream Average Capital Employed
$B
0
25
50
'00
'05
'10
ExxonMobil
Competitor Average
(1)
ExxonMobil
Competitor Average
(1)
Efficient Use of Capital
Disciplined capital management
Robust portfolio management
processes
Significant portfolio divestments*
•
Interests in 11 refineries
•
5K+ miles of pipeline assets
•
140 product terminals
•
40 lube oil blend plants
•
20K+ retail sites
ExxonMobil is the most capital efficient among competitors and actively
manages capital employed across the business cycle.
*
Asset
management
activities,
2000
–
2010
Downstream
Disciplined Investing
(1)
RDS, BP, and CVX values are estimated on a consistent basis with
ExxonMobil, based on public information. |
 49
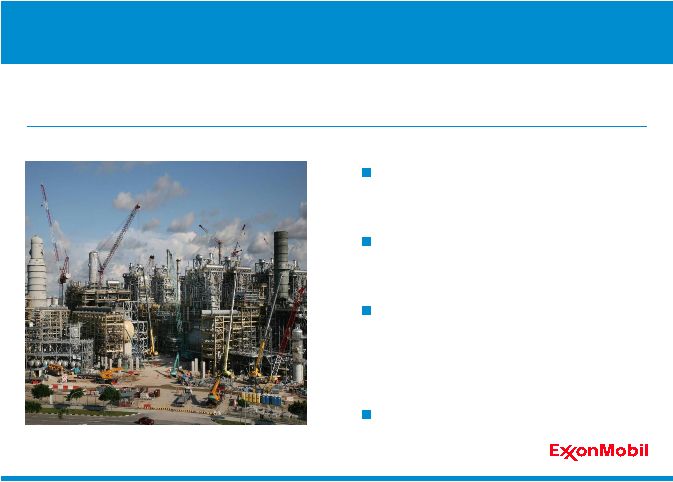
Singapore Expansion
2.5 million metric tons of new
capacity
Underpinned by proprietary
technologies
Advantaged project
•
Significant feed flexibility
•
World-scale efficiency
•
Premium products
Highly integrated with refining
Major expansion in Singapore to meet demand growth in Asia Pacific will
add shareholder value, building on key competitive advantages.
Singapore Expansion
Chemical
Disciplined Investing |
 50
Chemical Average Capital Employed
$B
0
20
40
'00
'05
'10
ExxonMobil
Major Chemical Company Average
(1)
Efficient Use of Capital
Disciplined investment selection
Engineering and project excellence
Growth via internal technology
development
ExxonMobil Chemical is the most capital efficient of the large, international
chemical companies.
Chemical
Disciplined Investing
(1)
Dow Chemical and BASF values are estimated on a consistent basis
with ExxonMobil, based on public information. |
 51
Competitive Advantages
Balanced Portfolio Quality
Disciplined Investing
High-Impact Technologies
Operational Excellence
Global Integration
ExxonMobil possesses unique competitive advantages which create long-
term shareholder value. |
 52
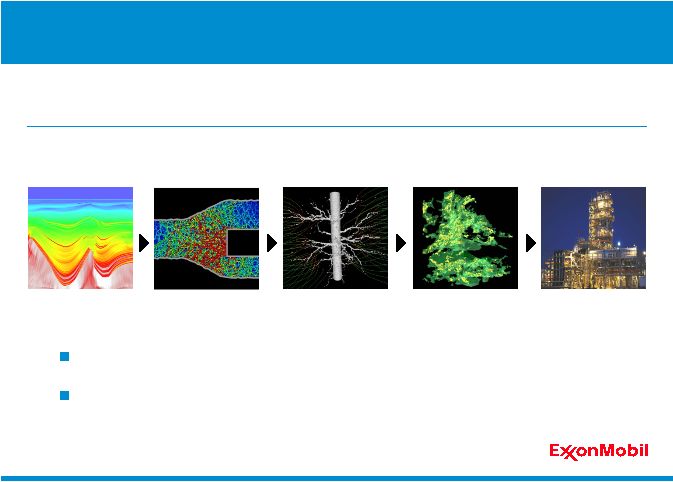
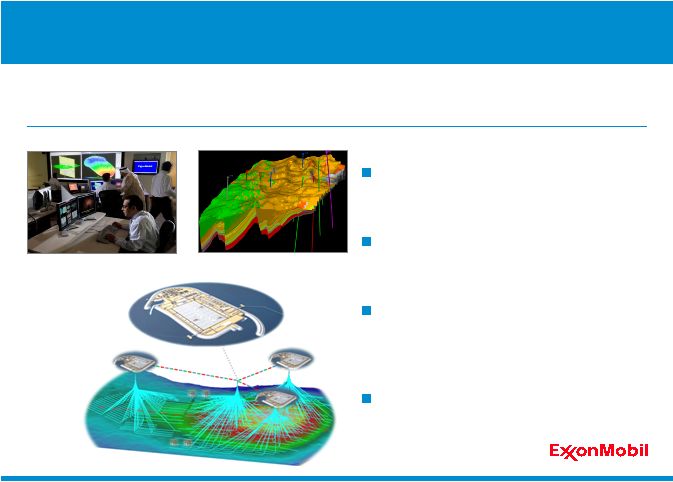
Research and Development
Upstream
High-Impact Technologies
ExxonMobil delivers advantaged technologies across the business while
progressing significant breakthrough
research. Integrated
technologies provide advantaged business solutions Developing
high-reward, risk-reduction technologies for the future Imaging
Shale Gas
Drilling
Flow Stimulation
Sour Gas
Exploration
Development
Production |
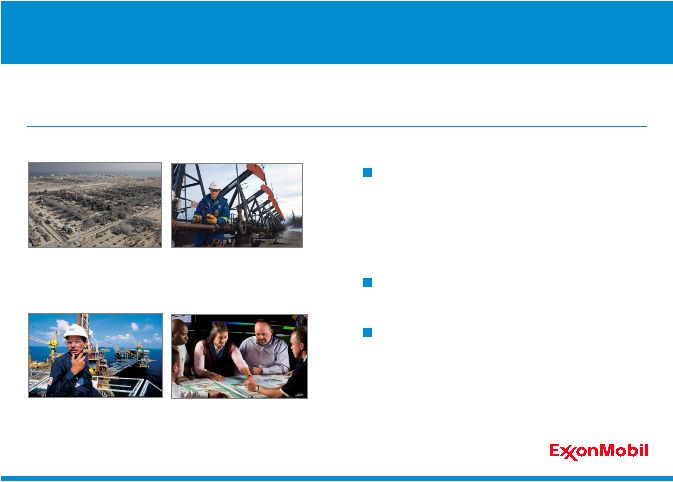
 Upper
Zakum Upstream
High-Impact Technologies
Employing advantaged technologies to progress resource development with
partners.
Abu Dhabi Technology Center
Leading Reservoir Simulator
Building artificial islands with co-
located drilling and processing
Technology Center is catalyst for
collaboration and innovation
Use of extended-reach drilling
technology demonstrated feasibility of
island development concept
Significant savings in development cost
and reduced environmental footprint
Upper Zakum
Development Plan
53 |
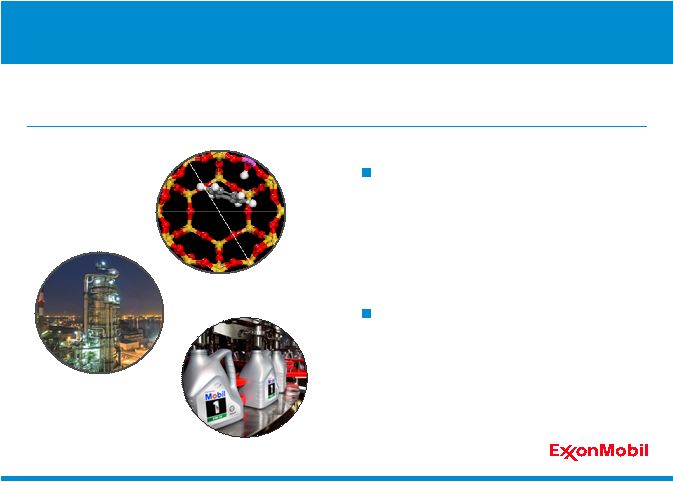 Leading-edge technologies
•
Fundamental composition models
•
Advanced catalysts and processes
•
Heavy oil characterization /
conversion
•
Energy efficiency / management
Maximize value through entire supply
and production chain
•
Rapidly assess and select
advantaged feeds
•
Model optimum feedstock routing
•
Formulate advanced products
Discovering, developing, and deploying proprietary technologies provide
near-term and longer-term competitive advantages to our businesses.
Legacy of Technology Leadership
High-Impact Technologies
Downstream
54 |
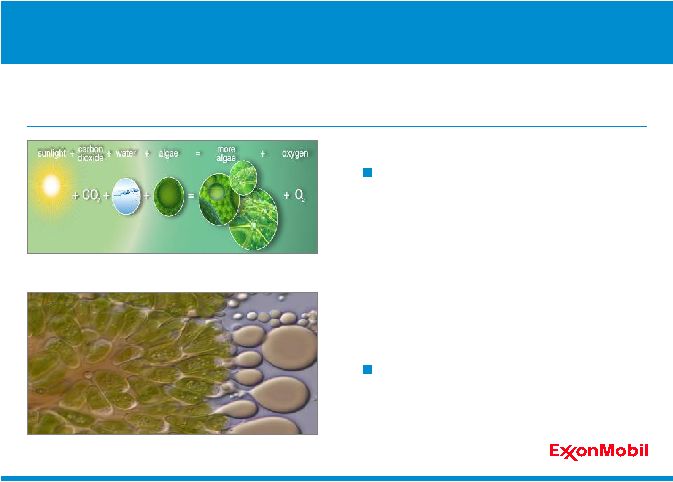 ExxonMobil and Synthetic Genomics are researching large-scale
production and commercialization of algae-based biofuels.
Numerous potential benefits of biofuels
production from algae
•
Provides GHG mitigation benefits
unlike conventional fuels
•
No impact on food production
•
Yields greater volume of biofuels per
acre than other sources
•
Produces biofuels similar to existing
transportation fuels
Expect to spend $600 million if project
milestones are met
Next Generation Technology
Downstream
High-Impact Technologies
Algae consume carbon dioxide as they grow
Algae secreting oil
55 |
 Advantaged Technology
Advantaged feedstock
•
High level of feed flexibility
Lower-cost manufacturing processes
•
Advanced processes and catalysts
•
Improved energy efficiency and
reliability
Premium products
•
Innovative, higher-value products
Development and deployment of industry-leading chemical technology
provide a competitive advantage.
Chemical
High-Impact Technologies
56 |
 Worldwide
Feedstock* 0
25
50
75
100
Industry
ExxonMobil Chemical
Percent
Ethane
LPG +
Naphtha
Heavy
Feedstock Advantage
ExxonMobil Chemical proprietary technology enables processing both
heavy and light feedstocks for competitive advantage.
Technology critical in delivering
flexibility
North America ethane advantage
Access to low-cost heavy feeds
Source: Chemical Market Associates, Incorporated.
* Ethylene feedstock, 2009 data; ExxonMobil data includes ExxonMobil share of JV
production. Chemical
High-Impact Technologies
57 |
 Competitive Advantages
ExxonMobil possesses unique competitive advantages which create long-
term shareholder value.
Balanced Portfolio Quality
Disciplined Investing
High-Impact Technologies
Operational Excellence
Global Integration
58 |
 Reliability and Cost Management
Achieving superior reliability
•
Operated uptime > 3 percent
higher than assets operated-by-
others
Maintaining integrity of facilities
Focusing on investment selectivity
and cost management
•
Efficiency identification and
capture
Upstream
Operational Excellence
Standardize
Integrate
Operate and Maintain
Plan and Execute
-
Global best practice deployment delivers superior reliability and life cycle
cost performance.
59 |
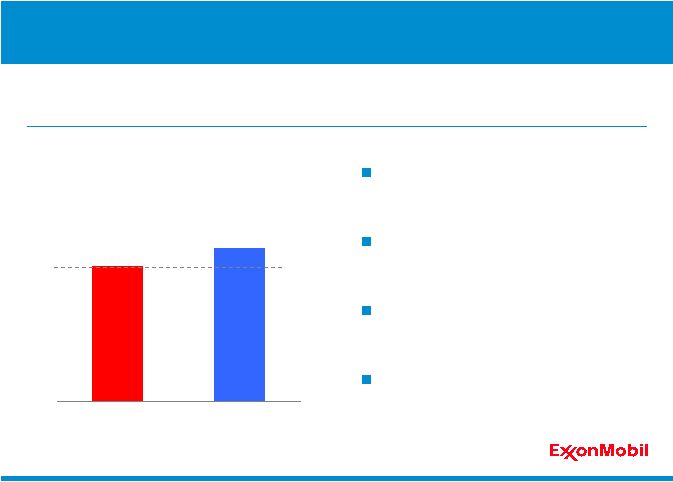 0
50
100
150
ExxonMobil Operated
Operated-by-Others
114%
101%
Cost Performance*
Percent
Rigorous, high-quality project management processes consistently deliver
industry-leading project execution performance.
Unmatched ability to implement
complex projects
Deliver projects faster than
competitors
Track record of superior cost
and schedule delivery
Maximize project efficiencies to
deliver superior returns
Project Execution
* Actual versus funded cost variance (%), ‘06 to ‘10 project
start-ups. Upstream
Operational Excellence
60 |
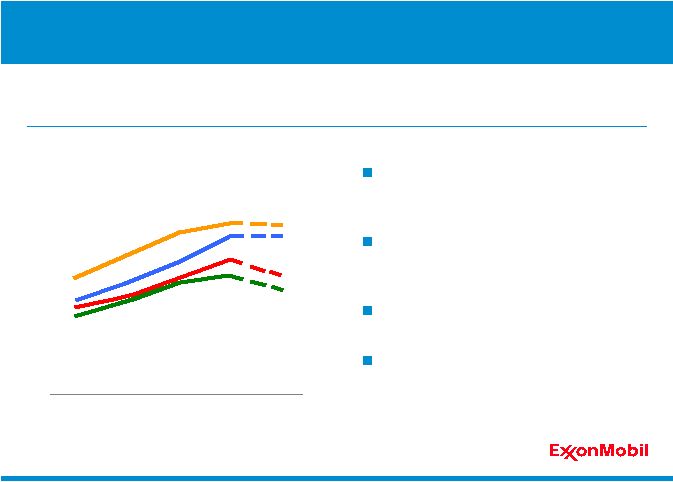 0
5
10
15
20
25
'05
'06
'07
'08
'09
Total Costs per OEB*
CVX
RDS
BP
XOM
$/OEB
Disciplined and consistent
approach to cost management
Continual effort to maximize the
value of each asset
Mature contracting strategies
Ongoing portfolio management
ExxonMobil effectively mitigated cost growth through the business cycle, as
a result of superior cost management.
Cost Management
* Upstream technical costs normalized using 10-K/20-F information; beginning
in 2009, equity companies and oil sands mining operations are included.
Upstream
Operational Excellence
61 |
 Superior
reliability
performance
combined
with
unmatched
project
execution
and
life
cycle
cost
performance
generate
maximum
value.
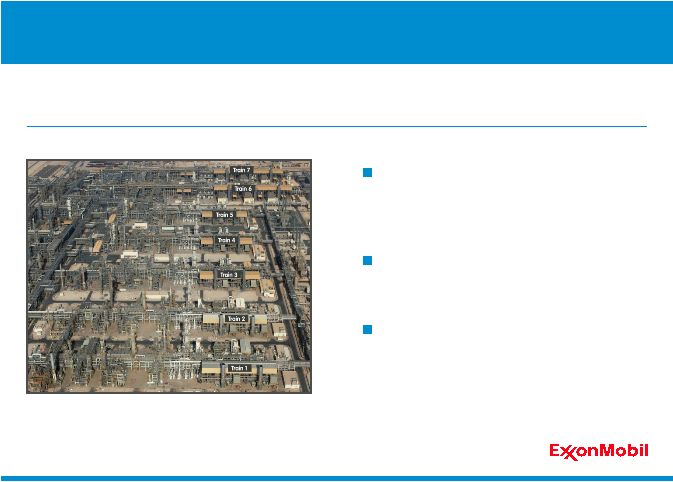
Qatar Liquefied Natural Gas
Delivering 62 million metric tons per
year capacity through Qatar joint
ventures
96 percent uptime performance in
2010
Supplying global major markets
Upstream
Operational Excellence
62 |
 95
100
105
110
'04
'06
'08
'10
Refining Energy Intensity*
ExxonMobil
Indexed
Industry
Source: Solomon Associates fuels refining benchmarking data; available for even
years. * 2010 results estimated by ExxonMobil. Data indexed to ExxonMobil
('04). Maintaining refining cost leadership
•
Global average in top quartile
Leveraging chemical integration
Reducing energy costs / emissions
•
Global Energy Management
System
•
Cogeneration investments
•
Upgrade high energy-consuming
systems
ExxonMobil continues to increase competitive advantage by focusing on
operations reliability, energy efficiencies, and integration.
Operating Cost Efficiencies
Downstream
Operational Excellence
63 |
 -80
-40
0
'04
'06
'08
'10
Lubes & Specialties Operating Efficiencies
Indexed
Products
Blend Plants
Order Centers
Improving Productivity
On-going consolidation activities
Streamlined product offering
Global resources drive lower
operating expenses
•
Organization, systems, and
processes
A continuous focus on optimizing productivity delivers a long-term
competitive advantage.
Operational Excellence
Downstream
64 |
 Source: Solomon Associates benchmarking data; available for odd years only.
* 2010 results estimated by ExxonMobil. Data indexed to ExxonMobil ('05).
Operating Efficiencies
A relentless focus on operating efficiencies creates a competitive
advantage and steady performance improvement over time.
Globally shared best practices
Advanced technology
Record performance in 2010
Chemical
Operational Excellence
65
Global
Steam
Cracker
Energy
Intensity*
95
100
105
110
'05
'07
'09
'10
Indexed
ExxonMobil
Industry |
 -40
-30
-20
-10
0
'05
'06
'07
'08
'09
'10
Indexed Percent Change
Marketing & Supply Chain Simplification
Finished Product
Inventory
Supply Points
Finished Grades
Business Simplification
Simplification delivers cost savings and operational efficiencies.
Focus on value capture
Eliminate unnecessary complexity
Lower cost, improve reliability to
customers
Chemical
Operational Excellence
66 |
 Competitive Advantages
ExxonMobil possesses unique competitive advantages which create long-
term shareholder value.
Balanced Portfolio Quality
Disciplined Investing
High-Impact Technologies
Operational Excellence
Global Integration
67 |
 Value
of the Integrated Model ExxonMobil’s effective execution of a complex
integrated business model creates significant value for the
shareholder. Maximize resource upgrade across the value chain
Joint feedstock and facilities planning
Highest-value outlets for products
Global competency networks, shared services, and best practices
Standardization of key processes including risk management
Efficient development and deployment of new technologies
Global Integration
68 |
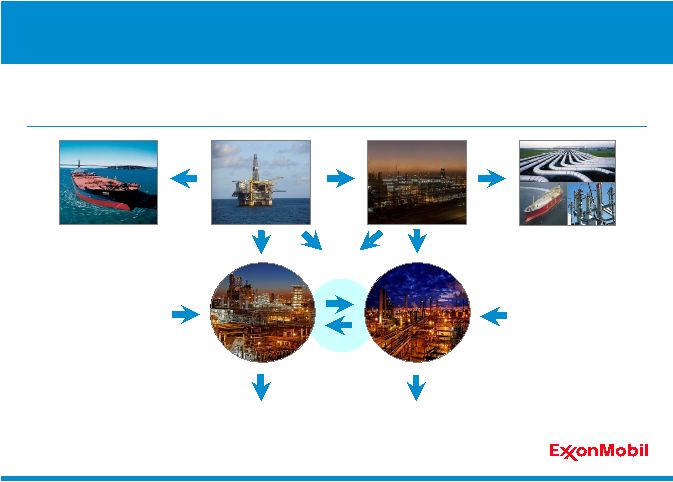   ExxonMobil maximizes value across the entire supply chain, from the
wellhead to the customer. The level of integration is unmatched.
Integrated Supply Chain
Global Integration
Commodities
and
Specialties
Fuels
Marketing,
Lubricants and
Specialties
Crude and
Feedstocks
Crude
Oil
Natural
Gas
Feedstocks
Refinery
Chemical
Plant
Production
3rd
Party Sales
Power Plant
LNG Plant
Gas
Processing
3rd
Party Sales
69 |
 Integration with
Chemicals/Lubes* Percent
25
50
75
XOM
RDS
Industry
BP
* Calculated on a consistent basis using public information; YE 2010.
Higher-value products
Integrated molecular optimization
Assets with unparalleled feed
flexibility
Common site management, utilities,
and infrastructure
Global scale and integration are structural advantages that are difficult for
competitors to replicate.
Downstream/Chemical
Integrated Manufacturing
Global Integration
70 |
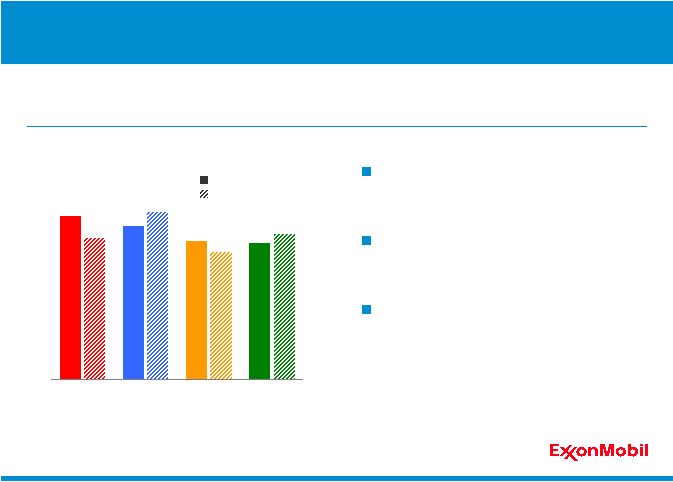
 Return on Average
Capital Employed* 2000 -
2010
Percent
0
5
10
15
20
25
XOM
XOM
Downstream
Chemical
Competitor
Average**
Competitor
Average***
Downstream/Chemical
Proven business strategies enabled
by technology
Businesses optimized together to
maximize shareholder value
Combined 2000 –
2010
average annual results
•
$8B earnings
•
20 percent ROCE
ExxonMobil has unequaled performance across the Downstream and
Chemical platforms.
*
Competitor data estimated on a consistent basis with ExxonMobil and based on public
information. **
RDS, BP, CVX.
***BP (through '04), RDS, CVX (through '09), Dow Chemical.
Industry-leading Returns
Global Integration
71 |
 Competitive Advantages
ExxonMobil possesses unique competitive advantages which create long-
term shareholder value.
Balanced Portfolio Quality
Disciplined Investing
High-Impact Technologies
Operational Excellence
Global Integration
72 |
 Mark Albers
Senior Vice President
Global Exploration |
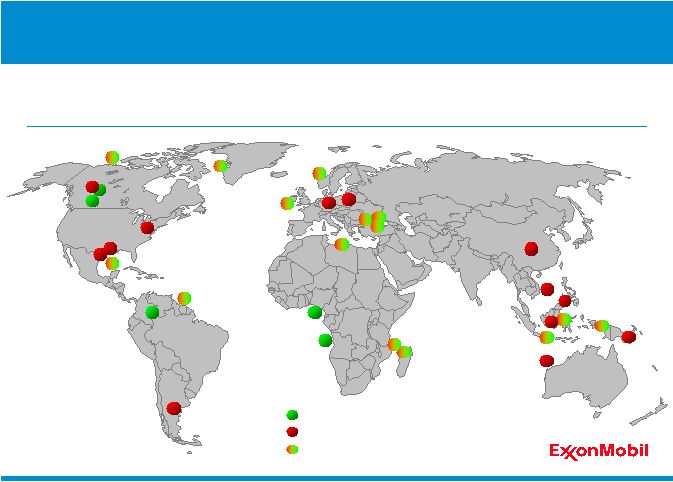
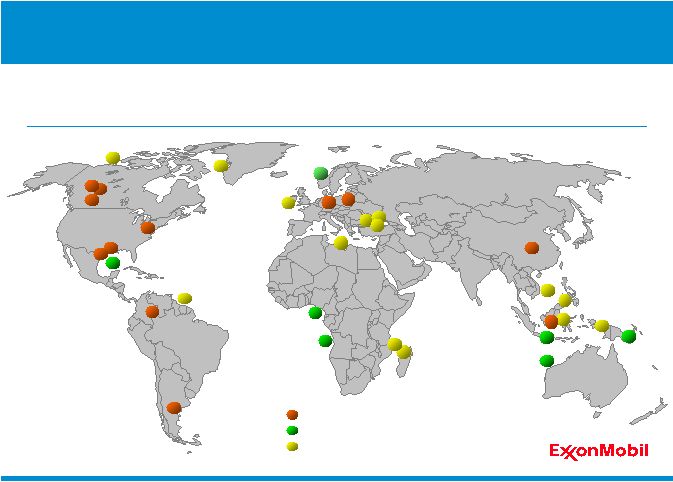 Turkey
Poland
Germany
Nigeria
Romania
Ireland
Norway
Indonesia
Madagascar
Vietnam
Tanzania
PNG
China
West
Greenland
Beaufort
Athabasca
GoM
Horn River
Haynesville /
Bossier
Eagle Ford
Guyana
Argentina
Cardium
Colombia
Marcellus
Angola
Australia
Libya
Philippines
Russia
New Play Tests
Unconventional
Established Basin
New Opportunity Growth
A diverse global portfolio of high-quality resource opportunities.
74 |
 Gas
Mixed / To be determined
Oil
Poland
Germany
Nigeria
Romania
Ireland
Norway
Indonesia
Madagascar
Vietnam
Tanzania
PNG
China
West
Greenland
Beaufort
Athabasca
GoM
Horn River
Haynesville /
Bossier
Eagle Ford
Guyana
Argentina
Cardium
Colombia
Marcellus
Angola
Libya
Turkey
Philippines
Australia
Russia
New Opportunity Growth
A diverse global portfolio of high-quality resource opportunities,
representing a balance between oil and gas.
75 |
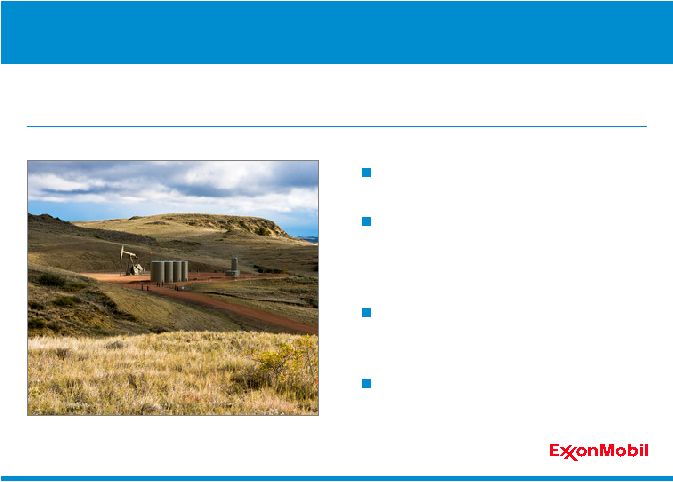
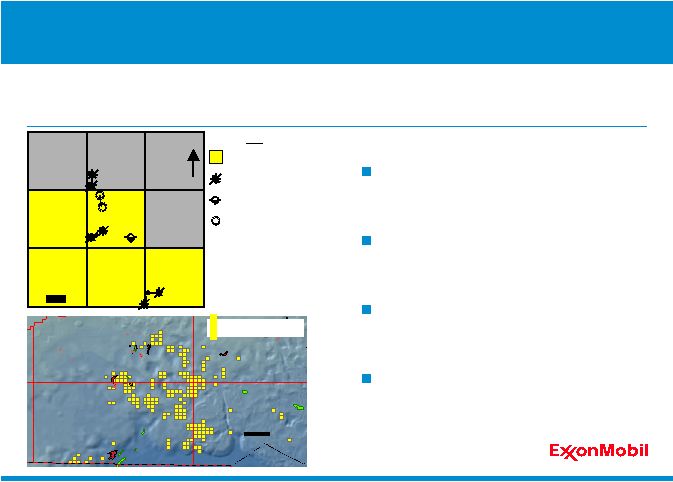 Established Exploration –
U.S. Gulf of Mexico
2.1 million net acres with exposure to
multiple plays
Recent discoveries at Hadrian South
and Hadrian North
Seismic processing and drilling
planned in 2011
Actively building Gulf of Mexico
prospect inventory
Active exploration programs in established basins such as the U.S. Gulf of
Mexico.
EM 50% (Operator)
Plugged oil and gas well
Plugged well with oil shows
Planned well location
Key
N
KC875
KC876
KC874
Lucius
Hadrian-5
(Planned)
KC964
Hadrian-2
Hadrian-4
KC962
KC963
KC920
Hadrian-1
KC918
KC919
Hadrian-3
1 Mile
Hadrian
North
Hadrian
South
Keathley Canyon
Diana
Hoover
Great White
Garden Banks
Tiber
20 miles
East Breaks
Alaminos Canyon
ExxonMobil
Interest Acreage
76 |
 Leading acreage position in the
Black Sea with 6.3 million net acres
Sinop-1 wildcat completed
•
Evaluating results to assist in
future exploration
Multiple new play tests are planned
in 2011-2012 in Turkey and Romania
ExxonMobil maintains an active exploration program which includes select
new play tests in basins with significant upside potential.
New Basin Tests –
Black Sea
77 |
 0.0
0.5
1.0
1.5
2.0
2.5
3.0
XOM
XOM
CVX
BP
RDS
0
1
2
3
4
5
'01
'02
'03
'04
'05
'06
'07
'08
'09
'10
Annual Resource Additions
(2001 –
2010)
BOEB
Discovered Undeveloped*
By-the-Bit*
2002 -
2008
2004 -
2008
2006 -
2010
2001 -
2010
2005 -
2009
Finding Cost
(as reported)**
$/OEB
Production
$2-3
ExxonMobil consistently adds quality resource additions at attractive finding
costs.
Resource Base Growth
* Excludes XTO acquisition and the proved portion of discovered undeveloped
additions. ** Source: Chevron Analyst Presentation (March 2010), BP Strategy
Presentation (March 2010), Shell Analyst Presentation (March 2010).
78 |
 Mark Albers
Senior Vice President
Upstream Projects |
 Expected to produce an additional
100 kbd of oil in Angola
Innovative loop development
between existing Kizomba A and B
producing facilities
Advancing three new projects in
Block 17
Delivering significant value through opportunities such as Kizomba
Satellites Phase 1 in West Africa.
Deepwater –
Blocks 15 and 17, Angola
80 |
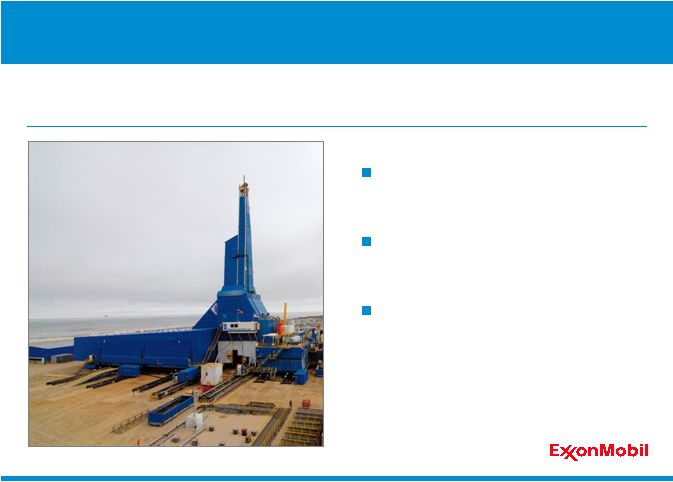 Arctic –
Sakhalin-1, Eastern Russia
Odoptu project started-up on time
and producing 50 kbd
Developed with world record
extended-reach drilling
Funded development of Arkutun Dagi
field with start-up planned in 2014
Disciplined project management processes continue to deliver industry-
leading project execution performance.
81 |
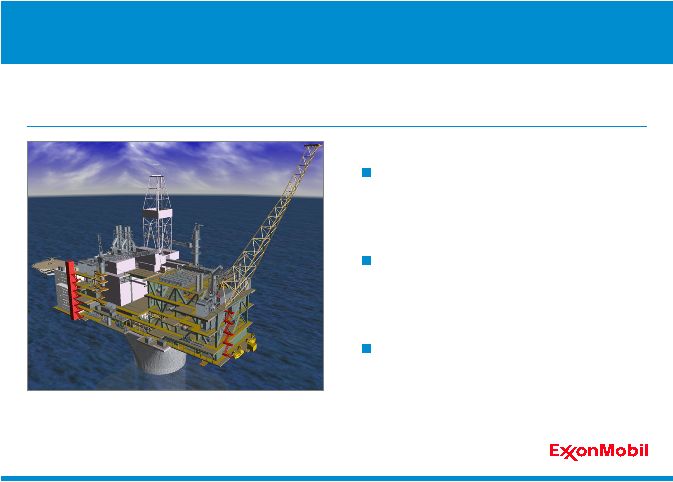 Awarded Hebron topsides and
gravity based structure front-end
engineering and design contracts
Leveraging global arctic experience
and proprietary technology
applications
Full funding targeted mid-2012
Delivering significant value through conventional development opportunities
such as Hebron.
Conventional –
Hebron, Eastern Canada
82 |
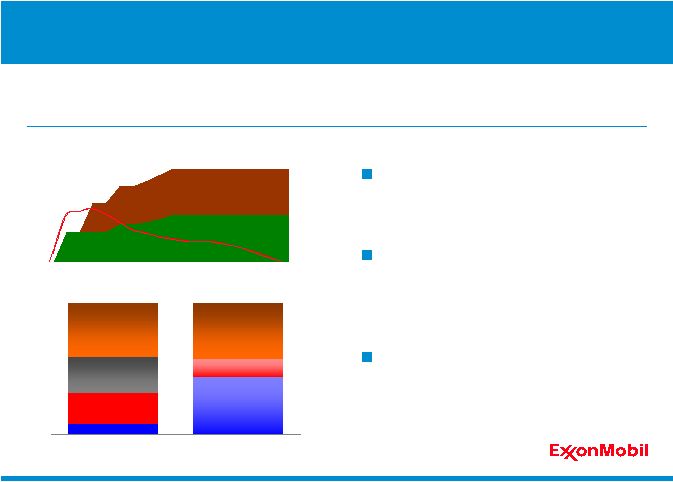 83
High-quality oil sands resource coupled with ExxonMobil technology and
execution capability provide long-life earnings contribution.
Oil Sands –
Kearl, Canada
Long-term plateau production
profile
Lower combined unit
development and operating
costs
Competitive with industry Gulf
of Mexico deepwater
developments
0
100
200
300
400
Initial Development
Expansion
0
40
80
Kearl
Industry GOM
Deepwater
Development
Cost
Operating
Earnings /
Government
Take
Bitumen
Discount
Kearl Comparison
KOEBD, net
GOM
Deepwater
Revenue Components at 2010 Oil Price
Source: Wood MacKenzie.
Earnings /
Government
Take
Operating
Cost
Development
$ per OEB |
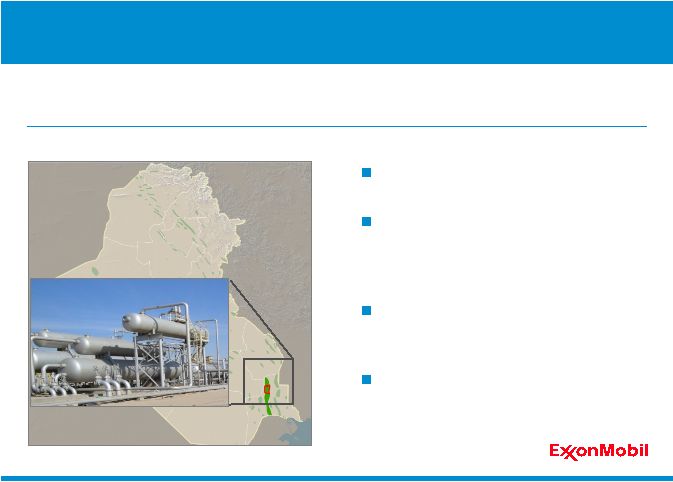 Conventional –
West Qurna (Phase I), Iraq
Signed 25-year agreement
Amended agreement to include
discovered but undeveloped
reservoirs
Established ExxonMobil presence in
Basra and Baghdad
Commenced field activities including
well work and facilities enhancement
ExxonMobil is advancing the redevelopment of this world-class field to
maximize production capability.
Iraq
84 |
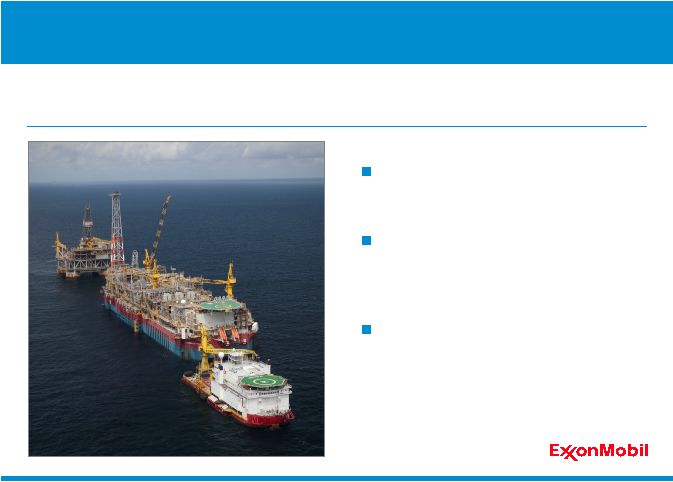
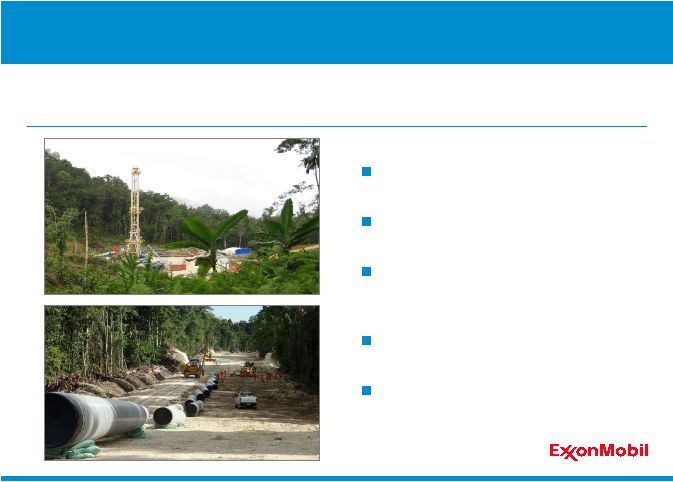 High-quality 9 TCF gross resource
Two-train 6.6 MTA LNG plant
Upstream facilities and 450 mile
pipeline
Commenced pipe laying
Anticipate start-up in 2014
Liquefied Natural Gas -
Papua New Guinea
PNG
LNG
project
utilizes
global
LNG
experience,
strengthening
ExxonMobil’s
presence
in
the
attractive
Asia
Pacific
gas
market.
85 |
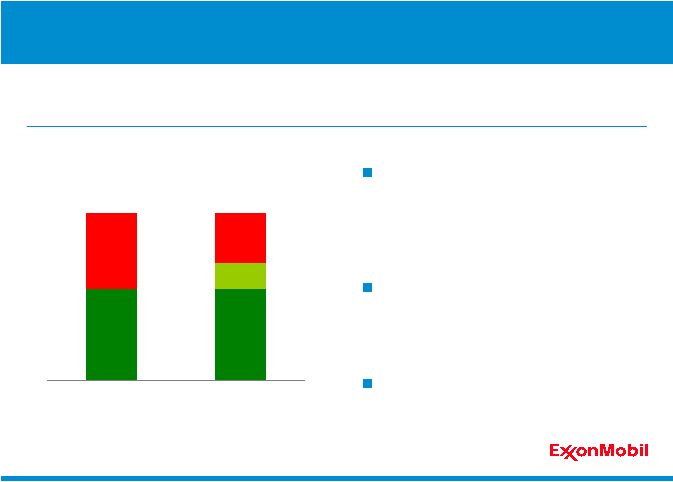
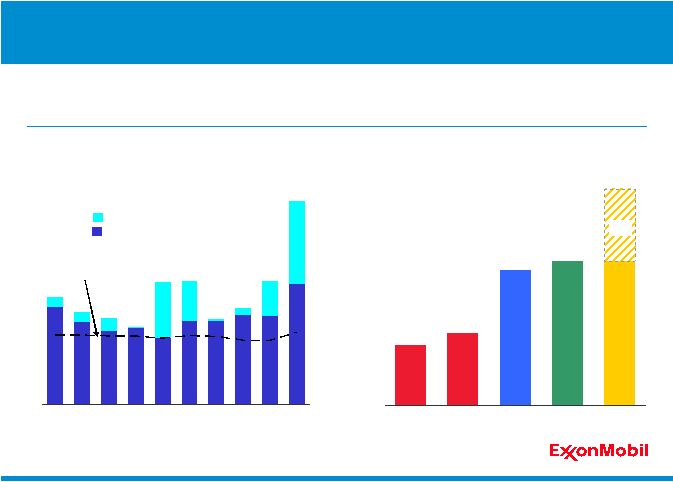
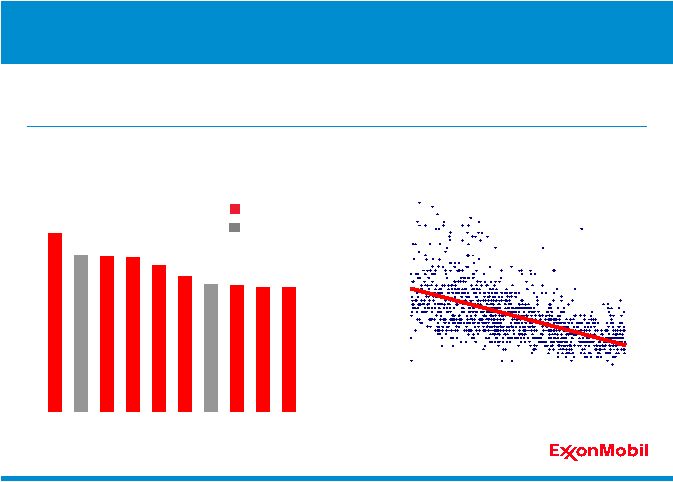
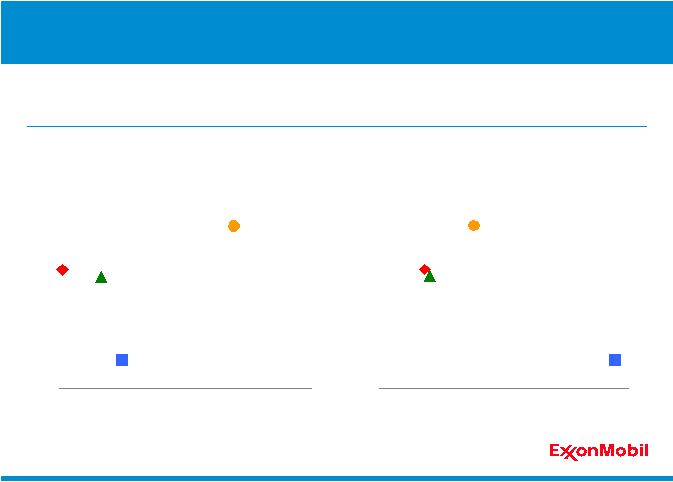 Exploration and Development Performance
ExxonMobil
consistently
delivers
competitive
reserves
replacement
with
the
most
efficient
use
of
exploration
and
development
capital.
Source: Company specific 10-K/20-F disclosures.
Exploration expenditures per unit of production ($ per boe)
Unit exploration & development expenditures ($ per boe)
86
50%
100%
150%
5
10
15
20
25
50%
100%
150%
2
4
6
8
Exploration Expenditures vs. Organic Reserve
Replacement Ratio
(2005-09)
Exploration
&
Development
Expenditures
vs.
Organic
Reserve
Replacement
Ratio
XOM
BP
CVX
RDS
XOM
BP
CVX
RDS
Organic RRR
Organic RRR
(2005-09) |
 Unconventional Portfolio
Andy Swiger
Senior Vice President |
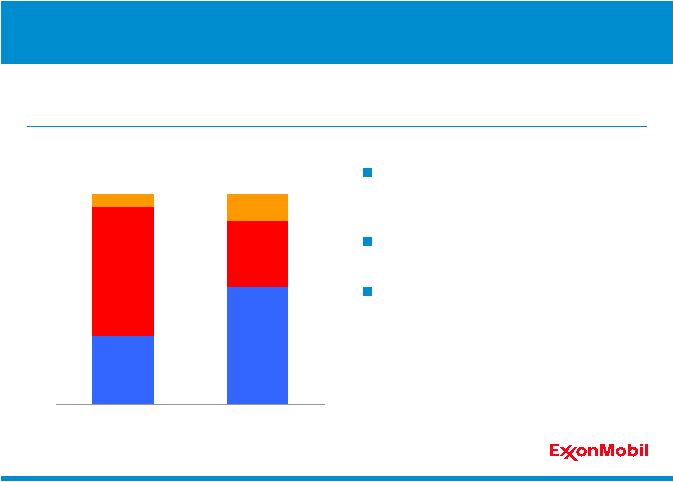
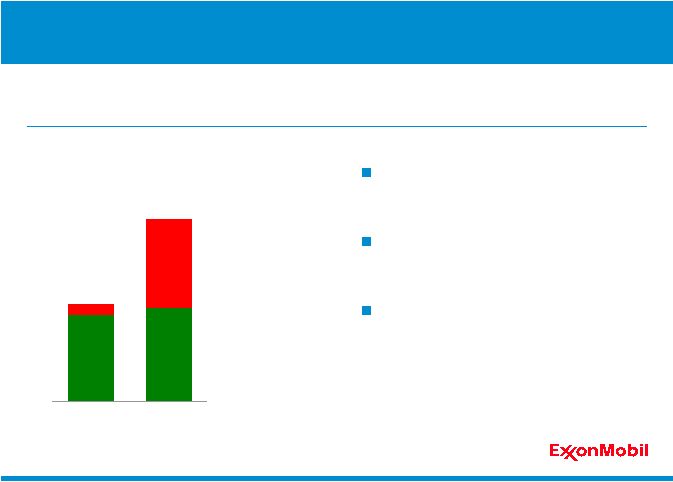 BOEB
Unconventional Resource Base
Unconventional
Gas and Light Oil
0
10
20
30
40
YE 2005
YE 2010
Heavy Oil /
Oil Sands
Almost 90 percent growth over 2005-
2010
Unconventional accounts for over 40
percent of total resource base
Gas growth balanced by strong
position in heavy oil / oil sands
ExxonMobil’s
global
unconventional
resource
base
of
almost
35
billion
oil-
equivalent
barrels
is
growing
and
includes
several
new
strategic
additions.
Unconventional Resource Base
88 |
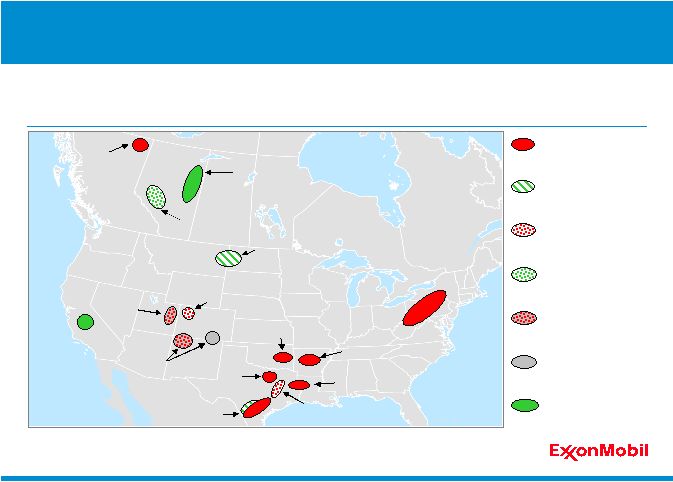 Shale Gas
Tight Oil
Tight Gas
CBM
Tight Gas / CBM
Heavy Oil /
Oil sands
Fayetteville
550K
Woodford
205K
Bakken
410K
San Juan/Raton
400K
Uinta
260K
Piceance
300K
Barnett
245K
Eagle Ford
120K
Freestone
290K
Haynesville/Bossier
240K
Athabasca
745K
Horn River
340K
Marcellus
390K
Cardium
235K
San Joaquin
Valley
122K
Shale Oil
(incl. liquids rich)
Unconventional –
North America
ExxonMobil’s North American unconventional resource base is diverse
by location and play type.
89 |
 Mcfd
0
50
100
150
200
250
Dec-08
Dec-09
Dec-10
0
10
20
30
Gross Op
Production*
Rigs
Mcfd
Haynesville Shale
0
50
100
150
200
250
300
Dec-08
Dec-09
Dec-10
0
10
20
30
Fayetteville Shale
Gross Op
Production*
Rigs
Rigs
Rigs
Mcfd
0
50
100
150
200
250
Dec-08
Dec-09
Dec-10
0
10
20
30
Gross Op
Production*
Rigs
Mcfd
Haynesville Shale
0
50
100
150
200
250
300
Dec-08
Dec-09
Dec-10
0
10
20
30
Fayetteville Shale
Gross Op
Production*
Rigs
Rigs
Rigs
Unconventional Gas Plays
ExxonMobil holds a leadership position in multiple unconventional plays
such as the Haynesville and Fayetteville shales.
Haynesville: increased production
four-fold in 2010
•
Hold 240,000 net acres
Fayetteville: production more than
doubled in 2010
•
Hold 550,000 net acres
2010 strategic additions:
•
Haynesville (Ellora)
•
Fayetteville (Petrohawk)
•
Continued leasing and minor
acquisitions
*
Represents
gross
operated
production
pre-
and
post-XTO
acquisition.
90 |
 91
Operational Excellence
0
10
20
30
40
50
'05
'06
'07
'08
'09
'10
Best practices in unconventional gas build value through higher recoveries
and increasing operational efficiency.
Source: Cumulative Production through May 2010, Powell Barnett
Shale Newsletter, 8/31/10.
Drilled 8 of 10 largest Cumulative
Production Wells in Barnett Shale
Drilling Days, Spud to Rig Release
Barnett Shale, 2005-2010
0
1
2
3
4
5
6
XOM well
Competitor well
BCF Produced |
 Unconventional Liquids Rich Plays
Strong acreage position
Drilling in Bakken/Three Forks with
potential to ramp-up
•
Hold 410,000 net acres
Delineating Eagle Ford position
•
Hold 120,000 net acres
Building position in other liquids-rich
plays
Unconventional liquids-rich plays such as the Eagle Ford and Bakken
provide upside value potential.
92 |
  XTO
Integration Attrition consistent with historic levels
Technology and expertise are key to
unlocking greater value
Consolidating activities to grow
operational capabilities
Creating significant long-term value
XTO’s experience and capabilities are further enhanced by leveraging
ExxonMobil’s global functional organization.
Research
Exploration
Gas Marketing
Drilling
Production
93 |
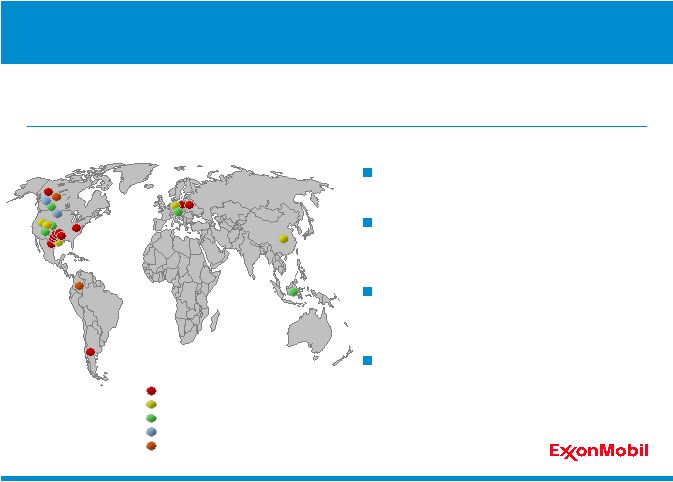 Argentina
Colombia
U.S.
Canada
Germany
Poland
China
Indonesia
Shale Gas
Tight Gas
Coal Bed Methane
Tight / Shale Oil
Heavy Oil / Oil Sands
Global Growth Opportunities
Diverse global portfolio
Access to greater than 10 million net
acres globally
Technology key to unlocking full
resource potential
Significant value creation through
sizeable long-life resources
ExxonMobil holds a leadership position in emerging global unconventional
plays.
94 |
 U.S. Unconventional
Production (2010-2020)
0.0
0.2
0.4
0.6
0.8
1.0
'10*
'12
'14
'16
'18
'20
Tight
CBM
Shale
MOEBD
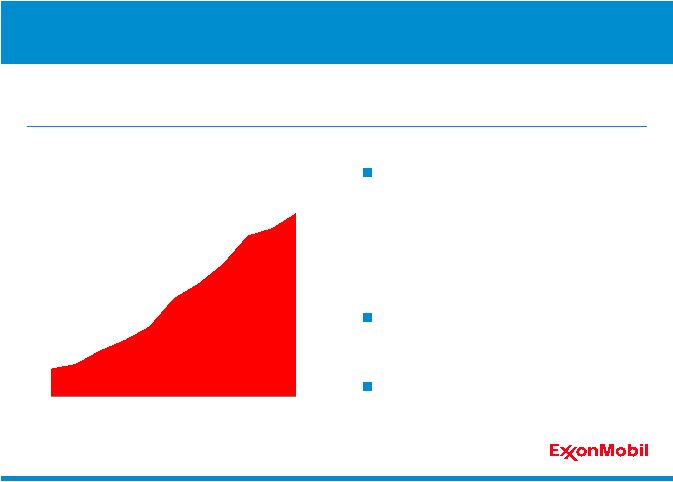
Value Creation –
Unconventional Gas and Oil
Unconventional gas and oil production has the potential to unlock significant
future value with strong volume growth.
100 Tcfe global resource base
~50,000 drillwell inventory in the U.S.
U.S. production doubles by 2020
Shale plays drive growth
* 2010 includes full-year XTO production.
95 |
 0.0
0.2
0.4
0.6
'10
'12
'14
'16
'18
'20
Heavy Oil
Oil Sands
Heavy Oil / Oil Sands Production
(2010-2020)
MOEBD
Value Creation -
Heavy Oil and Oil Sands
Extensive inventory of long-life projects provides growth in long-plateau
volumes.
18 BOEB heavy oil / oil sands
resource base
Over 500 percent growth in oil
sands production by 2020
Canadian oil sands drive growth
•
In-situ
•
Mining
96 |
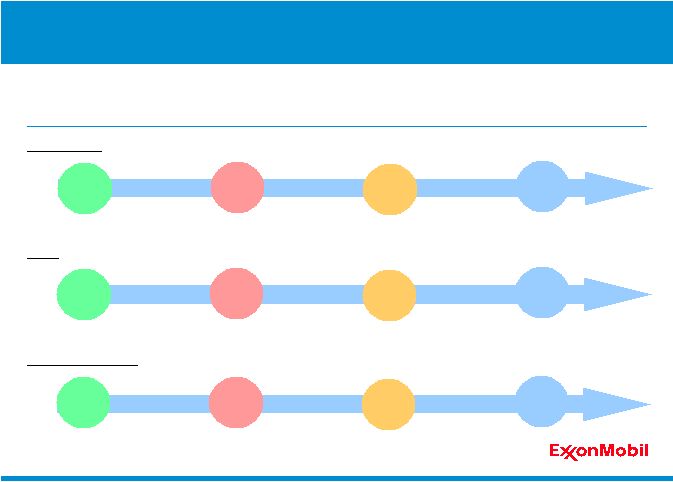 1995
2000
2005
2010
2000
2005
2010
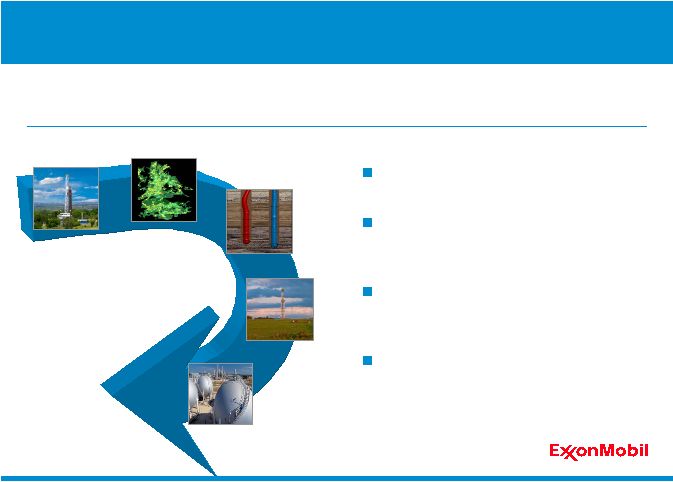
Unlocking Greater Value
Deepwater
Resources
Unconventional
Resources
Global Oil
Markets
Established
Markets
Deepwater
Technologies
Unconventional
Technologies
Leading
Deepwater
Capability
Leading
Unconventional
Capability
Superior value creation relies on high-quality resources, growth markets,
enabling technologies, and growing organizational capability.
Stranded Gas
Resources
Global LNG
Markets
Value Chain
Technologies
Leading
LNG
Capability
Deepwater
LNG
Unconventional
97 |
 Rex Tillerson
Chairman and CEO
Summary |
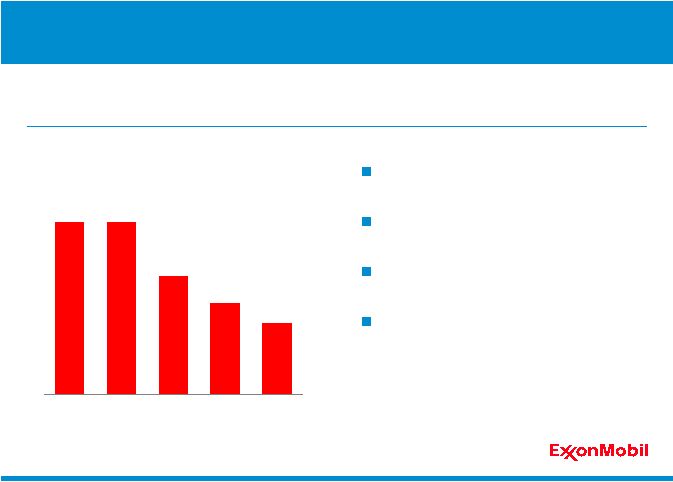
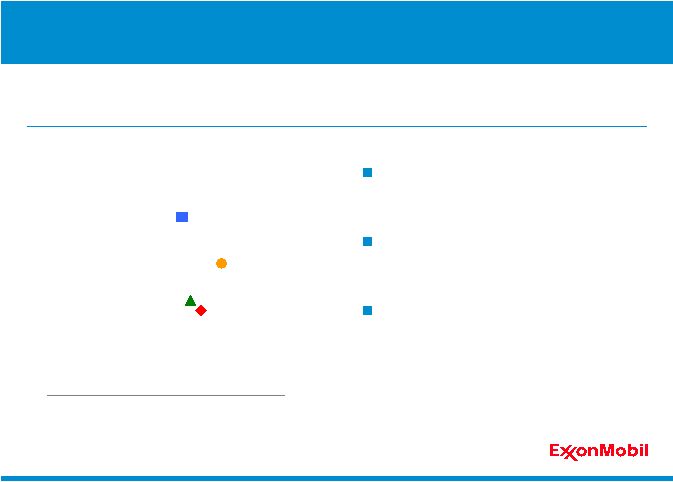
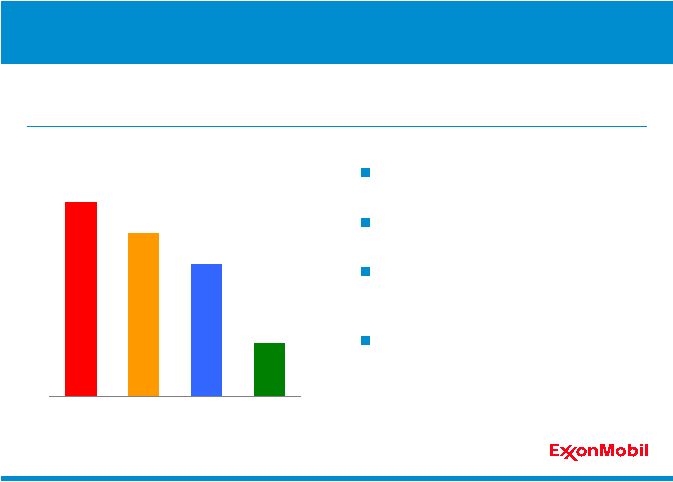
 0
3
6
9
12
20 Years
10 Years
5 Years
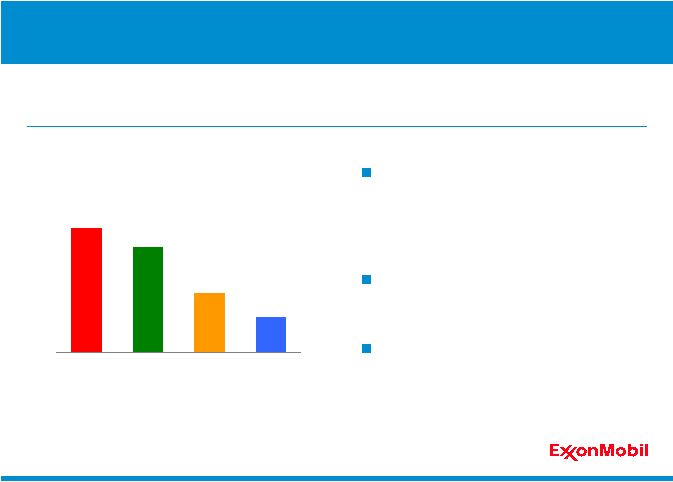
$K
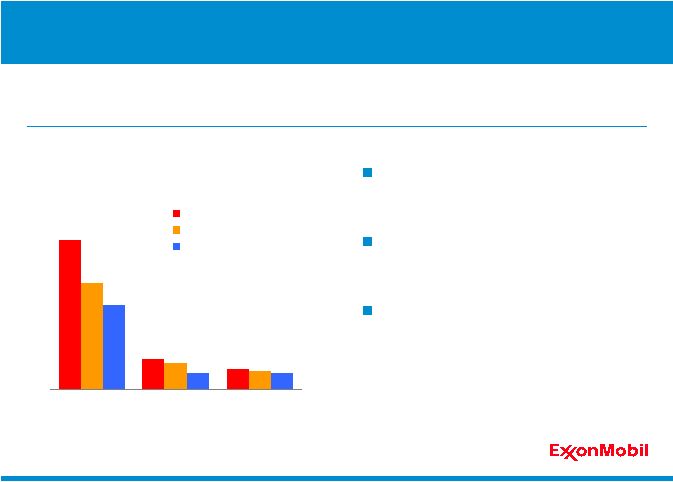
Shareholder Returns
Value of $1,000 Invested (as of YE 2010)
ExxonMobil
Competitor average*
S&P 500
Share Performance
ExxonMobil’s performance exceeds competitor average and S&P 500.
* RDS, BP, and CVX.
Financial results and stock market
returns best viewed over long-term
Performance consistent with
investment horizon
Supported by competitive
advantages and financial strength
99 |
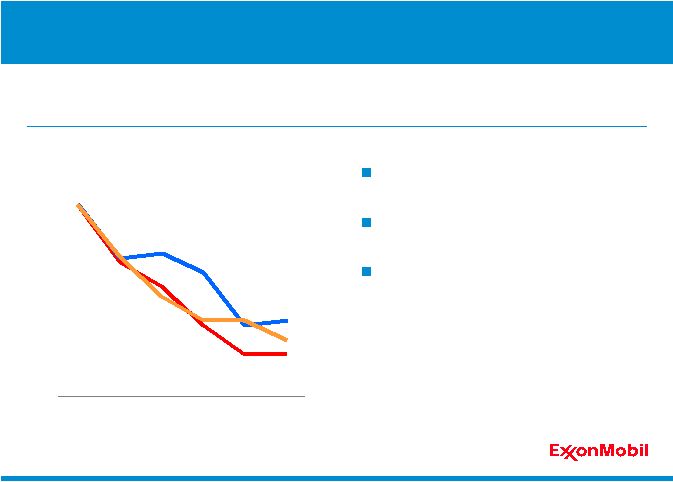
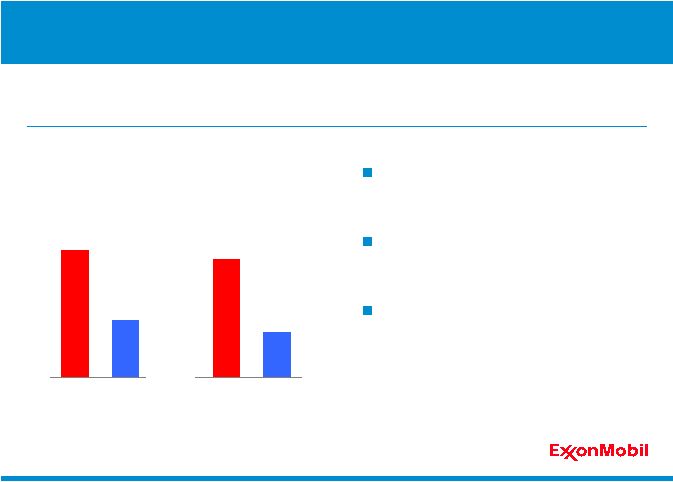
 0.8
0.9
1.0
1.1
1.2
1.3
'06
'07
'08
'09
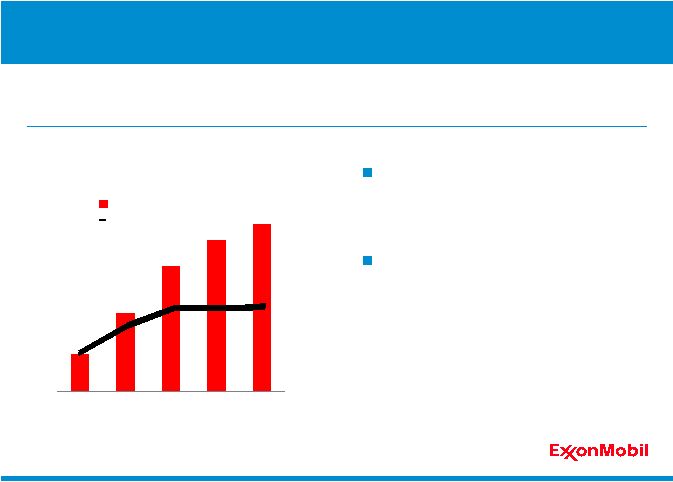
'10
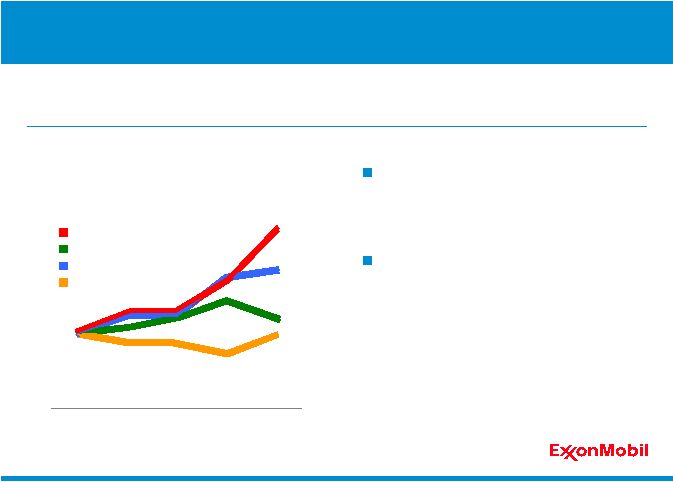
Production Growth per Share since 2006*
Indexed; 2006 = 100
Indexed Growth
XOM
BP
CVX
RDS
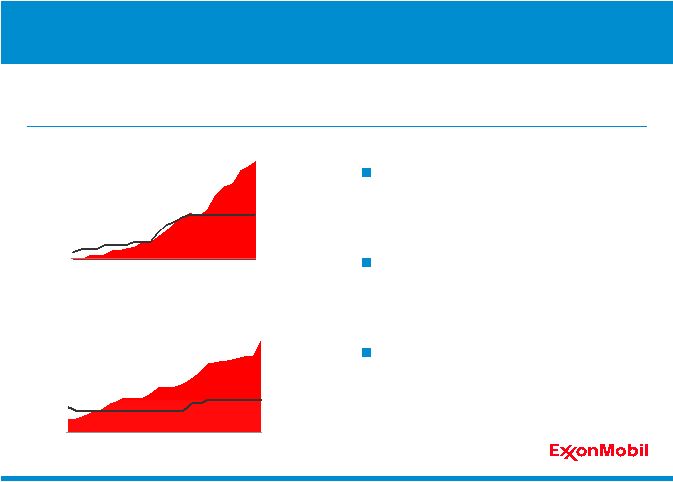
Increasing Ownership -
Production
Increasing production plus share
reductions yield strong growth in
production per share
Ahead of competition
* Competitor data estimated on a consistent basis with ExxonMobil and based on
public information. Share purchases have enhanced per share ownership of oil
and gas production. Annualized production growth per share of 6.3
percent. 100 |
 0.8
0.9
1.0
1.1
1.2
1.3
1.4
'06
'07
'08
'09
'10
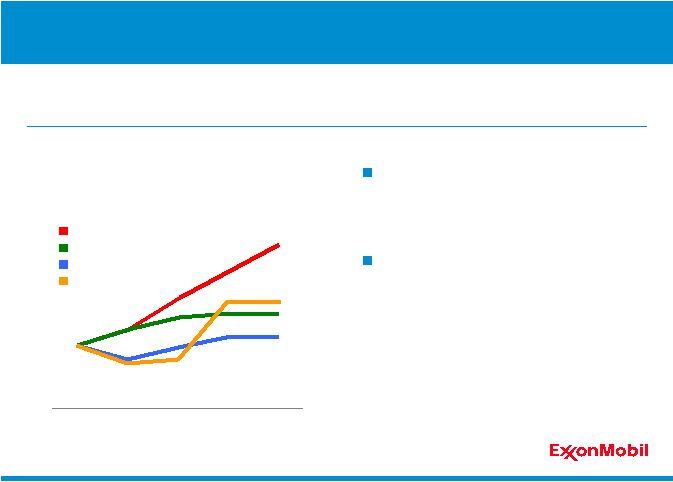
Reserves Growth per Share since 2006*
Indexed; 2006 = 100
Indexed Growth
XOM
BP
CVX
RDS
Increasing Ownership -
Reserves
Expanding reserve base plus share
reductions yield strong growth in
reserves per share
Ahead of competition
* Competitor data estimated on a consistent basis with ExxonMobil and based on
public information. **
Reserves
based
on
SEC
pricing
bases,
including
oil
sands
and
equity
companies.
2009
reserves
data used for competitors since 2010 data was not yet available.
Share purchases have enhanced per share ownership of oil and gas
reserves. Reserves per share increased 32 percent since 2006.
101 |
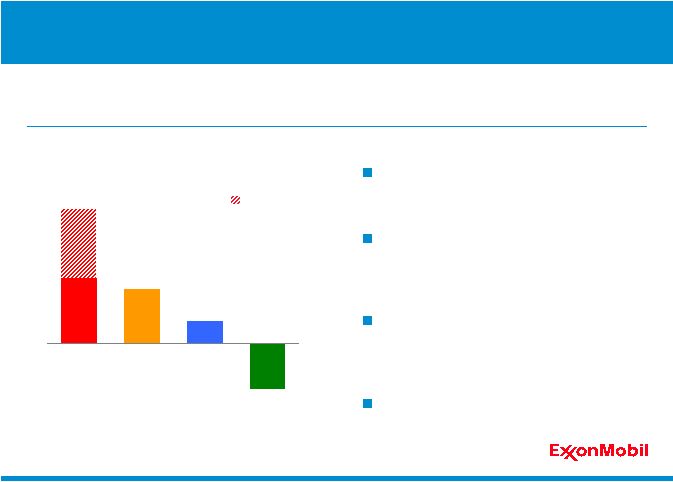
 0
2
4
6
8
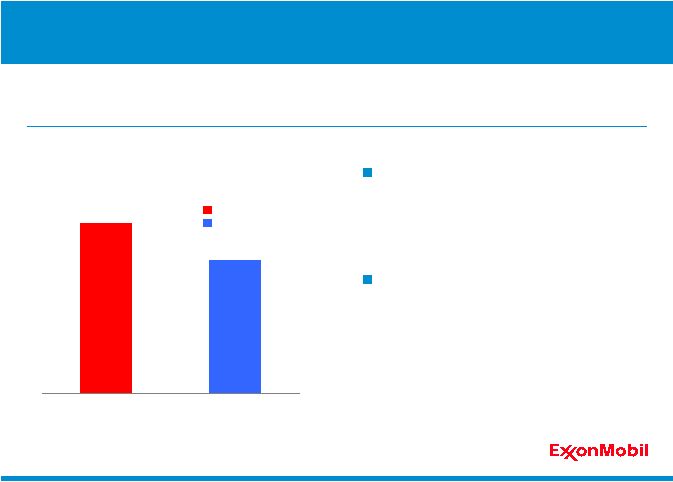
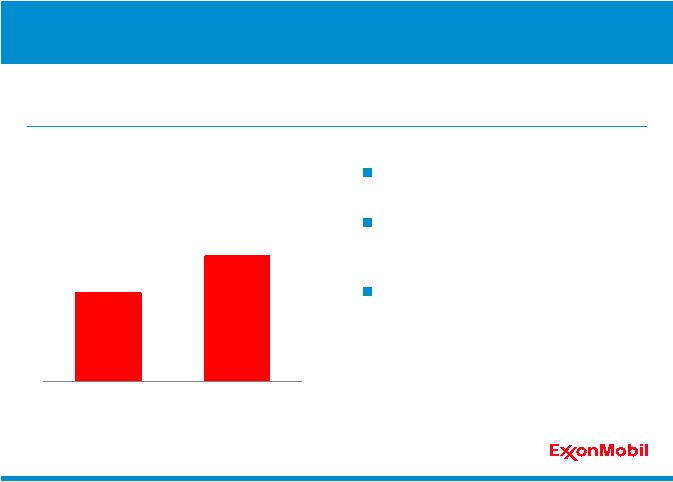
2010 EPS without Share
Reduction
2010 EPS
$ per share
Impact of Share Purchases since
Exxon and Mobil Merger on 2010 EPS
Value per Share
2010 EPS of $6.24 per share
EPS 42 percent higher than
without share purchases*
Ongoing benefit to shareholders
Earnings per share is enhanced by a robust share purchase program.
* Average shares outstanding reduced by 29.4 percent since beginning of 2001.
102 |
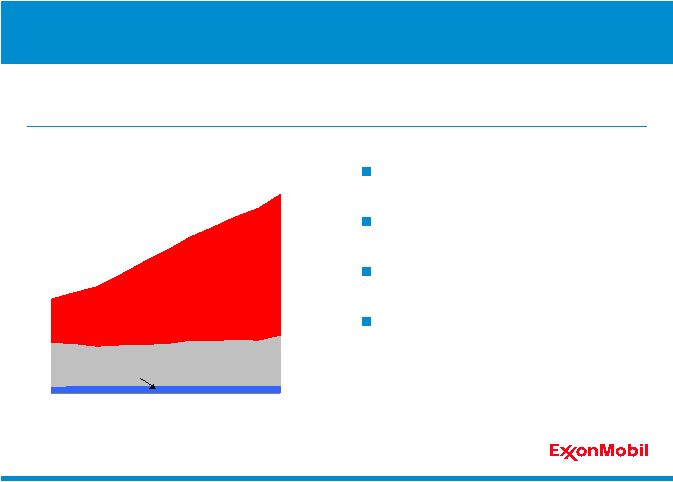
 0
10
20
30
40
'09
'10
'11
'12 - '15
$B
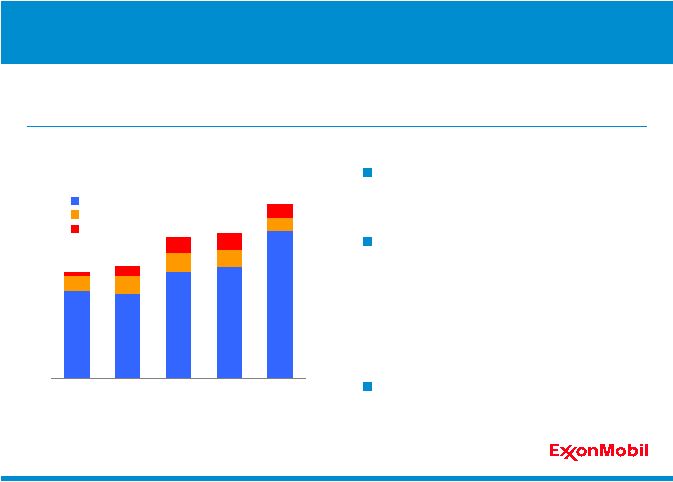
Capex by Business Line
Estimate
Upstream
Upstream
Downstream
Downstream
Chemical / Other
Chemical / Other
Estimate Range
Investment Plan
ExxonMobil
is
committed
to
investing
through
the
business
cycle.
Expect
to
invest
$33
to
$37
billion
per
year
through
2015.
Progressing large inventory of high-
quality projects
Aggressively pursuing cost
reduction opportunities
Delivering advantaged projects
103 |
 0
1
2
3
4
5
'09
'10
'11
'12
'13
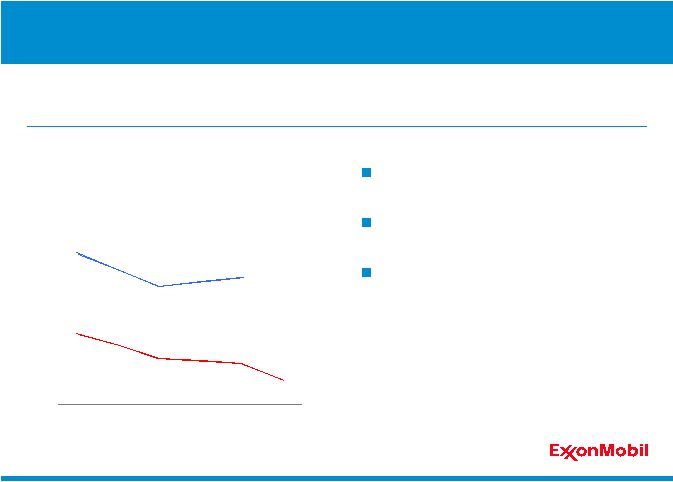
Total Production Outlook
MOEBD, net
2010 Outlook
2011 Outlook (excluding XTO)
Upstream Production Outlook
Production outlook, excluding XTO, remains unchanged at 2 to 3 percent
growth per year from 2009 to 2013.
2010 outlook assumed 3 to 4 percent
growth from 2009 to 2010
2010 production growth of 6 percent
exceeded outlook
2009 to 2013 outlook remains
unchanged
104 |
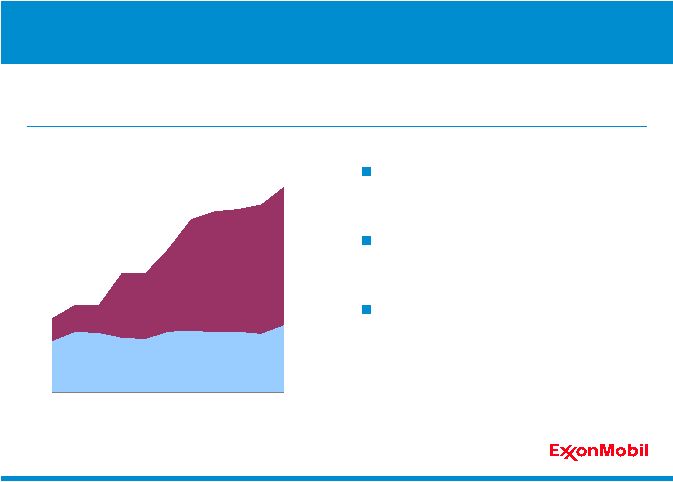
 0
1
2
3
4
5
'09
'10
'11
'12
'13
'14
Total Production Outlook*
MOEBD, net
Project Volumes
Base Production
Upstream Production Outlook
Production growth delivered by strong base performance, high-quality
projects, and new resource potential.
* Excludes divestments and OPEC quota effects.
Volumes growth remains strong
•
2010-2011: 3 to 4 percent
•
2009-2014: 4 to 5 percent
Decline rate of 3 percent
•
Compared to historic rate of 5 to 6
percent
•
Unconventional and long-plateau
volumes mitigate decline
105 |
 0
1
2
3
4
5
'09
'10
'11
'12
'13
'14
Total Production Outlook*
MOEBD, net
Gas
Liquids
Upstream Production Outlook
ExxonMobil has a balanced portfolio with strong contributions from both
liquids and natural gas.
*
Excludes
divestments
and
OPEC
quota
effects
.
Liquids growth averages 2 to 3
percent driven by major projects
Increasing level of long-plateau
volumes
106 |
 ExxonMobil Strengths
Superior Financial and Operating Performance
Balanced Portfolio Quality
Disciplined Investing
High-Impact Technologies
Operational Excellence
Global Integration
ExxonMobil’s strengths and competitive advantages sustain long-term
success.
107 |
 Sum
of the Parts Plus 108
ExxonMobil is an industry leader across the business, and competitive
advantages create value greater than the sum of the individual parts.
Largest IOC Producer of Liquids
Leader in LNG Value Chain
Largest Global Refiner
Highest-Return
Chemical Company
among Peers
High-Quality, Low-Cost Oil Sands
Premier Unconventional Gas Company
No. 1 Supplier of Lube Basestocks |