


2009
UNITED STATES
SECURITIES AND EXCHANGE COMMISSION
WASHINGTON, D.C. 20549
FORM 10-K
x ANNUAL REPORT PURSUANT TO SECTION 13 OR 15(d) OF
THE SECURITIES EXCHANGE ACT OF 1934
For the fiscal year ended December 31, 2009
or
¨ TRANSITION REPORT PURSUANT TO SECTION 13 OR 15(d) OF
THE SECURITIES EXCHANGE ACT OF 1934
For the transition period from to
Commission File Number 1-2256
EXXON MOBIL CORPORATION
(Exact name of registrant as specified in its charter)
| NEW JERSEY (State or other jurisdiction of |
13-5409005 (I.R.S. Employer |
5959 LAS COLINAS BOULEVARD, IRVING, TEXAS 75039-2298
(Address of principal executive offices) (Zip Code)
(972) 444-1000
(Registrant’s telephone number, including area code)
Securities registered pursuant to Section 12(b) of the Act:
| Title of Each Class |
Name of Each Exchange on Which Registered | |
| Common Stock, without par value (4,721,273,113 shares |
New York Stock Exchange | |
| Registered securities guaranteed by Registrant: | ||
| SeaRiver Maritime Financial Holdings, Inc. |
||
| Twenty-Five Year Debt Securities due October 1, 2011 |
New York Stock Exchange |
Indicate by check mark if the registrant is a well-known seasoned issuer, as defined in Rule 405 of the Securities Act. Yes ü No
Indicate by check mark if the registrant is not required to file reports pursuant to Section 13 or Section 15(d) of the Act. Yes No ü
Indicate by check mark whether the registrant (1) has filed all reports required to be filed by Section 13 or 15(d) of the Securities Exchange Act of 1934 during the preceding 12 months (or for such shorter period that the registrant was required to file such reports), and (2) has been subject to such filing requirements for the past 90 days. Yes ü No
Indicate by check mark whether the registrant has submitted electronically and posted on its corporate Web site, if any, every Interactive Data File required to be submitted and posted pursuant to Rule 405 of Regulation S-T during the preceding 12 months (or for such shorter period that the registrant was required to submit and post such files). Yes ü No
Indicate by check mark if disclosure of delinquent filers pursuant to Item 405 of Regulation S-K is not contained herein, and will not be contained, to the best of registrant’s knowledge, in definitive proxy or information statements incorporated by reference in Part III of this Form 10-K or any amendment to this Form 10-K. ü
Indicate by check mark whether the registrant is a large accelerated filer, an accelerated filer, a non-accelerated filer or a smaller reporting company. See the definitions of “large accelerated filer,” “accelerated filer,” and “smaller reporting company” in Rule 12b-2 of the Exchange Act.
Large accelerated filer ü Accelerated filer
Non-accelerated filer Smaller reporting company
Indicate by check mark whether the registrant is a shell company (as defined by Rule 12b-2 of the Act). Yes No ü
The aggregate market value of the voting stock held by non-affiliates of the registrant on June 30, 2009, the last business day of the registrant’s most recently completed second fiscal quarter, based on the closing price on that date of $69.91 on the New York Stock Exchange composite tape, was in excess of $335 billion.
Documents Incorporated by Reference:
None
FORM 10-K
FOR THE FISCAL YEAR ENDED DECEMBER 31, 2009
TABLE OF CONTENTS
| Page Number | ||||
| PART I | ||||
| Item 1. | 1 | |||
| Item 1A. | 2 | |||
| Item 1B. | 5 | |||
| Item 2. | 6 | |||
| Item 3. | 31 | |||
| Item 4. | 31 | |||
| Executive Officers of the Registrant [pursuant to Instruction 3 to Regulation S-K, Item 401(b)] | 32 | |||
| PART II | ||||
| Item 5. | 33 | |||
| Item 6. | 34 | |||
| Item 7. | Management’s Discussion and Analysis of Financial Condition and Results of Operations |
34 | ||
| Item 7A. | 34 | |||
| Item 8. | 34 | |||
| Item 9. | Changes in and Disagreements With Accountants on Accounting and Financial Disclosure | 35 | ||
| Item 9A. | Controls and Procedures | 35 | ||
| Item 9B. | Other Information | 35 | ||
| PART III | ||||
| Item 10. | 36 | |||
| Item 11. | 36 | |||
| Item 12. | Security Ownership of Certain Beneficial Owners and Management and Related Stockholder Matters |
37 | ||
| Item 13. | Certain Relationships and Related Transactions, and Director Independence |
37 | ||
| Item 14. | 38 | |||
| PART IV | ||||
| Item 15. | 38 | |||
| Financial Section |
39 | |||
| Proxy Information Section | 107 | |||
| Signatures | 148 | |||
| Index to Exhibits | 150 | |||
| Exhibit 12 — Computation of Ratio of Earnings to Fixed Charges | ||||
| Exhibits 31 and 32 — Certifications | ||||
PART I
Exxon Mobil Corporation was incorporated in the State of New Jersey in 1882. Divisions and affiliated companies of ExxonMobil operate or market products in the United States and most other countries of the world. Their principal business is energy, involving exploration for, and production of, crude oil and natural gas, manufacture of petroleum products and transportation and sale of crude oil, natural gas and petroleum products. ExxonMobil is a major manufacturer and marketer of commodity petrochemicals, including olefins, aromatics, polyethylene and polypropylene plastics and a wide variety of specialty products. ExxonMobil also has interests in electric power generation facilities. Affiliates of ExxonMobil conduct extensive research programs in support of these businesses.
Exxon Mobil Corporation has several divisions and hundreds of affiliates, many with names that include ExxonMobil, Exxon, Esso or Mobil. For convenience and simplicity, in this report the terms ExxonMobil, Exxon, Esso and Mobil, as well as terms like Corporation, Company, our, we and its, are sometimes used as abbreviated references to specific affiliates or groups of affiliates. The precise meaning depends on the context in question.
On December 13, 2009, ExxonMobil and XTO Energy Inc. entered into an Agreement and Plan of Merger. Under the terms of the agreement, (i) each share of XTO Energy common stock will be converted into the right to receive 0.7098 shares of common stock of the Corporation (the “Exchange Ratio”) and (ii) all outstanding XTO Energy options will be converted into options to purchase shares of common stock of the Corporation, with the number of shares of XTO Energy common stock subject to the option, and the option’s exercise price, adjusted based on the Exchange Ratio. The transaction includes XTO Energy debt, which was approximately $10.5 billion at December 31, 2009. Consummation of the Merger is subject to regulatory clearance, XTO Energy stockholder approval, and other customary conditions.
Throughout ExxonMobil’s businesses, new and ongoing measures are taken to prevent and minimize the impact of our operations on air, water and ground. These include a significant investment in refining infrastructure and technology to manufacture clean fuels as well as projects to monitor and reduce nitrogen oxide, sulfur oxide, and greenhouse gas emissions and expenditures for asset retirement obligations. ExxonMobil’s 2009 worldwide environmental expenditures for all such preventative and remediation steps, including ExxonMobil’s share of equity company expenditures, were about $5.1 billion, of which $2.5 billion were capital expenditures and $2.6 billion were included in expenses. The total cost for such activities is expected to remain in this range in 2010 and 2011 (with capital expenditures approximately 45 percent of the total).
The energy and petrochemical industries are highly competitive. There is competition within the industries and also with other industries in supplying the energy, fuel and chemical needs of both industrial and individual consumers. The Corporation competes with other firms in the sale or purchase of needed goods and services in many national and international markets and employs all methods of competition which are lawful and appropriate for such purposes.
Operating data and industry segment information for the Corporation are contained in the Financial Section of this report under the following: “Quarterly Information”, “Note 17: Disclosures about Segments and Related Information” and “Operating Summary”. Information on oil and gas reserves is contained in the “Oil and Gas Reserves” part of the “Supplemental Information on Oil and Gas Exploration and Production Activities” portion of the Financial Section of this report.
ExxonMobil has a long-standing commitment to the development of proprietary technology. We have a wide array of research programs designed to meet the needs identified in each of our business
1
segments. Information on Company-sponsored research and development spending is contained in “Note 3: Miscellaneous Financial Information” of the Financial Section of this report. ExxonMobil held approximately 11 thousand active patents worldwide at the end of 2009. For technology licensed to third parties, revenues totaled approximately $88 million in 2009. Although technology is an important contributor to the overall operations and results of our Company, the profitability of each business segment is not dependent on any individual patent, trade secret, trademark, license, franchise or concession.
The number of regular employees was 80.7 thousand, 79.9 thousand and 80.8 thousand at years ended 2009, 2008 and 2007, respectively. Regular employees are defined as active executive, management, professional, technical and wage employees who work full time or part time for the Corporation and are covered by the Corporation’s benefit plans and programs. Regular employees do not include employees of the company-operated retail sites (CORS). The number of CORS employees was 22.0 thousand, 24.8 thousand and 26.3 thousand at years ended 2009, 2008 and 2007, respectively.
Information concerning the source and availability of raw materials used in the Corporation’s business, the extent of seasonality in the business, the possibility of renegotiation of profits or termination of contracts at the election of governments and risks attendant to foreign operations may be found in “Item 1A–Risk Factors” and “Item 2–Properties” in this report.
ExxonMobil maintains a website at exxonmobil.com. Our annual report on Form 10-K, quarterly reports on Form 10-Q, current reports on Form 8-K and any amendments to those reports filed or furnished pursuant to Section 13(a) of the Securities Exchange Act of 1934 are made available through our website as soon as reasonably practical after we electronically file or furnish the reports to the Securities and Exchange Commission. Also available on the Corporation’s website are the Company’s Corporate Governance Guidelines and Code of Ethics and Business Conduct, as well as the charters of the audit, compensation and nominating committees of the Board of Directors. Information on our website is not incorporated into this report.
| Item 1A. | Risk Factors. |
ExxonMobil’s financial and operating results are subject to a variety of risks inherent in the global oil, gas, and petrochemical businesses. Many of these risk factors are not within the Company’s control and could adversely affect our business, our financial and operating results or our financial condition. We discuss some of these risks in more detail below.
Supply and Demand.
The oil, gas, and petrochemical businesses are fundamentally commodity businesses. This means ExxonMobil’s operations and earnings may be significantly affected by changes in oil, gas and petrochemical prices and by changes in margins on refined products. Oil, gas, petrochemical and product prices and margins in turn depend on local, regional and global events or conditions that affect supply and demand for the relevant commodity.
Economic conditions. The demand for energy and petrochemicals correlates closely with general economic growth rates. The occurrence of recessions or other periods of low or negative economic growth will typically have a direct adverse impact on our results. Other factors that affect general economic conditions in the world or in a major region, such as changes in population growth rates or periods of civil unrest, also impact the demand for energy and petrochemicals. Economic conditions that impair the functioning of financial markets and institutions also pose risks to ExxonMobil, including risks to the safety of our financial assets and to the ability of our partners and customers to fulfill their commitments to ExxonMobil.
2
Other demand-related factors. Other factors that may affect the demand for oil, gas and petrochemicals, and therefore impact our results, include technological improvements in energy efficiency; seasonal weather patterns, which affect the demand for energy associated with heating and cooling; increased competitiveness of alternative energy sources that have so far generally not been competitive with oil and gas without the benefit of government subsidies or mandates; and changes in technology or consumer preferences that alter fuel choices, such as toward alternative fueled vehicles.
Other supply-related factors. Commodity prices and margins also vary depending on a number of factors affecting supply. For example, increased supply from the development of new oil and gas supply sources and technologies to enhance recovery from existing sources tend to reduce commodity prices to the extent such supply increases are not offset by commensurate growth in demand. Similarly, increases in industry refining or petrochemical manufacturing capacity tend to reduce margins on the affected products. World oil, gas, and petrochemical supply levels can also be affected by factors that reduce available supplies, such as adherence by member countries to OPEC production quotas and the occurrence of wars, hostile actions, or natural disasters that may disrupt supplies. Technological change can also alter the relative costs for competitors to find, produce, and refine oil and gas and to manufacture petrochemicals.
Other market factors. ExxonMobil’s business results are also exposed to potential negative impacts due to changes in currency exchange rates, interest rates, inflation, and other local or regional market conditions. We generally do not use financial instruments to hedge market exposures.
Government and Political Factors.
ExxonMobil’s results can be adversely affected by political or regulatory developments affecting our operations.
Access limitations. A number of countries limit access to their oil and gas resources, or may place resources off-limits from development altogether. Restrictions on foreign investment in the oil and gas sector tend to increase in times of high commodity prices, when national governments may have less need of outside sources of private capital. Many countries also restrict the import or export of certain products based on point of origin.
Restrictions on doing business. As a U.S. company, ExxonMobil is subject to laws prohibiting U.S. companies from doing business in certain countries, or restricting the kind of business that may be conducted. Such restrictions may provide a competitive advantage to our non-U.S. competitors unless their own home countries impose comparable restrictions.
Lack of legal certainty. Some countries in which we do business lack well-developed legal systems, or have not yet adopted clear regulatory frameworks for oil and gas development. Lack of legal certainty exposes our operations to increased risk of adverse or unpredictable actions by government officials, and also makes it more difficult for us to enforce our contracts. In some cases these risks can be partially offset by agreements to arbitrate disputes in an international forum, but the adequacy of this remedy may still depend on the local legal system to enforce an award.
Regulatory and litigation risks. Even in countries with well-developed legal systems where ExxonMobil does business, we remain exposed to changes in law (including changes that result from international treaties and accords) that could adversely affect our results, such as increases in taxes or government royalty rates (including retroactive claims); price controls; changes in environmental regulations or other laws that increase our cost of compliance; adoption of regulations mandating the use of alternative fuels or uncompetitive fuel components; government actions to cancel contracts or renegotiate terms unilaterally; and expropriation. Legal remedies available to compensate us for
3
expropriation or other takings may be inadequate. We also may be adversely affected by the outcome of litigation or other legal proceedings, especially in countries such as the United States in which very large and unpredictable punitive damage awards may occur.
Security concerns. Successful operation of particular facilities or projects may be disrupted by civil unrest, acts of sabotage or terrorism, and other local security concerns. Such concerns may require us to incur greater costs for security or to shut down operations for a period of time.
Climate change and greenhouse gas restrictions. Due to concern over the risk of climate change, a number of countries have adopted, or are considering the adoption of, regulatory frameworks to reduce greenhouse gas emissions. These include adoption of cap and trade regimes, carbon taxes, increased efficiency standards, and incentives or mandates for renewable energy. These requirements could make our products more expensive and reduce demand for hydrocarbons, as well as shifting hydrocarbon demand toward relatively lower-carbon sources such as natural gas. Current and pending greenhouse gas regulations may also increase our compliance costs, such as for monitoring or sequestering emissions.
Government sponsorship of alternative energy. Many governments are providing tax advantages and other subsidies and mandates to make alternative energy sources more competitive against oil and gas. Governments are also promoting research into new technologies to reduce the cost and increase the scalability of alternative energy sources. We are conducting our own research efforts into alternative energy, such as through sponsorship of the Global Climate and Energy Project at Stanford University and research into hydrogen fuel cells and fuel-producing algae. Our future results may depend in part on the success of our research efforts and on our ability to adapt and apply the strengths of our current business model to providing the competitive energy products of the future. See “Management Effectiveness” below.
Management Effectiveness.
In addition to external economic and political factors, our future business results also depend on our ability to manage successfully those factors that are at least in part within our control. The extent to which we manage these factors will impact our performance relative to competition.
Exploration and development program. Our ability to maintain and grow our oil and gas production depends on the success of our exploration and development efforts. Among other factors, we must continuously improve our ability to identify the most promising resource prospects and apply our project management expertise to bring discovered resources on line on schedule.
Project management. The success of ExxonMobil’s Upstream, Downstream, and Chemical businesses depends on complex, long-term, capital intensive projects. These projects in turn require a high degree of project management expertise to maximize efficiency. Specific factors that can affect the performance of major projects include our ability to: negotiate successfully with joint venturers, partners, governments, suppliers, customers, or others; model and optimize reservoir performance; develop markets for project outputs, whether through long-term contracts or the development of effective spot markets; manage changes in operating conditions and costs, including costs of third party equipment or services such as drilling rigs and shipping; prevent, to the extent possible, and respond effectively to unforeseen technical difficulties that could delay project startup or cause unscheduled project downtime; and influence the performance of project operators where ExxonMobil does not perform that role.
Operational efficiency. An important component of ExxonMobil’s competitive performance, especially given the commodity-based nature of many of our businesses, is our ability to operate
4
efficiently, including our ability to manage expenses and improve production yields on an ongoing basis. This requires continuous management focus, including technology improvements, cost control, productivity enhancements and regular reappraisal of our asset portfolio.
Research and development. To maintain our competitive position, especially in light of the technological nature of our businesses and the need for continuous efficiency improvement, ExxonMobil’s research and development organizations must be successful and able to adapt to a changing market and policy environment.
Safety, business controls, and environmental risk management. Our results depend on management’s ability to minimize the inherent risks of oil, gas, and petrochemical operations and to control effectively our business activities. We apply rigorous management systems and continuous focus to workplace safety and to avoiding spills or other adverse environmental events. For example, we work to minimize spills through a combined program of effective operations integrity management, ongoing upgrades, key equipment replacements, and comprehensive inspection and surveillance. Similarly, we are implementing cost-effective new technologies and adopting new operating practices to reduce air emissions, not only in response to government requirements but also to address community priorities. We also maintain a disciplined framework of internal controls and apply a controls management system for monitoring compliance with this framework. Substantial liabilities and other adverse impacts could result if our management systems and controls do not function as intended.
Preparedness. Our operations may be disrupted by severe weather events, natural disasters, and similar events. For example, hurricanes may damage our offshore production facilities or coastal refining and petrochemical plants in vulnerable areas. Our ability to mitigate the adverse impacts of these events depends in part upon the effectiveness of our rigorous disaster preparedness and business continuity planning.
Projections, estimates and descriptions of ExxonMobil’s plans and objectives included or incorporated in Items 1, 1A, 2, 7 and 7A of this report are forward-looking statements. Actual future results, including project completion dates, production rates, capital expenditures, costs and business plans could differ materially due to, among other things, the factors discussed above and elsewhere in this report.
| Item 1B. | Unresolved Staff Comments. |
None.
5
Information with regard to oil and gas producing activities follows:
1. Disclosure of Reserves
A. Summary of Oil and Gas Reserves at Year-End 2009
The table below summarizes the oil-equivalent proved reserves in each geographic area and by product type for consolidated subsidiaries and equity companies. The Corporation has reported proved reserves on the basis of the average of the first-day-of-the-month price for each month during the last 12-month period. Gas is converted to an oil-equivalent basis at six million cubic feet per one thousand barrels. No major discovery or other favorable or adverse event has occurred since December 31, 2009, that would cause a significant change in the estimated proved reserves as of that date.
| Liquids(1) | Bitumen | Synthetic Oil |
Natural Gas |
Oil-Equivalent Basis | ||||||
| (million bbls) | (million bbls) |
(million bbls) | (billion cubic ft) |
(million bbls) | ||||||
| Proved Reserves |
||||||||||
| Developed |
||||||||||
| Consolidated Subsidiaries |
||||||||||
| United States |
1,211 | — | — | 7,492 | 2,460 | |||||
| Canada/South America |
152 | 468 | 691 | 1,200 | 1,511 | |||||
| Europe |
376 | — | — | 3,920 | 1,029 | |||||
| Africa |
1,122 | — | — | 739 | 1,245 | |||||
| Asia Pacific/Middle East |
1,335 | — | — | 8,351 | 2,727 | |||||
| Russia/Caspian |
86 | — | — | 318 | 139 | |||||
| Total Consolidated |
4,282 | 468 | 691 | 22,020 | 9,111 | |||||
| Equity Companies |
||||||||||
| United States |
279 | — | — | 90 | 294 | |||||
| Europe |
10 | — | — | 8,862 | 1,487 | |||||
| Asia Pacific/Middle East |
1,053 | — | — | 16,978 | 3,883 | |||||
| Russia/Caspian |
555 | — | — | 821 | 692 | |||||
| Total Equity Company |
1,897 | — | — | 26,751 | 6,356 | |||||
| Total Developed |
6,179 | 468 | 691 | 48,771 | 15,467 | |||||
| Undeveloped |
||||||||||
| Consolidated Subsidiaries |
||||||||||
| United States |
405 | — | — | 4,196 | 1,104 | |||||
| Canada/South America |
20 | 1,587 | — | 168 | 1,635 | |||||
| Europe |
111 | — | — | 803 | 245 | |||||
| Africa |
785 | — | — | 181 | 815 | |||||
| Asia Pacific/Middle East |
311 | — | — | 6,665 | 1,422 | |||||
| Russia/Caspian |
555 | — | — | 409 | 623 | |||||
| Total Consolidated |
2,187 | 1,587 | — | 12,422 | 5,844 | |||||
| Equity Companies |
||||||||||
| United States |
77 | — | — | 24 | 81 | |||||
| Europe |
20 | — | — | 2,588 | 451 | |||||
| Asia Pacific/Middle East |
195 | — | — | 3,595 | 794 | |||||
| Russia/Caspian |
247 | — | — | 607 | 348 | |||||
| Total Equity Company |
539 | — | — | 6,814 | 1,674 | |||||
| Total Undeveloped |
2,726 | 1,587 | — | 19,236 | 7,518 | |||||
| Total Proved Reserves |
8,905 | 2,055 | 691 | 68,007 | 22,985 | |||||
| (1) | Liquids includes crude, condensate and natural gas liquids. |
6
In the preceding reserves information, consolidated subsidiary and equity company reserves are reported separately. However, the Corporation operates its business with the same view of equity company reserves as it has for reserves from consolidated subsidiaries.
The Corporation’s overall volume capacity outlook, based on projects coming on stream as anticipated, is for production capacity to grow over the period 2010-2014. However, actual volumes will vary from year to year due to the timing of individual project start-ups, operational outages, reservoir performance, regulatory changes, asset sales, weather events, price effects on production sharing contracts and other factors as described in Item 1A—Risk Factors of this report.
The estimation of proved reserves, which is based on the requirement of reasonable certainty, is an ongoing process based on rigorous technical evaluations, commercial and market assessments and detailed analysis of well information such as flow rates and reservoir pressure declines. Furthermore, the Corporation only records proved reserves for projects which have received significant funding commitments by management made toward the development of the reserves. Although the Corporation is reasonably certain that proved reserves will be produced, the timing and amount recovered can be affected by a number of factors including completion of development projects, reservoir performance, regulatory approvals and significant changes in projections of long-term oil and gas price levels.
B. Technologies Used in Establishing Proved Reserves Additions in 2009
Additions to ExxonMobil’s proved reserves in 2009 were based on estimates generated through the integration of available and appropriate data, utilizing well established technologies that have been demonstrated in the field to yield repeatable and consistent results.
Data used in these integrated assessments included information obtained directly from the subsurface via wellbores, such as well logs, reservoir core samples, fluid samples, static and dynamic pressure information, production test data, and surveillance and performance information. The data utilized also included subsurface information obtained through indirect measurements including high-quality 2-D and 3-D seismic data, calibrated with available well control. Where applicable, surface geological information was also utilized. The tools used to interpret the data included proprietary seismic processing software, proprietary reservoir modeling and simulation software and commercially available data analysis packages.
In some circumstances, where appropriate analog reservoirs were available, reservoir parameters from these analogs were used to increase the quality of and confidence in the reserves estimates.
C. Qualifications of Reserves Technical Oversight Group and Internal Controls over Proved Reserves
ExxonMobil has a dedicated Reserves Technical Oversight group that is separate from the operating organization. Primary responsibilities of this group include oversight of the reserves estimation process for compliance with Securities and Exchange Commission (SEC) rules and regulations, review of annual changes in reserves estimates, and the reporting of ExxonMobil’s proved reserves. This group also maintains the official company reserves estimates for ExxonMobil’s proved reserves of crude and natural gas liquids, bitumen, synthetic oil and natural gas. In addition, the group provides training to personnel involved in the reserves estimation and reporting process within ExxonMobil and its affiliates. The group is managed by and staffed with individuals that have an average of more than 20 years of technical experience in the petroleum industry, including expertise in the classification and categorization of reserves under the SEC guidelines. This group includes several individuals who hold advanced degrees in either Engineering or Geology, as well as individuals who hold Bachelor’s degrees in various technical disciplines. Several members of the group hold professional registrations in their field of expertise and several have served on the Oil and Gas Reserves Committee of the Society of Petroleum Engineers.
7
The Reserves Technical Oversight group maintains a central computerized database containing the official company global reserves estimates and production data. Appropriate controls, including limitations on database access and update capabilities, are in place to ensure data integrity within this central computerized database. An annual review of the system’s controls is performed by internal audit. Key components of the reserves estimation process include technical evaluations and analysis of well and field performance and a rigorous peer review. No changes may be made to the reserves estimates in the central database, including additions of any new initial reserves estimates or subsequent revisions, unless these changes have been thoroughly reviewed and evaluated by duly authorized personnel within the operating organization. In addition, changes to reserves estimates that exceed certain thresholds require further review and approval of the appropriate level of management within the operating organization before the changes may be made in the central database. Endorsement by the Reserves Technical Oversight group for all proved reserves changes is a mandatory component of this review process. After all changes are made, reviews are held with senior management for final endorsement.
2. Proved Undeveloped Reserves
At year-end 2009, approximately 7.5 billion oil-equivalent barrels (GOEB) of ExxonMobil’s proved reserves were classified as proved undeveloped, which represented 33 percent of the 23.0 GOEB reported in proved reserves. This compares to 38 percent proved undeveloped reported at the end of 2008. The net reduction from 2008 is reflective of our active development programs on many projects worldwide. This percentage is inclusive of both consolidated subsidiaries and equity company reserves. Significant progress was made in converting proved undeveloped reserves into proved developed reserves in 2009. During the year, ExxonMobil completed development work in over 100 fields and participated in numerous major project start-ups that resulted in the transfer of approximately 2.4 GOEB from proved undeveloped to proved developed reserves by year-end. This represented the movement of 28 percent of the proved undeveloped reserves into the proved developed category or an average turnover time of about four years. The largest transfers were associated with two liquefied natural gas (LNG) trains and the second phase of a domestic gas supply project in Qatar.
One of ExxonMobil’s requirements for reporting proved reserves is that management has made significant funding commitments toward the development of the reserves. ExxonMobil has a disciplined investment strategy and many major fields require a long lead-time in order to be developed. Development projects typically take two to four years from the time of first recording of proved reserves to the start of production of these reserves. However, the development time for large and complex projects can exceed five years. During 2009, new approved projects added approximately 1.3 GOEB of proved undeveloped reserves. The largest of these were the Gorgon LNG project in Australia and the Papua New Guinea LNG project. Overall, investments of $12.7 billion were made by the Corporation during 2009 to progress the development of reported proved undeveloped reserves, including $11.6 billion for oil and gas producing activities and an additional $1.1 billion for other non-oil and gas producing activities such as the construction of LNG trains, tankers and regasification facilities that were undertaken to progress the development of proved undeveloped reserves. These investments represented 61 percent of the $20.7 billion in total reported Upstream capital and exploration expenditures.
Proved undeveloped reserves in the United States, Kazakhstan, Qatar, Nigeria, Netherlands and Canada have remained undeveloped for five years or more primarily due to constraints on the capacity of infrastructure and the pace of co-venturers/Government funding, as well as the time required to develop and complete the projects. The Corporation is reasonably certain that these proved reserves will be produced; however, the timing and amount recovered can be affected by a number of factors including completion of development projects, reservoir performance and regulatory approvals. The two largest projects that have been reported with proved undeveloped reserves for five or more years
8
are in Qatar and Kazakhstan. In Qatar, the construction of the Ras Laffan 3 Train 7 LNG liquefaction train is now complete. In Kazakhstan, ExxonMobil participates in the North Caspian Production Sharing Agreement, which includes the giant Kashagan field located offshore in the Caspian Sea. Phase 1 of the Kashagan field is currently under construction and includes an offshore production and separation hub on an artificial island, several drilling islands, three onshore oil-stabilization trains, two onshore gas treatment plants and an onshore sulfur treatment plant. ExxonMobil also participates in the Tengizchevroil joint venture in Kazakhstan which includes a production license in the Tengiz field, and the nearby Korolev field. The joint venture is producing and proved undeveloped reserves will continue to move to proved developed as approved development phases progress.
9
3. Oil and Gas Production, Production Prices and Production Costs
A. Oil and Gas Production
The table below summarizes production by final product sold and by geographic area for the last three years.
| 2009 | 2008 | 2007 | ||||
| (thousands of barrels daily) | ||||||
| Crude oil and natural gas liquids production |
||||||
| Consolidated Subsidiaries |
||||||
| United States |
311 | 289 | 310 | |||
| Canada/South America |
82 | 106 | 129 | |||
| Europe |
374 | 423 | 474 | |||
| Africa |
685 | 652 | 717 | |||
| Asia Pacific/Middle East |
286 | 313 | 328 | |||
| Russia/Caspian |
66 | 73 | 110 | |||
| Total Consolidated Subsidiaries |
1,804 | 1,856 | 2,068 | |||
| Equity Companies |
||||||
| United States |
73 | 78 | 82 | |||
| Europe |
5 | 5 | 6 | |||
| Asia Pacific/Middle East |
204 | 193 | 190 | |||
| Russia/Caspian |
116 | 87 | 75 | |||
| Total Equity Companies |
398 | 363 | 353 | |||
| Total crude oil and natural gas liquids production |
2,202 | 2,219 | 2,421 | |||
| Bitumen production |
||||||
| Consolidated Subsidiaries |
||||||
| Canada/South America |
120 | 124 | 130 | |||
| Synthetic oil production |
||||||
| Consolidated Subsidiaries |
||||||
| Canada/South America |
65 | 62 | 65 | |||
| Total liquids production |
2,387 | 2,405 | 2,616 | |||
| (millions of cubic feet daily) | ||||||
| Natural gas production available for sale |
||||||
| Consolidated Subsidiaries |
||||||
| United States |
1,274 | 1,245 | 1,467 | |||
| Canada/South America |
643 | 640 | 808 | |||
| Europe |
2,071 | 2,253 | 2,307 | |||
| Africa |
19 | 32 | 26 | |||
| Asia Pacific/Middle East |
1,691 | 1,758 | 1,890 | |||
| Russia/Caspian |
38 | 37 | 31 | |||
| Total Consolidated Subsidiaries |
5,736 | 5,965 | 6,529 | |||
| Equity Companies |
||||||
| United States |
1 | 1 | 1 | |||
| Europe |
1,618 | 1,696 | 1,503 | |||
| Asia Pacific/Middle East |
1,803 | 1,356 | 1,272 | |||
| Russia/Caspian |
115 | 77 | 79 | |||
| Total Equity Companies |
3,537 | 3,130 | 2,855 | |||
| Total natural gas production available for sale |
9,273 | 9,095 | 9,384 | |||
| (thousands of oil-equivalent barrels daily) | ||||||
| Oil-equivalent production |
3,932 | 3,921 | 4,180 | |||
10
B. Production Prices and Production Costs
The table below summarizes average production prices and average production costs by geographic area and by product type for the last three years.
| United States |
Canada/ S. America |
Europe | Africa | Asia Pacific/ Middle East |
Russia/ Caspian |
Total | |||||||||||||||
| During 2009 |
|||||||||||||||||||||
| Consolidated Subsidiaries |
|||||||||||||||||||||
| Average production prices |
|||||||||||||||||||||
| Crude oil and NGL, per barrel |
$ | 53.43 | $ | 54.07 | $ | 56.88 | $ | 60.10 | $ | 59.58 | $ | 58.42 | $ | 57.86 | |||||||
| Natural gas, per thousand cubic feet |
3.10 | 3.19 | 5.61 | 1.70 | 3.08 | 2.11 | 4.00 | ||||||||||||||
| Bitumen, per barrel |
— | 45.22 | — | — | — | — | 45.22 | ||||||||||||||
| Synthetic oil, per barrel |
— | 61.26 | — | — | — | — | 61.26 | ||||||||||||||
| Average production costs, per barrel - total |
11.80 | 17.75 | 10.19 | 8.07 | 6.89 | 7.84 | 10.25 | ||||||||||||||
| Average production costs, per barrel - bitumen |
— | 14.77 | — | — | — | — | 14.77 | ||||||||||||||
| Equity Companies |
|||||||||||||||||||||
| Average production prices |
|||||||||||||||||||||
| Crude oil and NGL, per barrel |
56.54 | — | 58.20 | — | 60.10 | 49.09 | 56.22 | ||||||||||||||
| Natural gas, per thousand cubic feet |
5.75 | — | 8.20 | — | 3.94 | 1.41 | 5.81 | ||||||||||||||
| Average production costs, per barrel - total |
18.07 | — | 2.48 | — | 0.49 | 3.23 | 2.72 | ||||||||||||||
| Total |
|||||||||||||||||||||
| Average production prices |
|||||||||||||||||||||
| Crude oil and NGL, per barrel |
54.02 | 54.07 | 56.89 | 60.10 | 59.79 | 52.46 | 57.56 | ||||||||||||||
| Natural gas, per thousand cubic feet |
3.10 | 3.19 | 6.74 | 1.70 | 3.52 | 1.58 | 4.69 | ||||||||||||||
| Bitumen, per barrel |
— | 45.22 | — | — | — | — | 45.22 | ||||||||||||||
| Synthetic oil, per barrel |
— | 61.26 | — | — | — | — | 61.26 | ||||||||||||||
| Average production costs, per barrel - total |
12.57 | 17.75 | 8.06 | 8.07 | 3.88 | 4.83 | 8.36 | ||||||||||||||
| Average production costs, per barrel - bitumen |
— | 14.77 | — | — | — | — | 14.77 | ||||||||||||||
| During 2008 |
|||||||||||||||||||||
| Consolidated Subsidiaries |
|||||||||||||||||||||
| Average production prices |
|||||||||||||||||||||
| Crude oil and NGL, per barrel |
$ | 87.41 | $ | 89.46 | $ | 89.65 | $ | 92.69 | $ | 92.28 | $ | 94.20 | $ | 90.96 | |||||||
| Natural gas, per thousand cubic feet |
7.22 | 7.82 | 10.12 | 3.33 | 4.55 | 2.08 | 7.54 | ||||||||||||||
| Bitumen, per barrel |
— | 65.45 | — | — | — | — | 65.45 | ||||||||||||||
| Synthetic oil, per barrel |
— | 100.35 | — | — | — | — | 100.35 | ||||||||||||||
| Average production costs, per barrel - total |
11.80 | 18.03 | 8.97 | 6.66 | 5.19 | 9.64 | 9.38 | ||||||||||||||
| Average production costs, per barrel - bitumen |
— | 19.55 | — | — | — | — | 19.55 | ||||||||||||||
| Equity Companies |
|||||||||||||||||||||
| Average production prices |
|||||||||||||||||||||
| Crude oil and NGL, per barrel |
89.94 | — | 85.08 | — | 94.21 | 84.14 | 90.80 | ||||||||||||||
| Natural gas, per thousand cubic feet |
13.97 | — | 11.09 | — | 8.86 | 1.38 | 9.89 | ||||||||||||||
| Average production costs, per barrel - total |
18.55 | — | 4.06 | — | 0.75 | 4.83 | 3.86 | ||||||||||||||
| Total |
|||||||||||||||||||||
| Average production prices |
|||||||||||||||||||||
| Crude oil and NGL, per barrel |
87.95 | 89.46 | 89.59 | 92.69 | 93.01 | 89.06 | 90.93 | ||||||||||||||
| Natural gas, per thousand cubic feet |
7.23 | 7.82 | 10.54 | 3.33 | 6.43 | 1.61 | 8.35 | ||||||||||||||
| Bitumen, per barrel |
— | 65.45 | — | — | — | — | 65.45 | ||||||||||||||
| Synthetic oil, per barrel |
— | 100.35 | — | — | — | — | 100.35 | ||||||||||||||
| Average production costs, per barrel - total |
12.72 | 18.03 | 7.67 | 6.66 | 3.38 | 6.96 | 8.14 | ||||||||||||||
| Average production costs, per barrel - bitumen |
— | 19.55 | — | — | — | — | 19.55 | ||||||||||||||
11
| United States |
Canada/ S. America |
Europe | Africa | Asia Pacific/ Middle East |
Russia/ Caspian |
Total | |||||||||||||||
| During 2007 |
|||||||||||||||||||||
| Consolidated Subsidiaries |
|||||||||||||||||||||
| Average production prices |
|||||||||||||||||||||
| Crude oil and NGL, per barrel |
$ | 62.35 | $ | 64.10 | $ | 68.01 | $ | 70.00 | $ | 69.58 | $ | 69.15 | $ | 67.89 | |||||||
| Natural gas, per thousand cubic feet |
5.93 | 5.77 | 6.22 | 2.26 | 3.54 | 1.79 | 5.29 | ||||||||||||||
| Bitumen, per barrel |
— | 36.63 | — | — | — | — | 36.63 | ||||||||||||||
| Synthetic oil, per barrel |
— | 74.79 | — | — | — | — | 74.79 | ||||||||||||||
| Average production costs, per barrel - total |
9.03 | 13.17 | 9.12 | 4.48 | 4.09 | 5.79 | 7.58 | ||||||||||||||
| Average production costs, per barrel - bitumen |
— | 13.26 | — | — | — | — | 13.26 | ||||||||||||||
| Equity Companies |
|||||||||||||||||||||
| Average production prices |
|||||||||||||||||||||
| Crude oil and NGL, per barrel |
64.79 | — | 73.23 | — | 71.91 | 63.60 | 68.51 | ||||||||||||||
| Natural gas, per thousand cubic feet |
10.44 | — | 8.52 | — | 5.76 | 0.90 | 7.08 | ||||||||||||||
| Average production costs, per barrel - total |
14.95 | — | 4.10 | — | 0.58 | 4.34 | 3.49 | ||||||||||||||
| Total |
|||||||||||||||||||||
| Average production prices |
|||||||||||||||||||||
| Crude oil and NGL, per barrel |
62.86 | 64.10 | 68.08 | 70.00 | 70.44 | 66.89 | 67.98 | ||||||||||||||
| Natural gas, per thousand cubic feet |
5.93 | 5.77 | 7.13 | 2.26 | 4.43 | 1.15 | 5.83 | ||||||||||||||
| Bitumen, per barrel |
— | 36.63 | — | — | — | — | 36.63 | ||||||||||||||
| Synthetic oil, per barrel |
— | 74.79 | — | — | — | — | 74.79 | ||||||||||||||
| Average production costs, per barrel - total |
9.80 | 13.17 | 7.97 | 4.48 | 2.74 | 5.16 | 6.77 | ||||||||||||||
| Average production costs, per barrel - bitumen |
— | 13.26 | — | — | — | — | 13.26 | ||||||||||||||
Average production prices have been calculated by using sales quantities from the Corporation’s own production as the divisor. Average production costs have been computed by using net production quantities for the divisor. The volumes of crude oil and natural gas liquids (NGL) production used for this computation are shown in the oil and gas production table in section 3.A. The volumes of natural gas used in the calculation are the production volumes of natural gas available for sale and are also shown in section 3.A. The natural gas available for sale volumes are different from those shown in the reserves table in the “Oil and Gas Reserves” part of the “Supplemental Information on Oil and Gas Exploration and Production Activities” portion of the Financial Section of this report due to volumes consumed or flared. Gas is converted to an oil-equivalent basis at six million cubic feet per one thousand barrels.
12
4. Drilling and Other Exploratory and Development Activities
A. Number of Net Productive and Dry Wells Drilled
| 2009 | 2008 | 2007 | ||||
| Net Productive Exploratory Wells Drilled |
||||||
| Consolidated Subsidiaries |
||||||
| United States |
10 | 10 | 12 | |||
| Canada/South America |
4 | — | 1 | |||
| Europe |
2 | 3 | — | |||
| Africa |
2 | 3 | 2 | |||
| Asia Pacific/Middle East |
1 | 2 | 1 | |||
| Russia/Caspian |
— | — | 1 | |||
| Total Consolidated Subsidiaries |
19 | 18 | 17 | |||
| Equity Companies |
||||||
| United States |
— | — | — | |||
| Europe |
1 | 1 | 2 | |||
| Asia Pacific/Middle East |
— | — | — | |||
| Russia/Caspian |
— | — | — | |||
| Total Equity Companies |
1 | 1 | 2 | |||
| Total productive exploratory wells drilled |
20 | 19 | 19 | |||
| Net Dry Exploratory Wells Drilled |
||||||
| Consolidated Subsidiaries |
||||||
| United States |
1 | 3 | 8 | |||
| Canada/South America |
— | — | 1 | |||
| Europe |
4 | 2 | 2 | |||
| Africa |
3 | 2 | 4 | |||
| Asia Pacific/Middle East |
1 | 1 | 1 | |||
| Russia/Caspian |
— | — | — | |||
| Total Consolidated Subsidiaries |
9 | 8 | 16 | |||
| Equity Companies |
||||||
| United States |
— | — | — | |||
| Europe |
— | — | — | |||
| Asia Pacific/Middle East |
— | 1 | — | |||
| Russia/Caspian |
— | — | — | |||
| Total Equity Companies |
— | 1 | — | |||
| Total dry exploratory wells drilled |
9 | 9 | 16 | |||
13
| 2009 | 2008 | 2007 | ||||
| Net Productive Development Wells Drilled |
||||||
| Consolidated Subsidiaries |
||||||
| United States |
165 | 105 | 118 | |||
| Canada/South America |
291 | 223 | 377 | |||
| Europe |
10 | 8 | 15 | |||
| Africa |
45 | 39 | 43 | |||
| Asia Pacific/Middle East |
13 | 14 | 18 | |||
| Russia/Caspian |
3 | 5 | 3 | |||
| Total Consolidated Subsidiaries |
527 | 394 | 574 | |||
| Equity Companies |
||||||
| United States |
287 | 321 | 333 | |||
| Europe |
1 | 2 | 1 | |||
| Asia Pacific/Middle East |
14 | 14 | 8 | |||
| Russia/Caspian |
— | — | 1 | |||
| Total Equity Companies |
302 | 337 | 343 | |||
| Total productive development wells drilled |
829 | 731 | 917 | |||
| Net Dry Development Wells Drilled |
||||||
| Consolidated Subsidiaries |
||||||
| United States |
3 | 3 | 15 | |||
| Canada/South America |
— | 1 | — | |||
| Europe |
1 | — | 3 | |||
| Africa |
— | — | 1 | |||
| Asia Pacific/Middle East |
1 | — | — | |||
| Russia/Caspian |
— | — | — | |||
| Total Consolidated Subsidiaries |
5 | 4 | 19 | |||
| Equity Companies |
||||||
| United States |
— | — | — | |||
| Europe |
— | — | — | |||
| Asia Pacific/Middle East |
— | — | — | |||
| Russia/Caspian |
— | — | — | |||
| Total Equity Companies |
— | — | — | |||
| Total dry development wells drilled |
5 | 4 | 19 | |||
| Total number of net wells drilled |
863 | 763 | 971 | |||
14
B. Exploratory and Development Activities Regarding Oil and Gas Resources Extracted by Mining Technologies
Syncrude Operations
Syncrude is a joint venture established to recover shallow deposits of oil sands using open-pit mining methods to extract the crude bitumen, and then upgrade it to produce a high-quality, light (32 degrees API), sweet, synthetic crude oil. Imperial Oil Limited is the owner of a 25 percent interest in the joint venture. Exxon Mobil Corporation has a 69.6 percent interest in Imperial Oil Limited. The Syncrude operation, located near Fort McMurray, Alberta, Canada, mines a portion of the Athabasca oil sands deposit. Syncrude joint venture owners hold eight oil sands leases covering about 250,000 acres in the Athabasca oil sands deposit. Since startup in 1978, Syncrude has produced about 2.0 billion barrels of synthetic crude oil. The produced synthetic crude oil is shipped from the Syncrude site to Edmonton, Alberta, by Alberta Oil Sands Pipeline Ltd. In 2009, Syncrude’s net production of synthetic crude oil was about 259,000 barrels per day and gross production was about 280,000 barrels per day. The company’s share of net production in 2009 was about 65,000 barrels per day. There are no approved plans for major future expansion projects.
Kearl Project
The Kearl oil sands project is a joint venture established to recover shallow deposits of oil sands using open-pit mining methods to extract the crude bitumen. Imperial Oil Limited holds a 70.96 percent interest in the joint venture and ExxonMobil Canada Properties holds the other 29.04 percent. Exxon Mobil Corporation has a 69.6 percent interest in Imperial Oil Limited and a 100 percent interest in ExxonMobil Canada Properties. The Kearl project is located approximately 40 miles north of Fort McMurray, Alberta, Canada.
Kearl is expected to be developed in phases. Bitumen will be extracted from oil sands produced from open-pit mining operations, and processed through a bitumen extraction and froth treatment plant. The product, a blend of bitumen and diluent, is planned to be shipped via pipelines for distribution to North American markets. Diluent is natural gas condensate or other light hydrocarbons added to the crude bitumen to facilitate transportation to market by pipeline.
The Kearl project received approvals from the Province of Alberta in 2007 and the Government of Canada in 2008. The Province of Alberta issued an operating and construction license in 2008, which permits the project to mine oil sands and produce bitumen from approved development areas on oil sands leases. Kearl is comprised of six oil sands leases covering about 48,000 acres in the Athabasca oil sands deposit.
Production from the first phase is expected to be at an initial rate of approximately 110,000 gross barrels of bitumen a day. About $2 billion has been spent on the project through 2009. In 2009, pipeline transportation agreements were concluded, infrastructure construction continued and more than half of the detailed engineering was completed.
15
5. Present Activities
A. Wells Drilling
| Year-end 2009 |
Year-end 2008 | |||||||
| Gross | Net | Gross | Net | |||||
| Wells Drilling |
||||||||
| Consolidated Subsidiaries |
||||||||
| United States |
185 | 146 | 201 | 136 | ||||
| Canada/South America |
83 | 57 | 297 | 173 | ||||
| Europe |
20 | 4 | 27 | 7 | ||||
| Africa |
24 | 8 | 19 | 7 | ||||
| Asia Pacific/Middle East |
6 | 3 | 5 | 2 | ||||
| Russia/Caspian |
18 | 3 | 25 | 4 | ||||
| Total Consolidated Subsidiaries |
336 | 221 | 574 | 329 | ||||
| Equity Companies |
||||||||
| United States |
10 | 5 | 2 | 1 | ||||
| Europe |
16 | 5 | 1 | — | ||||
| Asia Pacific/Middle East |
5 | — | 17 | 9 | ||||
| Russia/Caspian |
— | — | — | — | ||||
| Total Equity Companies |
31 | 10 | 20 | 10 | ||||
| Total gross and net wells drilling |
367 | 231 | 594 | 339 | ||||
B. Review of Principal Ongoing Activities
During 2009, ExxonMobil’s activities were conducted, either directly or through affiliated companies, by ExxonMobil Exploration Company (for exploration), by ExxonMobil Development Company (for large development activities), by ExxonMobil Production Company (for producing and smaller development activities) and by ExxonMobil Gas & Power Marketing Company (for gas marketing). During this same period, some of ExxonMobil’s exploration, development, production and gas marketing activities were also conducted in Canada by Imperial Oil Limited, which is 69.6 percent owned by ExxonMobil.
UNITED STATES
ExxonMobil’s year-end 2009 acreage holdings totaled 10.2 million net acres, of which 2.3 million net acres were offshore. ExxonMobil was active in areas onshore and offshore in the lower 48 states and in Alaska.
During 2009, 435.2 net exploration and development wells were completed in the inland lower 48 states and 2.0 net development wells were completed offshore in the Pacific. Tight gas development continued in the Piceance Basin of Colorado as the Piceance Phase 1 tight gas project came onstream in 2009. Participation in Alaska production and development continued and a total of 22.5 net development wells were drilled. On Alaska’s North Slope, activity continued on the Western Region Development with development drilling and facility upgrades.
ExxonMobil’s net acreage in the Gulf of Mexico at year-end 2009 was 2.2 million acres. A total of 6.0 net exploration and development wells were completed during the year. In 2009, the Rockefeller field was brought onstream.
Construction of the Golden Pass LNG regasification terminal in Texas continued in 2009. The terminal will have the capacity to deliver up to two billion cubic feet of gas per day.
16
CANADA / SOUTH AMERICA
Canada
Oil and Gas Operations
ExxonMobil’s year-end 2009 acreage holdings totaled 6.8 million net acres, of which 3.1 million net acres were offshore. A total of 234.0 net exploration and development wells were completed during the year.
In Situ Bitumen Operations
ExxonMobil’s year-end 2009 in situ bitumen acreage holdings totaled 0.6 million net onshore acres. A total of 60.0 net development wells were completed during the year. The only current in situ bitumen production comes from the Cold Lake field. To maintain production at Cold Lake, additional production wells and associated facilities are required periodically. In 2009, a development drilling program began within the approved development area to add additional productive capacity from undeveloped areas.
Argentina
ExxonMobil’s net acreage totaled 0.2 million onshore acres at year-end 2009, and there were 1.8 net development wells completed during the year.
Venezuela
ExxonMobil’s acreage holdings and assets were expropriated in 2007. Refer to the relevant portion of “Note 15: Litigation and Other Contingencies” of the Financial Section of this report for additional information.
EUROPE
Germany
A total of 4.9 million net onshore acres and 0.1 million net offshore acres were held by ExxonMobil at year-end 2009, with 3.6 net exploration and development wells drilled during the year.
Italy
The Adriatic LNG regasification terminal received its first cargo and commenced regasification operations in 2009. The terminal can supply up to 775 million cubic feet of gas per day to the Italian gas market.
Netherlands
ExxonMobil’s net interest in licenses totaled approximately 1.4 million acres at year-end 2009, of which 1.2 million acres are onshore. A total of 2.5 net exploration and development wells were completed during the year. The multi-year project to renovate Groningen production clusters, install new compression to maintain capacity and extend field life was completed and the project to redevelop the Schoonebeek oil field was progressed.
Norway
ExxonMobil’s net interest in licenses at year-end 2009 totaled approximately 0.7 million acres, all offshore. ExxonMobil participated in 6.6 net exploration and development well completions in 2009. Production was initiated at the Tyrihans field.
17
United Kingdom
ExxonMobil’s net interest in licenses at year-end 2009 totaled approximately 0.4 million acres, all offshore. A total of 3.7 net exploration and development wells were completed during the year including the successful Fram appraisal.
The South Hook LNG regasification terminal in Wales commenced operations in 2009 and received its first deliveries. The terminal has the capacity to deliver up to 2.1 billion cubic feet of gas per day into the natural gas grid.
AFRICA
Angola
ExxonMobil’s year-end 2009 acreage holdings totaled 0.7 million net offshore acres and 7.9 net exploration and development wells were completed during the year. On Block 15, development drilling continued at Kizomba A, Kizomba B and Kizomba C. Project work continued on the Angola Gas Gathering project and the Kizomba Satellites Phase 1 project in 2009. On the non-operated Block 17, project work continued on the Pazflor project and development drilling continued at Dalia. On the non-operated Block 31, project work continued on the Plutao-Saturno-Venus-Marte project.
Cameroon
ExxonMobil’s net acreage holdings totaled 0.1 million offshore acres.
Chad
ExxonMobil’s net year-end 2009 acreage holdings consisted of 0.1 million onshore acres, with 34.4 net development wells completed during the year. Production began from the Timbre field in 2009.
Equatorial Guinea
ExxonMobil’s acreage totaled 0.1 million net offshore acres at year-end 2009.
Nigeria
ExxonMobil’s net acreage totaled 1.0 million offshore acres at year-end 2009, with 6.7 net exploration and development wells completed during the year. Work continued on the deepwater Usan project in 2009. Projects to replace crude oil pipelines and to reduce flaring were progressed. A 3-D seismic acquisition program continued on the Nigerian Shelf joint venture acreage and a 4-D seismic survey was completed at the Erha field.
ASIA PACIFIC / MIDDLE EAST
Australia
ExxonMobil’s net year-end 2009 offshore acreage holdings totaled 1.9 million acres. During 2009, a total of 7.6 net exploration and development wells were drilled. Work continued on the Kipper/Tuna gas project and Turrum Phase 2 development. The Gorgon liquefied natural gas project was approved for development in 2009.
Indonesia
At year-end 2009, ExxonMobil had 5.4 million net acres, including 4.3 million net acres offshore and 1.1 million net acres onshore. A total of 0.8 net exploration wells were completed during the year. During 2009, early oil production commenced at the Banyu Urip field in the Cepu contract area. A new deepwater block was acquired in 2009 as well as three coalbed methane production sharing contracts.
18
Japan
ExxonMobil’s net offshore acreage was 36 thousand acres at year-end 2009.
Malaysia
ExxonMobil has interests in production sharing contracts covering 0.5 million net acres offshore Malaysia at year-end 2009. In 2009, a new production sharing contract was signed with PETRONAS and PETRONAS Carigali. During the year, a total of 5.0 net development wells were completed.
Papua New Guinea
A total of 0.4 million net onshore acres were held by ExxonMobil at year-end 2009, with 1.1 net development wells completed during the year. In 2009, all co-venturers agreed to proceed with the development of the Papua New Guinea liquefied natural gas project.
Qatar
Production and development activities continued on natural gas projects in Qatar. Liquefied natural gas (LNG) operating companies include:
Qatar Liquefied Gas Company Limited — (QG I)
Qatar Liquefied Gas Company Limited (2) — (QG 2)
Ras Laffan Liquefied Natural Gas Company Limited — (RL I)
Ras Laffan Liquefied Natural Gas Company Limited (II) — (RL II)
Ras Laffan Liquefied Natural Gas Company Limited (3) — (RL 3)
In addition, the Al Khaleej Gas (AKG) project supplied pipeline gas to domestic industrial customers. With the initial start-up of AKG Phase 2 in December 2009, the AKG facilities provide sales gas capacity of up to 2 billion cubic feet per day with associated condensate, ethane and liquid petroleum gas.
At the end of 2009, with the conclusion of the drilling program for the RL 3 and AKG 2 projects, 136 gross wells supplied natural gas to currently-producing LNG and pipeline gas sales facilities. During 2009, 8.9 net development wells were completed.
Total Qatar LNG capacity volumes (gross) at year-end 2009 was 53.8 MTA (millions of metric tons per annum), with the start up in 2009 of QG 2 trains 4 and 5 as well as the start-up of RL 3 train 6. Capacity consists of 9.7 MTA in QG I trains 1-3, a combined 20.7 MTA in RL I trains 1-2 and RL II trains 3-5, 15.6 MTA in QG 2 trains 4-5 and 7.8 MTA in RL 3 train 6 . In addition, RL 3 train 7 will add planned capacity of 7.8 MTA when completed.
The conversion factor to translate Qatar LNG volumes (millions of metric tons - MT) into gas volumes (billions of cubic feet - BCF) is dependent on the gas quality and the quality of the LNG produced. The conversion factors are approximately 46 BCF/MT for QG I trains 1-3, RL I trains 1-2 and RL II train 3, and approximately 49 BCF/MT for QG 2 trains 4-5, RL II trains 4-5 and RL 3 trains 6-7.
Republic of Yemen
ExxonMobil’s net acreage in the Republic of Yemen production sharing areas totaled 10 thousand acres onshore at year-end 2009.
19
Thailand
ExxonMobil’s net onshore acreage in Thailand concessions totaled 21 thousand acres at year-end 2009.
United Arab Emirates
ExxonMobil’s net acreage in the Abu Dhabi oil concessions was 0.6 million acres at year-end 2009, of which 0.4 million acres were onshore and 0.2 million acres offshore. During the year, 6.0 net development wells were completed. During 2009, work progressed on multiple field development projects, both onshore and offshore, to sustain and increase oil production capacity.
RUSSIA/CASPIAN
Azerbaijan
At year-end 2009, ExxonMobil’s net acreage, located in the Caspian Sea offshore of Azerbaijan, totaled 0.1 million acres. At the Azeri-Chirag-Gunashli field, 0.7 net development wells were completed.
Kazakhstan
ExxonMobil’s net acreage totaled 0.2 million acres onshore and 0.2 million acres offshore at year-end 2009, with 1.2 net exploration and development wells completed during 2009. Production continued to increase as a result of the latest Tengiz expansion that came onstream in 2008. Construction of the initial phase of the Kashagan field continued during 2009.
Russia
ExxonMobil’s net acreage holdings at year-end 2009 were 0.1 million acres, all offshore. A total of 0.6 net development wells were completed in the Chayvo field during the year. Development of the initial phase of the Odoptu field is underway with the construction of field separation facilities, a flowline to the Chayvo onshore processing plant and completion of 0.6 net development wells.
WORLDWIDE EXPLORATION
At year-end 2009, exploration activities were underway in several areas in which ExxonMobil has no established production operations and thus are not included above. A total of 49.1 million net acres were held at year-end 2009, and 3.8 net exploration wells were completed during the year in these countries.
20
6. Oil and Gas Properties, Wells, Operations and Acreage
A. Gross and Net Productive Wells
| Year-end 2009 | Year-end 2008 | |||||||||||||||
| Oil | Gas | Oil | Gas | |||||||||||||
| Gross | Net | Gross | Net | Gross | Net | Gross | Net | |||||||||
| Gross and Net Productive Wells |
||||||||||||||||
| Consolidated Subsidiaries |
||||||||||||||||
| United States |
15,606 | 4,821 | 9,261 | 5,645 | 15,275 | 4,588 | 9,084 | 5,511 | ||||||||
| Canada/South America |
5,357 | 4,828 | 6,728 | 3,408 | 5,527 | 5,007 | 6,189 | 3,189 | ||||||||
| Europe |
1,395 | 389 | 649 | 292 | 1,318 | 377 | 618 | 282 | ||||||||
| Africa |
1,081 | 432 | 13 | 5 | 943 | 381 | 14 | 6 | ||||||||
| Asia Pacific/Middle East |
1,380 | 507 | 238 | 183 | 1,345 | 484 | 229 | 179 | ||||||||
| Russia/Caspian |
93 | 15 | — | — | 74 | 12 | — | — | ||||||||
| Total Consolidated Subsidiaries |
24,912 | 10,992 | 16,889 | 9,533 | 24,482 | 10,849 | 16,134 | 9,167 | ||||||||
| Equity Companies |
||||||||||||||||
| United States |
11,592 | 5,452 | 8 | 4 | 11,972 | 5,598 | 8 | 4 | ||||||||
| Europe |
27 | 14 | 576 | 187 | 27 | 14 | 599 | 196 | ||||||||
| Asia Pacific/Middle East |
775 | 74 | 126 | 36 | 837 | 80 | 84 | 20 | ||||||||
| Russia/Caspian |
98 | 24 | — | — | 68 | 17 | — | — | ||||||||
| Total Equity Companies |
12,492 | 5,564 | 710 | 227 | 12,904 | 5,709 | 691 | 220 | ||||||||
| Total gross and net productive wells |
37,404 | 16,556 | 17,599 | 9,760 | 37,386 | 16,558 | 16,825 | 9,387 | ||||||||
There were 16,587 gross and 13,737 net operated wells at year-end 2009 and 16,286 gross and 13,573 net operated wells at year-end 2008. In 2009, 1,039 gross wells had multiple completions.
B. Gross and Net Developed Acreage
| Year-end 2009 | Year-end 2008 | |||||||||
| Gross | Net | Gross | Net | |||||||
| (thousands of acres) | ||||||||||
| Gross and Net Developed Acreage |
||||||||||
| Consolidated Subsidiaries |
||||||||||
| United States |
9,866 | 5,061 | 8,526 | 5,075 | ||||||
| Canada/South America |
5,570 | 2,460 | 5,558 | * | 2,488 | * | ||||
| Europe |
5,359 | 2,454 | 5,976 | 2,682 | ||||||
| Africa |
1,958 | 758 | 1,958 | 756 | ||||||
| Asia Pacific/Middle East |
3,031 | 1,210 | 2,814 | 1,120 | ||||||
| Russia/Caspian |
151 | 21 | 151 | 21 | ||||||
| Total Consolidated Subsidiaries |
25,935 | 11,964 | 24,983 | 12,142 | ||||||
| Equity Companies |
||||||||||
| United States |
165 | 59 | 220 | 73 | ||||||
| Europe |
4,325 | 1,352 | 4,196 | 1,344 | ||||||
| Asia Pacific/Middle East |
5,437 | 553 | 5,347 | 531 | ||||||
| Russia/Caspian |
380 | 95 | 380 | 95 | ||||||
| Total Equity Companies |
10,307 | 2,059 | 10,143 | 2,043 | ||||||
| Total gross and net developed acreage |
36,242 | 14,023 | 35,126 | 14,185 | ||||||
| * | Revised to include oil sands mining acreage. |
Separate acreage data for oil and gas are not maintained because, in many instances, both are produced from the same acreage.
21
C. Gross and Net Undeveloped Acreage
| Year-end 2009 | Year-end 2008 | |||||||||
| Gross | Net | Gross | Net | |||||||
| (thousands of acres) | ||||||||||
| Gross and Net Undeveloped Acreage |
||||||||||
| Consolidated Subsidiaries |
||||||||||
| United States |
7,650 | 5,034 | 8,818 | 5,600 | ||||||
| Canada/South America |
26,074 | 17,107 | 33,016 | * | 19,953 | * | ||||
| Europe |
25,420 | 13,462 | 16,464 | 7,844 | ||||||
| Africa |
15,768 | 10,555 | 40,440 | 26,439 | ||||||
| Asia Pacific/Middle East |
33,384 | 25,260 | 18,609 | 12,168 | ||||||
| Russia/Caspian |
1,964 | 356 | 1,724 | 315 | ||||||
| Total Consolidated Subsidiaries |
110,260 | 71,774 | 119,071 | 72,319 | ||||||
| Equity Companies |
||||||||||
| United States |
208 | 77 | 246 | 91 | ||||||
| Europe |
53 | 8 | 411 | 69 | ||||||
| Asia Pacific/Middle East |
— | — | 90 | 22 | ||||||
| Russia/Caspian |
228 | 57 | 228 | 57 | ||||||
| Total Equity Companies |
489 | 142 | 975 | 239 | ||||||
| Total gross and net undeveloped acreage |
110,749 | 71,916 | 120,046 | 72,558 | ||||||
| * | Revised to include oil sands mining acreage. |
ExxonMobil’s investment in developed and undeveloped acreage is comprised of numerous concessions, blocks and leases. The terms and conditions under which the Corporation maintains exploration and/or production rights to the acreage are property-specific, contractually defined and vary significantly from property to property. Work programs are designed to ensure that the exploration potential of any property is fully evaluated before expiration. In some instances, the Corporation may elect to relinquish acreage in advance of the contractual expiration date if the evaluation process is complete and there is not a business basis for extension. In cases where additional time may be required to fully evaluate acreage, the Corporation has generally been successful in obtaining extensions.
D. Summary of Acreage Terms
UNITED STATES
Oil and gas leases have an exploration period ranging from one to ten years, and a production period that normally remains in effect until production ceases. Under certain circumstances, a lease may be held beyond its exploration term even if production has not commenced. In some instances, a “fee interest” is acquired where both the surface and the underlying mineral interests are owned outright.
CANADA / SOUTH AMERICA
Canada
Exploration permits are granted for varying periods of time with renewals possible. Exploration rights in onshore areas acquired from Canadian provinces entitle the holder to obtain leases upon completing specified work. Production leases are held as long as there is production on the lease. The majority of Cold Lake leases were taken for an initial 21-year term in 1968-1969 and renewed for a second 21-year term in 1989-1990. The exploration acreage in eastern Canada and the block in the Beaufort Sea acquired in 2007 are currently held by work commitments of various amounts.
22
Argentina
The onshore concession terms in Argentina are up to four years for the initial exploration period, up to three years for the second exploration period and up to two years for the third exploration period. A 50-percent relinquishment is required after each exploration period. An extension after the third exploration period is possible for up to five years. The total production term is 25 years with a ten-year extension possible, once a field has been developed.
EUROPE
Germany
Exploration concessions are granted for an initial maximum period of five years, with an unlimited number of extensions of up to three years each. Extensions are subject to specific, minimum work commitments. Production licenses are normally granted for 20 to 25 years with multiple possible extensions as long as there is production on the license. In 2007, ExxonMobil affiliates acquired four exploration licenses in the state of Lower Saxony. The exploration licenses are for a period of five years during which exploration work programs will be carried out. In 2009, ExxonMobil affiliates acquired two exploration licenses in the state of North Rhine Westphalia for an initial period of five years and an extension to one of the Lower Saxony licenses.
Netherlands
Under the Mining Law, effective January 1, 2003, exploration and production licenses for both onshore and offshore areas are issued for a period as explicitly defined in the license. The term is based on the period of time necessary to perform the activities for which the license is issued. License conditions are stipulated in the Mining Law.
Production rights granted prior to January 1, 2003, remain subject to their existing terms, and differ slightly for onshore and offshore areas. Onshore production licenses issued prior to 1988 were indefinite; from 1988 they were issued for a period as explicitly defined in the license, ranging from 35 to 45 years. Offshore production licenses issued before 1976 were issued for a fixed period of 40 years; from 1976 they were again issued for a period as explicitly defined in the license, ranging from 15 to 40 years.
Norway
Licenses issued prior to 1972 were for an initial period of six years and an extension period of 40 years, with relinquishment of at least one-fourth of the original area required at the end of the sixth year and another one-fourth at the end of the ninth year. Licenses issued between 1972 and 1997 were for an initial period of up to six years (with extension of the initial period of one year at a time up to ten years after 1985), and an extension period of up to 30 years, with relinquishment of at least one-half of the original area required at the end of the initial period. Licenses issued after July 1, 1997, have an initial period of up to ten years and a normal extension period of up to 30 years or in special cases of up to 50 years, and with relinquishment of at least one-half of the original area required at the end of the initial period.
United Kingdom
Acreage terms are fixed by the government and are periodically changed. For example, many of the early licenses issued under the first four licensing rounds provided for an initial term of six years with relinquishment of at least one-half of the original area at the end of the initial term, subject to extension for a further 40 years. At the end of any such 40-year term, licenses may continue in
23
producing areas until cessation of production; or licenses may continue in development areas for periods agreed on a case-by-case basis until they become producing areas; or licenses terminate in all other areas. ExxonMobil’s licenses issued in 2005 as part of the 23rd licensing round have an initial term of four years with a second term extension of four years and a final term of 18 years. There is a mandatory relinquishment of 50-percent of the acreage after the initial term and of all acreage that is not covered by a development plan at the end of the second term.
AFRICA
Angola
Exploration and production activities are governed by production sharing agreements with an initial exploration term of four years and an optional second phase of two to three years. The production period is for 25 years, and agreements generally provide for a negotiated extension.
Cameroon
Exploration and production activities are governed by various agreements negotiated with the national oil company and the government of Cameroon. Exploration permits are granted for terms from four to 16 years and are generally renewable for multiple periods up to four years each. Upon commercial discovery, mining concessions are issued for a period of 25 years with one 25-year extension.
Chad
Exploration permits are issued for a period of five years, and are renewable for one or two further five-year periods. The terms and conditions of the permits, including relinquishment obligations, are specified in a negotiated convention. The production term is for 30 years and may be extended at the discretion of the government. In May 2007, Chad enacted a new Petroleum Code which would govern new acquisitions.
Equatorial Guinea
Exploration and production activities are governed by production sharing contracts negotiated with the State Ministry of Mines, Industry and Energy. The exploration periods are for ten to 15 years with limited relinquishments in the absence of commercial discoveries. The production period for crude oil is 30 years while the production period for gas is 50 years. A new Hydrocarbons Law was enacted in November 2006. Under the new law, the exploration terms for new production sharing contracts are four to five years with a maximum of two one-year extensions, unless the Ministry agrees otherwise.
Nigeria
Exploration and production activities in the deepwater offshore areas are typically governed by production sharing contracts (PSCs) with the national oil company, the Nigerian National Petroleum Corporation (NNPC). NNPC holds the underlying Oil Prospecting License (OPL) and any resulting Oil Mining Lease (OML). The terms of the PSCs are generally 30 years, including a ten-year exploration period (an initial exploration phase plus one or two optional periods) covered by an OPL. Upon commercial discovery, an OPL may be converted to an OML. Partial relinquishment is required under the PSC at the end of the ten-year exploration period, and OMLs have a 20-year production period that may be extended.
Some exploration activities are carried out in deepwater by joint ventures with local companies holding interests in an OPL. OPLs in deepwater offshore areas are valid for ten years and are non-
24
renewable, while in all other areas the licenses are for five years and also are non-renewable. Demonstrating a commercial discovery is the basis for conversion of an OPL to an OML.
OMLs granted prior to the 1969 Petroleum Act (i.e., under the Mineral Oils Act 1914, repealed by the 1969 Petroleum Act) were for 30 years onshore and 40 years in offshore areas and have been renewed, effective December 1, 2008, for a further period of 20 years, with a further renewal option of 20 years. Operations under these pre-1969 OMLs are conducted under a joint venture agreement with NNPC rather than a PSC. In 2000, a Memorandum of Understanding (MOU) was executed defining commercial terms applicable to existing joint venture oil production. The MOU may be terminated on one calendar year’s notice.
OMLs granted under the 1969 Petroleum Act, which include all deepwater OMLs, have a maximum term of 20 years without distinction for onshore or offshore location and are renewable, upon 12 months’ written notice, for another period of 20 years. OMLs not held by NNPC are also subject to a mandatory 50-percent relinquishment after the first ten years of their duration.
ASIA PACIFIC / MIDDLE EAST
Australia
Exploration and production activities are conducted offshore and are governed by Federal legislation. Exploration permits are granted for an initial term of six years with two possible five-year renewal periods. Retention leases may be granted for resources that are not commercially viable at the time of application, but are expected to become commercially viable within 15 years. These are granted for periods of five years and renewals may be requested. Prior to July 1998, production licenses were granted initially for 21 years, with a further renewal of 21 years and thereafter “indefinitely”, i.e., for the life of the field (if no operations for the recovery of petroleum have been carried on for five years, the license may be terminated). Effective from July 1998, new production licenses are granted “indefinitely”.
Indonesia
Exploration and production activities in Indonesia are generally governed by cooperation contracts, usually in the form of a production sharing contract, negotiated with BPMIGAS, a government agency established in 2002 to manage upstream oil and gas activities. Formerly this activity was carried out by Pertamina, the government owned oil company, which is now a competing limited liability company.
Japan
The Mining Law provides for the granting of concessions that convey exploration and production rights. Exploration rights are granted for an initial two-year period, and may be extended for two two-year periods for gas and three two-year periods for oil. Production rights have no fixed term and continue until abandonment so long as the rights holder is fulfilling its obligations.
Malaysia
Exploration and production activities are governed by seven production sharing contracts (PSCs) negotiated with the national oil company, three governing exploration and production activities and four governing production activities only. The more recent PSCs governing exploration and production activities have an overall term of 24 to 38 years, depending on water depth, with possible extensions to the exploration and/or development periods. The exploration period is five to seven years with the possibility of extensions, after which time areas with no commercial discoveries will be deemed relinquished. The development period is from four to six years from commercial discovery, with the
25
possibility of extensions under special circumstances. Areas from which commercial production has not started by the end of the development period will be deemed relinquished if no extension is granted. All extensions are subject to the national oil company’s prior written approval. The total production period is 15 to 25 years from first commercial lifting, not to exceed the overall term of the contract.
In 2008, the Company reached agreement with the national oil company for a new PSC, which was subsequently signed in 2009. Under the new PSC, from 2008 until March 31, 2012, the Company is entitled to undertake new development and production activities in oil fields under an existing PSC, subject to new minimum work and spending commitments, including an enhanced oil recovery project in one of the oil fields. When the existing PSC expires on March 31, 2012, the producing fields covered by the existing PSC will automatically become part of the new PSC, which has a 25-year duration from April 2008.
Papua New Guinea
Exploration and production activities are governed by the Oil and Gas Act. Petroleum Prospecting licenses are granted for an initial term of six years with a five-year extension possible (an additional extension of three years is possible in certain circumstances). Generally, a 50-percent relinquishment of the license area is required at the end of the initial six-year term, if extended. Petroleum Development licenses are granted for an initial 25-year period. An extension of up to 20 years may be granted at the Minister’s discretion. Petroleum Retention licenses may be granted for gas resources that are not commercially viable at the time of application, but may become commercially viable within the maximum possible retention time of 15 years. Petroleum Retention licenses are granted for five-year terms, and may be extended, at the Minister’s discretion, twice for the maximum retention time of 15 years. Extensions of Petroleum Retention licenses may be for periods of less than one year, renewable annually, if the Minister considers at the time of extension that the resources could become commercially viable in less than five years.
Qatar
The State of Qatar grants gas production development project rights to develop and supply gas from the offshore North Field to permit the economic development and production of gas reserves sufficient to satisfy the gas and LNG sales obligations of these projects.
Republic of Yemen
The Jannah production sharing agreement has a development period extending 20 years from first commercial declaration, which was made in June 1995.
Thailand
The Petroleum Act of 1971 allows production under ExxonMobil’s concession for 30 years with a ten-year extension at terms generally prevalent at the time.
United Arab Emirates
Exploration and production activities for the major onshore oilfields in the Emirate of Abu Dhabi are governed by a 75-year oil concession agreement executed in 1939 and subsequently amended through various agreements with the government of Abu Dhabi. An interest in the Upper Zakum field, a major offshore field, was acquired effective as of January 1, 2006, for a term expiring March 9, 2026, on fiscal terms consistent with the Company’s existing interests in Abu Dhabi.
26
RUSSIA/CASPIAN
Azerbaijan
The production sharing agreement (PSA) for the development of the Azeri-Chirag-Gunashli field is established for an initial period of 30 years starting from the PSA execution date in 1994.
Other exploration and production activities are governed by PSAs negotiated with the national oil company of Azerbaijan. The exploration period consists of three or four years with the possibility of a one to three-year extension. The production period, which includes development, is for 25 years or 35 years with the possibility of one or two five-year extensions.
Kazakhstan
Onshore exploration and production activities are governed by the production license, exploration license and joint venture agreements negotiated with the Republic of Kazakhstan. Existing production operations have a 40-year production period that commenced in 1993.
Offshore exploration and production activities are governed by a production sharing agreement negotiated with the Republic of Kazakhstan. The exploration period was six years followed by separate appraisal periods for each discovery. The production period for each discovery, which includes development, is for 20 years from the date of declaration of commerciality with the possibility of two ten-year extensions.
Russia
Terms for ExxonMobil’s acreage are fixed by the production sharing agreement (PSA) that became effective in 1996 between the Russian government and the Sakhalin-1 consortium, of which ExxonMobil is the operator. The term of the PSA is 20 years from the Declaration of Commerciality, which would be 2021. The term may be extended thereafter in 10-year increments as specified in the PSA.
27
Information with regard to the Downstream segment follows:
ExxonMobil’s Downstream segment manufactures and sells petroleum products. The refining and supply operations encompass a global network of manufacturing plants, transportation systems, and distribution centers that provide a range of fuels, lubricants and other products and feedstocks to our customers around the world.
Refining Capacity At Year-End 2009 (1)
| ExxonMobil Share KBD (2) |
ExxonMobil Interest % | |||||
| United States |
||||||
| Torrance |
California |
150 | 100 | |||
| Joliet |
Illinois |
238 | 100 | |||
| Baton Rouge |
Louisiana |
504 | 100 | |||
| Baytown |
Texas |
576 | 100 | |||
| Beaumont |
Texas |
345 | 100 | |||
| Other (2 refineries) |
157 | |||||
| Total United States |
1,970 | |||||
| Canada |
||||||
| Strathcona |
Alberta |
187 | 69.6 | |||
| Dartmouth |
Nova Scotia |
82 | 69.6 | |||
| Nanticoke |
Ontario |
112 | 69.6 | |||
| Sarnia |
Ontario |
121 | 69.6 | |||
| Total Canada |
502 | |||||
| Europe |
||||||
| Antwerp |
Belgium |
305 | 100 | |||
| Fos-sur-Mer |
France |
119 | 82.9 | |||
| Port-Jerome-Gravenchon |
France |
233 | 82.9 | |||
| Augusta |
Italy |
198 | 100 | |||
| Trecate |
Italy |
174 | 75.4 | |||
| Rotterdam |
Netherlands |
191 | 100 | |||
| Slagen |
Norway |
116 | 100 | |||
| Fawley |
United Kingdom |
329 | 100 | |||
| Other (2 refineries) |
78 | |||||
| Total Europe |
1,743 | |||||
| Asia Pacific |
||||||
| Kawasaki |
Japan |
296 | 50 | |||
| Sakai |
Japan |
139 | 50 | |||
| Wakayama |
Japan |
160 | 50 | |||
| Jurong/PAC |
Singapore |
605 | 100 | |||
| Sriracha |
Thailand |
174 | 66 | |||
| Other (5 refineries) |
337 | |||||
| Total Asia Pacific |
1,711 | |||||
| Other Non-U.S. |
||||||
| Yanbu |
Saudi Arabia |
200 | 50 | |||
| Laffan |
Qatar |
14 | 10 | |||
| Other (4 refineries) |
131 | |||||
| Total Other Non-U.S. |
345 | |||||
| Total Worldwide |
6,271 | |||||
| (1) | Capacity data is based on 100 percent of rated refinery process unit stream-day capacities under normal operating conditions, less the impact of shutdowns for regular repair and maintenance activities, averaged over an extended period of time. |
| (2) | Thousands of barrels per day (KBD). ExxonMobil share reflects 100 percent of atmospheric distillation capacity in operations of ExxonMobil and majority-owned subsidiaries. For companies owned 50 percent or less, ExxonMobil share is the greater of ExxonMobil’s equity interest or that portion of distillation capacity normally available to ExxonMobil. |
28
The marketing operations sell products and services throughout the world. Our Exxon, Esso and Mobil brands serve customers at nearly 28,000 retail service stations.
Retail Sites Year-End 2009
| United States |
||
| Owned/leased |
1,921 | |
| Distributors/resellers |
8,295 | |
| Total United States |
10,216 | |
| Canada |
||
| Owned/leased |
518 | |
| Distributors/resellers |
1,326 | |
| Total Canada |
1,844 | |
| Europe |
||
| Owned/leased |
4,153 | |
| Distributors/resellers |
2,674 | |
| Total Europe |
6,827 | |
| Asia Pacific |
||
| Owned/leased |
2,305 | |
| Distributors/resellers |
3,960 | |
| Total Asia Pacific |
6,265 | |
| Latin America |
||
| Owned/leased |
587 | |
| Distributors/resellers |
1,350 | |
| Total Latin America |
1,937 | |
| Middle East/Africa |
||
| Owned/leased |
481 | |
| Distributors/resellers |
150 | |
| Total Middle East/Africa |
631 | |
| Worldwide |
||
| Owned/leased |
9,965 | |
| Distributors/resellers |
17,755 | |
| Total worldwide |
27,720 | |
29
Information with regard to the Chemical segment follows:
ExxonMobil’s Chemical segment manufactures and sells petrochemicals. The Chemical business supplies olefins, polyolefins, aromatics, and a wide variety of other petrochemicals.
Chemical Complex Capacity at Year-End 2009 (1)(2)
| Ethylene | Polyethylene | Polypropylene | Paraxylene | ExxonMobil Interest % |
|||||||||
| North America |
|||||||||||||
| Baton Rouge |
Louisiana |
1.0 | 1.3 | 0.4 | — | 100 | |||||||
| Baytown |
Texas |
2.2 | — | 0.8 | 0.6 | 100 | |||||||
| Beaumont |
Texas |
0.8 | 1.0 | — | 0.3 | 100 | |||||||
| Mont Belvieu |
Texas |
— | 1.0 | — | — | 100 | |||||||
| Sarnia |
Ontario |
0.3 | 0.5 | — | — | 69.6 | |||||||
| Total North America |
4.3 | 3.8 | 1.2 | 0.9 | |||||||||
| Europe |
|||||||||||||
| Antwerp |
Belgium |
0.5 | 0.4 | — | — | 35 | (3) | ||||||
| Fawley |
United Kingdom |
0.1 | — | — | — | 100 | |||||||
| Fife |
United Kingdom |
0.4 | — | — | — | 50 | |||||||
| Meerhout |
Belgium |
— | 0.5 | — | — | 100 | |||||||
| Notre-Dame-de- |
France |
0.4 | 0.4 | 0.3 | — | 100 | |||||||
| Rotterdam |
Netherlands |
— | — | — | 0.7 | 100 | |||||||
| Total Europe |
1.4 | 1.3 | 0.3 | 0.7 | |||||||||
| Middle East |
|||||||||||||
| Al Jubail |
Saudi Arabia |
0.6 | 0.6 | — | — | 50 | |||||||
| Yanbu |
Saudi Arabia |
1.0 | 0.7 | 0.2 | — | 50 | |||||||
| Total Middle East |
1.6 | 1.3 | 0.2 | — | |||||||||
| Asia Pacific |
|||||||||||||
| Fujian |
China |
0.2 | 0.2 | 0.1 | 0.2 | 25 | |||||||
| Kawasaki |
Japan |
0.5 | 0.1 | — | — | 50 | |||||||
| Singapore |
Singapore |
0.9 | 0.6 | 0.4 | 0.9 | 100 | |||||||
| Sriracha |
Thailand |
— | — | — | 0.5 | 66 | |||||||
| Total Asia Pacific |
1.6 | 0.9 | 0.5 | 1.6 | |||||||||
| All Other |
— | — | — | 0.6 | |||||||||
| Total Worldwide |
8.9 | 7.3 | 2.2 | 3.8 | |||||||||
| (1) | Capacity for ethylene, polyethylene, polypropylene and paraxylene in millions of metric tons per year. |
| (2) | Capacity reflects 100 percent for operations of ExxonMobil and majority-owned subsidiaries. For companies owned 50 percent or less, capacity is ExxonMobil’s interest. |
| (3) | Net ExxonMobil ethylene capacity is 35%. Net ExxonMobil polyethylene capacity is 100%. |
30
As reported in the Corporation’s Form 10-Q for the third quarter of 2009, in September 2009, two shareholders filed purported shareholder derivative petitions, which have been consolidated and captioned In re Exxon Mobil, Corp. Derivative Litigation, in the District Court of Dallas County, Texas, naming certain current and former directors as defendants and ExxonMobil as a nominal defendant. The petitions claim that the individual defendants breached their fiduciary duties by, among other things, allegedly failing to properly supervise the management of land leases overlaying hydrocarbon resources in the Point Thomson Unit on the Northern Slope of Alaska. The petitions also allege that the individual defendants caused the company to make materially false and misleading statements concerning the leases and caused the waste of corporate assets. The petitions seek damages from the individual defendants in favor of ExxonMobil, equitable relief to remedy their alleged breaches, and costs and expenses of the action. The defendants have filed pleadings with the court seeking dismissal of both cases for failure to make a demand on the Corporation and failure to plead particularized facts to excuse a demand.
As reported in the Corporation’s Form 10-Q for the third quarter of 2009, in October 2009, a purported shareholder complaint captioned Resnik v. Boskin et al., alleging direct and derivative claims, was filed in the United States District Court for the District of New Jersey, naming the present directors, the “named executive officers” listed in the Corporation’s 2009 Proxy Statement (as defined in Securities and Exchange Commission regulations) and ExxonMobil as defendants. The complaint was amended in December 2009, alleging that the defendants made materially false or misleading proxy solicitations in connection with the 2008 and 2009 shareholder votes regarding the election of directors and failed to seek stockholder reapproval of the Exxon Mobil Corporation 2003 Incentive Program to qualify certain incentive compensation paid to the named executive officers as properly deductible expenditures. The amended complaint also alleges, on behalf of the Corporation, that these acts injured the company, breached fiduciary duties and constituted waste. The amended complaint seeks various injunctive remedies, including corrective disclosure, new election of directors after corrective disclosure, enjoining candidates from serving on the Board until a new election occurs, stockholder reapproval of the program, enjoining payments under the program and short term incentive program to the named executive officers, damages from the individual defendants in favor of ExxonMobil, and costs and expenses of the action. The defendants plan to file a motion seeking dismissal of the lawsuit.
Refer to the relevant portions of “Note 15: Litigation and Other Contingencies” of the Financial Section of this report for additional information on legal proceedings.
Item 4. Submission of Matters to a Vote of Security Holders.
None.
31
Executive Officers of the Registrant [pursuant to Instruction 3 to Regulation S-K, Item 401(b)].
| Name |
Age as of 2010 |
Title (Held Office Since) | ||
| R. W. Tillerson |
57 |
Chairman of the Board (2006) | ||
| M. W. Albers |
53 |
Senior Vice President (2007) | ||
| M. J. Dolan |
56 |
Senior Vice President (2008) | ||
| D. D. Humphreys |
62 |
Senior Vice President (2006) and Treasurer (2004) | ||
| A. P. Swiger |
53 |
Senior Vice President (2009) | ||
| S. J. Balagia |
58 |
Vice President and General Counsel (Effective March 1, 2010) | ||
| A. T. Cejka |
58 |
Vice President (2004) | ||
| W. M. Colton |
56 |
Vice President - Strategic Planning (2009) | ||
| H. R. Cramer |
59 |
Vice President (1999) | ||
| N. W. Duffin |
53 |
President, ExxonMobil Development Company (2007) | ||
| R. S. Franklin |
52 |
Vice President (2009) | ||
| S. J. Glass, Jr. |
62 | Vice President (2008) | ||
| A. J. Kelly |
52 |
Vice President (2007) | ||
| R. M. Kruger |
50 | Vice President (2008) | ||
| P. T. Mulva |
58 |
Vice President and Controller (2004) | ||
| S. D. Pryor |
60 |
Vice President (2004) | ||
| D. S. Rosenthal |
53 | Vice President - Investor Relations and Secretary (2008) | ||
| J. M. Spellings |
48 | Vice President and General Tax Counsel (Effective March 1, 2010) | ||
| T. R. Walters |
55 | Vice President (2009) |
For at least the past five years, Messrs. Cejka, Cramer, Dolan, Humphreys, Mulva, Pryor and Tillerson have been employed as executives of the registrant. Mr. Tillerson was a Senior Vice President and then President, a title he continues to hold, before becoming Chairman of the Board. Mr. Albers was President of ExxonMobil Development Company before becoming Senior Vice President. Mr. Dolan was President of ExxonMobil Chemical Company before becoming Senior Vice President. Mr. Humphreys was Vice President and Controller and then Vice President and Treasurer before becoming Senior Vice President and Treasurer. Mr. Balagia was Assistant General Counsel before becoming Vice President and General Counsel. Mr. Colton was Assistant Treasurer before becoming Vice President—Strategic Planning. Mr. Spellings was Associate General Tax Counsel before becoming Vice President and General Tax Counsel. Mr. Mulva was Vice President—Investor Relations and Secretary before becoming Vice President and Controller. Mr. Rosenthal was Assistant Controller before becoming Vice President—Investor Relations and Secretary. Mr. Swiger was President of ExxonMobil Gas & Power Marketing Company before becoming Senior Vice President.
The following executive officers of the registrant have also served as executives of the subsidiaries, affiliates or divisions of the registrant shown opposite their names during the five years preceding December 31, 2009.
| ExxonMobil Chemical Company |
Dolan, Glass, Jr. and Pryor | |||
| ExxonMobil Development Company |
Albers, Duffin and Walters | |||
| ExxonMobil Exploration Company |
Cejka | |||
| ExxonMobil Fuels Marketing Company |
Cramer | |||
| ExxonMobil Gas & Power Marketing Company |
Colton, Franklin, Swiger and Walters | |||
| ExxonMobil Lubricants & Petroleum Specialties Company |
Kelly | |||
| ExxonMobil Production Company |
Duffin, Kruger, Rosenthal, Swiger and Walters | |||
| ExxonMobil Refining & Supply Company |
Dolan, Glass, Jr. and Pryor | |||
Officers are generally elected by the Board of Directors at its meeting on the day of each annual election of directors, with each such officer serving until a successor has been elected and qualified.
32
PART II
| Item 5. | Market for Registrant’s Common Equity, Related Stockholder Matters and Issuer Purchases of Equity Securities. |
Reference is made to the “Quarterly Information” portion of the Financial Section of this report.
| Issuer Purchases of Equity Securities for Quarter Ended December 31, 2009 | |||||||||
| Period |
Total Number of Shares Purchased |
Average Price Paid per Share |
Total Number of Shares Purchased as Part of Publicly Announced Plans or Programs |
Maximum Number of Shares that May Yet Be Purchased Under the Plans or Programs |
|||||
| October, 2009 |
18,265,518 | 71.06 | 18,265,518 | ||||||
| November, 2009 |
5,615,488 | 73.78 | 5,615,488 | ||||||
| December, 2009 |
9,172,391 | 71.88 | 9,172,391 | ||||||
| Total |
33,053,397 | 71.75 | 33,053,397 | (See note 1 |
) | ||||
Note 1—On August 1, 2000, the Corporation announced its intention to resume purchases of shares of its common stock for the treasury both to offset shares issued in conjunction with company benefit plans and programs and to gradually reduce the number of shares outstanding. The announcement did not specify an amount or expiration date. The Corporation has continued to purchase shares since this announcement and to report purchased volumes in its quarterly earnings releases. In its most recent earnings release dated February 1, 2010, the Corporation stated that first quarter 2010 share purchases are continuing at a pace consistent with fourth quarter 2009 share reduction spending of $2.0 billion. However, total purchases for the quarter may be less due to trading restrictions during the proxy solicitation period for the XTO merger. Purchases may be made in both the open market and through negotiated transactions, and purchases may be increased, decreased or discontinued at any time without prior notice.
33
Item 6. Selected Financial Data.
| Years Ended December 31, | |||||||||||||||
| 2009 | 2008 | 2007 | 2006 | 2005 | |||||||||||
| (millions of dollars, except per share amounts) | |||||||||||||||
| Sales and other operating revenue (1)(2) | $ | 301,500 | $ | 459,579 | $ | 390,328 | $ | 365,467 | $ | 358,955 | |||||
| (1) Sales-based taxes included. |
$ | 25,936 | $ | 34,508 | $ | 31,728 | $ | 30,381 | $ | 30,742 | |||||
| (2) Includes amounts for purchases/sales contracts with the same counterparty for 2005. | |||||||||||||||
| Net income attributable to ExxonMobil | $ | 19,280 | $ | 45,220 | $ | 40,610 | $ | 39,500 | $ | 36,130 | |||||
| Earnings per common share (3) | $ | 3.99 | $ | 8.70 | $ | 7.31 | $ | 6.64 | $ | 5.74 | |||||
| Earnings per common share - assuming dilution (3) | $ | 3.98 | $ | 8.66 | $ | 7.26 | $ | 6.60 | $ | 5.70 | |||||
| (3) Prior periods have been adjusted retrospectively. See “Earnings per Share” in “Note 2: Accounting Changes” in the Financial Section of this report | |||||||||||||||
| Cash dividends per common share | $ | 1.66 | $ | 1.55 | $ | 1.37 | $ | 1.28 | $ | 1.14 | |||||
| Total assets | $ | 233,323 | $ | 228,052 | $ | 242,082 | $ | 219,015 | $ | 208,335 | |||||
| Long-term debt | $ | 7,129 | $ | 7,025 | $ | 7,183 | $ | 6,645 | $ | 6,220 | |||||
Item 7. Management’s Discussion and Analysis of Financial Condition and Results of Operations.
Reference is made to the section entitled “Management’s Discussion and Analysis of Financial Condition and Results of Operations” in the Financial Section of this report.
Item 7A. Quantitative and Qualitative Disclosures About Market Risk.
Reference is made to the section entitled “Market Risks, Inflation and Other Uncertainties”, excluding the part entitled “Inflation and Other Uncertainties,” in the Financial Section of this report. All statements other than historical information incorporated in this Item 7A are forward-looking statements. The actual impact of future market changes could differ materially due to, among other things, factors discussed in this report.
Item 8. Financial Statements and Supplementary Data.
Reference is made to the following in the Financial Section of this report:
| • | Consolidated financial statements, together with the report thereon of PricewaterhouseCoopers LLP dated February 26, 2010, beginning with the section entitled “Report of Independent Registered Public Accounting Firm” and continuing through “Note 18: Income, Sales-Based and Other Taxes”; |
| • | “Quarterly Information” (unaudited); |
| • | “Supplemental Information on Oil and Gas Exploration and Production Activities” (unaudited); and |
| • | “Frequently Used Terms” (unaudited). |
Financial Statement Schedules have been omitted because they are not applicable or the required information is shown in the consolidated financial statements or notes thereto.
34
Item 9. Changes in and Disagreements With Accountants on Accounting and Financial Disclosure.
None.
Item 9A. Controls and Procedures.
Management’s Evaluation of Disclosure Controls and Procedures
As indicated in the certifications in Exhibit 31 of this report, the Corporation’s chief executive officer, principal financial officer and principal accounting officer have evaluated the Corporation’s disclosure controls and procedures as of December 31, 2009. Based on that evaluation, these officers have concluded that the Corporation’s disclosure controls and procedures are effective in ensuring that information required to be disclosed by the Corporation in the reports that it files or submits under the Securities Exchange Act of 1934, as amended, is accumulated and communicated to them in a manner that allows for timely decisions regarding required disclosures and are effective in ensuring that such information is recorded, processed, summarized and reported within the time periods specified in the Securities and Exchange Commission’s rules and forms.
Management’s Report on Internal Control Over Financial Reporting
Management, including the Corporation’s chief executive officer, principal financial officer and principal accounting officer, is responsible for establishing and maintaining adequate internal control over the Corporation’s financial reporting. Management conducted an evaluation of the effectiveness of internal control over financial reporting based on criteria established in Internal Control - Integrated Framework issued by the Committee of Sponsoring Organizations of the Treadway Commission. Based on this evaluation, management concluded that Exxon Mobil Corporation’s internal control over financial reporting was effective as of December 31, 2009.
PricewaterhouseCoopers LLP, an independent registered public accounting firm, audited the effectiveness of the Corporation’s internal control over financial reporting as of December 31, 2009, as stated in their report included in the Financial Section of this report.
Changes in Internal Control Over Financial Reporting
There were no changes during the Corporation’s last fiscal quarter that materially affected, or are reasonably likely to materially affect, the Corporation’s internal control over financial reporting.
Effective April 1, 2010, the annual salary for M.J. Dolan will increase to $935,000. Like all other ExxonMobil executive officers, Mr. Dolan is an “at will” employee of the Corporation and does not have an employment contract.
35
PART III
Item 10. Directors, Executive Officers and Corporate Governance.
Reference is made to the following in the Proxy Information Section of this report:
| • | The section entitled “Director Information”; |
| • | The portion entitled “Section 16(a) Beneficial Ownership Reporting Compliance” of the section entitled “Director and Executive Officer Stock Ownership”; and |
| • | The portions entitled “Director Qualifications” and “Code of Ethics and Business Conduct” of the section entitled “Corporate Governance”. |
The Board has appointed an Audit Committee. The members of the Audit Committee are: M. J. Boskin, L. R. Faulkner and S. S Reinemund. The Board has determined that all members of the Committee are financially literate within the meaning of the NYSE standards, and that all are “audit committee financial experts” as defined in the SEC rules.
The procedures by which shareholders may recommend nominees for consideration by the Board Affairs Committee as director nominees have not changed materially since last year.
Item 11. Executive Compensation.
Reference is made to the sections entitled “Director Compensation,” “Compensation Committee Report”, “Compensation Discussion and Analysis” and “Executive Compensation Tables” of the Proxy Information Section of this report.
The Compensation Committee determines whether ExxonMobil’s compensation policies and practices could result in inappropriate risk-taking. Based on it’s assessment, the Committee does not believe that ExxonMobil’s compensation policies and practices create any material adverse risks for the Company for the following reasons:
Inappropriate risk-taking is discouraged by requiring senior executives to hold a substantial portion of their equity incentive award for their entire career and beyond retirement. These lengthy holding periods are tailored to our business model. The Compensation Committee requires that these equity grants with long holding periods comprise 50 to 70 percent of total compensation for Named Executive Officers as depicted on page 133 of the “Compensation Discussion and Analysis,” whereas the annual bonus award was only about 10 percent of total annual compensation in 2009.
Payout of 50 percent of the annual bonus is delayed and subject to risk of forfeiture, which is a unique feature of the annual bonus program relative to many comparator companies and further discourages inappropriate risk-taking; the timing of the delayed payout is determined by earnings performance.
Executives below the Named Executive Officers participate in the same plans which are also reviewed by the Compensation Committee; therefore, inappropriate risk-taking is discouraged at all levels of the Company through similar compensation design features and allocation of awards.
Finally, it should also be noted that a large percentage of career compensation for all executives and employees is in the form of a defined benefit pension which requires many years of dedicated service to the Company to have material value and is based on a standard retirement age of 65, with early retirement eligibility at age 55 with a minimum of 15 years of service. This is another dimension of total compensation that discourages inappropriate risk-taking; instead, it encourages executives to take a long-term view when making business decisions and to focus on achieving sustainable growth for shareholders.
36
Item 12. Security Ownership of Certain Beneficial Owners and Management and Related Stockholder Matters.
The information required under Item 403 of Regulation S-K is included in the section entitled “Director and Executive Officer Stock Ownership” of the Proxy Information Section of this report. Reference is also made to the section entitled “Certain Beneficial Owners” of the Proxy Information Section of this report.
Equity Compensation Plan Information
| (a) | (b) | (c) | ||||
| Plan Category |
Number of Securities to be Issued Upon Exercise of Outstanding Options, Warrants and Rights |
Weighted- Average Exercise Price of Outstanding Options, Warrants and Rights (1) |
Number of Securities Remaining Available for Future Issuance Under Equity Compensation Plans [Excluding Securities Reflected in Column (a)] | |||
| Equity compensation plans approved by security holders |
50,375,746(2) | $40.92 | 153,372,424(3)(4) | |||
| Equity compensation plans not approved by security holders |
0 |
0 | 0 | |||
| Total |
50,375,746 |
$40.92 |
153,372,424 | |||
| (1) | The exercise price of each option reflected in this table is equal to the fair market value of the Company’s common stock on the date the option was granted. The weighted-average price reflects three prior option grants that are still outstanding. |
| (2) | Includes 41,473,406 options granted under the 1993 Incentive Program and 8,902,340 restricted stock units to be settled in shares. |
| (3) | Available shares can be granted in the form of restricted stock, options, or other stock-based awards. Includes 152,591,224 shares available for award under the 2003 Incentive Program and 781,200 shares available for award under the 2004 Non-Employee Director Restricted Stock Plan. |
| (4) | Under the 2004 Non-Employee Director Restricted Stock Plan approved by shareholders in May 2004, and the related standing resolution adopted by the Board, each non-employee director automatically receives 8,000 shares of restricted stock when first elected to the Board and, if the director remains in office, an additional 2,500 restricted shares each following year. While on the Board, each non-employee director receives the same cash dividends on restricted shares as a holder of regular common stock, but the director is not allowed to sell the shares. The restricted shares may be forfeited if the director leaves the Board early. |
Item 13. Certain Relationships and Related Transactions, and Director Independence.
Information provided in response to this Item 13 is included in the portions entitled “Related Person Transactions and Procedures” and “Director Independence” of the section entitled “Corporate Governance” of the Proxy Information Section of this report.
37
Item 14. Principal Accounting Fees and Services.
Reference is made to the section entitled “Auditor Information” of the Proxy Information Section of this report.
The Audit Committee has adopted specific policies and procedures for pre-approving fees paid to the independent auditors. Under the Audit Committee’s approach, an annual program of work is approved each October for the following categories of services: Audit, Audit-Related, and Tax. Additional engagements may be brought forward from time to time for pre-approval by the Audit Committee. Pre-approvals apply to engagements within a category of service, and cannot be transferred between categories. If fees might otherwise exceed pre-approved amounts for any category of permissible services, the incremental amounts must be reviewed and pre-approved prior to commitment. The complete text of the Audit Committee’s pre-approval policies and procedures is posted on the Corporate Governance section of ExxonMobil’s website.
PART IV
Item 15. Exhibits, Financial Statement Schedules.
| (a) | (1) and (2) Financial Statements: |
See Table of Contents of the Financial Section of this report.
| (a) | (3) Exhibits: |
See Index to Exhibits of this report.
38
TABLE OF CONTENTS
| 40 | ||
| 41 | ||
| 42 | ||
| 44 | ||
| Management’s Discussion and Analysis of Financial Condition and Results of Operations |
||
| 45 | ||
| 46 | ||
| 46 | ||
| 46 | ||
| 49 | ||
| 50 | ||
| 53 | ||
| 54 | ||
| 54 | ||
| 55 | ||
| Recently Issued Statements of Financial Accounting Standards |
56 | |
| 56 | ||
| Management’s Report on Internal Control Over Financial Reporting |
60 | |
| 60 | ||
| Consolidated Financial Statements |
||
| 62 | ||
| 63 | ||
| 64 | ||
| 65 | ||
| 66 | ||
| 67 | ||
| 68 | ||
| 69 | ||
| 69 | ||
| 69 | ||
| 70 | ||
| 71 | ||
| 8. Property, Plant and Equipment and Asset Retirement Obligations |
71 | |
| 72 | ||
| 74 | ||
| 74 | ||
| 75 | ||
| 75 | ||
| 80 | ||
| 82 | ||
| 84 | ||
| 90 | ||
| 92 | ||
| Supplemental Information on Oil and Gas Exploration and Production Activities |
94 | |
| 106 |
39
| Financial |
Earnings After Income Taxes |
Average Capital Employed |
Return on Average Capital Employed |
Capital and Exploration Expenditures | ||||||||||||||||||
| 2009 |
2008 |
2009 |
2008 |
2009 |
2008 |
2009 |
2008 | |||||||||||||||
| (millions of dollars) | (percent) | (millions of dollars) | ||||||||||||||||||||
| Upstream |
||||||||||||||||||||||
| United States |
$ | 2,893 | $ | 6,243 | $ | 15,865 | $ | 14,651 | 18.2 | 42.6 | $ | 3,585 | $ | 3,334 | ||||||||
| Non-U.S. |
14,214 | 29,159 | 57,336 | 51,413 | 24.8 | 56.7 | 17,119 | 16,400 | ||||||||||||||
| Total |
$ | 17,107 | $ | 35,402 | $ | 73,201 | $ | 66,064 | 23.4 | 53.6 | $ | 20,704 | $ | 19,734 | ||||||||
| Downstream |
||||||||||||||||||||||
| United States |
$ | (153) | $ | 1,649 | $ | 7,306 | $ | 6,963 | (2.1) | 23.7 | $ | 1,511 | $ | 1,636 | ||||||||
| Non-U.S. |
1,934 | 6,502 | 17,793 | 18,664 | 10.9 | 34.8 | 1,685 | 1,893 | ||||||||||||||
| Total |
$ | 1,781 | $ | 8,151 | $ | 25,099 | $ | 25,627 | 7.1 | 31.8 | $ | 3,196 | $ | 3,529 | ||||||||
| Chemical |
||||||||||||||||||||||
| United States |
$ | 769 | $ | 724 | $ | 4,370 | $ | 4,535 | 17.6 | 16.0 | $ | 319 | $ | 441 | ||||||||
| Non-U.S. |
1,540 | 2,233 | 12,190 | 9,990 | 12.6 | 22.4 | 2,829 | 2,378 | ||||||||||||||
| Total |
$ | 2,309 | $ | 2,957 | $ | 16,560 | $ | 14,525 | 13.9 | 20.4 | $ | 3,148 | $ | 2,819 | ||||||||
| Corporate and financing |
(1,917) | (1,290) | 10,190 | 23,467 | — | — | 44 | 61 | ||||||||||||||
| Total |
$ | 19,280 | $ | 45,220 | $ | 125,050 | $ | 129,683 | 16.3 | 34.2 | $ | 27,092 | $ | 26,143 | ||||||||
See Frequently Used Terms for a definition and calculation of capital employed and return on average capital employed.
| Operating |
2009 |
2008 | ||
| (thousands of barrels daily) | ||||
| Net liquids production |
||||
| United States |
384 | 367 | ||
| Non-U.S. |
2,003 | 2,038 | ||
| Total |
2,387 | 2,405 | ||
| (millions of cubic feet daily) | ||||
| Natural gas production available for sale |
||||
| United States |
1,275 | 1,246 | ||
| Non-U.S. |
7,998 | 7,849 | ||
| Total |
9,273 | 9,095 | ||
| (thousands of oil-equivalent barrels daily) | ||||
| Oil-equivalent production (1) |
3,932 | 3,921 | ||
| (thousands of barrels daily) | ||||
| Refinery throughput |
||||
| United States |
1,767 | 1,702 | ||
| Non-U.S. |
3,583 | 3,714 | ||
| Total |
5,350 | 5,416 | ||
| (thousands of barrels daily) | ||||
| Petroleum product sales |
||||
| United States |
2,523 | 2,540 | ||
| Non-U.S. |
3,905 | 4,221 | ||
| Total |
6,428 | 6,761 | ||
| (thousands of metric tons) | ||||
| Chemical prime product sales |
||||
| United States |
9,649 | 9,526 | ||
| Non-U.S. |
15,176 | 15,456 | ||
| Total |
24,825 | 24,982 | ||
| (1) | Gas converted to oil-equivalent at 6 million cubic feet = 1 thousand barrels. |
40
| 2009 |
2008 |
2007 |
2006 |
2005 |
||||||||||||||||
| (millions of dollars, except per share amounts) | ||||||||||||||||||||
| Sales and other operating revenue (1) (2) |
$ | 301,500 | $ | 459,579 | $ | 390,328 | $ | 365,467 | $ | 358,955 | ||||||||||
| Earnings |
||||||||||||||||||||
| Upstream |
$ | 17,107 | $ | 35,402 | $ | 26,497 | $ | 26,230 | $ | 24,349 | ||||||||||
| Downstream |
1,781 | 8,151 | 9,573 | 8,454 | 7,992 | |||||||||||||||
| Chemical |
2,309 | 2,957 | 4,563 | 4,382 | 3,943 | |||||||||||||||
| Corporate and financing |
(1,917 | ) | (1,290 | ) | (23 | ) | 434 | (154 | ) | |||||||||||
| Net income attributable to ExxonMobil |
$ | 19,280 | $ | 45,220 | $ | 40,610 | $ | 39,500 | $ | 36,130 | ||||||||||
| Earnings per common share |
$ | 3.99 | $ | 8.70 | $ | 7.31 | $ | 6.64 | $ | 5.74 | ||||||||||
| Earnings per common share – assuming dilution |
$ | 3.98 | $ | 8.66 | $ | 7.26 | $ | 6.60 | $ | 5.70 | ||||||||||
| Cash dividends per common share |
$ | 1.66 | $ | 1.55 | $ | 1.37 | $ | 1.28 | $ | 1.14 | ||||||||||
| Earnings to average ExxonMobil share of equity (percent) |
17.3 | 38.5 | 34.5 | 35.1 | 33.9 | |||||||||||||||
| Working capital |
$ | 3,174 | $ | 23,166 | $ | 27,651 | $ | 26,960 | $ | 27,035 | ||||||||||
| Ratio of current assets to current liabilities (times) |
1.06 | 1.47 | 1.47 | 1.55 | 1.58 | |||||||||||||||
| Additions to property, plant and equipment |
$ | 22,491 | $ | 19,318 | $ | 15,387 | $ | 15,462 | $ | 13,839 | ||||||||||
| Property, plant and equipment, less allowances |
$ | 139,116 | $ | 121,346 | $ | 120,869 | $ | 113,687 | $ | 107,010 | ||||||||||
| Total assets |
$ | 233,323 | $ | 228,052 | $ | 242,082 | $ | 219,015 | $ | 208,335 | ||||||||||
| Exploration expenses, including dry holes |
$ | 2,021 | $ | 1,451 | $ | 1,469 | $ | 1,181 | $ | 964 | ||||||||||
| Research and development costs |
$ | 1,050 | $ | 847 | $ | 814 | $ | 733 | $ | 712 | ||||||||||
| Long-term debt |
$ | 7,129 | $ | 7,025 | $ | 7,183 | $ | 6,645 | $ | 6,220 | ||||||||||
| Total debt |
$ | 9,605 | $ | 9,425 | $ | 9,566 | $ | 8,347 | $ | 7,991 | ||||||||||
| Fixed-charge coverage ratio (times) |
26.1 | 52.2 | 49.9 | 46.3 | 50.2 | |||||||||||||||
| Debt to capital (percent) |
7.7 | 7.4 | 7.1 | 6.6 | 6.5 | |||||||||||||||
| Net debt to capital (percent) (3) |
(1.0 | ) | (23.0 | ) | (24.0 | ) | (20.4 | ) | (22.0 | ) | ||||||||||
| ExxonMobil share of equity at year end |
$ | 110,569 | $ | 112,965 | $ | 121,762 | $ | 113,844 | $ | 111,186 | ||||||||||
| ExxonMobil share of equity per common share |
$ | 23.39 | $ | 22.70 | $ | 22.62 | $ | 19.87 | $ | 18.13 | ||||||||||
| Weighted average number of common shares outstanding (millions) |
4,832 | 5,194 | 5,557 | 5,948 | 6,295 | |||||||||||||||
| Number of regular employees at year end (thousands) (4) |
80.7 | 79.9 | 80.8 | 82.1 | 83.7 | |||||||||||||||
| CORS employees not included above (thousands) (5) |
22.0 | 24.8 | 26.3 | 24.3 | 22.4 | |||||||||||||||
| (1) | Sales and other operating revenue includes sales-based taxes of $25,936 million for 2009, $34,508 million for 2008, $31,728 million for 2007, $30,381 million for 2006 and $30,742 million for 2005. |
| (2) | Sales and other operating revenue includes $30,810 million for 2005 for purchases/sales contracts with the same counterparty. Associated costs were included in Crude oil and product purchases. Effective January 1, 2006, these purchases/sales were recorded on a net basis with no resulting impact on net income. |
| (3) | Debt net of cash, excluding restricted cash. |
| (4) | Regular employees are defined as active executive, management, professional, technical and wage employees who work full time or part time for the Corporation and are covered by the Corporation’s benefit plans and programs. |
| (5) | CORS employees are employees of company-operated retail sites. |
41
Listed below are definitions of several of ExxonMobil’s key business and financial performance measures. These definitions are provided to facilitate understanding of the terms and their calculation.
CASH FLOW FROM OPERATIONS AND ASSET SALES
Cash flow from operations and asset sales is the sum of the net cash provided by operating activities and proceeds from sales of subsidiaries, investments and property, plant and equipment from the Consolidated Statement of Cash Flows. This cash flow reflects the total sources of cash from both operating the Corporation’s assets and from the divesting of assets. The Corporation employs a long-standing and regular disciplined review process to ensure that all assets are contributing to the Corporation’s strategic objectives. Assets are divested when they are no longer meeting these objectives or are worth considerably more to others. Because of the regular nature of this activity, we believe it is useful for investors to consider sales proceeds together with cash provided by operating activities when evaluating cash available for investment in the business and financing activities, including shareholder distributions.
| Cash flow from operations and asset sales |
2009 |
2008 |
2007 |
|||||||||
| (millions of dollars) | ||||||||||||
| Net cash provided by operating activities |
$ | 28,438 | $ | 59,725 | $ | 52,002 | ||||||
| Sales of subsidiaries, investments and property, plant and equipment |
1,545 | 5,985 | 4,204 | |||||||||
| Cash flow from operations and asset sales |
$ | 29,983 | $ | 65,710 | $ | 56,206 | ||||||
|
CAPITAL EMPLOYED
Capital employed is a measure of net investment. When viewed from the perspective of how the capital is used by the businesses, it includes ExxonMobil’s net share of property, plant and equipment and other assets less liabilities, excluding both short-term and long-term debt. When viewed from the perspective of the sources of capital employed in total for the Corporation, it includes ExxonMobil’s share of total debt and equity. Both of these views include ExxonMobil’s share of amounts applicable to equity companies, which the Corporation believes should be included to provide a more comprehensive measure of capital employed. |
| |||||||||||
| Capital employed |
2009 |
2008 |
2007 |
|||||||||
| (millions of dollars) | ||||||||||||
| Business uses: asset and liability perspective |
||||||||||||
| Total assets |
$ | 233,323 | $ | 228,052 | $ | 242,082 | ||||||
| Less liabilities and noncontrolling interests share of assets and liabilities |
||||||||||||
| Total current liabilities excluding notes and loans payable |
(49,585 | ) | (46,700 | ) | (55,929 | ) | ||||||
| Total long-term liabilities excluding long-term debt |
(58,741 | ) | (54,404 | ) | (50,543 | ) | ||||||
| Noncontrolling interests share of assets and liabilities |
(5,642 | ) | (6,044 | ) | (5,332 | ) | ||||||
| Add ExxonMobil share of debt-financed equity company net assets |
5,043 | 4,798 | 3,386 | |||||||||
| Total capital employed |
$ | 124,398 | $ | 125,702 | $ | 133,664 | ||||||
| Total corporate sources: debt and equity perspective |
||||||||||||
| Notes and loans payable |
$ | 2,476 | $ | 2,400 | $ | 2,383 | ||||||
| Long-term debt |
7,129 | 7,025 | 7,183 | |||||||||
| ExxonMobil share of equity |
110,569 | 112,965 | 121,762 | |||||||||
| Less noncontrolling interests share of total debt |
(819 | ) | (1,486 | ) | (1,050 | ) | ||||||
| Add ExxonMobil share of equity company debt |
5,043 | 4,798 | 3,386 | |||||||||
| Total capital employed |
$ | 124,398 | $ | 125,702 | $ | 133,664 | ||||||
42
RETURN ON AVERAGE CAPITAL EMPLOYED
Return on average capital employed (ROCE) is a performance measure ratio. From the perspective of the business segments, ROCE is annual business segment earnings divided by average business segment capital employed (average of beginning and end-of-year amounts). These segment earnings include ExxonMobil’s share of segment earnings of equity companies, consistent with our capital employed definition, and exclude the cost of financing. The Corporation’s total ROCE is net income attributable to ExxonMobil excluding the after-tax cost of financing, divided by total corporate average capital employed. The Corporation has consistently applied its ROCE definition for many years and views it as the best measure of historical capital productivity in our capital-intensive, long-term industry, both to evaluate management’s performance and to demonstrate to shareholders that capital has been used wisely over the long term. Additional measures, which are more cash flow-based, are used to make investment decisions.
| Return on average capital employed |
2009 |
2008 |
2007 |
|||||||||
| (millions of dollars) | ||||||||||||
| Net income attributable to ExxonMobil |
$ | 19,280 | $ | 45,220 | $ | 40,610 | ||||||
| Financing costs (after tax) |
||||||||||||
| Gross third-party debt |
(303 | ) | (343 | ) | (339 | ) | ||||||
| ExxonMobil share of equity companies |
(285 | ) | (325 | ) | (204 | ) | ||||||
| All other financing costs – net |
(483 | ) | 1,485 | 268 | ||||||||
| Total financing costs |
(1,071 | ) | 817 | (275 | ) | |||||||
| Earnings excluding financing costs |
$ | 20,351 | $ | 44,403 | $ | 40,885 | ||||||
| Average capital employed |
$ | 125,050 | $ | 129,683 | $ | 128,760 | ||||||
| Return on average capital employed – corporate total |
16.3 | % | 34.2 | % | 31.8 | % | ||||||
43
| 2009 |
2008 | |||||||||||||||||||||
| First Quarter |
Second Quarter |
Third Quarter |
Fourth Quarter |
Year |
First Quarter |
Second Quarter |
Third Quarter |
Fourth Quarter |
Year | |||||||||||||
| Volumes |
||||||||||||||||||||||
| (thousands of barrels daily) | ||||||||||||||||||||||
| Production of crude oil and natural gas liquids, synthetic oil and bitumen |
2,476 | 2,346 | 2,335 | 2,393 | 2,387 | 2,468 | 2,391 | 2,290 | 2,472 | 2,405 | ||||||||||||
| Refinery throughput |
5,381 | 5,290 | 5,352 | 5,379 | 5,350 | 5,526 | 5,472 | 5,354 | 5,313 | 5,416 | ||||||||||||
| Petroleum product sales |
6,434 | 6,487 | 6,301 | 6,489 | 6,428 | 6,821 | 6,775 | 6,688 | 6,761 | 6,761 | ||||||||||||
| (millions of cubic feet daily) | ||||||||||||||||||||||
| Natural gas production available for sale |
10,187 | 8,041 | 8,155 | 10,717 | 9,273 | 10,229 | 8,489 | 7,820 | 9,849 | 9,095 | ||||||||||||
| (thousands of oil-equivalent barrels daily) | ||||||||||||||||||||||
| Oil-equivalent production (1) |
4,174 | 3,686 | 3,694 | 4,179 | 3,932 | 4,173 | 3,806 | 3,593 | 4,113 | 3,921 | ||||||||||||
| (thousands of metric tons) | ||||||||||||||||||||||
| Chemical prime product sales |
5,527 | 6,267 | 6,356 | 6,675 | 24,825 | 6,578 | 6,718 | 6,060 | 5,626 | 24,982 | ||||||||||||
| Summarized financial data |
||||||||||||||||||||||
| (millions of dollars) | ||||||||||||||||||||||
| Sales and other operating revenue (2) |
$ | 62,128 | 72,167 | 80,090 | 87,115 | 301,500 | $ | 113,223 | 133,776 | 132,085 | 80,495 | 459,579 | ||||||||||
| Gross profit (3) |
$ | 23,562 | 24,231 | 27,377 | 28,580 | 103,750 | $ | 40,255 | 43,925 | 45,901 | 29,760 | 159,841 | ||||||||||
| Net income attributable to ExxonMobil |
$ | 4,550 | 3,950 | 4,730 | 6,050 | 19,280 | $ | 10,890 | 11,680 | 14,830 | 7,820 | 45,220 | ||||||||||
| Per share data |
||||||||||||||||||||||
| (dollars per share) | ||||||||||||||||||||||
| Earnings per common share (4) |
$ | 0.92 | 0.82 | 0.98 | 1.27 | 3.99 | $ | 2.03 | 2.24 | 2.86 | 1.55 | 8.70 | ||||||||||
| Earnings per common share – assuming dilution (4) |
$ | 0.92 | 0.81 | 0.98 | 1.27 | 3.98 | $ | 2.02 | 2.22 | 2.85 | 1.54 | 8.66 | ||||||||||
| Dividends per common share |
$ | 0.40 | 0.42 | 0.42 | 0.42 | 1.66 | $ | 0.35 | 0.40 | 0.40 | 0.40 | 1.55 | ||||||||||
| Common stock prices |
||||||||||||||||||||||
| High |
$ | 82.73 | 74.83 | 72.79 | 76.54 | 82.73 | $ | 94.74 | 96.12 | 89.63 | 83.64 | 96.12 | ||||||||||
| Low |
$ | 61.86 | 64.50 | 64.46 | 66.11 | 61.86 | $ | 77.55 | 84.26 | 71.51 | 56.51 | 56.51 | ||||||||||
| (1) | Gas converted to oil-equivalent at 6 million cubic feet = 1 thousand barrels. |
| (2) | Includes amounts for sales-based taxes. |
| (3) | Gross profit equals sales and other operating revenue less estimated costs associated with products sold. |
| (4) | Computed using the average number of shares outstanding during each period. The sum of the four quarters may not add to the full year. |
The price range of ExxonMobil common stock is as reported on the composite tape of the several U.S. exchanges where ExxonMobil common stock is traded. The principal market where ExxonMobil common stock (XOM) is traded is the New York Stock Exchange, although the stock is traded on other exchanges in and outside the United States.
There were 525,529 registered shareholders of ExxonMobil common stock at December 31, 2009. At January 31, 2010, the registered shareholders of ExxonMobil common stock numbered 523,748.
On January 27, 2010, the Corporation declared a $0.42 dividend per common share, payable March 10, 2010.
44
MANAGEMENT’S DISCUSSION AND ANALYSIS OF FINANCIAL CONDITION AND RESULTS OF OPERATIONS
| |
2009 |
2008 |
2007 |
|||||||||
| (millions of dollars, except per share amounts) | ||||||||||||
| Earnings (U.S. GAAP) |
||||||||||||
| Upstream |
||||||||||||
| United States |
$ | 2,893 | $ | 6,243 | $ | 4,870 | ||||||
| Non-U. S. |
14,214 | 29,159 | 21,627 | |||||||||
| Downstream |
||||||||||||
| United States |
(153 | ) | 1,649 | 4,120 | ||||||||
| Non-U. S. |
1,934 | 6,502 | 5,453 | |||||||||
| Chemical |
||||||||||||
| United States |
769 | 724 | 1,181 | |||||||||
| Non-U. S. |
1,540 | 2,233 | 3,382 | |||||||||
| Corporate and financing |
(1,917 | ) | (1,290 | ) | (23 | ) | ||||||
| Net income attributable to ExxonMobil |
$ | 19,280 | $ | 45,220 | $ | 40,610 | ||||||
| Earnings per common share |
$ | 3.99 | $ | 8.70 | $ | 7.31 | ||||||
| Earnings per common share – assuming dilution |
$ | 3.98 | $ | 8.66 | $ | 7.26 | ||||||
| Special items included in earnings |
||||||||||||
| Non-U. S. Upstream |
||||||||||||
| Gain on German natural gas transportation business sale |
$ | — | $ | 1,620 | $ | — | ||||||
| Corporate and financing |
||||||||||||
| Valdez litigation |
$ | (140 | ) | $ | (460 | ) | $ | — | ||||
References in this discussion to total corporate earnings mean net income attributable to ExxonMobil (U.S. GAAP) from the consolidated income statement. Unless otherwise indicated, references to earnings, special items, Upstream, Downstream, Chemical and Corporate and Financing segment earnings, and earnings per share are ExxonMobil’s share after excluding amounts attributable to noncontrolling interests.
45
MANAGEMENT’S DISCUSSION AND ANALYSIS OF FINANCIAL CONDITION AND RESULTS OF OPERATIONS
Statements in this discussion regarding expectations, plans and future events or conditions are forward-looking statements. Actual future results, including demand growth and energy source mix; capacity increases; production growth and mix; rates of field decline; financing sources; the resolution of contingencies and uncertain tax positions; environmental and capital expenditures; and benefits realized from the XTO Energy transaction could differ materially depending on a number of factors, such as changes in the supply of and demand for crude oil, natural gas, and petroleum and petrochemical products; the outcome of commercial negotiations; political or regulatory events, including the timing and conditions of clearance for the XTO Energy transaction; our ability to integrate XTO Energy’s business with our own; and other factors discussed herein and in Item 1A of ExxonMobil’s 2009 Form 10-K.
The following discussion and analysis of ExxonMobil’s financial results, as well as the accompanying financial statements and related notes to consolidated financial statements to which they refer, are the responsibility of the management of Exxon Mobil Corporation. The Corporation’s accounting and financial reporting fairly reflect its straightforward business model involving the extracting, manufacturing and marketing of hydrocarbons and hydrocarbon-based products. The Corporation’s business model involves the production (or purchase), manufacture and sale of physical products, and all commercial activities are directly in support of the underlying physical movement of goods. Our consistent, conservative approach to financing the capital-intensive needs of the Corporation has helped ExxonMobil to sustain the “triple-A” status of its long-term debt securities for 91 years.
ExxonMobil, with its resource base, financial strength, disciplined investment approach and technology portfolio, is well-positioned to participate in substantial investments to develop new energy supplies. While commodity prices are volatile on a short-term basis and depend on supply and demand, ExxonMobil’s investment decisions are based on our long-term business outlook, using a disciplined approach in selecting and pursuing the most attractive investment opportunities. The corporate plan is a fundamental annual management process that is the basis for setting near-term operating and capital objectives in addition to providing the longer-term economic assumptions used for investment evaluation purposes. Volumes are based on individual field production profiles, which are also updated annually. Prices for crude oil, natural gas and refined products are based on corporate plan assumptions developed annually by major region and are utilized for investment evaluation purposes. Potential investment opportunities are tested over a wide range of economic scenarios to establish the resiliency of each opportunity. Once investments are made, a reappraisal process is completed to ensure relevant lessons are learned and improvements are incorporated into future projects.
BUSINESS ENVIRONMENT AND RISK ASSESSMENT
Long-Term Business Outlook
By 2030, the world’s population is projected to grow to approximately 8 billion people, or about 1.5 billion more than in 2005. Coincident with this population increase, the Corporation expects worldwide economic growth to average 2.7 percent per year. This combination of population and economic growth is expected to lead to an increase in primary energy demand of almost 35 percent by 2030 versus 2005 even with substantial efficiency gains. This demand increase is expected to be concentrated in developing countries.
As economic progress drives demand higher, the use of more energy-efficient, lower-emission technologies and practices will become increasingly important, leading to a significantly lower level of energy consumption and emissions per unit of economic output by 2030. Efficiency gains will result from anticipated improvements in the transportation and power generation sectors, driven by the introduction of new technologies, as well as many other improvements that span the residential, commercial and industrial sectors.
Energy for transportation – including cars, trucks, ships, trains and airplanes – is expected to increase by over 35 percent from 2005 to 2030. The global growth in transportation demand will be met primarily by oil, which is expected to provide almost 95 percent of all transportation fuel by 2030, down from about 98 percent in 2005, as biofuels and natural gas gain market share.
Demand for electricity around the world will grow significantly through 2030. Consistent with this projection, power generation will remain the largest and fastest-growing major segment of global energy demand. Meeting the expected growth in power demand will require a diverse set of energy sources. Coal will retain the largest share. However, natural gas, nuclear and renewables are all expected to gain market share.
Liquid fuels provide the largest share of energy supply today due to their availability, affordability and ease of transport. By 2030, global demand for liquids is expected to grow to approximately 104 million barrels of oil-equivalent per day or close to 25 percent more than in 2005. Global demand for liquid fuels will be met by a wide variety of sources. Conventional non-OPEC crude and condensate production is expected to remain relatively flat through 2030. However, growth is expected from a number of supply sources, including biofuels, oil sands and natural gas liquids, as well as crude oil from OPEC countries. While the world’s resource base is sufficient to meet projected demand, access to resources and timely investments will remain critical to meeting global needs with reliable, affordable supplies.
Increases in natural gas demand in North America, Europe and Asia Pacific will require new sources of supply. Helping meet these needs will be additional local supplies of unconventional natural gas – the result of recent improvements in technologies used to tap these hard-to-produce resources – as well as imports. The growing need for natural gas imports will have a dramatic impact on the worldwide liquefied natural gas (LNG) market, which is expected to approximately triple in volume from 2005 to 2030.
The world’s energy mix is highly diverse and will remain so through 2030. Oil is expected to remain the largest source of energy supply at close to 35 percent. From 2005 to 2030, natural gas is expected to grow the fastest of the fossil fuels and overtake coal as the second-largest energy source. Nuclear power is projected to grow significantly, surpassing coal in terms of absolute growth and reaching the level of biomass as the fourth-largest source of energy. Hydro and geothermal will also grow, though remain limited by the availability of natural sites. Wind, solar and biofuels are expected to grow at close to 10 percent per year on average, the highest growth rate of all fuels, and are projected to reach approximately 2.5 percent of world energy by 2030.
46
The Corporation anticipates that the world’s available oil and gas resource base will grow not only from new discoveries, but also from reserve increases in previously discovered fields. Technology will underpin these increases. The cost to develop and supply these resources will be significant. According to the International Energy Agency, the investment required to meet total oil and gas energy needs worldwide through 2030 will be close to $480 billion per year on average, or about $11.1 trillion (measured in 2009 dollars) in total over the period 2008-2030. International accords and underlying regional and national regulations for greenhouse gas reduction are evolving with uncertain timing and outcome, making it difficult to predict their business impact. ExxonMobil includes estimates of potential costs for energy-related greenhouse gas emissions in its long-term Energy Outlook, which is used for assessing the business environment and in its investment evaluations.
Upstream
ExxonMobil continues to maintain a large portfolio of exploration and development opportunities, which enables the Corporation to be selective, maximizing shareholder value and mitigating political and technical risks. ExxonMobil’s fundamental Upstream business strategies guide our global exploration, development, production, and gas and power marketing activities. These strategies include identifying and selectively pursuing the highest quality exploration opportunities, investing in projects that deliver superior returns, maximizing profitability of existing oil and gas production, and capitalizing on growing natural gas and power markets. These strategies are underpinned by a relentless focus on operational excellence, commitment to innovative technologies, development of our employees and investment in the communities in which we operate.
As future development projects bring new production online, the Corporation expects a shift in the geographic mix of its production volumes between now and 2014. Oil and natural gas output from West Africa, the Caspian region, the Middle East and Russia is expected to increase over the next five years based on current capital project execution plans. Currently, these growth areas account for 42 percent of the Corporation’s production. By 2014, they are expected to generate about 50 percent of total volumes. The remainder of the Corporation’s production is expected to be sourced from established areas, including Europe, North America and Asia Pacific.
In addition to an evolving geographic mix, there will also be continued change in the type of opportunities from which volumes are produced. Production from diverse resource types utilizing specialized technologies such as arctic technology, deepwater drilling and production systems, heavy oil recovery processes, unconventional gas production and LNG is expected to grow from about 30 percent to over 40 percent of the Corporation’s output between now and 2014. We do not anticipate that the expected change in the geographic mix of production volumes, and in the types of opportunities from which volumes will be produced, will have a material impact on the nature and the extent of the risks disclosed in Item 1A of ExxonMobil’s 2009 Form 10-K, or result in a material change in our level of unit operating expenses. The Corporation’s overall volume capacity outlook, based on projects coming onstream as anticipated, is for production capacity to grow over the period 2010-2014. However, actual volumes will vary from year to year due to the timing of individual project start-ups, operational outages, reservoir performance, performance of enhanced oil recovery projects, regulatory changes, asset sales, weather events, price effects under production sharing contracts and other factors described in Item 1A of ExxonMobil’s 2009 Form 10-K. Enhanced oil recovery projects extract hydrocarbons from reservoirs in excess of that which may be produced through primary recovery, i.e., through pressure depletion or natural aquifer support. They include the injection of water, gases or chemicals into a reservoir to produce hydrocarbons otherwise unobtainable.
Merger Agreement
On December 13, 2009, ExxonMobil and XTO Energy Inc. (XTO) entered into an Agreement and Plan of Merger (the “Merger Agreement”). Under the terms of the Merger Agreement, (i) each share of XTO common stock will be converted into the right to receive 0.7098 shares of common stock of the Corporation (the “Exchange Ratio”) and (ii) all outstanding XTO options will be converted into options to purchase shares of common stock of the Corporation, with the number of shares of XTO common stock subject to the option, and the option’s exercise price, adjusted based on the Exchange Ratio. The transaction includes XTO debt, which was approximately $10.5 billion at December 31, 2009.
XTO’s reported year-end 2009 proved reserves of 14.8 trillion cubic feet of natural gas equivalents include shale gas, tight gas, coal-bed methane and shale oil. These will complement ExxonMobil’s holdings in the United States, Canada, Germany, Poland and Argentina. XTO’s resource base, technical expertise and highly skilled employees together with ExxonMobil’s operational and financial strengths should enable development of additional supplies of unconventional natural gas and oil resources.
Consummation of the merger is subject to customary conditions, including (i) the adoption of the Merger Agreement by the holders of XTO common stock, (ii) the absence of any law or order prohibiting the closing, (iii) the expiration or termination of the applicable Hart-Scott-Rodino waiting period and receipt of antitrust clearance under Dutch competition laws, (iv) subject to certain exceptions, the accuracy of representations and warranties and performance of covenants, (v) the effectiveness of the registration statement for the common stock of the Corporation being issued in the merger and (vi) the delivery of customary opinions from counsel to the Corporation and counsel to XTO that the merger will qualify as a reorganization for federal income tax purposes.
The Corporation and XTO have made customary representations, warranties and covenants in the Merger Agreement, including, among others, covenants to conduct their respective businesses in the ordinary course consistent with past practice between the execution of the Merger Agreement and consummation of the merger. In addition, XTO has covenanted (i) to cause a stockholder meeting to be held to consider approval of the transactions contemplated by the Merger Agreement, (ii) subject to certain exceptions, for its board of directors to recommend approval by its stockholders of the transactions contemplated by the Merger Agreement, (iii) not to solicit proposals relating to alternative business combination transactions and (iv) subject to certain exceptions, not to enter into discussions concerning or provide confidential information in connection with alternative business combination transactions.
47
MANAGEMENT’S DISCUSSION AND ANALYSIS OF FINANCIAL CONDITION AND RESULTS OF OPERATIONS
Assuming the merger is approved by XTO stockholders and is cleared by regulatory authorities, the transaction will be accounted for as a purchase, with XTO’s assets and liabilities reflected in ExxonMobil’s books at fair value. The transaction should be accretive to ExxonMobil’s production growth and cash flow. Depending on the market price for gas, it is not likely to be accretive to near-term earnings per share and may be dilutive.
Downstream
ExxonMobil’s Downstream is a large, diversified business with refining and marketing complexes around the world. The Corporation has a strong presence in mature markets in North America and Europe, as well as the growing Asia Pacific region. ExxonMobil’s fundamental Downstream business strategies position the company to deliver long-term growth in shareholder value that is superior to competition across a range of market conditions. These strategies include maintaining best-in-class operations in all aspects of the business, maximizing value from leading-edge technologies, capitalizing on integration with other ExxonMobil businesses, selectively investing for resilient, advantaged returns, leading the industry in efficiency and effectiveness, and providing quality, valued products and services to customers.
ExxonMobil has an ownership interest in 37 refineries, located in 21 countries, with distillation capacity of 6.3 million barrels per day and lubricant basestock manufacturing capacity of about 143 thousand barrels per day. ExxonMobil’s fuels and lubes marketing business portfolios include operations around the world, with multiple channels to market serving a globally diverse customer base.
The downstream industry environment remains very challenging. The recent global economic recession had a negative impact on the global demand for refined products, and thus put considerable downward pressure on worldwide refining margins. Further, in prior years, the industry has experienced a period of robust refining margins, which encouraged the construction of additional industry capacity. Over the prior 20-year period, inflation-adjusted refining margins have been flat, with the recent prior years’ stronger margins offsetting the longer-term trend of declining margins.
Refining margins are largely driven by differences in commodity prices and are a function of the difference between what a refinery pays for its raw materials (primarily crude oil) and the market prices for the range of products produced (primarily gasoline, heating oil, diesel oil, jet fuel and fuel oil). Crude oil and many products are widely traded with published prices, including those quoted on multiple exchanges around the world (e.g., New York Mercantile Exchange and Intercontinental Exchange). Prices for these commodities are determined by the global marketplace and are influenced by many factors, including global and regional supply/demand balances, inventory levels, refinery operations, import/export balances, currency fluctuations, seasonal demand, weather and political climate.
ExxonMobil’s long-term outlook continues to be that refining margins will generally decline as competition in the refining industry remains intense and, in the near term, new capacity additions outpace the growth in global demand. Additionally, as described in more detail in Item 1A of ExxonMobil’s 2009 Form 10-K, proposed carbon policy and other climate-related regulations in many countries, as well as the continued growth in biofuels mandates, could have negative impacts on the refining business.
In the retail fuels marketing business, ongoing intense competition continues to drive down inflation-adjusted margins by about 2 percent per year. In 2009, ExxonMobil progressed the transition of the direct served (i.e., dealer, company-operated) retail network in the U.S. to a branded distributor model. This transition was announced in 2008 and will be a multiyear process.
ExxonMobil takes a disciplined approach to managing the Downstream capital employed. The Downstream portfolio is continually evaluated during all parts of the business cycle, and numerous asset divestments have been made over the past decade. When investing in the Downstream, ExxonMobil remains focused on selective and resilient projects. These investments capitalize on the Corporation’s world-class scale and integration, industry-leading efficiency, leading-edge technology and respected brands, enabling ExxonMobil to take advantage of attractive emerging-growth opportunities around the globe. In 2009, ExxonMobil completed commissioning new cogeneration facilities in Fujian, China, and Antwerp, Belgium, representing a total of 375 megawatts, that help improve our refinery efficiency. Additionally, ExxonMobil is progressing with announced plans to invest over $1 billion in three refineries to increase the supply of cleaner-burning diesel by about 140 thousand barrels per day. The company will construct new units and modify existing facilities at its Baton Rouge, La., Baytown, Texas, and Antwerp, Belgium, refineries. In the Asia Pacific region, ExxonMobil and its partners Sinopec, Fujian Province and Saudi Aramco started up the integrated refining and petrochemicals facility in Fujian Province, China. This project expanded the existing 80-thousand-barrel-per-day refinery to a 240-thousand-barrel-per-day high-conversion facility. Additionally, the project encompasses a new world-scale integrated chemical plant. The partnership also includes a fuels marketing joint venture that includes over 750 retail sites and a network of distribution terminals.
Chemical
Worldwide petrochemical demand continued to be weak in the first half of 2009, due to the soft economy. Demand increased in the second half of the year, reflecting improved economic activity, particularly in Asia Pacific. Industry operating rates improved in the second half of the year on stronger demand and were further supported by industry capacity rationalizations and delays in start-up of new capacity. Tighter industry supply/demand balances in the second half of the year supported higher product prices and improved industry margins.
ExxonMobil benefited from continued operational excellence and a balanced portfolio of products. In addition to being a worldwide supplier of primary petrochemical products, ExxonMobil Chemical also has a number of less-cyclical business lines. Chemical’s competitive advantages are achieved through its business mix, broad geographic coverage, investment discipline, integration of chemical capacity with large refineries or upstream gas processing facilities, advantaged feedstock capabilities, leading proprietary technology and product application expertise.
48
REVIEW OF 2009 AND 2008 RESULTS
| 2009 |
2008 |
2007 | |||||||
| (millions of dollars) | |||||||||
| Earnings (U.S. GAAP) |
$ | 19,280 | $ | 45,220 | $ | 40,610 | |||
2009
Earnings in 2009 of $19,280 million decreased $25,940 million from 2008. Earnings for 2009 included an after-tax special charge of $140 million for interest related to the Valdez punitive damages award.
2008
Earnings in 2008 of $45,220 million increased $4,610 million from 2007. Earnings for 2008 included an after-tax gain of $1,620 million from the sale of a natural gas transportation business in Germany and after-tax special charges of $460 million related to the Valdez litigation.
Upstream
| 2009 |
2008 |
2007 | |||||||
| (millions of dollars) | |||||||||
| Upstream |
|||||||||
| United States |
$ | 2,893 | $ | 6,243 | $ | 4,870 | |||
| Non-U.S. |
14,214 | 29,159 | 21,627 | ||||||
| Total |
$ | 17,107 | $ | 35,402 | $ | 26,497 | |||
2009
Upstream earnings for 2009 were $17,107 million, down $18,295 million from 2008, including the absence of an after-tax special gain in 2008 of $1,620 million from the sale of a natural gas transportation business in Germany. Lower crude oil and natural gas realizations reduced earnings $15.2 billion. Volume and mix effects increased earnings $700 million. Higher operating expenses and increased exploration activities decreased earnings $1.4 billion. Lower gains on asset divestments reduced earnings approximately $900 million. Oil-equivalent production increased slightly versus 2008, including impacts from entitlement effects, quotas and divestments. Excluding these items, oil-equivalent production was up about 2 percent. Liquids production of 2,387 kbd (thousands of barrels per day) decreased 18 kbd. Production increases from new projects in the U.S., Qatar and West Africa along with higher volumes in Kazakhstan were offset by field decline. Natural gas production of 9,273 mcfd (millions of cubic feet per day) increased 178 mcfd from 2008. Higher volumes from projects in Qatar were partially offset by field decline. Earnings from U.S. Upstream operations for 2009 were $2,893 million, a decrease of $3,350 million. Earnings outside the U.S. for 2009 of $14,214 million declined $14,945 million.
2008
Upstream earnings for 2008 totaled $35,402 million, an increase of $8,905 million from 2007, including an after-tax gain of $1,620 million from the sale of a natural gas transportation business in Germany. Higher crude oil and natural gas realizations increased earnings approximately $11.8 billion. Lower sales volumes reduced earnings about $3.7 billion. Higher taxes and increased operating costs decreased earnings approximately $1.5 billion, partially offset by favorable foreign exchange. Oil-equivalent production decreased 6 percent versus 2007, including impacts from lower entitlement volumes, the expropriation of assets in Venezuela and divestments. Excluding these impacts, total oil-equivalent production decreased 3 percent. Liquids production of 2,405 kbd decreased 211 kbd from 2007. Production increases from new projects in West Africa were more than offset by field decline, lower entitlement volumes, the expropriation of assets in Venezuela and divestments. Natural gas production of 9,095 mcfd decreased 289 mcfd from 2007. Higher volumes from North Sea, Malaysia and Qatar projects and higher European demand were more than offset by field decline. Earnings from U.S. Upstream operations for 2008 were $6,243 million, an increase of $1,373 million. Earnings outside the U.S. for 2008, including a $1,620 million gain related to the sale of the German natural gas transportation business, were $29,159 million, $7,532 million higher than in 2007.
Downstream
| 2009 |
2008 |
2007 | ||||||||
| (millions of dollars) | ||||||||||
| Downstream |
||||||||||
| United States |
$ | (153 | ) | $ | 1,649 | $ | 4,120 | |||
| Non-U.S. |
1,934 | 6,502 | 5,453 | |||||||
| Total |
$ | 1,781 | $ | 8,151 | $ | 9,573 | ||||
2009
Downstream earnings were $1,781 million, down $6.4 billion from 2008. Weaker margins reduced earnings $5.1 billion. Lower divestment activity reduced earnings about $1.0 billion. Volumes decreased earnings approximately $300 million. Petroleum product sales of 6,428 kbd decreased 333 kbd, mainly reflecting asset divestments and lower demand. Refinery throughput was 5,350 kbd, down 66 kbd from 2008. Earnings from the U.S. Downstream were $1,802 million lower than in 2008. Non-U.S. Downstream earnings were $1,934 million, down $4,568 million from 2008.
2008
Downstream earnings of $8,151 million were $1,422 million lower than in 2007. Lower margins reduced earnings approximately $900 million, as weaker refining margins more than offset stronger marketing margins. Higher operating costs, mainly associated with planned work activity, reduced earnings about $700 million, while unfavorable foreign exchange effects decreased earnings approximately $600 million. Improved refinery operations provided a partial offset, increasing earnings about $800 million. Petroleum product sales of 6,761 kbd decreased from 7,099 kbd in 2007, primarily reflecting asset sales and lower demand. Refinery throughput was 5,416 kbd compared with 5,571 kbd in 2007. U.S. Downstream earnings were $1,649 million, down $2,471 million from 2007. Non-U.S. Downstream earnings of $6,502 million were $1,049 million higher than in 2007.
49
MANAGEMENT’S DISCUSSION AND ANALYSIS OF FINANCIAL CONDITION AND RESULTS OF OPERATIONS
Chemical
| 2009 |
2008 |
2007 | |||||||
| (millions of dollars) | |||||||||
| Chemical |
|||||||||
| United States |
$ | 769 | $ | 724 | $ | 1,181 | |||
| Non-U.S. |
1,540 | 2,233 | 3,382 | ||||||
| Total |
$ | 2,309 | $ | 2,957 | $ | 4,563 | |||
2009
Earnings declined $648 million versus 2008 to a total of $2,309 million. Weaker margins reduced earnings by $340 million, mostly in commodities. Lower volumes decreased earnings $190 million. All other items, including unfavorable foreign exchange impacts, reduced earnings $115 million. Prime product sales of 24,825 kt (thousands of metric tons) decreased 157 kt from 2008. Prime product sales are total chemical product sales, including ExxonMobil’s share of equity-company volumes and finished-product transfers to the Downstream business. U.S. Chemical earnings of $769 million increased $45 million. Non-U.S. Chemical earnings were $1,540 million, down $693 million.
2008
Chemical earnings totaled $2,957 million, a decrease of $1,606 million from 2007. Lower margins reduced earnings approximately $1.2 billion, while lower volumes decreased earnings about $500 million. Prime product sales were 24,982 kt, a decrease of 2,498 kt from 2007. U.S. Chemical earnings of $724 million decreased $457 million. Non-U.S. Chemical earnings of $2,233 million were $1,149 million lower than in 2007.
Corporate and Financing
| 2009 |
2008 |
2007 |
||||||||||
| (millions of dollars) | ||||||||||||
| Corporate and financing |
$ | (1,917 | ) | $ | (1,290 | ) | $ | (23 | ) | |||
2009
Corporate and financing expenses of $1,917 million in 2009 increased $627 million, primarily due to lower interest income.
2008
Corporate and financing expenses of $1,290 million in 2008 increased $1,267 million from 2007, mainly due to charges of $460 million related to the Valdez litigation, net higher taxes and lower interest income.
LIQUIDITY AND CAPITAL RESOURCES
Sources and Uses of Cash
| 2009 |
2008 |
2007 |
||||||||||
| (millions of dollars) | ||||||||||||
| Net cash provided by/(used in) |
||||||||||||
| Operating activities |
$ | 28,438 | $ | 59,725 | $ | 52,002 | ||||||
| Investing activities |
(22,419 | ) | (15,499 | ) | (9,728 | ) | ||||||
| Financing activities |
(27,283 | ) | (44,027 | ) | (38,345 | ) | ||||||
| Effect of exchange rate changes |
520 | (2,743 | ) | 1,808 | ||||||||
| Increase/(decrease) in cash and cash equivalents |
$ | (20,744 | ) | $ | (2,544 | ) | $ | 5,737 | ||||
| (Dec. 31) | ||||||||||||
| Cash and cash equivalents |
$ | 10,693 | $ | 31,437 | $ | 33,981 | ||||||
Cash and cash equivalents were $10.7 billion at the end of 2009, $20.7 billion lower than the prior year, reflecting lower earnings and a higher level of capital spending partially offset by a lower level of purchases of ExxonMobil shares.
Cash and cash equivalents were $31.4 billion at the end of 2008, $2.5 billion lower than the prior year, reflecting $2.7 billion of foreign exchange reductions from the strengthening of the U.S. dollar in 2008. Cash flows from operating, investing and financing activities are discussed below. For additional details, see the Consolidated Statement of Cash Flows.
Although the Corporation could issue long-term debt and has access to short-term liquidity, internally generated funds cover the majority of its financial requirements. The management of cash that may be temporarily available as surplus to the Corporation’s immediate needs is carefully controlled to ensure that it is secure and readily available to meet the Corporation’s cash requirements and to optimize returns on the cash balances.
To support cash flows in future periods the Corporation will need to continually find and develop new fields, and continue to develop and apply new technologies and recovery processes to existing fields, in order to maintain or increase production. After a period of production at plateau rates, it is the nature of oil and gas fields eventually to produce at declining rates for the remainder of their economic life. Averaged over all the Corporation’s existing oil and gas fields and without new projects, ExxonMobil’s production is expected to decline at an average of approximately 5 percent per year over the next few years. Decline rates can vary widely by individual field due to a number of factors, including, but not limited to, the type of reservoir, fluid properties, recovery mechanisms, work activity, and age of the field. Furthermore, the Corporation’s net interest in production for individual fields can vary with price and contractual terms.
The Corporation has long been successful at offsetting the effects of natural field decline through disciplined investments in quality opportunities and project execution. Over the last decade, this has resulted in net annual additions to proved reserves that have exceeded the amount produced. Projects are in progress or planned to increase production capacity. However, these volume increases are subject to a variety of risks including project start-up timing, operational outages, reservoir performance, crude oil and natural gas prices, weather events, and regulatory changes. The Corporation’s cash flows are also
50
highly dependent on crude oil and natural gas prices. Please refer to Item 1A. Risk Factors for a more complete discussion of risks.
The Corporation’s financial strength, as evidenced by its AAA/Aaa debt rating, enables it to make large, long-term capital expenditures. Capital and exploration expenditures in 2009 were $27.1 billion, reflecting the Corporation’s continued active investment program. The Corporation expects annual expenditures to range from $25 billion to $30 billion for the next several years. Actual spending could vary depending on the progress of individual projects. The Corporation has a large and diverse portfolio of development projects and exploration opportunities, which helps mitigate the overall political and technical risks of the Corporation’s Upstream segment and associated cash flow. Further, due to its financial strength, debt capacity and diverse portfolio of opportunities, the risk associated with failure or delay of any single project would not have a significant impact on the Corporation’s liquidity or ability to generate sufficient cash flows for operations and its fixed commitments. The purchase and sale of oil and gas properties have not had a significant impact on the amount or timing of cash flows from operating activities.
Cash Flow from Operating Activities
2009
Cash provided by operating activities totaled $28.4 billion in 2009, $31.3 billion lower than 2008. The major source of funds was net income including noncontrolling interests of $19.7 billion, adjusted for the noncash provision of $11.9 billion for depreciation and depletion, both of which declined. Pension fund contributions in 2009 of $4.5 billion increased from $1.0 billion in 2008. The net effects of changes in prices and the timing of collection of accounts receivable and of payments of accounts and other payables and of income taxes payable reduced cash provided by operating activities in 2009 compared to an increase in 2008.
2008
Cash provided by operating activities totaled $59.7 billion in 2008, a $7.7 billion increase from 2007. The major source of funds was net income including noncontrolling interests of $46.9 billion, adjusted for the noncash provision of $12.4 billion for depreciation and depletion, both of which increased. The net effects of lower prices and the timing of collection of accounts receivable and of payments of accounts and other payables and of income taxes payable added to cash provided by operating activities.
Cash Flow from Investing Activities
2009
Cash used in investing activities netted to $22.4 billion in 2009, $6.9 billion higher than in 2008. Spending for property, plant and equipment of $22.5 billion in 2009 increased $3.2 billion from 2008. Proceeds from the sales of subsidiaries, investments and property, plant and equipment of $1.5 billion in 2009 compared to $6.0 billion in 2008, the decrease reflecting the absence of the sale of the natural gas transportation business in Germany and lower sales of Downstream assets and investments.
2008
Cash used in investing activities netted to $15.5 billion in 2008, $5.8 billion higher than in 2007. Spending for property, plant and equipment of $19.3 billion in 2008 increased $3.9 billion from 2007. Proceeds from the sales of subsidiaries, investments and property, plant and equipment of $6.0 billion in 2008 compared to $4.2 billion in 2007, the increase reflecting the sale of the German natural gas transportation business in 2008. Cash used in investing activities in 2008 was higher due to the absence of the $4.6 billion positive cash flow in 2007 from the release of the restriction on the restricted cash and cash equivalents. Net cash used for investments and advances and the change in marketable securities was $1.0 billion lower in 2008.
Cash Flow from Financing Activities
2009
Cash used in financing activities was $27.3 billion in 2009, $16.7 billion lower than 2008, reflecting a lower level of purchases of ExxonMobil shares. Dividend payments on common shares increased to $1.66 per share from $1.55 per share and totaled $8.0 billion, a pay-out of 42 percent. Total consolidated short-term and long-term debt increased $0.2 billion to $9.6 billion at year-end 2009.
ExxonMobil share of equity decreased $2.4 billion in 2009, to $110.6 billion. The addition to equity for earnings of $19.3 billion was more than offset by reductions for distributions to ExxonMobil shareholders of $8.0 billion of dividends and $18.0 billion of purchases of shares of ExxonMobil stock to reduce shares outstanding. Equity, and net assets and liabilities, increased $3.3 billion, representing the foreign exchange translation effects of generally stronger foreign currencies at the end of 2009 on ExxonMobil’s operations outside the United States. The change in the funded status of the postretirement benefits reserves in 2009 increased equity by $1.2 billion.
During 2009, Exxon Mobil Corporation purchased 277 million shares of its common stock for the treasury at a gross cost of $19.7 billion. These purchases were to reduce the number of shares outstanding and to offset shares issued in conjunction with company benefit plans and programs. Shares outstanding were reduced by 5.0 percent from 4,976 million at the end of 2008 to 4,727 million at the end of 2009. Purchases were made in both the open market and through negotiated transactions. Purchases may be increased, decreased or discontinued at any time without prior notice.
2008
Cash used in financing activities was $44.0 billion in 2008, an increase of $5.7 billion from 2007, reflecting a higher level of purchases of ExxonMobil shares. Dividend payments on common shares increased to $1.55 per share from $1.37 per share and totaled $8.1 billion, a pay-out of 18 percent. Total consolidated short-term and long-term debt decreased $0.2 billion to $9.4 billion at year-end 2008.
ExxonMobil share of equity decreased $8.8 billion in 2008, to $113.0 billion. Earnings of $45.2 billion, reduced by distributions to ExxonMobil shareholders of $8.1 billion of dividends and $32.0 billion of purchases of shares of ExxonMobil stock to reduce shares outstanding, added to equity. Equity, and net assets and liabilities, decreased $6.8 billion, representing the foreign exchange translation effects of generally weaker
51
MANAGEMENT’S DISCUSSION AND ANALYSIS OF FINANCIAL CONDITION AND RESULTS OF OPERATIONS
foreign currencies at the end of 2008 on ExxonMobil’s operations outside the United States. The change in the funded status of the postretirement benefits reserves in 2008 lowered equity by $5.1 billion.
During 2008, Exxon Mobil Corporation purchased 434 million shares of its common stock for the treasury at a gross cost of $35.7 billion. These purchases were to reduce the number of shares outstanding and to offset shares issued in conjunction with company benefit plans and programs. Shares outstanding were reduced by 7.5 percent from 5,382 million at the end of 2007 to 4,976 million at the end of 2008. Purchases were made in both the open market and through negotiated transactions.
Commitments
Set forth below is information about the outstanding commitments of the Corporation’s consolidated subsidiaries at December 31, 2009. It combines data from the Consolidated Balance Sheet and from individual notes to the Consolidated Financial Statements.
| Payments Due by Period | ||||||||||||||
| Commitments |
Note Reference Number |
2010 |
2011- 2014 |
2015 and Beyond |
Total | |||||||||
| (millions of dollars) | ||||||||||||||
| Long-term debt (1) |
13 | $ | — | $ | 3,531 | $ | 3,598 | $ | 7,129 | |||||
| – Due in one year (2) |
348 | — | — | 348 | ||||||||||
| Asset retirement obligations (3) |
8 | 693 | 1,944 | 5,836 | 8,473 | |||||||||
| Pension and other post retirement obligations (4) |
16 | 1,540 | 4,024 | 12,317 | 17,881 | |||||||||
| Operating leases (5) |
10 | 2,444 | 5,561 | 2,360 | 10,365 | |||||||||
| Unconditional purchase obligations (6) |
15 | 314 | 902 | 568 | 1,784 | |||||||||
| Take-or-pay obligations (7) |
1,208 | 4,241 | 7,594 | 13,043 | ||||||||||
| Firm capital commitments (8) |
12,250 | 12,525 | 688 | 25,463 | ||||||||||
This table excludes commodity purchase obligations (volumetric commitments but no fixed or minimum price) which are resold shortly after purchase, either in an active, highly liquid market or under long-term, unconditional sales contracts with similar pricing terms. Examples include long-term, noncancelable LNG and natural gas purchase commitments and commitments to purchase refinery products at market prices. Inclusion of such commitments would not be meaningful in assessing liquidity and cash flow, because these purchases will be offset in the same periods by cash received from the related sales transactions. The table also excludes unrecognized tax benefits totaling $4.7 billion as of December 31, 2009, because the Corporation is unable to make reasonably reliable estimates of the timing of cash settlements with the respective taxing authorities. Further details on the unrecognized tax benefits can be found in note 18, Income, Sales-Based and Other Taxes.
Notes:
| (1) | Includes capitalized lease obligations of $368 million. |
| (2) | The amount due in one year is included in notes and loans payable of $2,476 million (note 5). |
| (3) | The fair value of upstream asset retirement obligations, primarily asset removal costs at the completion of field life. |
| (4) | The amount by which the benefit obligations exceeded the fair value of fund assets for certain U.S. and non-U.S. pension and other postretirement plans at year end. The payments by period include expected contributions to funded pension plans in 2010 and estimated benefit payments for unfunded plans in all years. |
| (5) | Minimum commitments for operating leases, shown on an undiscounted basis, cover drilling equipment, tankers, service stations and other properties. |
| (6) | Unconditional purchase obligations (UPOs) are those long-term commitments that are noncancelable and that third parties have used to secure financing for the facilities that will provide the contracted goods or services. The undiscounted obligations of $1,784 million mainly pertain to pipeline throughput agreements and include $1,141 million of obligations to equity companies. |
| (7) | Take-or-pay obligations are noncancelable, long-term commitments for goods and services other than UPOs. The undiscounted obligations of $13,043 million mainly pertain to manufacturing supply, pipeline and terminaling agreements and include $501 million of obligations to equity companies. |
| (8) | Firm commitments related to capital projects, shown on an undiscounted basis, totaled approximately $25.5 billion. These commitments were primarily associated with Upstream projects outside the U.S., of which $14.5 billion was associated with projects in West Africa, Kazakhstan, Papua New Guinea and Australia. The Corporation expects to fund the majority of these projects through internal cash flow. |
Guarantees
The Corporation and certain of its consolidated subsidiaries were contingently liable at December 31, 2009, for $8,786 million, primarily relating to guarantees for notes, loans and performance under contracts (note 15). Included in this amount were guarantees by consolidated affiliates of $5,629 million, representing ExxonMobil’s share of obligations of certain equity companies. The below-mentioned guarantees are not reasonably likely to have a material effect on the Corporation’s financial condition, changes in financial condition, revenues or expenses, results of operations, liquidity, capital expenditures or capital resources.
| Dec. 31, 2009 | |||||||||
| Equity Company Obligations |
Other Third-Party Obligations |
Total | |||||||
| (millions of dollars) | |||||||||
| Total guarantees |
$ | 5,629 | $ | 3,157 | $ | 8,786 | |||
52
Financial Strength
On December 31, 2009, unused credit lines for short-term financing totaled approximately $4.8 billion (note 5).
The table below shows the Corporation’s fixed-charge coverage and consolidated debt-to-capital ratios. The data demonstrate the Corporation’s creditworthiness. Throughout this period, the Corporation’s long-term debt securities maintained the top credit rating from both Standard & Poor’s (AAA) and Moody’s (Aaa), a rating it has sustained for 91 years.
| 2009 |
2008 |
2007 | ||||
| Fixed-charge coverage ratio (times) |
26.1 | 52.2 | 49.9 | |||
| Debt to capital (percent) |
7.7 | 7.4 | 7.1 | |||
| Net debt to capital (percent) |
(1.0) | (23.0) | (24.0) | |||
| Credit rating |
AAA/Aaa | AAA/Aaa | AAA/Aaa |
Management views the Corporation’s financial strength, as evidenced by the above financial ratios and other similar measures, to be a competitive advantage of strategic importance. The Corporation’s sound financial position gives it the opportunity to access the world’s capital markets in the full range of market conditions, and enables the Corporation to take on large, long-term capital commitments in the pursuit of maximizing shareholder value.
The Corporation makes limited use of derivative instruments, which are discussed in note 12.
Litigation and Other Contingencies
Litigation
As discussed in note 15, a number of lawsuits, including class actions, were brought in various courts against Exxon Mobil Corporation and certain of its subsidiaries relating to the accidental release of crude oil from the tanker Exxon Valdez in 1989. All the compensatory claims and the punitive damage award have been paid.
Based on a consideration of all relevant facts and circumstances, the Corporation does not believe the ultimate outcome of any currently pending lawsuit against ExxonMobil will have a materially adverse effect upon the Corporation’s operations or financial condition. There are no events or uncertainties beyond those already included in reported financial information that would indicate a material change in future operating results or financial condition.
Other Contingencies
In accordance with a nationalization decree issued by Venezuela’s president in February 2007, by May 1, 2007, a subsidiary of the Venezuelan National Oil Company (PdVSA) assumed the operatorship of the Cerro Negro Heavy Oil Project. This Project had been operated and owned by ExxonMobil affiliates holding a 41.67 percent ownership interest in the Project. The decree also required conversion of the Cerro Negro Project into a “mixed enterprise” and an increase in PdVSA’s or one of its affiliate’s ownership interest in the Project, with the stipulation that if ExxonMobil refused to accept the terms for the formation of the mixed enterprise within a specified period of time, the government would “directly assume the activities” carried out by the joint venture. ExxonMobil refused to accede to the terms proffered by the government, and on June 27, 2007, the government expropriated ExxonMobil’s 41.67 percent interest in the Cerro Negro Project.
On September 6, 2007, affiliates of ExxonMobil filed a Request for Arbitration with the International Centre for Settlement of Investment Disputes. An affiliate of ExxonMobil has also filed an arbitration under the rules of the International Chamber of Commerce against PdVSA and a PdVSA affiliate for breach of their contractual obligations under certain Cerro Negro Project agreements. Both arbitration proceedings continue. At this time, the net impact of this matter on the Corporation’s consolidated financial results cannot be reasonably estimated. However, the Corporation does not expect the resolution to have a material effect upon the Corporation’s operations or financial condition. ExxonMobil’s remaining net book investment in Cerro Negro producing assets is about $750 million.
CAPITAL AND EXPLORATION EXPENDITURES
| 2009 |
2008 | |||||||||||
| U.S. |
Non-U.S. |
U.S. |
Non-U.S. | |||||||||
| (millions of dollars) | ||||||||||||
| Upstream (1) |
$ | 3,585 | $ | 17,119 | $ | 3,334 | $ | 16,400 | ||||
| Downstream |
1,511 | 1,685 | 1,636 | 1,893 | ||||||||
| Chemical |
319 | 2,829 | 441 | 2,378 | ||||||||
| Other |
44 | — | 61 | — | ||||||||
| Total |
$ | 5,459 | $ | 21,633 | $ | 5,472 | $ | 20,671 | ||||
| (1) | Exploration expenses included. |
Capital and exploration expenditures in 2009 were $27.1 billion, reflecting the Corporation’s continued active investment program. The Corporation expects annual expenditures to range from $25 billion to $30 billion for the next several years. Actual spending could vary depending on the progress of individual projects.
Upstream spending of $20.7 billion in 2009 was up 5 percent from 2008, mainly due to increased exploration and production drilling activity. The majority of these expenditures are on development projects, which typically take two to four years from the time of recording proved undeveloped reserves to the start of production from those reserves. The percentage of proved developed reserves was 67 percent of total proved reserves at year-end 2009, and has been over 60 percent for the last five years, indicating that proved reserves are
53
MANAGEMENT’S DISCUSSION AND ANALYSIS OF FINANCIAL CONDITION AND RESULTS OF OPERATIONS
consistently moved from undeveloped to developed status. Capital investments in the Downstream totaled $3.2 billion in 2009, a decrease of $0.3 billion from 2008, due to lower refining project and fuels marketing expenditures. Chemical 2009 capital expenditures of $3.1 billion were up $0.3 billion from 2008 due to increased investment in Asia Pacific to meet demand growth.
| 2009 |
2008 |
2007 |
||||||||||
| (millions of dollars) | ||||||||||||
| Income taxes |
$ | 15,119 | $ | 36,530 | $ | 29,864 | ||||||
| Effective income tax rate |
47 | % | 46 | % | 44 | % | ||||||
| Sales-based taxes |
25,936 | 34,508 | 31,728 | |||||||||
| All other taxes and duties |
37,571 | 45,223 | 44,091 | |||||||||
| Total |
$ | 78,626 | $ | 116,261 | $ | 105,683 | ||||||
2009
Income, sales-based and all other taxes and duties totaled $78.6 billion in 2009, a decrease of $37.6 billion or 32 percent from 2008. Income tax expense, both current and deferred, was $15.1 billion, $21.4 billion lower than 2008, reflecting lower pre-tax income in 2009. A higher share of total income from the Upstream segment in 2009 increased the effective income tax rate to 47 percent compared to 46 percent in 2008. Sales-based and all other taxes and duties of $63.5 billion in 2009 decreased $16.2 billion from 2008, reflecting lower prices and foreign exchange effects.
2008
Income, sales-based and all other taxes and duties totaled $116.3 billion in 2008, an increase of $10.6 billion or 10 percent from 2007. Income tax expense, both current and deferred, was $36.5 billion, $6.7 billion higher than 2007, reflecting higher pre-tax income in 2008. A higher share of total income from the Upstream segment in 2008 increased the effective income tax rate to 46 percent compared to 44 percent in 2007. Sales-based and all other taxes and duties of $79.7 billion in 2008 increased $3.9 billion from 2007, reflecting higher prices.
Environmental Expenditures
| 2009 |
2008 | |||||
| (millions of dollars) | ||||||
| Capital expenditures |
$ | 2,481 | $ | 2,485 | ||
| Other expenditures |
2,610 | 2,730 | ||||
| Total |
$ | 5,091 | $ | 5,215 | ||
Throughout ExxonMobil’s businesses, new and ongoing measures are taken to prevent and minimize the impact of our operations on air, water and ground. These include a significant investment in refining infrastructure and technology to manufacture clean fuels as well as projects to monitor and reduce nitrogen oxide, sulfur oxide and greenhouse gas emissions and expenditures for asset retirement obligations. ExxonMobil’s 2009 worldwide environmental expenditures for all such preventative and remediation steps, including ExxonMobil’s share of equity company expenditures, were about $5.1 billion. The total cost for such activities is expected to remain in this range in 2010 and 2011 (with capital expenditures approximately 45 percent of the total).
Environmental Liabilities
The Corporation accrues environmental liabilities when it is probable that obligations have been incurred and the amounts can be reasonably estimated. This policy applies to assets or businesses currently owned or previously disposed. ExxonMobil has accrued liabilities for probable environmental remediation obligations at various sites, including multiparty sites where the U.S. Environmental Protection Agency has identified ExxonMobil as one of the potentially responsible parties. The involvement of other financially responsible companies at these multiparty sites could mitigate ExxonMobil’s actual joint and several liability exposure. At present, no individual site is expected to have losses material to ExxonMobil’s operations or financial condition. Consolidated company provisions made in 2009 for environmental liabilities were $504 million ($507 million in 2008) and the balance sheet reflects accumulated liabilities of $943 million as of December 31, 2009, and $884 million as of December 31, 2008.
Asset Retirement Obligations
The fair values of asset retirement obligations are recorded as liabilities on a discounted basis when they are incurred, which is typically at the time assets are installed, with an offsetting amount booked as additions to property, plant and equipment ($156 million for 2009). Over time, the liabilities are accreted for the increase in their present value, with this effect included in expenses ($372 million in 2009). Consolidated company expenditures for asset retirement obligations in 2009 were $448 million and the ending balance of the obligations recorded on the balance sheet at December 31, 2009, totaled $8,473 million.
54
MARKET RISKS, INFLATION AND OTHER UNCERTAINTIES
| Worldwide Average Realizations (1) |
2009 |
2008 |
2007 | ||||||
| Crude oil and NGL ($/barrel) |
$ | 57.86 | $ | 90.96 | $ | 67.89 | |||
| Natural gas ($/kcf) |
4.00 | 7.54 | 5.29 | ||||||
| (1) | Consolidated subsidiaries. |
Crude oil, natural gas, petroleum product and chemical prices have fluctuated in response to changing market forces. The impacts of these price fluctuations on earnings from Upstream, Downstream and Chemical operations have varied. In the Upstream, a $1 per barrel change in the weighted-average realized price of oil would have approximately a $375 million annual after-tax effect on Upstream consolidated plus equity company earnings. Similarly, a $0.10 per kcf change in the worldwide average gas realization would have approximately a $175 million annual after-tax effect on Upstream consolidated plus equity company earnings. For any given period, the extent of actual benefit or detriment will be dependent on the price movements of individual types of crude oil, taxes and other government take impacts, price adjustment lags in long-term gas contracts, and crude and gas production volumes. Accordingly, changes in benchmark prices for crude oil and natural gas only provide broad indicators of changes in the earnings experienced in any particular period.
In the very competitive downstream and chemical environments, earnings are primarily determined by margin capture rather than absolute price levels of products sold. Refining margins are a function of the difference between what a refiner pays for its raw materials (primarily crude oil) and the market prices for the range of products produced. These prices in turn depend on global and regional supply/demand balances, inventory levels, refinery operations, import/export balances and weather.
The global energy markets can give rise to extended periods in which market conditions are adverse to one or more of the Corporation’s businesses. Such conditions, along with the capital-intensive nature of the industry and very long lead times associated with many of our projects, underscore the importance of maintaining a strong financial position. Management views the Corporation’s financial strength, including the AAA and Aaa ratings of its long-term debt securities by Standard & Poor’s and Moody’s, as a competitive advantage.
In general, segment results are not dependent on the ability to sell and/or purchase products to/from other segments. Instead, where such sales take place, they are the result of efficiencies and competitive advantages of integrated refinery/chemical complexes. Additionally, intersegment sales are at market-based prices. The products bought and sold between segments can also be acquired in worldwide markets that have substantial liquidity, capacity and transportation capabilities. About 40 percent of the Corporation’s intersegment sales are crude oil produced by the Upstream and sold to the Downstream.
Other intersegment sales include those between refineries and chemical plants related to raw materials, feedstocks and finished products.
Although price levels of crude oil and natural gas may rise or fall significantly over the short to medium term due to political events, OPEC actions and other factors, industry economics over the long term will continue to be driven by market supply and demand. Accordingly, the Corporation tests the viability of all of its investments over a broad range of future prices. The Corporation’s assessment is that its operations will continue to be successful in a variety of market conditions. This is the outcome of disciplined investment and asset management programs. Investment opportunities are tested against a variety of market conditions, including low-price scenarios.
The Corporation has an active asset management program in which underperforming assets are either improved to acceptable levels or considered for divestment. The asset management program includes a disciplined, regular review to ensure that all assets are contributing to the Corporation’s strategic objectives. The result is an efficient capital base, and the Corporation has seldom had to write down the carrying value of assets, even during periods of low commodity prices.
Risk Management
The Corporation’s size, strong capital structure, geographic diversity and the complementary nature of the Upstream, Downstream and Chemical businesses reduce the Corporation’s enterprise-wide risk from changes in interest rates, currency rates and commodity prices. As a result, the Corporation makes limited use of derivative instruments to mitigate the impact of such changes. The Corporation does not engage in speculative derivative activities or derivative trading activities nor does it use derivatives with leveraged features. The Corporation maintains a system of controls that includes the authorization, reporting and monitoring of derivative activity. The Corporation’s limited derivative activities pose no material credit or market risks to ExxonMobil’s operations, financial condition or liquidity. Note 12 summarizes the fair value of derivatives outstanding at year end and the gains or losses that have been recognized in net income.
The Corporation is exposed to changes in interest rates, primarily on its short-term debt and the portion of long-term debt that carries floating interest rates. The impact of a 100-basis-point change in interest rates affecting the Corporation’s debt would not be material to earnings, cash flow or fair value. The Corporation’s cash balances exceeded total debt at year-end 2009 and 2008. The Corporation is not dependent on the credit markets to fund current operations. However, some joint-venture partners are dependent on the credit markets, and their funding ability may impact the development pace of joint-venture projects.
55
MANAGEMENT’S DISCUSSION AND ANALYSIS OF FINANCIAL CONDITION AND RESULTS OF OPERATIONS
The Corporation conducts business in many foreign currencies and is subject to exchange rate risk on cash flows related to sales, expenses, financing and investment transactions. The impacts of fluctuations in exchange rates on ExxonMobil’s geographically and functionally diverse operations are varied and often offsetting in amount. The Corporation makes limited use of currency exchange contracts, commodity forwards, swaps and futures contracts to mitigate the impact of changes in currency values and commodity prices. Exposures related to the Corporation’s limited use of the above contracts are not material.
Inflation and Other Uncertainties
The general rate of inflation in many major countries of operation increased in 2008 before moderating in 2009, and the associated impact on non-energy costs has generally been mitigated by cost reductions from efficiency and productivity improvements. Increased demand for certain services and materials has resulted in higher operating and capital costs in recent years. The Corporation works to counter upward pressure on costs through its economies of scale in global procurement and its efficient project management practices.
RECENTLY ISSUED STATEMENTS OF FINANCIAL ACCOUNTING STANDARDS
Variable-Interest Entities
In 2009, the FASB issued an accounting standard for variable-interest entities (VIEs), which became effective January 1, 2010. The standard requires the enterprise to qualitatively assess if it is the primary beneficiary of the VIE and, if so, the VIE must be consolidated. The Corporation does not expect the adoption of this standard to have a material impact on the Corporation’s financial statements.
The Corporation’s accounting and financial reporting fairly reflect its straightforward business model involving the extracting, refining and marketing of hydrocarbons and hydrocarbon-based products. The preparation of financial statements in conformity with U.S. Generally Accepted Accounting Principles (GAAP) requires management to make estimates and judgments that affect the reported amounts of assets, liabilities, revenues and expenses and the disclosure of contingent assets and liabilities. The following summary provides further information about the critical accounting policies and the judgments that are made by the Corporation in the application of those policies.
Oil and Gas Reserves
Evaluations of oil and gas reserves are important to the effective management of Upstream assets. They are integral to making investment decisions about oil and gas properties such as whether development should proceed. Oil and gas reserve quantities are also used as the basis for calculating unit-of-production depreciation rates and for evaluating impairment. Oil and gas reserves include both proved and unproved reserves. Consistent with the definitions in the Securities and Exchange Commission’s amended Rule 4-10(a) of Regulation S-X, proved oil and gas reserves are those quantities of oil and gas, which, by analysis of geoscience and engineering data, can be estimated with reasonable certainty to be economically producible – from a given date forward, from known reservoirs, and under existing economic conditions, operating methods and government regulations – prior to the time at which contracts providing the right to operate expire, unless evidence indicates that renewal is reasonably certain. Unproved reserves are those with less than reasonable certainty of recoverability and include probable reserves. Probable reserves are reserves that are more likely to be recovered than not.
The estimation of proved reserves, which is based on the requirement of reasonable certainty, is an ongoing process based on rigorous technical evaluations, commercial and market assessment, and detailed analysis of well information such as flow rates and reservoir pressure declines. The estimation of proved reserves is controlled by the Corporation through long-standing approval guidelines. Reserve changes are made within a well-established, disciplined process driven by senior level geoscience and engineering professionals, assisted by the Reserves Technical Oversight group which has significant technical experience, culminating in reviews with and approval by senior management. Notably, the Corporation does not use specific quantitative reserve targets to determine compensation.
Key features of the reserves estimation process include:
| – | rigorous peer-reviewed technical evaluations and analysis of well and field performance information (such as flow rates and reservoir pressure declines) and |
| – | a requirement that management make significant funding commitments toward the development of the reserves prior to reporting as proved. |
Although the Corporation is reasonably certain that proved reserves will be produced, the timing and amount recovered can be affected by a number of factors including completion of development projects, reservoir performance, regulatory approvals and significant changes in long-term oil and gas price levels.
Proved reserves can be further subdivided into developed and undeveloped reserves. The percentage of proved developed reserves was 67 percent of total proved reserves at year-end 2009 (including both consolidated and equity company reserves), and has been over 60 percent for the last five years, indicating that proved reserves are consistently moved from undeveloped to developed status. Over time, these undeveloped reserves will be reclassified to the developed category as new wells are drilled, existing wells are recompleted and/or facilities to collect and deliver the production from existing and future wells are installed. Major development projects typically take two to four years from the time of recording proved reserves to the start of production from these reserves.
56
Revisions can include upward or downward changes in previously estimated volumes of proved reserves for existing fields due to the evaluation or re-evaluation of (1) already available geologic, reservoir or production data, (2) new geologic, reservoir or production data or (3) changes in prices and costs that are used in the estimation of reserves. This category can also include significant changes in either development strategy or production equipment/facility capacity.
The Corporation uses the “successful efforts” method to account for its exploration and production activities. Under this method, costs are accumulated on a field-by-field basis with certain exploratory expenditures and exploratory dry holes being expensed as incurred. Costs of productive wells and development dry holes are capitalized and amortized on the unit-of-production method. The Corporation uses this accounting policy instead of the “full cost” method because it provides a more timely accounting of the success or failure of the Corporation’s exploration and production activities. If the full cost method were used, all costs would be capitalized and depreciated on a country-by-country basis. The capitalized costs would be subject to an impairment test by country. The full cost method would tend to delay the expense recognition of unsuccessful projects.
Impact of Oil and Gas Reserves on Depreciation. The calculation of unit-of-production depreciation is a critical accounting estimate that measures the depreciation of upstream assets. It is the ratio of actual volumes produced to total proved developed reserves (those proved reserves recoverable through existing wells with existing equipment and operating methods), applied to the asset cost. The volumes produced and asset cost are known and, while proved developed reserves have a high probability of recoverability, they are based on estimates that are subject to some variability. While the revisions the Corporation has made in the past are an indicator of variability, they have had a very small impact on the unit-of-production rates because they have been small compared to the large reserves base.
Impact of Oil and Gas Reserves and Prices on Testing for Impairment. Proved oil and gas properties held and used by the Corporation are reviewed for impairment whenever events or circumstances indicate that the carrying amounts may not be recoverable. Assets are grouped at the lowest level for which there are identifiable cash flows that are largely independent of the cash flows of other groups of assets.
The Corporation estimates the future undiscounted cash flows of the affected properties to judge the recoverability of carrying amounts. In general, analyses are based on proved reserves. Where probable reserves exist, an appropriately risk-adjusted amount of these reserves may be included in the impairment evaluation. An asset would be impaired if the undiscounted cash flows were less than its carrying value. Impairments are measured by the amount by which the carrying value exceeds its fair value.
The Corporation performs asset valuation analyses on an ongoing basis as a part of its asset management program. These analyses monitor the performance of assets against corporate objectives. They also assist the Corporation in assessing whether the carrying amounts of any of its assets may not be recoverable. In addition to estimating oil and gas reserve volumes in conducting these analyses, it is also necessary to estimate future oil and gas prices. Trigger events for impairment evaluation include a significant decrease in current and projected reserve volumes, an accumulation of project costs significantly in excess of the amount originally expected, and historical and forecast operating losses.
In general, the Corporation does not view temporarily low oil and gas prices as a trigger event for conducting the impairment tests. The markets for crude oil and natural gas have a history of significant price volatility. Although prices will occasionally drop significantly, industry prices over the long term will continue to be driven by market supply and demand. On the supply side, industry production from mature fields is declining, but this is being offset by production from new discoveries and field developments. OPEC production policies also have an impact on world oil supplies. The demand side is largely a function of global economic growth. The relative growth/decline in supply versus demand will determine industry prices over the long term, and these cannot be accurately predicted. Accordingly, any impairment tests that the Corporation performs make use of the Corporation’s price assumptions developed in the annual planning and budgeting process for the crude oil and natural gas markets, petroleum products and chemicals. These are the same price assumptions that are used for capital investment decisions. Volumes are based on individual field production profiles, which are updated annually. Cash flow estimates for impairment testing exclude the use of derivative instruments.
Supplemental information regarding oil and gas results of operations, capitalized costs and reserves is provided following the notes to consolidated financial statements. Future prices used for any impairment tests will vary from the one used in the supplemental oil and gas disclosure and could be lower or higher for any given year.
Suspended Exploratory Well Costs
The Corporation carries as an asset exploratory well costs when the well has found a sufficient quantity of reserves to justify its completion as a producing well and where the Corporation is making sufficient progress assessing the reserves and the economic and operating viability of the project. Exploratory well costs not meeting these criteria are charged to expense. Assessing whether a project has made sufficient progress is a subjective area and requires careful consideration of the relevant facts and circumstances. The facts and circumstances that support continued capitalization of suspended wells as of year-end 2009 are disclosed in note 9 to the financial statements.
57
MANAGEMENT’S DISCUSSION AND ANALYSIS OF FINANCIAL CONDITION AND RESULTS OF OPERATIONS
Consolidations
The Consolidated Financial Statements include the accounts of those subsidiaries that the Corporation controls. They also include the Corporation’s share of the undivided interest in certain upstream assets and liabilities. Amounts representing the Corporation’s percentage interest in the underlying net assets of other significant affiliates that it does not control, but exercises significant influence, are included in “Investments, advances and long-term receivables”; the Corporation’s share of the net income of these companies is included in the Consolidated Statement of Income caption “Income from equity affiliates.” The accounting for these non-consolidated companies is referred to as the equity method of accounting.
Majority ownership is normally the indicator of control that is the basis on which subsidiaries are consolidated. However, certain factors may indicate that a majority-owned investment is not controlled and therefore should be accounted for using the equity method of accounting. These factors occur where the minority shareholders are granted by law or by contract substantive participating rights. These include the right to approve operating policies, expense budgets, financing and investment plans and management compensation and succession plans.
Additional disclosures of summary balance sheet and income information for those subsidiaries accounted for under the equity method of accounting can be found in note 6.
Investments in companies that are partially owned by the Corporation are integral to the Corporation’s operations. In some cases they serve to balance worldwide risks and in others they provide the only available means of entry into a particular market or area of interest. The other parties who also have an equity interest in these companies are either independent third parties or host governments that share in the business results according to their percentage ownership. The Corporation does not invest in these companies in order to remove liabilities from its balance sheet. In fact, the Corporation has long been on record supporting an alternative accounting method that would require each investor to consolidate its percentage share of all assets and liabilities in these partially owned companies rather than only its percentage in the net equity. This method of accounting for investments in partially owned companies is not permitted by GAAP except where the investments are in the direct ownership of a share of upstream assets and liabilities. However, for purposes of calculating return on average capital employed, which is not covered by GAAP standards, the Corporation includes its share of debt of these partially owned companies in the determination of average capital employed.
Pension Benefits
The Corporation and its affiliates sponsor approximately 100 defined benefit (pension) plans in about 50 countries. The funding arrangement for each plan depends on the prevailing practices and regulations of the countries where the Corporation operates. Pension and Other Postretirement Benefits (note 16) provides details on pension obligations, fund assets and pension expense.
Some of these plans (primarily non-U.S.) provide pension benefits that are paid directly by their sponsoring affiliates out of corporate cash flow rather than a separate pension fund. Book reserves are established for these plans because tax conventions and regulatory practices do not encourage advance funding. The portion of the pension cost attributable to employee service is expensed as services are rendered. The portion attributable to the increase in pension obligations due to the passage of time is expensed over the term of the obligations, which ends when all benefits are paid. The primary difference in pension expense for unfunded versus funded plans is that pension expense for funded plans also includes a credit for the expected long-term return on fund assets.
For funded plans, including those in the United States, pension obligations are financed in advance through segregated assets or insurance arrangements. These plans are managed in compliance with the requirements of governmental authorities and meet or exceed required funding levels as measured by relevant actuarial and government standards at the mandated measurement dates. In determining liabilities and required contributions, these standards often require approaches and assumptions that differ from those used for accounting purposes.
The Corporation will continue to make contributions to these funded plans as necessary. All defined-benefit pension obligations, regardless of the funding status of the underlying plans, are fully supported by the financial strength of the Corporation or the respective sponsoring affiliate.
Pension accounting requires explicit assumptions regarding, among others, the long-term expected earnings rate on fund assets, the discount rate for the benefit obligations and the long-term rate for future salary increases. Pension assumptions are reviewed annually by outside actuaries and senior management. These assumptions are adjusted as appropriate to reflect changes in market rates and outlook. The long-term expected earnings rate on U.S. pension plan assets in 2009 was 8.0 percent. The 10-year and 20-year actual returns on U.S. pension plan assets are 3 percent and 9 percent, respectively. The Corporation establishes the long-term expected rate of return by developing a forward-looking, long-term return assumption for each pension fund asset class, taking into account factors such as the expected real return
58
for the specific asset class and inflation. A single, long-term rate of return is then calculated as the weighted average of the target asset allocation and the long-term return assumption for each asset class. A worldwide reduction of 0.5 percent in the long-term rate of return on assets would increase annual pension expense by approximately $130 million before tax.
Differences between actual returns on fund assets and the long-term expected return are not recognized in pension expense in the year that the difference occurs. Such differences are deferred, along with other actuarial gains and losses, and are amortized into pension expense over the expected remaining service life of employees.
Litigation Contingencies
A variety of claims have been made against the Corporation and certain of its consolidated subsidiaries in a number of pending lawsuits. Management has regular litigation reviews, including updates from corporate and outside counsel, to assess the need for accounting recognition or disclosure of these contingencies. The status of significant claims is summarized in note 15.
GAAP requires that liabilities for contingencies be recorded when it is probable that a liability has been incurred by the date of the balance sheet and that the amount can be reasonably estimated. These amounts are not reduced by amounts that may be recovered under insurance or claims against third parties, but undiscounted receivables from insurers or other third parties may be accrued separately. The Corporation revises such accruals in light of new information. For contingencies where an unfavorable outcome is reasonably possible and which are significant, the Corporation discloses the nature of the contingency and, where feasible, an estimate of the possible loss.
Significant management judgment is required related to contingent liabilities and the outcome of litigation because both are difficult to predict. However, the Corporation has been successful in defending litigation in the past. Payments have not had a materially adverse effect on operations or financial condition. In the Corporation’s experience, large claims often do not result in large awards. Large awards are often reversed or substantially reduced as a result of appeal or settlement.
Tax Contingencies
The Corporation is subject to income taxation in many jurisdictions around the world. Significant management judgment is required in the accounting for income tax contingencies and tax disputes because the outcomes are often difficult to predict.
GAAP requires recognition and measurement of uncertain tax positions that the Corporation has taken or expects to take in its income tax returns. The benefit of an uncertain tax position can only be recognized in the financial statements if management concludes that it is more likely than not that the position will be sustained with the tax authorities. For a position that is likely to be sustained, the benefit recognized in the financial statements is measured at the largest amount that is greater than 50 percent likely of being realized. A reserve is established for the difference between a position taken in an income tax return and the amount recognized in the financial statements. The Corporation’s unrecognized tax benefits and a description of open tax years are summarized in note 18.
Foreign Currency Translation
The method of translating the foreign currency financial statements of the Corporation’s international subsidiaries into U.S. dollars is prescribed by GAAP. Under these principles, it is necessary to select the functional currency of these subsidiaries. The functional currency is the currency of the primary economic environment in which the subsidiary operates. Management selects the functional currency after evaluating this economic environment. Downstream and Chemical operations use the local currency, except in countries with a history of high inflation (primarily in Latin America) and Singapore, which uses the U.S. dollar because it predominantly sells into the U.S. dollar export market. Upstream operations also use the local currency as the functional currency, except where crude and natural gas production is predominantly sold in the export market in U.S. dollars. Upstream operations using the U.S. dollar as their functional currency are primarily in Asia, West Africa, Russia and the Middle East.
Factors considered by management when determining the functional currency for a subsidiary include: the currency used for cash flows related to individual assets and liabilities; the responsiveness of sales prices to changes in exchange rates; the history of inflation in the country; whether sales are into local markets or exported; the currency used to acquire raw materials, labor, services and supplies; sources of financing; and significance of intercompany transactions.
59
MANAGEMENT’S REPORT ON INTERNAL CONTROL OVER FINANCIAL REPORTING
Management, including the Corporation’s chief executive officer, principal financial officer, and principal accounting officer, is responsible for establishing and maintaining adequate internal control over the Corporation’s financial reporting. Management conducted an evaluation of the effectiveness of internal control over financial reporting based on criteria established in Internal Control – Integrated Framework issued by the Committee of Sponsoring Organizations of the Treadway Commission. Based on this evaluation, management concluded that Exxon Mobil Corporation’s internal control over financial reporting was effective as of December 31, 2009.
PricewaterhouseCoopers LLP, an independent registered public accounting firm, audited the effectiveness of the Corporation’s internal control over financial reporting as of December 31, 2009, as stated in their report included in the Financial Section of this report.
|
|
|
| ||
| Rex W. Tillerson | Donald D. Humphreys | Patrick T. Mulva | ||
| Chief Executive Officer | Sr. Vice President and Treasurer | Vice President and Controller | ||
| (Principal Financial Officer) | (Principal Accounting Officer) |
REPORT OF INDEPENDENT REGISTERED PUBLIC ACCOUNTING FIRM

To the Shareholders of Exxon Mobil Corporation:
In our opinion, the accompanying Consolidated Balance Sheets and the related Consolidated Statements of Income, Comprehensive Income, Changes in Equity and Cash Flows present fairly, in all material respects, the financial position of Exxon Mobil Corporation and its subsidiaries at December 31, 2009, and 2008, and the results of their operations and their cash flows for each of the three years in the period ended December 31, 2009, in conformity with accounting principles generally accepted in the United States of America. Also in our opinion, the Corporation maintained, in all material respects, effective internal control over financial reporting as of December 31, 2009, based on criteria established in Internal Control – Integrated Framework issued by the Committee of Sponsoring Organizations of the Treadway Commission (COSO). The Corporation’s management is responsible for these financial statements, for maintaining effective internal control over financial reporting and for its assessment of the effectiveness of internal control over financial reporting, included in the accompanying Management’s Report on Internal Control over Financial Reporting. Our responsibility is to express opinions on these financial statements and on the Corporation’s internal control over financial reporting based on our integrated audits. We conducted our audits in accordance with the standards of the Public Company Accounting Oversight Board (United States). Those standards require that we plan and perform the audits to obtain reasonable assurance about whether the financial statements are free of material misstatement and whether effective internal control over financial reporting was maintained in all material respects. Our audits of the financial statements included examining, on a test basis, evidence supporting the amounts and disclosures in the financial statements, assessing the accounting principles used and significant estimates made by management, and evaluating the overall financial statement presentation. Our audit of internal control over financial reporting included obtaining an understanding of internal control over financial reporting, assessing the risk that a material weakness exists, and testing and evaluating the design and operating effectiveness of internal control based on the assessed risk. Our audits also included performing such other procedures as we considered necessary in the circumstances. We believe that our audits provide a reasonable basis for our opinions.
60
A company’s internal control over financial reporting is a process designed to provide reasonable assurance regarding the reliability of financial reporting and the preparation of financial statements for external purposes in accordance with generally accepted accounting principles. A company’s internal control over financial reporting includes those policies and procedures that (i) pertain to the maintenance of records that, in reasonable detail, accurately and fairly reflect the transactions and dispositions of the assets of the company; (ii) provide reasonable assurance that transactions are recorded as necessary to permit preparation of financial statements in accordance with generally accepted accounting principles, and that receipts and expenditures of the company are being made only in accordance with authorizations of management and directors of the company; and (iii) provide reasonable assurance regarding prevention or timely detection of unauthorized acquisition, use, or disposition of the company’s assets that could have a material effect on the financial statements.
Because of its inherent limitations, internal control over financial reporting may not prevent or detect misstatements. Also, projections of any evaluation of effectiveness to future periods are subject to the risk that controls may become inadequate because of changes in conditions, or that the degree of compliance with the policies or procedures may deteriorate.

Dallas, Texas
February 26, 2010
61
CONSOLIDATED STATEMENT OF INCOME
| Note Reference Number |
2009 |
2008 |
2007 | ||||||||
| (millions of dollars) | |||||||||||
| Revenues and other income |
|||||||||||
| Sales and other operating revenue (1) |
$ | 301,500 | $ | 459,579 | $ | 390,328 | |||||
| Income from equity affiliates |
6 | 7,143 | 11,081 | 8,901 | |||||||
| Other income (2) |
1,943 | 6,699 | 5,323 | ||||||||
| Total revenues and other income |
$ | 310,586 | $ | 477,359 | $ | 404,552 | |||||
| Costs and other deductions |
|||||||||||
| Crude oil and product purchases |
$ | 152,806 | $ | 249,454 | $ | 199,498 | |||||
| Production and manufacturing expenses |
33,027 | 37,905 | 31,885 | ||||||||
| Selling, general and administrative expenses |
14,735 | 15,873 | 14,890 | ||||||||
| Depreciation and depletion |
11,917 | 12,379 | 12,250 | ||||||||
| Exploration expenses, including dry holes |
2,021 | 1,451 | 1,469 | ||||||||
| Interest expense |
548 | 673 | 400 | ||||||||
| Sales-based taxes (1) |
18 | 25,936 | 34,508 | 31,728 | |||||||
| Other taxes and duties |
18 | 34,819 | 41,719 | 40,953 | |||||||
| Total costs and other deductions |
$ | 275,809 | $ | 393,962 | $ | 333,073 | |||||
| Income before income taxes |
$ | 34,777 | $ | 83,397 | $ | 71,479 | |||||
| Income taxes |
18 | 15,119 | 36,530 | 29,864 | |||||||
| Net income including noncontrolling interests |
$ | 19,658 | $ | 46,867 | $ | 41,615 | |||||
| Net income attributable to noncontrolling interests |
378 | 1,647 | 1,005 | ||||||||
| Net income attributable to ExxonMobil |
$ | 19,280 | $ | 45,220 | $ | 40,610 | |||||
| Earnings per common share (dollars) |
11 | $ | 3.99 | $ | 8.70 | $ | 7.31 | ||||
| Earnings per common share – assuming dilution (dollars) |
11 | $ | 3.98 | $ | 8.66 | $ | 7.26 | ||||
| (1) | Sales and other operating revenue includes sales-based taxes of $25,936 million for 2009, $34,508 million for 2008 and $31,728 million for 2007. |
| (2) | Other income for 2008 includes a $62 million gain from the sale of a non-U.S. investment and a related $143 million foreign exchange loss. |
The information in the Notes to Consolidated Financial Statements is an integral part of these statements.
62
| Note Reference Number |
Dec. 31 2009 |
Dec. 31 2008 |
||||||||
| (millions of dollars) | ||||||||||
| Assets |
||||||||||
| Current assets |
||||||||||
| Cash and cash equivalents |
$ | 10,693 | $ | 31,437 | ||||||
| Marketable securities |
169 | 570 | ||||||||
| Notes and accounts receivable, less estimated doubtful amounts |
5 | 27,645 | 24,702 | |||||||
| Inventories |
||||||||||
| Crude oil, products and merchandise |
3 | 8,718 | 9,331 | |||||||
| Materials and supplies |
2,835 | 2,315 | ||||||||
| Other current assets |
5,175 | 3,911 | ||||||||
| Total current assets |
$ | 55,235 | $ | 72,266 | ||||||
| Investments, advances and long-term receivables |
7 | 31,665 | 28,556 | |||||||
| Property, plant and equipment, at cost, less accumulated depreciation and depletion |
8 | 139,116 | 121,346 | |||||||
| Other assets, including intangibles, net |
7,307 | 5,884 | ||||||||
| Total assets |
$ | 233,323 | $ | 228,052 | ||||||
| Liabilities |
||||||||||
| Current liabilities |
||||||||||
| Notes and loans payable |
5 | $ | 2,476 | $ | 2,400 | |||||
| Accounts payable and accrued liabilities |
5 | 41,275 | 36,643 | |||||||
| Income taxes payable |
8,310 | 10,057 | ||||||||
| Total current liabilities |
$ | 52,061 | $ | 49,100 | ||||||
| Long-term debt |
13 | 7,129 | 7,025 | |||||||
| Postretirement benefits reserves |
16 | 17,942 | 20,729 | |||||||
| Deferred income tax liabilities |
18 | 23,148 | 19,726 | |||||||
| Other long-term obligations |
17,651 | 13,949 | ||||||||
| Total liabilities |
$ | 117,931 | $ | 110,529 | ||||||
| Commitments and contingencies |
15 | |||||||||
| Equity |
||||||||||
| Common stock without par value |
$ | 5,503 | $ | 5,314 | ||||||
| (9,000 million shares authorized, 8,019 million shares issued) |
||||||||||
| Earnings reinvested |
276,937 | 265,680 | ||||||||
| Accumulated other comprehensive income |
||||||||||
| Cumulative foreign exchange translation adjustment |
4,402 | 1,146 | ||||||||
| Postretirement benefits reserves adjustment |
(9,863 | ) | (11,077 | ) | ||||||
| Common stock held in treasury (3,292 million shares in 2009 and 3,043 million shares in 2008) |
(166,410 | ) | (148,098 | ) | ||||||
| ExxonMobil share of equity |
$ | 110,569 | $ | 112,965 | ||||||
| Noncontrolling interests |
4,823 | 4,558 | ||||||||
| Total equity |
115,392 | 117,523 | ||||||||
| Total liabilities and equity |
$ | 233,323 | $ | 228,052 | ||||||
The information in the Notes to Consolidated Financial Statements is an integral part of these statements.
63
CONSOLIDATED STATEMENT OF CASH FLOWS
| Note Reference Number |
2009 |
2008 |
2007 |
|||||||||||
| (millions of dollars) | ||||||||||||||
| Cash flows from operating activities |
||||||||||||||
| Net income including noncontrolling interests |
$ | 19,658 | $ | 46,867 | $ | 41,615 | ||||||||
| Adjustments for noncash transactions |
||||||||||||||
| Depreciation and depletion |
11,917 | 12,379 | 12,250 | |||||||||||
| Deferred income tax charges/(credits) |
— | 1,399 | 124 | |||||||||||
| Postretirement benefits expense in excess of/(less than) payments |
(1,722 | ) | 57 | (1,314 | ) | |||||||||
| Other long-term obligation provisions in excess of/(less than) payments |
731 | (63 | ) | 1,065 | ||||||||||
| Dividends received greater than/(less than) equity in current earnings of equity companies |
(483 | ) | 921 | (714 | ) | |||||||||
| Changes in operational working capital, excluding cash and debt |
||||||||||||||
| Reduction/(increase) – Notes and accounts receivable |
(3,170 | ) | 8,641 | (5,441 | ) | |||||||||
| – Inventories |
459 | (1,285 | ) | 72 | ||||||||||
| – Other current assets |
132 | (509 | ) | 280 | ||||||||||
| Increase/(reduction) – Accounts and other payables |
1,420 | (5,415 | ) | 6,228 | ||||||||||
| Net (gain) on asset sales |
4 | (488 | ) | (3,757 | ) | (2,217 | ) | |||||||
| All other items – net |
(16 | ) | 490 | 54 | ||||||||||
| Net cash provided by operating activities |
$ | 28,438 | $ | 59,725 | $ | 52,002 | ||||||||
| Cash flows from investing activities |
||||||||||||||
| Additions to property, plant and equipment |
$ | (22,491 | ) | $ | (19,318 | ) | $ | (15,387 | ) | |||||
| Sales of subsidiaries, investments and property, plant and equipment |
4 | 1,545 | 5,985 | 4,204 | ||||||||||
| Decrease in restricted cash and cash equivalents |
4 | — | — | 4,604 | ||||||||||
| Additional investments and advances |
(2,752 | ) | (2,495 | ) | (3,038 | ) | ||||||||
| Collection of advances |
724 | 574 | 391 | |||||||||||
| Additions to marketable securities |
(16 | ) | (2,113 | ) | (646 | ) | ||||||||
| Sales of marketable securities |
571 | 1,868 | 144 | |||||||||||
| Net cash used in investing activities |
$ | (22,419 | ) | $ | (15,499 | ) | $ | (9,728 | ) | |||||
| Cash flows from financing activities |
||||||||||||||
| Additions to long-term debt |
$ | 225 | $ | 79 | $ | 592 | ||||||||
| Reductions in long-term debt |
(68 | ) | (192 | ) | (209 | ) | ||||||||
| Additions to short-term debt |
1,336 | 1,067 | 1,211 | |||||||||||
| Reductions in short-term debt |
(1,575 | ) | (1,624 | ) | (809 | ) | ||||||||
| Additions/(reductions) in debt with three months or less maturity |
(71 | ) | 143 | (187 | ) | |||||||||
| Cash dividends to ExxonMobil shareholders |
(8,023 | ) | (8,058 | ) | (7,621 | ) | ||||||||
| Cash dividends to noncontrolling interests |
(280 | ) | (375 | ) | (289 | ) | ||||||||
| Changes in noncontrolling interests |
(113 | ) | (419 | ) | (659 | ) | ||||||||
| Tax benefits related to stock-based awards |
237 | 333 | 369 | |||||||||||
| Common stock acquired |
(19,703 | ) | (35,734 | ) | (31,822 | ) | ||||||||
| Common stock sold |
752 | 753 | 1,079 | |||||||||||
| Net cash used in financing activities |
$ | (27,283 | ) | $ | (44,027 | ) | $ | (38,345 | ) | |||||
| Effects of exchange rate changes on cash |
$ | 520 | $ | (2,743 | ) | $ | 1,808 | |||||||
| Increase/(decrease) in cash and cash equivalents |
$ | (20,744 | ) | $ | (2,544 | ) | $ | 5,737 | ||||||
| Cash and cash equivalents at beginning of year |
31,437 | 33,981 | 28,244 | |||||||||||
| Cash and cash equivalents at end of year |
$ | 10,693 | $ | 31,437 | $ | 33,981 | ||||||||
The information in the Notes to Consolidated Financial Statements is an integral part of these statements.
64
CONSOLIDATED STATEMENT OF CHANGES IN EQUITY
| ExxonMobil Share of Equity |
||||||||||||||||||||||||||||
| Common Stock |
Earnings Reinvested |
Accumulated Other Comprehensive Income |
Common Stock Held in Treasury |
ExxonMobil Share of Equity |
Noncontrolling Interests |
Total Equity |
||||||||||||||||||||||
| (millions of dollars) | ||||||||||||||||||||||||||||
| Balance as of December 31, 2006 |
$ | 4,786 | $ | 195,207 | $ | (2,762 | ) | $ | (83,387 | ) | $ | 113,844 | $ | 3,804 | $ | 117,648 | ||||||||||||
| Restricted stock amortization |
531 | 531 | 531 | |||||||||||||||||||||||||
| Tax benefits related to stock-based awards |
113 | 113 | 113 | |||||||||||||||||||||||||
| Cumulative effect of accounting change (note 18) |
(55 | ) | 322 | 267 | 267 | |||||||||||||||||||||||
| Other |
(442 | ) | (442 | ) | (442 | ) | ||||||||||||||||||||||
| Net income for the year |
40,610 | 40,610 | 1,005 | 41,615 | ||||||||||||||||||||||||
| Dividends – common shares |
(7,621 | ) | (7,621 | ) | (289 | ) | (7,910 | ) | ||||||||||||||||||||
| Foreign exchange translation adjustment |
4,239 | 4,239 | 482 | 4,721 | ||||||||||||||||||||||||
| Postretirement benefits reserves adjustment (note 16) |
(326 | ) | (326 | ) | (61 | ) | (387 | ) | ||||||||||||||||||||
| Amortization of postretirement benefits reserves adjustment included in net periodic benefit costs (note 16) |
838 | 838 | 838 | |||||||||||||||||||||||||
| Acquisitions, at cost |
(31,822 | ) | (31,822 | ) | (762 | ) | (32,584 | ) | ||||||||||||||||||||
| Dispositions |
1,531 | 1,531 | 103 | 1,634 | ||||||||||||||||||||||||
| Balance as of December 31, 2007 |
$ | 4,933 | $ | 228,518 | $ | 1,989 | $ | (113,678 | ) | $ | 121,762 | $ | 4,282 | $ | 126,044 | |||||||||||||
| Restricted stock amortization |
618 | 618 | 618 | |||||||||||||||||||||||||
| Tax benefits related to stock-based awards |
315 | 315 | 315 | |||||||||||||||||||||||||
| Other |
(552 | ) | (552 | ) | (552 | ) | ||||||||||||||||||||||
| Net income for the year |
45,220 | 45,220 | 1,647 | 46,867 | ||||||||||||||||||||||||
| Dividends – common shares |
(8,058 | ) | (8,058 | ) | (375 | ) | (8,433 | ) | ||||||||||||||||||||
| Foreign exchange translation adjustment |
(6,964 | ) | (6,964 | ) | (334 | ) | (7,298 | ) | ||||||||||||||||||||
| Adjustment for foreign exchange translation loss included in net income |
138 | 138 | 17 | 155 | ||||||||||||||||||||||||
| Postretirement benefits reserves adjustment (note 16) |
(5,853 | ) | (5,853 | ) | (224 | ) | (6,077 | ) | ||||||||||||||||||||
| Amortization of postretirement benefits reserves adjustment included in net periodic benefit costs (note 16) |
759 | 759 | 759 | |||||||||||||||||||||||||
| Acquisitions, at cost |
(35,734 | ) | (35,734 | ) | (675 | ) | (36,409 | ) | ||||||||||||||||||||
| Dispositions |
1,314 | 1,314 | 220 | 1,534 | ||||||||||||||||||||||||
| Balance as of December 31, 2008 |
$ | 5,314 | $ | 265,680 | $ | (9,931 | ) | $ | (148,098 | ) | $ | 112,965 | $ | 4,558 | $ | 117,523 | ||||||||||||
| Restricted stock amortization |
685 | 685 | 685 | |||||||||||||||||||||||||
| Tax benefits related to stock-based awards |
140 | 140 | 140 | |||||||||||||||||||||||||
| Other |
(636 | ) | (636 | ) | (636 | ) | ||||||||||||||||||||||
| Net income for the year |
19,280 | 19,280 | 378 | 19,658 | ||||||||||||||||||||||||
| Dividends – common shares |
(8,023 | ) | (8,023 | ) | (280 | ) | (8,303 | ) | ||||||||||||||||||||
| Foreign exchange translation adjustment |
3,256 | 3,256 | 373 | 3,629 | ||||||||||||||||||||||||
| Postretirement benefits reserves adjustment (note 16) |
(196 | ) | (196 | ) | (144 | ) | (340 | ) | ||||||||||||||||||||
| Amortization of postretirement benefits reserves adjustment included in net periodic benefit costs (note 16) |
1,410 | 1,410 | 51 | 1,461 | ||||||||||||||||||||||||
| Acquisitions, at cost |
(19,703 | ) | (19,703 | ) | (127 | ) | (19,830 | ) | ||||||||||||||||||||
| Dispositions |
1,391 | 1,391 | 14 | 1,405 | ||||||||||||||||||||||||
| Balance as of December 31, 2009 |
$ | 5,503 | $ | 276,937 | $ | (5,461 | ) | $ | (166,410 | ) | $ | 110,569 | $ | 4,823 | $ | 115,392 | ||||||||||||
The information in the Notes to Consolidated Financial Statements is an integral part of these statements.
65
CONSOLIDATED STATEMENT OF CHANGES IN EQUITY (continued)
| Common Stock Share Activity |
Issued |
Held in Treasury |
Outstanding |
|||||
| (millions of shares) | ||||||||
| Balance as of December 31, 2006 |
8,019 | (2,290 | ) | 5,729 | ||||
| Acquisitions |
(386 | ) | (386 | ) | ||||
| Dispositions |
39 | 39 | ||||||
| Balance as of December 31, 2007 |
8,019 | (2,637 | ) | 5,382 | ||||
| Acquisitions |
(434 | ) | (434 | ) | ||||
| Dispositions |
28 | 28 | ||||||
| Balance as of December 31, 2008 |
8,019 | (3,043 | ) | 4,976 | ||||
| Acquisitions |
(277 | ) | (277 | ) | ||||
| Dispositions |
28 | 28 | ||||||
| Balance as of December 31, 2009 |
8,019 | (3,292 | ) | 4,727 | ||||
CONSOLIDATED STATEMENT OF COMPREHENSIVE INCOME
| 2009 |
2008 |
2007 |
||||||||||
| (millions of dollars) | ||||||||||||
| Net income including noncontrolling interests |
$ | 19,658 | $ | 46,867 | $ | 41,615 | ||||||
| Other comprehensive income (net of income taxes) |
||||||||||||
| Foreign exchange translation adjustment |
3,629 | (7,298 | ) | 4,721 | ||||||||
| Adjustment for foreign exchange translation loss included in net income |
— | 155 | — | |||||||||
| Postretirement benefits reserves adjustment (excluding amortization) |
(340 | ) | (6,077 | ) | (387 | ) | ||||||
| Amortization of postretirement benefits reserves adjustment included in net periodic benefit costs |
1,461 | 759 | 838 | |||||||||
| Comprehensive income including noncontrolling interests |
24,408 | 34,406 | 46,787 | |||||||||
| Comprehensive income attributable to noncontrolling interests |
658 | 1,106 | 1,426 | |||||||||
| Comprehensive income attributable to ExxonMobil |
$ | 23,750 | $ | 33,300 | $ | 45,361 | ||||||
The information in the Notes to Consolidated Financial Statements is an integral part of these statements.
66
NOTES TO CONSOLIDATED FINANCIAL STATEMENTS
The accompanying consolidated financial statements and the supporting and supplemental material are the responsibility of the management of Exxon Mobil Corporation.
The Corporation’s principal business is energy, involving the worldwide exploration, production, transportation and sale of crude oil and natural gas (Upstream) and the manufacture, transportation and sale of petroleum products (Downstream). The Corporation is also a major worldwide manufacturer and marketer of petrochemicals (Chemical) and participates in electric power generation (Upstream).
The preparation of financial statements in conformity with U.S. Generally Accepted Accounting Principles (GAAP) requires management to make estimates that affect the reported amounts of assets, liabilities, revenues and expenses and the disclosure of contingent assets and liabilities. Actual results could differ from these estimates. Prior years’ data has been reclassified in certain cases to conform to the 2009 presentation basis.
Subsequent events have been evaluated through February 26, 2010, the date the financial statements were issued.
1. Summary of Accounting Policies
Principles of Consolidation. The Consolidated Financial Statements include the accounts of those subsidiaries owned directly or indirectly with more than 50 percent of the voting rights held by the Corporation and for which other shareholders do not possess the right to participate in significant management decisions. They also include the Corporation’s share of the undivided interest in certain upstream assets and liabilities.
Amounts representing the Corporation’s percentage interest in the underlying net assets of other subsidiaries and less-than-majority-owned companies in which a significant ownership percentage interest is held are included in “Investments, advances and long-term receivables”; the Corporation’s share of the net income of these companies is included in the Consolidated Statement of Income caption “Income from equity affiliates.” The Corporation’s share of the cumulative foreign exchange translation adjustment for equity method investments is reported in the Consolidated Statement of Changes in Equity. Evidence of loss in value that might indicate impairment of investments in companies accounted for on the equity method is assessed to determine if such evidence represents a loss in value of the Corporation’s investment that is other than temporary. Examples of key indicators include a history of operating losses, a negative earnings and cash flow outlook, significant downward revisions to oil and gas reserves, and the financial condition and prospects for the investee’s business segment or geographic region. If evidence of an other than temporary loss in fair value below carrying amount is determined, an impairment is recognized. In the absence of market prices for the investment, discounted cash flows are used to assess fair value.
Revenue Recognition. The Corporation generally sells crude oil, natural gas and petroleum and chemical products under short-term agreements at prevailing market prices. In some cases (e.g., natural gas), products may be sold under long-term agreements, with periodic price adjustments. In all cases, revenues are recognized when the products are delivered, which occurs when the customer has taken title and has assumed the risks and rewards of ownership, prices are fixed or determinable and collectibility is reasonably assured.
Revenues from the production of natural gas properties in which the Corporation has an interest with other producers are recognized on the basis of the Corporation’s net working interest. Differences between actual production and net working interest volumes are not significant.
Purchases and sales of inventory with the same counterparty that are entered into in contemplation of one another are combined and recorded as exchanges measured at the book value of the item sold.
Sales-Based Taxes. The Corporation reports sales, excise and value-added taxes on sales transactions on a gross basis in the Consolidated Statement of Income (included in both revenues and costs). This gross reporting basis is footnoted on the Consolidated Statement of Income.
Derivative Instruments. The Corporation makes limited use of derivative instruments. The Corporation does not engage in speculative derivative activities or derivative trading activities nor does it use derivatives with leveraged features. When the Corporation does enter into derivative transactions, it is to offset exposures associated with interest rates, foreign currency exchange rates and hydrocarbon prices that arise from existing assets, liabilities and transactions.
The gains and losses resulting from changes in the fair value of derivatives are recorded in income. In some cases, the Corporation designates derivatives as fair value hedges, in which case the gains and losses are offset in income by the gains and losses arising from changes in the fair value of the underlying hedged items.
Inventories. Crude oil, products and merchandise inventories are carried at the lower of current market value or cost (generally determined under the last-in, first-out method – LIFO). Inventory costs include expenditures and other charges (including depreciation) directly and indirectly incurred in bringing the inventory to its existing condition and location. Selling expenses and general and administrative expenses are reported as period costs and excluded from inventory cost. Inventories of materials and supplies are valued at cost or less.
Property, Plant and Equipment. Depreciation, depletion and amortization, based on cost less estimated salvage value of the asset, are primarily determined under either the unit-of-production method or the straight-line method, which is based on estimated asset service life taking obsolescence into consideration. Maintenance and repairs, including planned major maintenance, are expensed as incurred. Major renewals and improvements are capitalized and the assets replaced are retired.
Interest costs incurred to finance expenditures during the construction phase of multiyear projects are capitalized as part of the historical cost of acquiring the constructed assets. The project construction phase commences with the development of the detailed engineering design and ends when the constructed assets are ready for their intended use. Capitalized interest costs are included in property, plant and equipment and are depreciated over the service life of the related assets.
The Corporation uses the “successful efforts” method to account for its exploration and production activities. Under this method, costs are accumulated on a field-by-field basis with certain exploratory expenditures and exploratory dry holes being expensed as incurred. Costs of productive wells and development dry holes are capitalized and amortized on the unit-of-production method.
The Corporation carries as an asset exploratory well costs when the well has found a sufficient quantity of reserves to justify its completion
67
NOTES TO CONSOLIDATED FINANCIAL STATEMENTS
as a producing well and where the Corporation is making sufficient progress assessing the reserves and the economic and operating viability of the project. Exploratory well costs not meeting these criteria are charged to expense.
Acquisition costs of proved properties are amortized using a unit-of-production method, computed on the basis of total proved oil and gas reserves. Significant unproved properties are assessed for impairment individually and valuation allowances against the capitalized costs are recorded based on the estimated economic chance of success and the length of time that the Corporation expects to hold the properties. The cost of properties that are not individually significant are aggregated by groups and amortized over the average holding period of the properties of the groups. The valuation allowances are reviewed at least annually. Other exploratory expenditures, including geophysical costs, other dry hole costs and annual lease rentals, are expensed as incurred.
Unit-of-production depreciation is applied to property, plant and equipment, including capitalized exploratory drilling and development costs, associated with productive depletable extractive properties in the Upstream segment. Unit-of-production rates are based on the amount of proved developed reserves of oil, gas and other minerals that are estimated to be recoverable from existing facilities using current operating methods.
Under the unit-of-production method, oil and gas volumes are considered produced once they have been measured through meters at custody transfer or sales transaction points at the outlet valve on the lease or field storage tank.
Production costs are expensed as incurred. Production involves lifting the oil and gas to the surface and gathering, treating, field processing and field storage of the oil and gas. The production function normally terminates at the outlet valve on the lease or field production storage tank. Production costs are those incurred to operate and maintain the Corporation’s wells and related equipment and facilities. They become part of the cost of oil and gas produced. These costs, sometimes referred to as lifting costs, include such items as labor costs to operate the wells and related equipment; repair and maintenance costs on the wells and equipment; materials, supplies and energy costs required to operate the wells and related equipment; and administrative expenses related to the production activity.
Gains on sales of proved and unproved properties are only recognized when there is no uncertainty about the recovery of costs applicable to any interest retained or where there is no substantial obligation for future performance by the Corporation. Losses on properties sold are recognized when incurred or when the properties are held for sale and the fair value of the properties is less than the carrying value.
Proved oil and gas properties held and used by the Corporation are reviewed for impairment whenever events or changes in circumstances indicate that the carrying amounts may not be recoverable. Assets are grouped at the lowest level for which there are identifiable cash flows that are largely independent of the cash flows of other groups of assets.
The Corporation estimates the future undiscounted cash flows of the affected properties to judge the recoverability of carrying amounts. Cash flows used in impairment evaluations are developed using annually updated corporate plan investment evaluation assumptions for crude oil commodity prices and foreign currency exchange rates. Annual volumes are based on individual field production profiles, which are also updated annually. Prices for natural gas and other products are based on corporate plan assumptions developed annually by major region and also for investment evaluation purposes. Cash flow estimates for impairment testing exclude derivative instruments.
Impairment analyses are generally based on proved reserves. Where probable reserves exist, an appropriately risk-adjusted amount of these reserves may be included in the impairment evaluation. Impairments are measured by the amount the carrying value exceeds the fair value.
Asset Retirement Obligations and Environmental Liabilities. The Corporation incurs retirement obligations for certain assets at the time they are installed. The fair values of these obligations are recorded as liabilities on a discounted basis. The costs associated with these liabilities are capitalized as part of the related assets and depreciated. Over time, the liabilities are accreted for the change in their present value.
Liabilities for environmental costs are recorded when it is probable that obligations have been incurred and the amounts can be reasonably estimated. These liabilities are not reduced by possible recoveries from third parties and projected cash expenditures are not discounted.
Foreign Currency Translation. The Corporation selects the functional reporting currency for its international subsidiaries based on the currency of the primary economic environment in which each subsidiary operates. Downstream and Chemical operations primarily use the local currency. However, the U.S. dollar is used in countries with a history of high inflation (primarily in Latin America) and Singapore, which predominantly sells into the U.S. dollar export market. Upstream operations which are relatively self-contained and integrated within a particular country, such as Canada, the United Kingdom, Norway and continental Europe, use the local currency. Some Upstream operations, primarily in Asia, West Africa, Russia and the Middle East, use the U.S. dollar because they predominantly sell crude and natural gas production into U.S. dollar-denominated markets. For all operations, gains or losses from remeasuring foreign currency transactions into the functional currency are included in income.
Share-Based Payments. The Corporation awards share-based compensation to employees in the form of restricted stock and restricted stock units. Compensation expense is measured by the market price of the restricted shares at the date of grant and is recognized in the income statement over the requisite service period of each award. See note 14, Incentive Program, for further details.
Fair Value Measurements. Effective January 1, 2009, ExxonMobil adopted the authoritative guidance for fair value measurements as they relate to nonfinancial assets and liabilities that are measured at fair value on a nonrecurring basis. The guidance defines fair value, establishes a framework for measuring fair value when an entity is required to use a fair value measure for recognition or disclosure purposes and expands the disclosures about fair value measures. The adoption did not have a material impact on the Corporation’s financial statements. The Corporation previously adopted the guidance as it relates to financial assets and liabilities that are measured at fair value and for nonfinancial assets and liabilities that are measured at fair value on a recurring basis.
Noncontrolling Interests. Effective January 1, 2009, ExxonMobil adopted the authoritative guidance on consolidation as it relates to noncontrolling interests. The guidance changed the accounting and reporting
68
for minority interests, which were recharacterized as noncontrolling interests and classified as a component of equity. The guidance requires retrospective adoption of the presentation and disclosure requirements for existing minority interests. All other requirements of the guidance will be applied prospectively. The adoption of the guidance did not have a material impact on the Corporation’s financial statements.
Business Combinations. Effective January 1, 2009, ExxonMobil adopted the authoritative guidance for business combinations. This guidance applies prospectively to all transactions in which an entity obtains control of one or more other businesses. In general, the guidance requires the acquiring entity in a business combination to recognize the fair value of all assets acquired and liabilities assumed in the transaction; establishes the acquisition date as the fair value measurement point; and modifies disclosure requirements. It also modifies the accounting treatment for transaction costs by requiring that these be expensed as incurred. The adoption of the guidance did not have a material impact on the Corporation’s financial statements.
Earnings Per Share. Effective January 1, 2009, ExxonMobil adopted the authoritative guidance for earnings per share as it relates to determining whether instruments granted in share-based payment transactions are participating securities. The guidance requires that all unvested share-based payment awards that contain nonforfeitable rights to dividends should be included in the basic Earnings Per Share (EPS) calculation. Prior-year EPS numbers have been adjusted retrospectively on a consistent basis with 2009 reporting. This guidance did not affect the consolidated financial position or results of operations.
Oil and Gas Reserves. Effective December 31, 2009, ExxonMobil adopted the authoritative guidance for estimating and disclosing oil and gas reserve quantities. Year-end 2009 proved reserve volumes as well as the 2009 reserve change categories were calculated using average prices during the 12-month period. Year-end 2008 and 2007 reserve volumes were calculated using December 31 prices. The effect on unit-of-production depreciation rates of using 12-month average versus December 31 prices will be applied prospectively commencing in 2010. Additionally, the definition of “oil and gas producing activities” has been expanded to include bitumen extracted through mining activities and hydrocarbons from other non-traditional resources. The amended rules also adopted a reliable technology definition that permits reserves to be added based on field-tested technologies. The adoption of this guidance is not expected to have a material impact on the Corporation’s consolidated financial position or results of operations.
3. Miscellaneous Financial Information
Research and development costs totaled $1,050 million in 2009, $847 million in 2008 and $814 million in 2007.
Net income included before-tax aggregate foreign exchange transaction gains of $54 million, $54 million and $229 million in 2009, 2008 and 2007, respectively.
In 2009, 2008 and 2007, net income included gains of $207 million, $341 million and $327 million, respectively, attributable to the combined effects of LIFO inventory accumulations and draw-downs. The aggregate replacement cost of inventories was estimated to exceed their LIFO carrying values by $17.1 billion and $10.0 billion at December 31, 2009, and 2008, respectively.
Crude oil, products and merchandise as of year-end 2009 and 2008 consist of the following:
| 2009 |
2008 | |||||
| (billions of dollars) | ||||||
| Petroleum products |
$ | 3.2 | $ | 3.7 | ||
| Crude oil |
3.2 | 3.1 | ||||
| Chemical products |
2.0 | 2.2 | ||||
| Gas/other |
0.3 | 0.3 | ||||
| Total |
$ | 8.7 | $ | 9.3 | ||
The Consolidated Statement of Cash Flows provides information about changes in cash and cash equivalents. Highly liquid investments with maturities of three months or less when acquired are classified as cash equivalents.
The “Net (gain) on asset sales” in net cash provided by operating activities on the Consolidated Statement of Cash Flows includes before-tax gains from the sale of Downstream assets and investments and producing properties in the Upstream in 2009; from the sale of a natural gas transportation business in Germany and other producing properties in the Upstream and Downstream assets and investments in 2008; and from the sale of producing properties in the Upstream and Downstream assets and investments in 2007. These gains are reported in “Other income” on the Consolidated Statement of Income.
The restriction on $4.6 billion of cash and cash equivalents was released in 2007 following an Alabama Supreme Court judgment in ExxonMobil’s favor.
| 2009 |
2008 |
2007 | |||||||
| (millions of dollars) | |||||||||
| Cash payments for interest |
$ | 820 | $ | 650 | $ | 555 | |||
| Cash payments for income taxes |
$ | 15,427 | $ | 33,941 | $ | 26,342 | |||
5. Additional Working Capital Information
| Dec. 31 2009 |
Dec. 31 2008 | |||||
| (millions of dollars) | ||||||
| Notes and accounts receivable |
||||||
| Trade, less reserves of $198 million and $219 million |
$ | 22,186 | $ | 18,707 | ||
| Other, less reserves of $31 million and $43 million |
5,459 | 5,995 | ||||
| Total |
$ | 27,645 | $ | 24,702 | ||
| Notes and loans payable |
||||||
| Bank loans |
$ | 1,043 | $ | 1,139 | ||
| Commercial paper |
201 | 172 | ||||
| Long-term debt due within one year |
348 | 368 | ||||
| Other |
884 | 721 | ||||
| Total |
$ | 2,476 | $ | 2,400 | ||
| Accounts payable and accrued liabilities |
||||||
| Trade payables |
$ | 24,236 | $ | 21,190 | ||
| Payables to equity companies |
4,979 | 3,552 | ||||
| Accrued taxes other than income taxes |
5,921 | 5,866 | ||||
| Other |
6,139 | 6,035 | ||||
| Total |
$ | 41,275 | $ | 36,643 | ||
69
NOTES TO CONSOLIDATED FINANCIAL STATEMENTS
On December 31, 2009, unused credit lines for short-term financing totaled approximately $4.8 billion. Of this total, $2.3 billion support commercial paper programs under terms negotiated when drawn. The weighted-average interest rate on short-term borrowings outstanding at December 31, 2009, and 2008, was 3.6 percent and 5.7 percent, respectively.
The summarized financial information below includes amounts related to certain less-than-majority-owned companies and majority-owned subsidiaries where minority shareholders possess the right to participate in significant management decisions (see note 1).
These companies are primarily engaged in crude production, natural gas marketing and refining operations in North America; natural gas production, natural gas distribution and downstream operations in Europe; crude production in Kazakhstan; and liquefied natural gas (LNG) operations in Qatar. Also included are several power generation, refining, petrochemical/lubes manufacturing and chemical ventures. The Corporation’s ownership in these ventures is in the form of shares in corporate joint ventures as well as interests in partnerships. The share of total equity company revenues from sales to ExxonMobil consolidated companies was 19 percent, 21 percent and 23 percent in the years 2009, 2008 and 2007, respectively.
| 2009 |
2008 |
2007 | ||||||||||||||||
| Equity Company Financial Summary |
Total |
ExxonMobil Share |
Total |
ExxonMobil Share |
Total |
ExxonMobil Share | ||||||||||||
| (millions of dollars) | ||||||||||||||||||
| Total revenues |
$ | 112,153 | $ | 36,570 | $ | 148,477 | $ | 49,999 | $ | 109,149 | $ | 37,724 | ||||||
| Income before income taxes |
$ | 28,472 | $ | 9,632 | $ | 42,588 | $ | 15,082 | $ | 30,505 | $ | 11,448 | ||||||
| Income taxes |
7,775 | 2,489 | 12,020 | 4,001 | 7,557 | 2,547 | ||||||||||||
| Income from equity affiliates |
$ | 20,697 | $ | 7,143 | $ | 30,568 | $ | 11,081 | $ | 22,948 | $ | 8,901 | ||||||
| Current assets |
$ | 37,376 | $ | 12,843 | $ | 29,358 | $ | 9,920 | $ | 29,268 | $ | 10,228 | ||||||
| Property, plant and equipment, less accumulated depreciation |
85,468 | 27,134 | 81,916 | 25,974 | 70,591 | 22,638 | ||||||||||||
| Other long-term assets |
2,685 | 849 | 5,526 | 2,365 | 6,667 | 3,092 | ||||||||||||
| Total assets |
$ | 125,529 | $ | 40,826 | $ | 116,800 | $ | 38,259 | $ | 106,526 | $ | 35,958 | ||||||
| Short-term debt |
$ 3,632 | $ | 965 | $ | 3,462 | $ | 1,085 | $ | 3,127 | $ | 1,117 | |||||||
| Other current liabilities |
21,222 | 7,120 | 22,759 | 7,622 | 20,861 | 7,124 | ||||||||||||
| Long-term debt |
29,591 | 4,078 | 26,075 | 3,713 | 19,821 | 2,269 | ||||||||||||
| Other long-term liabilities |
10,746 | 4,252 | 9,183 | 3,809 | 8,142 | 3,395 | ||||||||||||
| Advances from shareholders |
17,047 | 8,669 | 15,637 | 7,572 | 18,422 | 8,353 | ||||||||||||
| Net assets |
$ | 43,291 | $ | 15,742 | $ | 39,684 | $ | 14,458 | $ | 36,153 | $ | 13,700 | ||||||
A list of significant equity companies as of December 31, 2009, together with the Corporation’s percentage ownership interest, is detailed below:
| Percentage Ownership Interest | ||
| Upstream |
||
| Aera Energy LLC |
48 | |
| BEB Erdgas und Erdoel GmbH |
50 | |
| Cameroon Oil Transportation Company S.A. |
41 | |
| Castle Peak Power Company Limited |
60 | |
| Golden Pass LNG Terminal LLC |
18 | |
| Nederlandse Aardolie Maatschappij B.V. |
50 | |
| Qatar Liquefied Gas Company Limited |
10 | |
| Qatar Liquefied Gas Company Limited 2 |
24 | |
| Ras Laffan Liquefied Natural Gas Company Limited |
25 | |
| Ras Laffan Liquefied Natural Gas Company Limited II |
30 | |
| Ras Laffan Liquefied Natural Gas Company Limited (3) |
30 | |
| South Hook LNG Terminal Company Limited |
24 | |
| Tengizchevroil, LLP |
25 | |
| Terminale GNL Adriatico S.r.l. |
45 | |
| Downstream |
||
| Chalmette Refining, LLC |
50 | |
| Fujian Refining & Petrochemical Co. Ltd. |
25 | |
| Saudi Aramco Mobil Refinery Company Ltd. |
50 | |
| Chemical |
||
| Al-Jubail Petrochemical Company |
50 | |
| Infineum Holdings B.V. |
50 | |
| Saudi Yanbu Petrochemical Co. |
50 | |
70
7. Investments, Advances and Long-Term Receivables
| Dec. 31 2009 |
Dec. 31 2008 | |||||
| (millions of dollars) | ||||||
| Companies carried at equity in underlying assets |
||||||
| Investments |
$ | 15,742 | $ | 14,458 | ||
| Advances |
8,669 | 7,572 | ||||
| $ | 24,411 | $ | 22,030 | |||
| Companies carried at cost or less and stock investments carried at fair value |
1,577 | 1,636 | ||||
| $ | 25,988 | $ | 23,666 | |||
| Long-term receivables and miscellaneous investments at cost or less, net of reserves of $368 million and $1,288 million |
5,677 | 4,890 | ||||
| Total |
$ | 31,665 | $ | 28,556 | ||
8. Property, Plant and Equipment and Asset Retirement Obligations
| Dec. 31, 2009 |
Dec. 31, 2008 | |||||||||||
| Property, Plant and Equipment |
Cost |
Net |
Cost |
Net | ||||||||
| (millions of dollars) | ||||||||||||
| Upstream |
$ | 198,036 | $ | 88,319 | $ | 168,977 | $ | 73,413 | ||||
| Downstream |
68,092 | 30,499 | 64,618 | 29,254 | ||||||||
| Chemical |
28,464 | 13,511 | 25,463 | 11,430 | ||||||||
| Other |
11,314 | 6,787 | 11,787 | 7,249 | ||||||||
| Total |
$ | 305,906 | $ | 139,116 | $ | 270,845 | $ | 121,346 | ||||
In the Upstream segment, depreciation is generally on a unit-of-production basis, so depreciable life will vary by field. In the Downstream segment, investments in refinery and lubes basestock manufacturing facilities are generally depreciated on a straight-line basis over a 25-year life and service station buildings and fixed improvements over a 20-year life. In the Chemical segment, investments in process equipment are generally depreciated on a straight-line basis over a 20-year life. Accumulated depreciation and depletion totaled $166,790 million at the end of 2009 and $149,499 million at the end of 2008. Interest capitalized in 2009, 2008 and 2007 was $425 million, $510 million and $557 million, respectively.
Asset Retirement Obligations
The Corporation incurs retirement obligations for its upstream assets. The fair values of these obligations are recorded as liabilities on a discounted basis, which is typically at the time the assets are installed. The Corporation uses estimates, assumptions and judgments regarding such factors as the existence of a legal obligation for an ARO; technical assessments of the assets; estimated amounts and timing of settlements; the credit-adjusted risk-free rate to be used; and inflation rates. AROs incurred in the current period were Level 3 (unobservable inputs) fair value measurements. The costs associated with these liabilities are capitalized as part of the related assets and depreciated as the reserves are produced. Over time, the liabilities are accreted for the change in their present value. Asset retirement obligations for downstream and chemical facilities generally become firm at the time the facilities are permanently shut down and dismantled. These obligations may include the costs of asset disposal and additional soil remediation. However, these sites have indeterminate lives based on plans for continued operations and as such, the fair value of the conditional legal obligations cannot be measured, since it is impossible to estimate the future settlement dates of such obligations.
The following table summarizes the activity in the liability for asset retirement obligations:
| 2009 |
2008 |
|||||||
| (millions of dollars) | ||||||||
| Beginning balance |
$ | 5,352 | $ | 5,141 | ||||
| Accretion expense and other provisions |
372 | 335 | ||||||
| Reduction due to property sales |
(18 | ) | (369 | ) | ||||
| Payments made |
(448 | ) | (258 | ) | ||||
| Liabilities incurred |
156 | 195 | ||||||
| Foreign currency translation |
535 | (837 | ) | |||||
| Revisions |
2,524 | 1,145 | ||||||
| Ending balance |
$ | 8,473 | $ | 5,352 | ||||
71
NOTES TO CONSOLIDATED FINANCIAL STATEMENTS
9. Accounting for Suspended Exploratory Well Costs
The Corporation continues capitalization of exploratory well costs beyond one year after the well is completed if (a) the well found a sufficient quantity of reserves to justify its completion as a producing well and (b) sufficient progress is being made in assessing the reserves and the economic and operating viability of the project.
The following two tables provide details of the changes in the balance of suspended exploratory well costs as well as an aging summary of those costs.
Change in capitalized suspended exploratory well costs:
| 2009 |
2008 |
2007 |
||||||||||
| (millions of dollars) | ||||||||||||
| Balance beginning at January 1 |
$ | 1,585 | $ | 1,291 | $ | 1,305 | ||||||
| Additions pending the determination of proved reserves |
624 | 448 | 228 | |||||||||
| Charged to expense |
(51 | ) | — | (108 | ) | |||||||
| Reclassifications to wells, facilities and equipment based on the determination of proved reserves |
(200 | ) | (101 | ) | (82 | ) | ||||||
| Other |
47 | (53 | ) | (52 | ) | |||||||
| Ending balance |
$ | 2,005 | $ | 1,585 | $ | 1,291 | ||||||
| Ending balance attributed to equity companies included above |
$ | 9 | $ | 10 | $ | 3 | ||||||
| Period end capitalized suspended exploratory well costs: | ||||||||||||
| 2009 |
2008 |
2007 |
||||||||||
| (millions of dollars) | ||||||||||||
| Capitalized for a period of one year or less |
$ | 624 | $ | 448 | $ | 228 | ||||||
| Capitalized for a period of between one and five years |
924 | 636 | 566 | |||||||||
| Capitalized for a period of between five and ten years |
220 | 225 | 255 | |||||||||
| Capitalized for a period of greater than ten years |
237 | 276 | 242 | |||||||||
| Capitalized for a period greater than one year – subtotal |
$ | 1,381 | $ | 1,137 | $ | 1,063 | ||||||
| Total |
$ | 2,005 | $ | 1,585 | $ | 1,291 | ||||||
| Exploration activity often involves drilling multiple wells, over a number of years, to fully evaluate a project. The table below provides a numerical breakdown of the number of projects with suspended exploratory well costs which had their first capitalized well drilled in the preceding 12 months and those that have had exploratory well costs capitalized for a period greater than 12 months. | ||||||||||||
| 2009 |
2008 |
2007 |
||||||||||
| Number of projects with first capitalized well drilled in the preceding 12 months |
18 | 12 | 4 | |||||||||
| Number of projects that have exploratory well costs capitalized for a period of greater than 12 months |
57 | 50 | 49 | |||||||||
| Total |
75 | 62 | 53 | |||||||||
72
Of the 57 projects that have exploratory well costs capitalized for a period greater than 12 months as of December 31, 2009, 29 projects have drilling in the preceding 12 months or exploratory activity planned in the next two years, while the remaining 28 projects are those with completed exploratory activity progressing toward development. The table below provides additional detail for those 28 projects, which total $497 million.
| Country/Project | Dec. 31, 2009 |
Years Wells Drilled |
Comment | |||
| (millions of dollars) |
||||||
| Australia |
||||||
| – East Pilchard |
$9 | 2001 | Gas field near Kipper/Tuna development, awaiting capacity in existing/planned infrastructure. | |||
| Canada |
||||||
| – Hibernia |
34 | 2006 | Progressing development plan and regulatory approvals for tieback to Hibernia gravity-based structure. | |||
| Indonesia |
||||||
| – Natuna |
118 | 1981 - 1983 | Development activity under way, while continuing discussions with the government on contract terms. | |||
| Kazakhstan |
||||||
| – Kairan |
53 | 2004 - 2007 | Declarations involving field commerciality filed with Kazakhstan government in 2008; progressing commercialization and field development studies. | |||
| Nigeria |
||||||
| – Bolia |
15 | 2002 - 2006 | Evaluating development plan, while continuing discussions with the government regarding regional hub strategy. | |||
| – Etoro-Isobo |
9 | 2002 | Offshore satellite development which will tie back to a planned production facility. | |||
| – Other (5 projects) |
16 | 2001 - 2002 | Pursuing development of several additional offshore satellite discoveries which will tie back to existing/planned production facilities. | |||
| Norway |
||||||
| – H-North |
16 | 2007 | Discovery near existing facilities in Fram area; evaluating development options. | |||
| – Njord |
33 | 2000 - 2008 | Evaluating development plan to integrate resource into existing production facilities. | |||
| – Noatun |
19 | 2008 | Evaluating development plan for tieback to existing production facilities. | |||
| – Nyk High |
20 | 2008 | Evaluating field development alternatives. | |||
| – Other (3 projects) |
16 | 1992 - 2008 | Evaluating development plans, including potential for tieback to existing production facilities. | |||
| Papua New Guinea |
||||||
| – Juha |
28 | 2007 | Working on development plans to tie into planned LNG facilities. | |||
| United Kingdom |
||||||
| – Carrack West |
6 | 2001 | Planned tieback to Carrack production facility; awaiting capacity. | |||
| – Phyllis |
8 | 2004 | Progressing unitization and joint development with nearby Barbara discovery. | |||
| United States |
||||||
| – Julia Unit |
78 | 2007 - 2008 | Julia Unit owners are progressing development plans and have agreed to share funding on facilities at the Chevron-operated Jack-Saint Malo platform. Suspension of Production for the Julia Unit is under review by the Minerals Management Service. | |||
| Other |
||||||
| – Various (6 projects) |
19 | 1979 - 2008 | Projects primarily awaiting capacity in existing or planned infrastructure. | |||
| Total (28 projects) |
$497 | |||||
73
NOTES TO CONSOLIDATED FINANCIAL STATEMENTS
At December 31, 2009, the Corporation and its consolidated subsidiaries held noncancelable operating charters and leases covering drilling equipment, tankers, service stations and other properties with minimum undiscounted lease commitments totaling $10,365 million as indicated in the table. Estimated related rental income from noncancelable subleases is $128 million.
| Lease Payments Under Minimum Commitments |
Related Sublease Rental Income | |||||
| (millions of dollars) | ||||||
| 2010 |
$ | 2,444 | $ | 16 | ||
| 2011 |
2,216 | 14 | ||||
| 2012 |
1,602 | 13 | ||||
| 2013 |
994 | 12 | ||||
| 2014 |
749 | 11 | ||||
| 2015 and beyond |
2,360 | 62 | ||||
| Total |
$ | 10,365 | $ | 128 | ||
Net rental cost under both cancelable and noncancelable operating leases incurred during 2009, 2008 and 2007 were as follows:
| 2009 |
2008 |
2007 | |||||||
| (millions of dollars) | |||||||||
| Rental cost |
$ | 4,426 | $ | 4,115 | $ | 3,367 | |||
| Less sublease rental income |
98 | 123 | 168 | ||||||
| Net rental cost |
$ | 4,328 | $ | 3,992 | $ | 3,199 | |||
| 2009 |
2008 |
2007 | |||||||
| Earnings per common share | |||||||||
| Net income attributable to ExxonMobil (millions of dollars) |
$ | 19,280 | $ | 45,220 | $ | 40,610 | |||
| Weighted average number of common shares outstanding (millions of shares) |
4,832 | 5,194 | 5,557 | ||||||
| Earnings per common share (dollars) |
$ | 3.99 | $ | 8.70 | $ | 7.31 | |||
| Earnings per common share – assuming dilution | |||||||||
| Net income attributable to ExxonMobil (millions of dollars) |
$ | 19,280 | $ | 45,220 | $ | 40,610 | |||
| Weighted average number of common shares outstanding (millions of shares) |
4,832 | 5,194 | 5,557 | ||||||
| Effect of employee stock-based awards |
16 | 27 | 37 | ||||||
| Weighted average number of common shares outstanding – assuming dilution |
4,848 | 5,221 | 5,594 | ||||||
| Earnings per common share – assuming dilution (dollars) |
$ | 3.98 | $ | 8.66 | $ | 7.26 | |||
| Dividends paid per common share (dollars) |
$ | 1.66 | $ | 1.55 | $ | 1.37 | |||
74
12. Financial Instruments and Derivatives
The fair value of financial instruments is determined by reference to various market data and other valuation techniques as appropriate. The estimated fair value of total long-term debt, including capitalized lease obligations, at December 31, 2009, and 2008, was $7.7 billion and $7.6 billion, respectively, as compared to recorded book values of $7.1 billion and $7.0 billion. The fair value hierarchy for long-term debt is primarily Level 2 (observable input).
The Corporation’s size, strong capital structure, geographic diversity and the complementary nature of the Upstream, Downstream and Chemical businesses reduce the Corporation’s enterprise-wide risk from changes in interest rates, currency rates and commodity prices. As a result, the Corporation makes limited use of derivatives to mitigate the impact of such changes. The Corporation does not engage in speculative derivative activities or derivative trading activities nor does it use derivatives with leveraged features. The Corporation maintains a system of controls that includes the authorization, reporting and monitoring of derivative activity. The Corporation’s limited derivative activities pose no material credit or market risks to ExxonMobil’s operations, financial condition or liquidity.
The estimated fair value of derivatives outstanding and recorded on the balance sheet was a net payable of $5 million at year-end 2009 and a net receivable of $118 million at year-end 2008. This is the amount that the Corporation would have paid to, or received from, third parties if these derivatives had been settled in the open market. The Corporation recognized a before-tax loss of $60 million and a before-tax gain of $89 million and $66 million related to derivatives during 2009, 2008 and 2007, respectively.
The fair value of derivatives outstanding at year-end 2009 and loss recognized during the year are immaterial in relation to the Corporation’s year-end cash balance of $10.7 billion, total assets of $233.3 billion or net income for the year of $19.3 billion.
At December 31, 2009, long-term debt consisted of $6,865 million due in U.S. dollars and $264 million representing the U.S. dollar equivalent at year-end exchange rates of amounts payable in foreign currencies. These amounts exclude that portion of long-term debt, totaling $348 million, which matures within one year and is included in current liabilities. The amounts of long-term debt maturing, together with sinking fund payments required, in each of the four years after December 31, 2010, in millions of dollars, are: 2011 – $344, 2012 – $2,725, 2013 – $160 and 2014 – $302. At December 31, 2009, the Corporation’s unused long-term credit lines were not material.
Summarized long-term debt at year-end 2009 and 2008 are shown in the table below:
| 2009 |
2008 | |||||
| (millions of dollars) | ||||||
| SeaRiver Maritime Financial Holdings, Inc. (1) |
||||||
| Guaranteed debt securities due 2010-2011 (2) |
$ | 13 | $ | 26 | ||
| Guaranteed deferred interest debentures due 2012 |
||||||
| – Face value net of unamortized discount plus accrued interest |
2,144 | 1,925 | ||||
| Mobil Services (Bahamas) Ltd. |
||||||
| Variable notes due 2035 (3) |
972 | 972 | ||||
| Variable notes due 2034 (4) |
311 | 311 | ||||
| Mobil Producing Nigeria Unlimited (5) |
||||||
| Variable notes due 2010-2016 |
621 | 597 | ||||
| Esso (Thailand) Public Company Ltd. (6) |
||||||
| Variable note due 2010-2012 |
165 | 236 | ||||
| Mobil Corporation |
||||||
| 8.625% debentures due 2021 |
248 | 248 | ||||
| Industrial revenue bonds due 2012-2039 (7) |
1,685 | 1,690 | ||||
| Other U.S. dollar obligations (8) |
536 | 546 | ||||
| Other foreign currency obligations |
66 | 94 | ||||
| Capitalized lease obligations (9) |
368 | 380 | ||||
| Total long-term debt |
$ | 7,129 | $ | 7,025 | ||
| (1) | Additional information is provided for this subsidiary on the following pages. |
| (2) | Average effective interest rate of 1.6% in 2009 and 3.1% in 2008. |
| (3) | Average effective interest rate of 0.3% in 2009 and 2.9% in 2008. |
| (4) | Average effective interest rate of 0.9% in 2009 and 3.6% in 2008. |
| (5) | Average effective interest rate of 5.4% in 2009 and 7.4% in 2008. |
| (6) | Average effective interest rate of 2.2% in 2009 and 4.3% in 2008. |
| (7) | Average effective interest rate of 0.2% in 2009 and 2.0% in 2008. |
| (8) | Average effective interest rate of 5.0% in 2009 and 5.7% in 2008. |
| (9) | Average imputed interest rate of 8.8% in 2009 and 8.7% in 2008. |
75
NOTES TO CONSOLIDATED FINANCIAL STATEMENTS
Condensed consolidating financial information related to guaranteed securities issued by subsidiaries
Exxon Mobil Corporation has fully and unconditionally guaranteed the deferred interest debentures due 2012 ($2,144 million long-term debt at December 31, 2009) and the debt securities due 2010 and 2011 ($13 million long-term and $13 million short-term) of SeaRiver Maritime Financial Holdings, Inc.
SeaRiver Maritime Financial Holdings, Inc. is a 100-percent-owned subsidiary of Exxon Mobil Corporation.
The following condensed consolidating financial information is provided for Exxon Mobil Corporation, as guarantor, and for SeaRiver Maritime Financial Holdings, Inc., as issuer, as an alternative to providing separate financial statements for the issuer. The accounts of Exxon Mobil Corporation and SeaRiver Maritime Financial Holdings, Inc. are presented utilizing the equity method of accounting for investments in subsidiaries.
| Exxon Mobil Corporation Parent Guarantor |
SeaRiver Maritime Financial Holdings, Inc. |
All Other Subsidiaries |
Consolidating and Eliminating Adjustments |
Consolidated | ||||||||||||||
| (millions of dollars) | ||||||||||||||||||
| Condensed consolidated statement of income for 12 months ended December 31, 2009 |
|
|||||||||||||||||
| Revenues and other income |
||||||||||||||||||
| Sales and other operating revenue, including sales-based taxes |
$ | 11,352 | $ | — | $ | 290,148 | $ | — | $ | 301,500 | ||||||||
| Income from equity affiliates |
19,852 | 7 | 7,060 | (19,776 | ) | 7,143 | ||||||||||||
| Other income |
813 | — | 1,130 | — | 1,943 | |||||||||||||
| Intercompany revenue |
30,889 | 4 | 271,663 | (302,556 | ) | — | ||||||||||||
| Total revenues and other income |
62,906 | 11 | 570,001 | (322,332 | ) | 310,586 | ||||||||||||
| Costs and other deductions |
||||||||||||||||||
| Crude oil and product purchases |
31,419 | — | 411,689 | (290,302 | ) | 152,806 | ||||||||||||
| Production and manufacturing expenses |
7,811 | — | 30,805 | (5,589 | ) | 33,027 | ||||||||||||
| Selling, general and administrative expenses |
2,574 | — | 12,852 | (691 | ) | 14,735 | ||||||||||||
| Depreciation and depletion |
1,571 | — | 10,346 | — | 11,917 | |||||||||||||
| Exploration expenses, including dry holes |
230 | — | 1,791 | — | 2,021 | |||||||||||||
| Interest expense |
1,200 | 222 | 5,126 | (6,000 | ) | 548 | ||||||||||||
| Sales-based taxes |
— | — | 25,936 | — | 25,936 | |||||||||||||
| Other taxes and duties |
(29 | ) | — | 34,848 | — | 34,819 | ||||||||||||
| Total costs and other deductions |
44,776 | 222 | 533,393 | (302,582 | ) | 275,809 | ||||||||||||
| Income before income taxes |
18,130 | (211 | ) | 36,608 | (19,750 | ) | 34,777 | |||||||||||
| Income taxes |
(1,150 | ) | (81 | ) | 16,350 | — | 15,119 | |||||||||||
| Net income including noncontrolling interests |
19,280 | (130 | ) | 20,258 | (19,750 | ) | 19,658 | |||||||||||
| Net income attributable to noncontrolling interests |
— | — | 378 | — | 378 | |||||||||||||
| Net income attributable to ExxonMobil |
$ | 19,280 | $ | (130 | ) | $ | 19,880 | $ | (19,750 | ) | $ | 19,280 | ||||||
76
| Exxon Mobil Corporation Parent Guarantor |
SeaRiver Maritime Financial Holdings, Inc. |
All Other Subsidiaries |
Consolidating and Eliminating Adjustments |
Consolidated | |||||||||||||
| (millions of dollars) | |||||||||||||||||
| Condensed consolidated statement of income for 12 months ended December 31, 2008 |
|||||||||||||||||
| Revenues and other income |
|||||||||||||||||
| Sales and other operating revenue, including sales-based taxes |
$ | 17,481 | $ | — | $ | 442,098 | $ | — | $ | 459,579 | |||||||
| Income from equity affiliates |
45,664 | 9 | 11,055 | (45,647 | ) | 11,081 | |||||||||||
| Other income |
302 | — | 6,397 | — | 6,699 | ||||||||||||
| Intercompany revenue |
48,414 | 45 | 442,305 | (490,764 | ) | — | |||||||||||
| Total revenues and other income |
111,861 | 54 | 901,855 | (536,411 | ) | 477,359 | |||||||||||
| Costs and other deductions |
|||||||||||||||||
| Crude oil and product purchases |
48,346 | — | 669,107 | (467,999 | ) | 249,454 | |||||||||||
| Production and manufacturing expenses |
8,327 | — | 35,298 | (5,720 | ) | 37,905 | |||||||||||
| Selling, general and administrative expenses |
3,349 | — | 13,364 | (840 | ) | 15,873 | |||||||||||
| Depreciation and depletion |
1,552 | — | 10,827 | — | 12,379 | ||||||||||||
| Exploration expenses, including dry holes |
192 | — | 1,259 | — | 1,451 | ||||||||||||
| Interest expense |
3,859 | 207 | 13,143 | (16,536 | ) | 673 | |||||||||||
| Sales-based taxes |
— | — | 34,508 | — | 34,508 | ||||||||||||
| Other taxes and duties |
67 | — | 41,652 | — | 41,719 | ||||||||||||
| Total costs and other deductions |
65,692 | 207 | 819,158 | (491,095 | ) | 393,962 | |||||||||||
| Income before income taxes |
46,169 | (153 | ) | 82,697 | (45,316 | ) | 83,397 | ||||||||||
| Income taxes |
949 | (56 | ) | 35,637 | — | 36,530 | |||||||||||
| Net income including noncontrolling interests |
45,220 | (97 | ) | 47,060 | (45,316 | ) | 46,867 | ||||||||||
| Net income attributable to noncontrolling interests |
— | — | 1,647 | — | 1,647 | ||||||||||||
| Net income attributable to ExxonMobil |
$ | 45,220 | $ | (97 | ) | $ | 45,413 | $ | (45,316 | ) | $ | 45,220 | |||||
| Condensed consolidated statement of income for 12 months ended December 31, 2007 |
|||||||||||||||||
| Revenues and other income |
|||||||||||||||||
| Sales and other operating revenue, including sales-based taxes |
$ | 16,502 | $ | — | $ | 373,826 | $ | — | $ | 390,328 | |||||||
| Income from equity affiliates |
40,800 | 4 | 8,859 | (40,762 | ) | 8,901 | |||||||||||
| Other income |
488 | — | 4,835 | — | 5,323 | ||||||||||||
| Intercompany revenue |
39,490 | 101 | 361,263 | (400,854 | ) | — | |||||||||||
| Total revenues and other income |
97,280 | 105 | 748,783 | (441,616 | ) | 404,552 | |||||||||||
| Costs and other deductions |
|||||||||||||||||
| Crude oil and product purchases |
38,260 | — | 535,973 | (374,735 | ) | 199,498 | |||||||||||
| Production and manufacturing expenses |
7,147 | — | 30,003 | (5,265 | ) | 31,885 | |||||||||||
| Selling, general and administrative expenses |
2,581 | — | 13,116 | (807 | ) | 14,890 | |||||||||||
| Depreciation and depletion |
1,661 | — | 10,589 | — | 12,250 | ||||||||||||
| Exploration expenses, including dry holes |
276 | — | 1,193 | — | 1,469 | ||||||||||||
| Interest expense |
5,997 | 201 | 14,601 | (20,399 | ) | 400 | |||||||||||
| Sales-based taxes |
— | — | 31,728 | — | 31,728 | ||||||||||||
| Other taxes and duties |
48 | — | 40,905 | — | 40,953 | ||||||||||||
| Total costs and other deductions |
55,970 | 201 | 678,108 | (401,206 | ) | 333,073 | |||||||||||
| Income before income taxes |
41,310 | (96 | ) | 70,675 | (40,410 | ) | 71,479 | ||||||||||
| Income taxes |
700 | (34 | ) | 29,198 | — | 29,864 | |||||||||||
| Net income including noncontrolling interests |
40,610 | (62 | ) | 41,477 | (40,410 | ) | 41,615 | ||||||||||
| Net income attributable to noncontrolling interests |
— | — | 1,005 | — | 1,005 | ||||||||||||
| Net income attributable to ExxonMobil |
$ | 40,610 | $ | (62 | ) | $ | 40,472 | $ | (40,410 | ) | $ | 40,610 | |||||
77
NOTES TO CONSOLIDATED FINANCIAL STATEMENTS
Condensed consolidating financial information related to guaranteed securities issued by subsidiaries
| Exxon Mobil Corporation Parent Guarantor |
SeaRiver Maritime Financial Holdings, Inc. |
All Other Subsidiaries |
Consolidating and Eliminating Adjustments |
Consolidated |
|||||||||||||||
| (millions of dollars) | |||||||||||||||||||
| Condensed consolidated balance sheet for year ended December 31, 2009 |
|||||||||||||||||||
| Cash and cash equivalents |
$ | 449 | $ | — | $ | 10,244 | $ | — | $ | 10,693 | |||||||||
| Marketable securities |
— | — | 169 | — | 169 | ||||||||||||||
| Notes and accounts receivable – net |
2,050 | — | 25,858 | (263 | ) | 27,645 | |||||||||||||
| Inventories |
1,202 | — | 10,351 | — | 11,553 | ||||||||||||||
| Other current assets |
313 | — | 4,862 | — | 5,175 | ||||||||||||||
| Total current assets |
4,014 | — | 51,484 | (263 | ) | 55,235 | |||||||||||||
| Investments, advances and long-term receivables |
199,110 | 449 | 439,712 | (607,606 | ) | 31,665 | |||||||||||||
| Property, plant and equipment – net |
18,015 | — | 121,101 | — | 139,116 | ||||||||||||||
| Other long-term assets |
207 | 24 | 7,076 | — | 7,307 | ||||||||||||||
| Intercompany receivables |
19,637 | 2,257 | 442,903 | (464,797 | ) | — | |||||||||||||
| Total assets |
$ | 240,983 | $ | 2,730 | $ | 1,062,276 | $ | (1,072,666 | ) | $ | 233,323 | ||||||||
| Notes and loans payable |
$ | 43 | $ | 13 | $ | 2,420 | $ | — | $ | 2,476 | |||||||||
| Accounts payable and accrued liabilities |
2,779 | — | 38,496 | — | 41,275 | ||||||||||||||
| Income taxes payable |
— | 2 | 8,571 | (263 | ) | 8,310 | |||||||||||||
| Total current liabilities |
2,822 | 15 | 49,487 | (263 | ) | 52,061 | |||||||||||||
| Long-term debt |
279 | 2,157 | 4,693 | — | 7,129 | ||||||||||||||
| Postretirement benefits reserves |
8,673 | — | 9,269 | — | 17,942 | ||||||||||||||
| Deferred income tax liabilities |
818 | 151 | 22,179 | — | 23,148 | ||||||||||||||
| Other long-term liabilities |
5,286 | — | 12,365 | — | 17,651 | ||||||||||||||
| Intercompany payables |
112,536 | 382 | 351,879 | (464,797 | ) | — | |||||||||||||
| Total liabilities |
130,414 | 2,705 | 449,872 | (465,060 | ) | 117,931 | |||||||||||||
| Earnings reinvested |
276,937 | (694 | ) | 109,603 | (108,909 | ) | 276,937 | ||||||||||||
| Other equity |
(166,368 | ) | 719 | 497,978 | (498,697 | ) | (166,368 | ) | |||||||||||
| ExxonMobil share of equity |
110,569 | 25 | 607,581 | (607,606 | ) | 110,569 | |||||||||||||
| Noncontrolling interests |
— | — | 4,823 | — | 4,823 | ||||||||||||||
| Total equity |
110,569 | 25 | 612,404 | (607,606 | ) | 115,392 | |||||||||||||
| Total liabilities and equity |
$ | 240,983 | $ | 2,730 | $ | 1,062,276 | $ | (1,072,666 | ) | $ | 233,323 | ||||||||
| Condensed consolidated balance sheet for year ended December 31, 2008 |
|||||||||||||||||||
| Cash and cash equivalents |
$ | 4,011 | $ | — | $ | 27,426 | $ | — | $ | 31,437 | |||||||||
| Marketable securities |
— | — | 570 | — | 570 | ||||||||||||||
| Notes and accounts receivable – net |
2,486 | 3 | 23,224 | (1,011 | ) | 24,702 | |||||||||||||
| Inventories |
1,253 | — | 10,393 | — | 11,646 | ||||||||||||||
| Other current assets |
348 | — | 3,563 | — | 3,911 | ||||||||||||||
| Total current assets |
8,098 | 3 | 65,176 | (1,011 | ) | 72,266 | |||||||||||||
| Investments, advances and long-term receivables |
202,257 | 432 | 450,604 | (624,737 | ) | 28,556 | |||||||||||||
| Property, plant and equipment – net |
16,939 | — | 104,407 | — | 121,346 | ||||||||||||||
| Other long-term assets |
214 | 37 | 5,633 | — | 5,884 | ||||||||||||||
| Intercompany receivables |
10,026 | 2,057 | 432,902 | (444,985 | ) | — | |||||||||||||
| Total assets |
$ | 237,534 | $ | 2,529 | $ | 1,058,722 | $ | (1,070,733 | ) | $ | 228,052 | ||||||||
| Notes and loans payable |
$ | 7 | $ | 13 | $ | 2,380 | $ | — | $ | 2,400 | |||||||||
| Accounts payable and accrued liabilities |
3,352 | — | 33,291 | — | 36,643 | ||||||||||||||
| Income taxes payable |
— | — | 11,068 | (1,011 | ) | 10,057 | |||||||||||||
| Total current liabilities |
3,359 | 13 | 46,739 | (1,011 | ) | 49,100 | |||||||||||||
| Long-term debt |
279 | 1,951 | 4,795 | — | 7,025 | ||||||||||||||
| Postretirement benefits reserves |
11,653 | — | 9,076 | — | 20,729 | ||||||||||||||
| Deferred income tax liabilities |
120 | 178 | 19,428 | — | 19,726 | ||||||||||||||
| Other long-term liabilities |
5,175 | — | 8,774 | — | 13,949 | ||||||||||||||
| Intercompany payables |
103,983 | 382 | 340,620 | (444,985 | ) | — | |||||||||||||
| Total liabilities |
124,569 | 2,524 | 429,432 | (445,996 | ) | 110,529 | |||||||||||||
| Earnings reinvested |
265,680 | (564 | ) | 116,805 | (116,241 | ) | 265,680 | ||||||||||||
| Other equity |
(152,715 | ) | 569 | 507,927 | (508,496 | ) | (152,715 | ) | |||||||||||
| ExxonMobil share of equity |
112,965 | 5 | 624,732 | (624,737 | ) | 112,965 | |||||||||||||
| Noncontrolling interests |
— | — | 4,558 | — | 4,558 | ||||||||||||||
| Total equity |
112,965 | 5 | 629,290 | (624,737 | ) | 117,523 | |||||||||||||
| Total liabilities and equity |
$ | 237,534 | $ | 2,529 | $ | 1,058,722 | $ | (1,070,733 | ) | $ | 228,052 | ||||||||
78
| Exxon Mobil Corporation Parent Guarantor |
SeaRiver Maritime Financial Holdings, Inc. |
All Other Subsidiaries |
Consolidating and Eliminating Adjustments |
Consolidated |
||||||||||||||||
| (millions of dollars) | ||||||||||||||||||||
| Condensed consolidated statement of cash flows for 12 months ended December 31, 2009 |
|
|||||||||||||||||||
| Cash provided by/(used in) operating activities |
$ | 27,424 | $ | 72 | $ | 28,024 | $ | (27,082 | ) | $ | 28,438 | |||||||||
| Cash flows from investing activities |
||||||||||||||||||||
| Additions to property, plant and equipment |
(2,686 | ) | — | (19,805 | ) | — | (22,491 | ) | ||||||||||||
| Sales of long-term assets |
228 | — | 1,317 | — | 1,545 | |||||||||||||||
| Decrease/(increase) in restricted cash and cash equivalents |
— | — | — | — | — | |||||||||||||||
| Net intercompany investing |
(1,826 | ) | (209 | ) | 1,717 | 318 | — | |||||||||||||
| All other investing, net |
— | — | (1,473 | ) | — | (1,473 | ) | |||||||||||||
| Net cash provided by/(used in) investing activities |
(4,284 | ) | (209 | ) | (18,244 | ) | 318 | (22,419 | ) | |||||||||||
| Cash flows from financing activities |
||||||||||||||||||||
| Additions to short- and long-term debt |
— | — | 1,561 | — | 1,561 | |||||||||||||||
| Reductions in short- and long-term debt |
(3 | ) | (13 | ) | (1,627 | ) | — | (1,643 | ) | |||||||||||
| Additions/(reductions) in debt with three months or less maturity |
39 | — | (110 | ) | — | (71 | ) | |||||||||||||
| Cash dividends |
(8,023 | ) | — | (27,082 | ) | 27,082 | (8,023 | ) | ||||||||||||
| Common stock acquired |
(19,703 | ) | — | — | — | (19,703 | ) | |||||||||||||
| Net intercompany financing activity |
— | — | 168 | (168 | ) | — | ||||||||||||||
| All other financing, net |
988 | 150 | (392 | ) | (150 | ) | 596 | |||||||||||||
| Net cash provided by/(used in) financing activities |
(26,702 | ) | 137 | (27,482 | ) | 26,764 | (27,283 | ) | ||||||||||||
| Effects of exchange rate changes on cash |
— | — | 520 | — | 520 | |||||||||||||||
| Increase/(decrease) in cash and cash equivalents |
$ | (3,562 | ) | $ | — | $ | (17,182 | ) | $ | — | $ | (20,744 | ) | |||||||
| Condensed consolidated statement of cash flows for 12 months ended December 31, 2008 |
|
|||||||||||||||||||
| Cash provided by/(used in) operating activities |
$ | 47,823 | $ | 68 | $ | 54,478 | $ | (42,644 | ) | $ | 59,725 | |||||||||
| Cash flows from investing activities |
||||||||||||||||||||
| Additions to property, plant and equipment |
(2,154 | ) | — | (17,164 | ) | — | (19,318 | ) | ||||||||||||
| Sales of long-term assets |
162 | — | 5,823 | — | 5,985 | |||||||||||||||
| Decrease/(increase) in restricted cash and cash equivalents |
— | — | — | — | — | |||||||||||||||
| Net intercompany investing |
(502 | ) | (155 | ) | 476 | 181 | — | |||||||||||||
| All other investing, net |
— | — | (2,166 | ) | — | (2,166 | ) | |||||||||||||
| Net cash provided by/(used in) investing activities |
(2,494 | ) | (155 | ) | (13,031 | ) | 181 | (15,499 | ) | |||||||||||
| Cash flows from financing activities |
||||||||||||||||||||
| Additions to short- and long-term debt |
— | — | 1,146 | — | 1,146 | |||||||||||||||
| Reductions in short- and long-term debt |
(4 | ) | (13 | ) | (1,799 | ) | — | (1,816 | ) | |||||||||||
| Additions/(reductions) in debt with three months or less maturity |
— | — | 143 | — | 143 | |||||||||||||||
| Cash dividends |
(8,058 | ) | — | (42,644 | ) | 42,644 | (8,058 | ) | ||||||||||||
| Common stock acquired |
(35,734 | ) | — | — | — | (35,734 | ) | |||||||||||||
| Net intercompany financing activity |
— | — | 81 | (81 | ) | — | ||||||||||||||
| All other financing, net |
1,085 | 100 | (793 | ) | (100 | ) | 292 | |||||||||||||
| Net cash provided by/(used in) financing activities |
(42,711 | ) | 87 | (43,866 | ) | 42,463 | (44,027 | ) | ||||||||||||
| Effects of exchange rate changes on cash |
— | — | (2,743 | ) | — | (2,743 | ) | |||||||||||||
| Increase/(decrease) in cash and cash equivalents |
$ | 2,618 | $ | — | $ | (5,162 | ) | $ | — | $ | (2,544 | ) | ||||||||
79
NOTES TO CONSOLIDATED FINANCIAL STATEMENTS
Condensed consolidating financial information related to guaranteed securities issued by subsidiaries
| Exxon Mobil Corporation Parent Guarantor |
SeaRiver Maritime Financial Holdings, Inc. |
All Other Subsidiaries |
Consolidating and Eliminating Adjustments |
Consolidated |
||||||||||||||||
| (millions of dollars) | ||||||||||||||||||||
| Condensed consolidated statement of cash flows for 12 months ended December 31, 2007 |
|
|||||||||||||||||||
| Cash provided by/(used in) operating activities |
$ | 73,813 | $ | 97 | $ | 49,185 | $ | (71,093 | ) | $ | 52,002 | |||||||||
| Cash flows from investing activities |
||||||||||||||||||||
| Additions to property, plant and equipment |
(1,252 | ) | — | (14,135 | ) | — | (15,387 | ) | ||||||||||||
| Sales of long-term assets |
251 | — | 3,953 | — | 4,204 | |||||||||||||||
| Decrease/(increase) in restricted cash and cash equivalents |
— | — | 4,604 | — | 4,604 | |||||||||||||||
| Net intercompany investing |
(39,679 | ) | (79 | ) | 39,676 | 82 | — | |||||||||||||
| All other investing, net |
— | — | (3,149 | ) | — | (3,149 | ) | |||||||||||||
| Net cash provided by/(used in) investing activities |
(40,680 | ) | (79 | ) | 30,949 | 82 | (9,728 | ) | ||||||||||||
| Cash flows from financing activities |
||||||||||||||||||||
| Additions to short- and long-term debt |
— | — | 1,803 | — | 1,803 | |||||||||||||||
| Reductions in short- and long-term debt |
(3 | ) | (13 | ) | (1,002 | ) | — | (1,018 | ) | |||||||||||
| Additions/(reductions) in debt with three months or less maturity |
(97 | ) | — | (90 | ) | — | (187 | ) | ||||||||||||
| Cash dividends |
(7,621 | ) | — | (71,093 | ) | 71,093 | (7,621 | ) | ||||||||||||
| Common stock acquired |
(31,822 | ) | — | — | — | (31,822 | ) | |||||||||||||
| Net intercompany financing activity |
— | (5 | ) | 87 | (82 | ) | — | |||||||||||||
| All other financing, net |
1,448 | — | (948 | ) | — | 500 | ||||||||||||||
| Net cash provided by/(used in) financing activities |
(38,095 | ) | (18 | ) | (71,243 | ) | 71,011 | (38,345 | ) | |||||||||||
| Effects of exchange rate changes on cash |
— | — | 1,808 | — | 1,808 | |||||||||||||||
| Increase/(decrease) in cash and cash equivalents |
$ | (4,962 | ) | $ | — | $ | 10,699 | $ | — | $ | 5,737 | |||||||||
The 2003 Incentive Program provides for grants of stock options, stock appreciation rights (SARs), restricted stock and other forms of award. Awards may be granted to eligible employees of the Corporation and those affiliates at least 50 percent owned. Outstanding awards are subject to certain forfeiture provisions contained in the program or award instrument. The maximum number of shares of stock that may be issued under the 2003 Incentive Program is 220 million. Awards that are forfeited or expire, or are settled in cash, do not count against this maximum limit. The 2003 Incentive Program does not have a specified term. New awards may be made until the available shares are depleted, unless the Board terminates the plan early. At the end of 2009, remaining shares available for award under the 2003 Incentive Program were 152,591 thousand.
As under earlier programs, options and SARs may be granted at prices not less than 100 percent of market value on the date of grant and have a maximum life of 10 years. Most of the options and SARs normally first become exercisable one year following the date of grant. All remaining stock options and SARs outstanding were granted prior to 2002.
Long-term incentive awards totaling 10,133 thousand, 10,116 thousand and 10,226 thousand of restricted (nonvested) common stock and restricted (nonvested) common stock units were granted in 2009, 2008 and 2007, respectively. These shares are issued to employees from treasury stock. The total compensation expense is recognized over the requisite service period. The units that are settled in cash are recorded as liabilities and their changes in fair value are recognized over the vesting period. During the applicable restricted periods, the shares may not be sold or transferred and are subject to forfeiture. The majority of the awards have graded vesting periods, with 50 percent of the shares in each award vesting after three years and the remaining 50 percent vesting after seven years. A small number of awards granted to certain senior executives have vesting periods of five years for 50 percent of the award and of 10 years or retirement, whichever occurs later, for the remaining 50 percent of the award.
80
The Corporation has purchased shares in the open market and through negotiated transactions to offset shares issued in conjunction with benefit plans and programs. Purchases may be discontinued at any time without prior notice.
In 2002, the Corporation began issuing restricted stock as share-based compensation in lieu of stock options. Compensation expense for these awards is based on the price of the stock at the date of grant and has been recognized in income over the requisite service period. Prior to 2002, the Corporation issued stock options as share-based compensation and since these awards vested prior to the effective date of current authoritative guidance, they continue to be accounted for under the prior prescribed method. Under this method, compensation expense for awards granted in the form of stock options is measured at the intrinsic value of the options (the difference between the market price of the stock and the exercise price of the options) on the date of grant. Since these two prices were the same on the date of grant, no compensation expense has been recognized in income for these awards.
The following tables summarize information about restricted stock and restricted stock units for the year ended December 31, 2009.
| 2009 | ||||||
| Restricted stock and units outstanding |
Shares |
Weighted Average Grant-Date Fair Value per Share | ||||
| (thousands) | ||||||
| Issued and outstanding at January 1 |
43,701 | $ | 61.88 | |||
| 2008 award issued in 2009 |
10,109 | $ | 78.24 | |||
| Vested |
(10,229 | ) | $ | 54.03 | ||
| Forfeited |
(78 | ) | $ | 65.60 | ||
| Issued and outstanding at December 31 |
43,503 | $ | 67.52 | |||
| Grant value of restricted stock and units |
2009 |
2008 |
2007 | ||||||
| Grant price |
$ | 75.40 | $ | 78.24 | $ | 87.14 | |||
| (millions of dollars) | |||||||||
| Value at date of grant: |
|||||||||
| Restricted stock and units settled in stock |
$ | 711 | $ | 735 | $ | 827 | |||
| Units settled in cash |
53 | 56 | 64 | ||||||
| Total value |
$ | 764 | $ | 791 | $ | 891 | |||
As of December 31, 2009, there was $2,038 million of unrecognized compensation cost related to the nonvested restricted awards. This cost is expected to be recognized over a weighted-average period of 4.5 years. The compensation cost charged against income for the restricted stock and restricted units was $723 million, $648 million and $590 million for 2009, 2008 and 2007, respectively. The income tax benefit recognized in income related to this compensation expense was $76 million, $75 million and $81 million for the same periods, respectively. The fair value of shares and units vested in 2009, 2008 and 2007 was $763 million, $438 million and $581 million, respectively. Cash payments of $41 million, $25 million and $29 million for vested restricted stock units settled in cash were made in 2009, 2008 and 2007, respectively.
81
NOTES TO CONSOLIDATED FINANCIAL STATEMENTS
Changes that occurred in stock options in 2009 are summarized below (shares in thousands):
| 2009 |
Weighted Average Remaining Contractual Term | |||||||
| Stock options |
Shares |
Avg. Exercise Price |
||||||
| Outstanding at January 1 |
59,993 | $ | 40.90 | |||||
| Exercised |
(18,500 | ) | $ | 40.85 | ||||
| Forfeited |
(20 | ) | $ | 41.85 | ||||
| Outstanding at December 31 |
41,473 | $ | 40.92 | 1.4 Years | ||||
| Exercisable at December 31 |
41,473 | $ | 40.92 | 1.4 Years | ||||
No compensation expense was recognized for stock options in 2009, 2008 and 2007, as all remaining outstanding stock options were granted prior to 2002 and are fully vested. Cash received from stock option exercises was $752 million, $753 million and $1,079 million for 2009, 2008 and 2007, respectively. The cash tax benefit realized for the options exercised was $164 million, $273 million and $304 million for 2009, 2008 and 2007, respectively. The aggregate intrinsic value of stock options exercised in 2009, 2008 and 2007 was $563 million, $894 million and $1,359 million, respectively. The intrinsic value for the balance of outstanding stock options at December 31, 2009, was $1,131 million.
15. Litigation and Other Contingencies
Litigation
A variety of claims have been made against ExxonMobil and certain of its consolidated subsidiaries in a number of pending lawsuits. Management has regular litigation reviews, including updates from corporate and outside counsel, to assess the need for accounting recognition or disclosure of these contingencies. The Corporation accrues an undiscounted liability for those contingencies where the incurrence of a loss is probable and the amount can be reasonably estimated. If a range of amounts can be reasonably estimated and no amount within the range is a better estimate than any other amount, then the minimum of the range is accrued. The Corporation does not record liabilities when the likelihood that the liability has been incurred is probable but the amount cannot be reasonably estimated or when the liability is believed to be only reasonably possible or remote. For contingencies where an unfavorable outcome is reasonably possible and which are significant, the Corporation discloses the nature of the contingency and, where feasible, an estimate of the possible loss. ExxonMobil will continue to defend itself vigorously in these matters. Based on a consideration of all relevant facts and circumstances, the Corporation does not believe the ultimate outcome of any currently pending lawsuit against ExxonMobil will have a materially adverse effect upon the Corporation’s operations or financial condition.
A number of lawsuits, including class actions, were brought in various courts against Exxon Mobil Corporation and certain of its subsidiaries relating to the accidental release of crude oil from the tanker Exxon Valdez in 1989. All the compensatory claims and the punitive damage award have been paid.
82
Other Contingencies
The Corporation and certain of its consolidated subsidiaries were contingently liable at December 31, 2009, for $8,786 million, primarily relating to guarantees for notes, loans and performance under contracts. Included in this amount were guarantees by consolidated affiliates of $5,629 million, representing ExxonMobil’s share of obligations of certain equity companies.
| Dec. 31, 2009 | |||||||||
| Equity Company Obligations |
Other Third-Party Obligations |
Total | |||||||
| (millions of dollars) | |||||||||
| Total guarantees |
$ | 5,629 | $ | 3,157 | $ | 8,786 | |||
Additionally, the Corporation and its affiliates have numerous long-term sales and purchase commitments in their various business activities, all of which are expected to be fulfilled with no adverse consequences material to the Corporation’s operations or financial condition. Unconditional purchase obligations as defined by accounting standards are those long-term commitments that are noncancelable or cancelable only under certain conditions, and that third parties have used to secure financing for the facilities that will provide the contracted goods or services.
| Payments Due by Period | ||||||||||||
| 2010 |
2011- 2014 |
2015 and Beyond |
Total | |||||||||
| (millions of dollars) | ||||||||||||
| Unconditional purchase obligations (1) |
$ | 314 | $ | 902 | $ | 568 | $ | 1,784 | ||||
| (1) | Undiscounted obligations of $1,784 million mainly pertain to pipeline throughput agreements and include $1,141 million of obligations to equity companies. The present value of these commitments, which excludes imputed interest of $309 million, totaled $1,475 million. |
In accordance with a nationalization decree issued by Venezuela’s president in February 2007, by May 1, 2007, a subsidiary of the Venezuelan National Oil Company (PdVSA) assumed the operatorship of the Cerro Negro Heavy Oil Project. This Project had been operated and owned by ExxonMobil affiliates holding a 41.67 percent ownership interest in the Project. The decree also required conversion of the Cerro Negro Project into a “mixed enterprise” and an increase in PdVSA’s or one of its affiliate’s ownership interest in the Project, with the stipulation that if ExxonMobil refused to accept the terms for the formation of the mixed enterprise within a specified period of time, the government would “directly assume the activities” carried out by the joint venture. ExxonMobil refused to accede to the terms proffered by the government, and on June 27, 2007, the government expropriated ExxonMobil’s 41.67 percent interest in the Cerro Negro Project.
On September 6, 2007, affiliates of ExxonMobil filed a Request for Arbitration with the International Centre for Settlement of Investment Disputes. An affiliate of ExxonMobil has also filed an arbitration under the rules of the International Chamber of Commerce against PdVSA and a PdVSA affiliate for breach of their contractual obligations under certain Cerro Negro Project agreements. Both arbitration proceedings continue. At this time, the net impact of this matter on the Corporation’s consolidated financial results cannot be reasonably estimated. However, the Corporation does not expect the resolution to have a material effect upon the Corporation’s operations or financial condition. ExxonMobil’s remaining net book investment in Cerro Negro producing assets is about $750 million.
83
NOTES TO CONSOLIDATED FINANCIAL STATEMENTS
16. Pension and Other Postretirement Benefits
The benefit obligations and plan assets associated with the Corporation’s principal benefit plans are measured on December 31.
| Pension Benefits |
Other Postretirement Benefits |
|||||||||||||||||||||||
| U.S. |
Non-U.S. |
|||||||||||||||||||||||
| 2009 |
2008 |
2009 |
2008 |
2009 |
2008 |
|||||||||||||||||||
| (percent) | ||||||||||||||||||||||||
| Weighted-average assumptions used to determine benefit |
||||||||||||||||||||||||
| Discount rate |
6.00 | 6.25 | 5.20 | 5.50 | 6.00 | 6. 25 | ||||||||||||||||||
| Long-term rate of compensation increase |
5.00 | 5.00 | 5.00 | 4.70 | 5.00 | 5. 00 | ||||||||||||||||||
| (millions of dollars) | ||||||||||||||||||||||||
| Change in benefit obligation |
||||||||||||||||||||||||
| Benefit obligation at January 1 |
$ | 13,272 | $ | 12,062 | $ | 19,990 | $ | 22,475 | $ | 6,633 | $ | 6,828 | ||||||||||||
| Service cost |
438 | 378 | 421 | 434 | 94 | 100 | ||||||||||||||||||
| Interest cost |
809 | 729 | 1,121 | 1,152 | 408 | 414 | ||||||||||||||||||
| Actuarial loss/(gain) |
1,126 | 1,227 | 1,280 | 76 | (49 | ) | (243 | ) | ||||||||||||||||
| Benefits paid (1) (2) |
(1,665 | ) | (1,124 | ) | (1,174 | ) | (1,286 | ) | (480 | ) | (466 | ) | ||||||||||||
| Foreign exchange rate changes |
— | — | 1,676 | (2,682 | ) | 60 | (83 | ) | ||||||||||||||||
| Plan amendments, other |
1 | — | 30 | (179 | ) | 82 | 83 | |||||||||||||||||
| Benefit obligation at December 31 |
$ | 13,981 | $ | 13,272 | $ | 23,344 | $ | 19,990 | $ | 6,748 | $ | 6,633 | ||||||||||||
| Accumulated benefit obligation at December 31 |
$ | 11,615 | $ | 11,000 | $ | 20,909 | $ | 17,893 | $ | — | $ | — | ||||||||||||
| (1) | Benefit payments for funded and unfunded plans. |
| (2) | For 2009 and 2008, other postretirement benefits paid are net of $28 million and $26 million of Medicare subsidy receipts, respectively. |
For U.S. plans, the discount rate is determined by constructing a portfolio of high-quality, noncallable bonds with cash flows that match estimated outflows for benefit payments. For major non-U.S. plans, the discount rate is determined by using bond portfolios with an average maturity approximating that of the liabilities or spot yield curves, both of which are constructed using high-quality, local-currency-denominated bonds.
The measurement of the accumulated postretirement benefit obligation assumes an initial health care cost trend rate of 6.5 percent that declines to 4.5 percent by 2015. A one-percentage-point increase in the health care cost trend rate would increase service and interest cost by $50 million and the postretirement benefit obligation by $532 million. A one-percentage-point decrease in the health care cost trend rate would decrease service and interest cost by $40 million and the post-retirement benefit obligation by $442 million.
| Pension Benefits |
Other Postretirement Benefits |
|||||||||||||||||||||||
| U.S. |
Non-U.S. |
|||||||||||||||||||||||
| 2009 |
2008 |
2009 |
2008 |
2009 |
2008 |
|||||||||||||||||||
| (millions of dollars) | ||||||||||||||||||||||||
| Change in plan assets |
||||||||||||||||||||||||
| Fair value at January 1 |
$ | 6,634 | $ | 10,617 | $ | 11,260 | $ | 17,192 | $ | 443 | $ | 659 | ||||||||||||
| Actual return on plan assets |
2,013 | (3,133 | ) | 2,201 | (3,547 | ) | 93 | (197 | ) | |||||||||||||||
| Foreign exchange rate changes |
— | — | 1,300 | (2,321 | ) | — | — | |||||||||||||||||
| Company contribution |
3,070 | 52 | 1,456 | 956 | 36 | 38 | ||||||||||||||||||
| Benefits paid (1) |
(1,440 | ) | (902 | ) | (795 | ) | (860 | ) | (57 | ) | (57 | ) | ||||||||||||
| Other |
— | — | (21 | ) | (160 | ) | (1 | ) | — | |||||||||||||||
| Fair value at December 31 |
$ | 10,277 | $ | 6,634 | $ | 15,401 | $ | 11,260 | $ | 514 | $ | 443 | ||||||||||||
| (1) | Benefit payments for funded plans. |
84
The funding levels of all qualified pension plans are in compliance with standards set by applicable law or regulation. As shown in the table below, certain smaller U.S. pension plans and a number of non-U.S. pension plans are not funded because local tax conventions and regulatory practices do not encourage funding of these plans. All defined benefit pension obligations, regardless of the funding status of the underlying plans, are fully supported by the financial strength of the Corporation or the respective sponsoring affiliate.
| Pension Benefits |
||||||||||||||||
| U.S. |
Non-U.S. |
|||||||||||||||
| 2009 |
2008 |
2009 |
2008 |
|||||||||||||
| (millions of dollars) | ||||||||||||||||
| Assets in excess of/(less than) benefit obligation |
||||||||||||||||
| Balance at December 31 |
||||||||||||||||
| Funded plans |
$ | (1,940 | ) | $ | (5,049 | ) | $ | (2,085 | ) | $ | (3,416 | ) | ||||
| Unfunded plans |
(1,764 | ) | (1,589 | ) | (5,858 | ) | (5,314 | ) | ||||||||
| Total |
$ | (3,704 | ) | $ | (6,638 | ) | $ | (7,943 | ) | $ | (8,730 | ) | ||||
The authoritative guidance for defined benefit pension and other post-retirement plans requires an employer to recognize the overfunded or underfunded status of a defined benefit postretirement plan as an asset or liability in its statement of financial position and to recognize changes in that funded status in the year in which the changes occur through other comprehensive income.
| Pension Benefits |
Other Postretirement Benefits |
|||||||||||||||||||||||
| U.S. |
Non-U.S. |
|||||||||||||||||||||||
| 2009 |
2008 |
2009 |
2008 |
2009 |
2008 |
|||||||||||||||||||
| (millions of dollars) | ||||||||||||||||||||||||
| Assets in excess of/(less than) benefit obligation |
||||||||||||||||||||||||
| Balance at December 31 (1) |
$ | (3,704 | ) | $ | (6,638 | ) | $ | (7,943 | ) | $ | (8,730 | ) | $ | (6,234 | ) | $ | (6,190 | ) | ||||||
| Amounts recorded in the consolidated balance sheet consist of: |
||||||||||||||||||||||||
| Other assets |
$ | 1 | $ | 1 | $ | 961 | $ | 3 | $ | — | $ | — | ||||||||||||
| Current liabilities |
(235 | ) | (208 | ) | (348 | ) | (304 | ) | (318 | ) | (321 | ) | ||||||||||||
| Postretirement benefits reserves |
(3,470 | ) | (6,431 | ) | (8,556 | ) | (8,429 | ) | (5,916 | ) | (5,869 | ) | ||||||||||||
| Total recorded |
$ | (3,704 | ) | $ | (6,638 | ) | $ | (7,943 | ) | $ | (8,730 | ) | $ | (6,234 | ) | $ | (6,190 | ) | ||||||
| Amounts recorded in accumulated other comprehensive income consist of: |
||||||||||||||||||||||||
| Net actuarial loss/(gain) |
$ | 5,830 | $ | 7,240 | $ | 7,036 | $ | 7,161 | $ | 1,878 | $ | 2,159 | ||||||||||||
| Prior service cost |
5 | 5 | 622 | 582 | 181 | 250 | ||||||||||||||||||
| Total recorded in accumulated other comprehensive income |
$ | 5,835 | $ | 7,245 | $ | 7,658 | $ | 7,743 | $ | 2,059 | $ | 2,409 | ||||||||||||
| (1) | Fair value of assets less benefit obligation shown on the preceding page. |
85
NOTES TO CONSOLIDATED FINANCIAL STATEMENTS
The long-term expected rate of return on funded assets shown below is established for each benefit plan by developing a forward-looking, long-term return assumption for each asset class, taking into account factors such as the expected real return for the specific asset class and inflation.
A single, long-term rate of return is then calculated as the weighted average of the target asset allocation and the long-term return assumption for each asset class.
| Pension Benefits |
Other Postretirement Benefits |
|||||||||||||||||||||||||||||||||||
| U.S. |
Non-U.S. |
|||||||||||||||||||||||||||||||||||
| 2009 |
2008 |
2007 |
2009 |
2008 |
2007 |
2009 |
2008 |
2007 |
||||||||||||||||||||||||||||
| (percent) | ||||||||||||||||||||||||||||||||||||
| Weighted-average assumptions used to determine net periodic benefit cost for years ended December 31 |
||||||||||||||||||||||||||||||||||||
| Discount rate |
6.25 | 6.25 | 6.00 | 5.50 | 5.40 | 4.70 | 6.25 | 6.25 | 6.00 | |||||||||||||||||||||||||||
| Long-term rate of return on funded assets |
8.00 | 9.00 | 9.00 | 7.30 | 7.50 | 7.70 | 8.00 | 9.00 | 9.00 | |||||||||||||||||||||||||||
| Long-term rate of compensation increase |
5.00 | 5.00 | 4.50 | 4.70 | 4.50 | 4.20 | 5.00 | 5.00 | 4.50 | |||||||||||||||||||||||||||
| (millions of dollars) | ||||||||||||||||||||||||||||||||||||
| Components of net periodic benefit cost |
||||||||||||||||||||||||||||||||||||
| Service cost |
$ | 438 | $ | 378 | $ | 360 | $ | 421 | $ | 434 | $ | 451 | $ | 94 | $ | 100 | $ | 109 | ||||||||||||||||||
| Interest cost |
809 | 729 | 687 | 1,121 | 1,152 | 1,011 | 408 | 414 | 403 | |||||||||||||||||||||||||||
| Expected return on plan assets |
(656 | ) | (915 | ) | (844 | ) | (886 | ) | (1,200 | ) | (1,105 | ) | (35 | ) | (59 | ) | (44 | ) | ||||||||||||||||||
| Amortization of actuarial loss/(gain) |
694 | 239 | 246 | 648 | 318 | 362 | 176 | 197 | 243 | |||||||||||||||||||||||||||
| Amortization of prior service cost |
— | (2 | ) | 23 | 79 | 93 | 89 | 69 | 76 | 75 | ||||||||||||||||||||||||||
| Net pension enhancement and curtailment/settlement expense |
485 | 174 | 190 | 2 | 32 | 19 | — | — | 9 | |||||||||||||||||||||||||||
| Net periodic benefit cost |
$ | 1,770 | $ | 603 | $ | 662 | $ | 1,385 | $ | 829 | $ | 827 | $ | 712 | $ | 728 | $ | 795 | ||||||||||||||||||
| Changes in amounts recorded in accumulated other comprehensive income: |
||||||||||||||||||||||||||||||||||||
| Net actuarial loss/(gain) |
$ | (231 | ) | $ | 5,275 | $ | 770 | $ | (33 | ) | $ | 4,837 | $ | (294 | ) | $ | (107 | ) | $ | 13 | $ | (245 | ) | |||||||||||||
| Amortization of actuarial (loss)/gain |
(1,179 | ) | (413 | ) | (436 | ) | (650 | ) | (350 | ) | (381 | ) | (176 | ) | (197 | ) | (252 | ) | ||||||||||||||||||
| Prior service cost/(credit) |
— | — | (95 | ) | 69 | 16 | 72 | — | — | — | ||||||||||||||||||||||||||
| Amortization of prior service (cost) |
— | 2 | (23 | ) | (79 | ) | (93 | ) | (89 | ) | (69 | ) | (76 | ) | (75 | ) | ||||||||||||||||||||
| Foreign exchange rate changes |
— | — | — | 608 | (997 | ) | 404 | 2 | (3 | ) | 12 | |||||||||||||||||||||||||
| Total recorded in other comprehensive income |
(1,410 | ) | 4,864 | 216 | (85 | ) | 3,413 | (288 | ) | (350 | ) | (263 | ) | (560 | ) | |||||||||||||||||||||
| Total recorded in net periodic benefit cost and other comprehensive income, before tax |
$ | 360 | $ | 5,467 | $ | 878 | $ | 1,300 | $ | 4,242 | $ | 539 | $ | 362 | $ | 465 | $ | 235 | ||||||||||||||||||
Costs for defined contribution plans were $339 million, $309 million and $287 million in 2009, 2008 and 2007, respectively.
A summary of the change in accumulated other comprehensive income is shown in the table below:
| Total Pension and Other Postretirement Benefits |
||||||||||||
| 2009 |
2008 |
2007 |
||||||||||
| (millions of dollars) | ||||||||||||
| (Charge)/credit to other comprehensive income, before tax |
||||||||||||
| U.S. pension |
$ | 1,410 | $ | (4,864 | ) | $ | (216 | ) | ||||
| Non-U.S. pension |
85 | (3,413 | ) | 288 | ||||||||
| Other postretirement benefits |
350 | 263 | 560 | |||||||||
| Total (charge)/credit to other comprehensive income, before tax |
1,845 | (8,014 | ) | 632 | ||||||||
| (Charge)/credit to income tax (see note 18) |
(591 | ) | 2,723 | (207 | ) | |||||||
| (Charge)/credit to investment in equity companies |
(133 | ) | (27 | ) | 26 | |||||||
| (Charge)/credit to other comprehensive income including noncontrolling interests, after tax |
$ | 1,121 | $ | (5,318 | ) | $ | 451 | |||||
| Charge/(credit) to equity of noncontrolling interests |
93 | 224 | 61 | |||||||||
| (Charge)/credit to other comprehensive income attributable to ExxonMobil |
$ | 1,214 | $ | (5,094 | ) | $ | 512 | |||||
86
The Corporation’s investment strategy for benefit plan assets reflects a long-term view, a careful assessment of the risks inherent in various asset classes and broad diversification to reduce the risk of the portfolio. The benefit plan assets are primarily invested in passive equity and fixed income index funds to diversify risk while minimizing costs. The equity funds hold ExxonMobil stock only to the extent necessary to replicate the relevant equity index. The fixed income funds are largely invested in high-quality corporate and government debt securities.
Studies are periodically conducted to establish the preferred target asset allocation. The target asset allocation for the U.S. benefit plans is 60% equity securities and 40% debt securities. The target asset allocation for the non-U.S. plans in aggregate is 56% equities, 41% debt and 3% real estate funds. The equity targets for the U.S. and non-U.S. plans include an allocation to private equity partnerships that primarily focus on early-stage venture capital of 5% and 3%, respectively.
The authoritative guidance for fair value measurements provides a framework for measuring fair value. The framework establishes a three-level fair value hierarchy based on the nature of the information used to measure fair value. The terms “Level 1,” “Level 2” and “Level 3” are accounting terms that refer to different methods of valuing assets. The terms do not represent the relative risk or credit quality of an investment.
The 2009 fair value of the benefit plan assets, including the level within the fair value hierarchy, is shown in the tables below:
| U.S. Pension |
Non-U.S. Pension | ||||||||||||||||||||||||||||
| Fair Value Measurement at December 31, 2009, Using: |
Total |
Fair Value Measurement at December 31, 2009, Using: |
Total | ||||||||||||||||||||||||||
| Quoted Prices in Active Markets for Identical Assets (Level 1) |
Significant Other Observable Inputs (Level 2) |
Significant Unobservable Inputs (Level 3) |
Quoted Prices in Active Markets for Identical Assets (Level 1) |
Significant Other Observable Inputs (Level 2) |
Significant Unobservable Inputs (Level 3) |
||||||||||||||||||||||||
| (millions of dollars) | (millions of dollars) | ||||||||||||||||||||||||||||
| Asset category: |
|||||||||||||||||||||||||||||
| Equity securities |
|||||||||||||||||||||||||||||
| U.S. |
$ | — | $ | 2,503 | (1) | $ | — | $ | 2,503 | $ | — | $ | 2,244 | (1) | $ | — | $ | 2,244 | |||||||||||
| Non-U.S. |
— | 3,341 | (1) | — | 3,341 | 227 | (2) | 5,946 | (1) | — | 6,173 | ||||||||||||||||||
| Private equity |
— | — | 349 | (3) | 349 | — | — | 239 | (3) | 239 | |||||||||||||||||||
| Debt securities |
|||||||||||||||||||||||||||||
| Corporate |
— | 1,040 | (4) | — | 1,040 | 2 | (5) | 1,637 | (4) | — | 1,639 | ||||||||||||||||||
| Government |
— | 2,570 | (4) | — | 2,570 | 70 | (5) | 4,217 | (4) | — | 4,287 | ||||||||||||||||||
| Asset-backed |
— | 30 | (4) | — | 30 | — | 119 | (4) | — | 119 | |||||||||||||||||||
| Private mortgages |
— | — | 280 | (6) | 280 | — | — | 5 | (6) | 5 | |||||||||||||||||||
| Real estate funds |
— | — | — | — | — | — | 413 | (7) | 413 | ||||||||||||||||||||
| Cash |
140 | — | — | 140 | 79 | 55 | (8) | — | 134 | ||||||||||||||||||||
| Total at fair value |
$ | 140 | $ | 9,484 | $ | 629 | $ | 10,253 | $ | 378 | $ | 14,218 | $ | 657 | $ | 15,253 | |||||||||||||
| Insurance contracts at contract value |
24 | 148 | |||||||||||||||||||||||||||
| Total plan assets |
$ | 10,277 | $ | 15,401 | |||||||||||||||||||||||||
| (1) | For U.S. and non-U.S. equity securities held in the form of fund units that are redeemable at the measurement date, the unit value is treated as a Level 2 input. The fair value of the securities owned by the funds is based on observable quoted prices on active exchanges, which are Level 1 inputs. |
| (2) | For non-U.S. equity securities held in separate accounts, fair value is based on observable quoted prices on active exchanges. |
| (3) | For private equity, fair value is generally established by using revenue or earnings multiples or other relevant market data including Initial Public Offerings. |
| (4) | For corporate, government and asset-backed debt securities, fair value is based on observable inputs of comparable market transactions. |
| (5) | For corporate and government debt securities that are traded on active exchanges, fair value is based on observable quoted prices. |
| (6) | For private mortgages, fair value is based on proprietary credit spread matrices developed using market data and monthly surveys of active mortgage bankers. |
| (7) | For real estate funds, fair value is based on appraised values developed using comparable market transactions. |
| (8) | For cash balances that are subject to withdrawal penalties or other adjustments, the fair value is treated as a Level 2 input. |
87
NOTES TO CONSOLIDATED FINANCIAL STATEMENTS
| Other Postretirement | ||||||||||||||
| Fair Value Measurement at December 31, 2009, Using: |
Total | |||||||||||||
| Quoted Prices in Active Markets for Identical Assets (Level 1) |
Significant Other Observable Inputs (Level 2) |
Significant Unobservable Inputs (Level 3) |
||||||||||||
| (millions of dollars) | ||||||||||||||
| Asset category: |
||||||||||||||
| Equity securities |
||||||||||||||
| U.S. |
$ | — | $ | 166 | (1) | $ | — | $ | 166 | |||||
| Non-U.S. |
— | 181 | (1) | — | 181 | |||||||||
| Private equity |
— | — | 4 | (2) | 4 | |||||||||
| Debt securities |
||||||||||||||
| Corporate |
— | 51 | (3) | — | 51 | |||||||||
| Government |
— | 95 | (3) | — | 95 | |||||||||
| Asset-backed |
— | 11 | (3) | — | 11 | |||||||||
| Private mortgages |
— | — | 3 | (4) | 3 | |||||||||
| Cash |
3 | — | — | 3 | ||||||||||
| Total at fair value |
$ | 3 | $ | 504 | $ | 7 | $ | 514 | ||||||
| (1) | For U.S. and non-U.S. equity securities held in the form of fund units that are redeemable at the measurement date, the unit value is treated as a Level 2 input. The fair value of the securities owned by the funds is based on observable quoted prices on active exchanges, which are Level 1 inputs. |
| (2) | For private equity, fair value is generally established by using revenue or earnings multiples or other relevant market data including Initial Public Offerings. |
| (3) | For corporate, government and asset-backed debt securities, fair value is based on observable inputs of comparable market transactions. |
| (4) | For private mortgages, fair value is based on proprietary credit spread matrices developed using market data and monthly surveys of active mortgage bankers. |
The change in the fair value in 2009 of Level 3 assets that use significant unobservable inputs to measure fair value is shown in the table below:
| 2009 |
||||||||||||||||||||||||||
| Pension |
Other Postretirement |
|||||||||||||||||||||||||
| U.S. |
Non U.S. |
Private Equity |
Private Mortgages |
|||||||||||||||||||||||
| Private Equity |
Private Mortgages |
Private Equity |
Private Mortgages |
Real Estate |
||||||||||||||||||||||
| (millions of dollars) | ||||||||||||||||||||||||||
| Fair value at January 1 |
$ | 346 | $ | 476 | $ | 238 | $ | 5 | $ | 409 | $ | 4 | $ | 6 | ||||||||||||
| Net realized gains/(losses) |
4 | 11 | (10 | ) | — | (7 | ) | — | — | |||||||||||||||||
| Net unrealized gains/(losses) |
(35 | ) | 7 | (35 | ) | — | (11 | ) | — | — | ||||||||||||||||
| Net purchases/(sales) |
34 | (214 | ) | 46 | — | 22 | — | (3 | ) | |||||||||||||||||
| Fair value at December 31 |
$ | 349 | $ | 280 | $ | 239 | $ | 5 | $ | 413 | $ | 4 | $ | 3 | ||||||||||||
88
A summary of pension plans with an accumulated benefit obligation in excess of plan assets is shown in the table below:
| Pension Benefits | ||||||||||||
| U.S. |
Non-U.S. | |||||||||||
| 2009 |
2008 |
2009 |
2008 | |||||||||
| (millions of dollars) | ||||||||||||
| For funded pension plans with an accumulated benefit obligation in excess of plan assets: |
||||||||||||
| Projected benefit obligation |
$ | 12,217 | $ | 11,683 | $ | 13,152 | $ | 12,226 | ||||
| Accumulated benefit obligation |
10,312 | 9,810 | 12,260 | 11,221 | ||||||||
| Fair value of plan assets |
10,276 | 6,632 | 10,447 | 9,002 | ||||||||
| For unfunded pension plans: |
||||||||||||
| Projected benefit obligation |
$ | 1,764 | $ | 1,589 | $ | 5,858 | $ | 5,314 | ||||
| Accumulated benefit obligation |
1,303 | 1,190 | 5,180 | 4,709 | ||||||||
| Pension Benefits |
Other Postretirement Benefits | |||||||
| U.S. |
Non-U.S. |
|||||||
| (millions of dollars) | ||||||||
| Estimated 2010 amortization from accumulated other comprehensive income: |
||||||||
| Net actuarial loss/(gain) (1) |
$ | 1,026 | $ | 572 | $ 154 | |||
| Prior service cost (2) |
2 | 86 | 52 | |||||
| (1) | The Corporation amortizes the net balance of actuarial losses/(gains) as a component of net periodic benefit cost over the average remaining service period of active plan participants. |
| (2) | The Corporation amortizes prior service cost on a straight-line basis as permitted under authoritative guidance for defined benefit pension and other postretirement benefit plans. |
| Pension Benefits |
Other Postretirement Benefits | ||||||||||
| U.S. |
Non-U.S. |
Gross |
Medicare Subsidy Receipt | ||||||||
| (millions of dollars) | |||||||||||
| Contributions expected in 2010 |
$ | — | $ | 1,090 | $ | — | $ — | ||||
| Benefit payments expected in: |
|||||||||||
| 2010 |
1,273 | 1,197 | 418 | 24 | |||||||
| 2011 |
1,318 | 1,227 | 439 | 25 | |||||||
| 2012 |
1,386 | 1,268 | 455 | 26 | |||||||
| 2013 |
1,431 | 1,286 | 472 | 28 | |||||||
| 2014 |
1,383 | 1,318 | 487 | 29 | |||||||
| 2015 - 2019 |
6,202 | 8,052 | 2,601 | 166 | |||||||
89
NOTES TO CONSOLIDATED FINANCIAL STATEMENTS
17. Disclosures about Segments and Related Information
The Upstream, Downstream and Chemical functions best define the operating segments of the business that are reported separately. The factors used to identify these reportable segments are based on the nature of the operations that are undertaken by each segment. The Upstream segment is organized and operates to explore for and produce crude oil and natural gas. The Downstream segment is organized and operates to manufacture and sell petroleum products. The Chemical segment is organized and operates to manufacture and sell petrochemicals. These segments are broadly understood across the petroleum and petrochemical industries.
These functions have been defined as the operating segments of the Corporation because they are the segments (1) that engage in business activities from which revenues are earned and expenses are incurred; (2) whose operating results are regularly reviewed by the Corporation’s chief operating decision maker to make decisions about resources to be allocated to the segment and assess its performance; and (3) for which discrete financial information is available.
Earnings after income tax include special items, and transfers are at estimated market prices. Earnings for 2009 included a special charge of $140 million in the corporate and financing segment for interest related to the Valdez punitive damages award. Special items included in 2008 after-tax earnings were a $1,620 million gain in Non-U.S. Upstream on the sale of a natural gas transportation business in Germany and special charges of $460 million in the corporate and financing segment related to the Valdez litigation. There were no special items in 2007.
Interest expense includes non-debt-related interest expense of $500 million, $498 million and $290 million in 2009, 2008 and 2007, respectively. Higher expenses in 2009 and 2008 primarily reflect interest provisions related to the Valdez litigation.
In corporate and financing activities, interest revenue relates to interest earned on cash deposits and marketable securities.
90
| Upstream |
Downstream |
Chemical |
Corporate and Financing |
Corporate Total | ||||||||||||||||||||||||
| U.S. |
Non-U.S. |
U.S. |
Non-U.S. |
U.S. |
Non-U.S. |
|||||||||||||||||||||||
| (millions of dollars) | ||||||||||||||||||||||||||||
| As of December 31, 2009 |
||||||||||||||||||||||||||||
| Earnings after income tax |
$ | 2,893 | $ | 14,214 | $ | (153 | ) | $ | 1,934 | $ | 769 | $ | 1,540 | $ | (1,917 | ) | $ | 19,280 | ||||||||||
| Earnings of equity companies included above |
1,216 | 5,269 | (102 | ) | 188 | 164 | 906 | (498 | ) | 7,143 | ||||||||||||||||||
| Sales and other operating revenue (1) |
3,406 | 21,355 | 76,467 | 173,404 | 9,962 | 16,885 | 21 | 301,500 | ||||||||||||||||||||
| Intersegment revenue |
6,718 | 32,982 | 10,168 | 39,190 | 7,185 | 6,947 | 284 | — | ||||||||||||||||||||
| Depreciation and depletion expense |
1,768 | 6,376 | 687 | 1,665 | 400 | 457 | 564 | 11,917 | ||||||||||||||||||||
| Interest revenue |
— | — | — | — | — | — | 179 | 179 | ||||||||||||||||||||
| Interest expense |
38 | 27 | 10 | 18 | 4 | 1 | 450 | 548 | ||||||||||||||||||||
| Income taxes |
1,451 | 15,183 | (164 | ) | (22 | ) | 281 | (182 | ) | (1,428 | ) | 15,119 | ||||||||||||||||
| Additions to property, plant and equipment |
2,973 | 13,307 | 1,449 | 1,447 | 294 | 2,553 | 468 | 22,491 | ||||||||||||||||||||
| Investments in equity companies |
2,440 | 8,864 | 323 | 1,190 | 259 | 2,873 | (207 | ) | 15,742 | |||||||||||||||||||
| Total assets |
24,940 | 102,372 | 17,493 | 45,098 | 7,044 | 17,117 | 19,259 | 233,323 | ||||||||||||||||||||
| As of December 31, 2008 |
||||||||||||||||||||||||||||
| Earnings after income tax |
$ | 6,243 | $ | 29,159 | $ | 1,649 | $ | 6,502 | $ | 724 | $ | 2,233 | $ | (1,290 | ) | $ | 45,220 | |||||||||||
| Earnings of equity companies included above |
1,954 | 7,597 | (2 | ) | 518 | 105 | 1,411 | (502 | ) | 11,081 | ||||||||||||||||||
| Sales and other operating revenue (1) |
6,767 | 32,346 | 116,701 | 265,359 | 14,136 | 24,252 | 18 | 459,579 | ||||||||||||||||||||
| Intersegment revenue |
9,617 | 55,069 | 16,225 | 65,723 | 9,925 | 9,749 | 273 | — | ||||||||||||||||||||
| Depreciation and depletion expense |
1,391 | 7,266 | 656 | 1,672 | 410 | 422 | 562 | 12,379 | ||||||||||||||||||||
| Interest revenue |
— | — | — | — | — | — | 1,400 | 1,400 | ||||||||||||||||||||
| Interest expense |
47 | 63 | 9 | 28 | 3 | 4 | 519 | 673 | ||||||||||||||||||||
| Income taxes |
3,451 | 30,654 | 728 | 1,990 | 177 | 10 | (480 | ) | 36,530 | |||||||||||||||||||
| Additions to property, plant and equipment |
2,699 | 10,545 | 1,550 | 1,552 | 413 | 1,987 | 572 | 19,318 | ||||||||||||||||||||
| Investments in equity companies |
2,248 | 7,787 | 456 | 1,382 | 241 | 2,384 | (40 | ) | 14,458 | |||||||||||||||||||
| Total assets |
23,056 | 83,750 | 16,328 | 42,044 | 6,856 | 13,300 | 42,718 | 228,052 | ||||||||||||||||||||
| As of December 31, 2007 |
||||||||||||||||||||||||||||
| Earnings after income tax |
$ | 4,870 | $ | 21,627 | $ | 4,120 | $ | 5,453 | $ | 1,181 | $ | 3,382 | $ | (23 | ) | $ | 40,610 | |||||||||||
| Earnings of equity companies included above |
1,455 | 5,393 | 208 | 641 | 120 | 1,558 | (474 | ) | 8,901 | |||||||||||||||||||
| Sales and other operating revenue (1) |
5,661 | 22,995 | 101,671 | 223,145 | 13,790 | 23,036 | 30 | 390,328 | ||||||||||||||||||||
| Intersegment revenue |
7,596 | 47,498 | 13,942 | 52,403 | 8,710 | 7,881 | 303 | — | ||||||||||||||||||||
| Depreciation and depletion expense |
1,469 | 7,126 | 639 | 1,662 | 405 | 418 | 531 | 12,250 | ||||||||||||||||||||
| Interest revenue |
— | — | — | — | — | — | 1,672 | 1,672 | ||||||||||||||||||||
| Interest expense |
57 | 75 | 14 | 26 | 2 | 2 | 224 | 400 | ||||||||||||||||||||
| Income taxes |
2,686 | 23,328 | 2,141 | 1,405 | 392 | 591 | (679 | ) | 29,864 | |||||||||||||||||||
| Additions to property, plant and equipment |
1,595 | 9,139 | 1,061 | 1,578 | 335 | 1,078 | 601 | 15,387 | ||||||||||||||||||||
| Investments in equity companies |
2,016 | 7,194 | 488 | 1,172 | 224 | 2,650 | (44 | ) | 13,700 | |||||||||||||||||||
| Total assets |
21,782 | 84,440 | 18,569 | 54,883 | 7,617 | 13,801 | 40,990 | 242,082 | ||||||||||||||||||||
| Geographic Sales and other operating revenue (1) |
2009 |
2008 |
2007 | ||||||
| (millions of dollars) | |||||||||
| United States |
$ | 89,847 | $ | 137,615 | $ | 121,144 | |||
| Non-U.S. |
211,653 | 321,964 | 269,184 | ||||||
| Total |
$ | 301,500 | $ | 459,579 | $ | 390,328 | |||
| Significant non-U.S. revenue sources include: |
|||||||||
| Japan |
$ | 22,054 | $ | 30,126 | $ | 26,146 | |||
| Canada |
21,151 | 33,677 | 27,284 | ||||||
| United Kingdom |
20,293 | 29,764 | 25,113 | ||||||
| Belgium |
16,857 | 25,399 | 20,550 | ||||||
| Germany |
14,839 | 20,591 | 17,445 | ||||||
| Italy |
12,997 | 17,953 | 16,255 | ||||||
| France |
12,042 | 18,530 | 14,287 | ||||||
| Singapore |
8,400 | 11,059 | 9,517 | ||||||
| (1) Sales and other operating revenue includes sales-based taxes of $25,936 million for 2009, $34,508 million for 2008 and $31,728 million for 2007. See note 1, Summary of Accounting Policies. | |||||||||
| Long-lived assets |
2009 |
2008 |
2007 | ||||||
| (millions of dollars) | |||||||||
| United States |
$ | 37,138 | $ | 35,548 | $ | 33,630 | |||
| Non-U.S. |
101,978 | 85,798 | 87,239 | ||||||
| Total |
$ | 139,116 | $ | 121,346 | $ | 120,869 | |||
| Significant non-U.S. long-lived assets include: |
|||||||||
| Canada |
$ | 15,919 | $ | 12,018 | $ | 14,167 | |||
| Nigeria |
11,046 | 9,227 | 7,504 | ||||||
| United Kingdom |
7,609 | 5,778 | 8,589 | ||||||
| Angola |
7,320 | 6,129 | 5,084 | ||||||
| Norway |
7,251 | 5,856 | 7,920 | ||||||
| Singapore |
7,238 | 5,113 | 3,598 | ||||||
| Kazakhstan |
4,748 | 3,535 | 2,829 | ||||||
| Japan |
4,532 | 4,769 | 4,077 | ||||||
91
NOTES TO CONSOLIDATED FINANCIAL STATEMENTS
18. Income, Sales-Based and Other Taxes
| 2009 |
2008 |
2007 |
||||||||||||||||||||||||||||||
| U.S. |
Non-U.S. |
Total |
U.S. |
Non-U.S. |
Total |
U.S. |
Non-U.S. |
Total |
||||||||||||||||||||||||
| (millions of dollars) | ||||||||||||||||||||||||||||||||
| Income taxes |
||||||||||||||||||||||||||||||||
| Federal and non-U.S. |
||||||||||||||||||||||||||||||||
| Current |
$ | (838 | ) | $ | 15,830 | $ | 14,992 | $ | 3,005 | $ | 31,377 | $ | 34,382 | $ | 4,666 | $ | 24,329 | $ | 28,995 | |||||||||||||
| Deferred – net |
650 | (665 | ) | (15 | ) | 168 | 1,289 | 1,457 | (439 | ) | 415 | (24 | ) | |||||||||||||||||||
| U.S. tax on non-U.S. operations |
32 | — | 32 | 230 | — | 230 | 263 | — | 263 | |||||||||||||||||||||||
| Total federal and non-U.S. |
(156 | ) | 15,165 | 15,009 | 3,403 | 32,666 | 36,069 | 4,490 | 24,744 | 29,234 | ||||||||||||||||||||||
| State |
110 | — | 110 | 461 | — | 461 | 630 | — | 630 | |||||||||||||||||||||||
| Total income taxes |
(46 | ) | 15,165 | 15,119 | 3,864 | 32,666 | 36,530 | 5,120 | 24,744 | 29,864 | ||||||||||||||||||||||
| Sales-based taxes |
6,271 | 19,665 | 25,936 | 6,646 | 27,862 | 34,508 | 7,154 | 24,574 | 31,728 | |||||||||||||||||||||||
| All other taxes and duties |
||||||||||||||||||||||||||||||||
| Other taxes and duties |
581 | 34,238 | 34,819 | 1,663 | 40,056 | 41,719 | 1,008 | 39,945 | 40,953 | |||||||||||||||||||||||
| Included in production and manufacturing expenses |
699 | 1,318 | 2,017 | 915 | 1,720 | 2,635 | 825 | 1,445 | 2,270 | |||||||||||||||||||||||
| Included in SG&A expenses |
197 | 538 | 735 | 209 | 660 | 869 | 215 | 653 | 868 | |||||||||||||||||||||||
| Total other taxes and duties |
1,477 | 36,094 | 37,571 | 2,787 | 42,436 | 45,223 | 2,048 | 42,043 | 44,091 | |||||||||||||||||||||||
| Total |
$ | 7,702 | $ | 70,924 | $ | 78,626 | $ | 13,297 | $ | 102,964 | $ | 116,261 | $ | 14,322 | $ | 91,361 | $ | 105,683 | ||||||||||||||
All other taxes and duties include taxes reported in production and manufacturing and selling, general and administrative (SG&A) expenses. The above provisions for deferred income taxes include net credits for the effect of changes in tax laws and rates of $9 million in 2009, $300 million in 2008 and $258 million in 2007.
Income taxes (charged)/credited directly to equity were:
| 2009 |
2008 |
2007 |
||||||||||
| (millions of dollars) | ||||||||||||
| Cumulative foreign exchange translation adjustment |
$ | (247 | ) | $ | 360 | $ | (269 | ) | ||||
| Postretirement benefits reserves adjustment: |
||||||||||||
| Net actuarial loss/(gain) |
(94 | ) | 3,361 | 102 | ||||||||
| Amortization of actuarial loss/(gain) |
(649 | ) | (317 | ) | (358 | ) | ||||||
| Prior service cost |
20 | 4 | (23 | ) | ||||||||
| Amortization of prior service cost |
(43 | ) | (51 | ) | (60 | ) | ||||||
| Foreign exchange rate changes |
175 | (274 | ) | 132 | ||||||||
| Total postretirement benefits reserves adjustment |
(591 | ) | 2,723 | (207 | ) | |||||||
| Other components of equity |
140 | 315 | 113 | |||||||||
The reconciliation between income tax expense and a theoretical U.S. tax computed by applying a rate of 35 percent for 2009, 2008 and 2007 is as follows:
| 2009 |
2008 |
2007 |
||||||||||
| (millions of dollars) | ||||||||||||
| Income before income taxes |
||||||||||||
| United States |
$ | 2,576 | $ | 10,152 | $ | 13,708 | ||||||
| Non-U.S. |
32,201 | 73,245 | 57,771 | |||||||||
| Total |
$ | 34,777 | $ | 83,397 | $ | 71,479 | ||||||
| Theoretical tax |
$ | 12,172 | $ | 29,189 | $ | 25,018 | ||||||
| Effect of equity method of accounting |
(2,500 | ) | (3,878 | ) | (3,115 | ) | ||||||
| Non-U.S. taxes in excess of theoretical U.S. tax |
5,948 | 10,188 | 7,015 | |||||||||
| U.S. tax on non-U.S. operations |
32 | 230 | 263 | |||||||||
| State taxes, net of federal tax benefit |
72 | 300 | 410 | |||||||||
| Other U.S. |
(605 | ) | 501 | 273 | ||||||||
| Total income tax expense |
$ | 15,119 | $ | 36,530 | $ | 29,864 | ||||||
| Effective tax rate calculation |
||||||||||||
| Income taxes |
$ | 15,119 | $ | 36,530 | $ | 29,864 | ||||||
| ExxonMobil share of equity company income taxes |
2,489 | 4,001 | 2,547 | |||||||||
| Total income taxes |
17,608 | 40,531 | 32,411 | |||||||||
| Net income including noncontrolling interests |
19,658 | 46,867 | 41,615 | |||||||||
| Total income before taxes |
$ | 37,266 | $ | 87,398 | $ | 74,026 | ||||||
| Effective income tax rate |
47 | % | 46 | % | 44 | % | ||||||
92
Deferred income taxes reflect the impact of temporary differences between the amount of assets and liabilities recognized for financial reporting purposes and such amounts recognized for tax purposes.
Deferred tax liabilities/(assets) are comprised of the following at December 31:
| Tax effects of temporary differences for: |
2009 |
2008 |
||||||
| (millions of dollars) | ||||||||
| Depreciation |
$ | 20,210 | $ | 17,279 | ||||
| Intangible development costs |
6,407 | 5,578 | ||||||
| Capitalized interest |
2,948 | 2,751 | ||||||
| Other liabilities |
4,468 | 3,589 | ||||||
| Total deferred tax liabilities |
$ | 34,033 | $ | 29,197 | ||||
| Pension and other postretirement benefits |
$ | (5,442 | ) | $ | (6,275 | ) | ||
| Asset retirement obligations |
(3,978 | ) | (1,837 | ) | ||||
| Tax loss carryforwards |
(3,693 | ) | (2,850 | ) | ||||
| Other assets |
(4,700 | ) | (3,437 | ) | ||||
| Total deferred tax assets |
$ | (17,813 | ) | $ | (14,399 | ) | ||
| Asset valuation allowances |
1,495 | 1,264 | ||||||
| Net deferred tax liabilities |
$ | 17,715 | $ | 16,062 | ||||
Deferred income tax (assets) and liabilities are included in the balance sheet as shown below. Deferred income tax (assets) and liabilities are classified as current or long term consistent with the classification of the related temporary difference – separately by tax jurisdiction.
| Balance sheet classification |
2009 |
2008 |
||||||
| (millions of dollars) | ||||||||
| Other current assets |
$ | (3,322 | ) | $ | (2,097 | ) | ||
| Other assets, including intangibles, net |
(2,263 | ) | (1,725 | ) | ||||
| Accounts payable and accrued liabilities |
152 | 158 | ||||||
| Deferred income tax liabilities |
23,148 | 19,726 | ||||||
| Net deferred tax liabilities |
$ | 17,715 | $ | 16,062 | ||||
The Corporation had $42 billion of indefinitely reinvested, undistributed earnings from subsidiary companies outside the U.S. Unrecognized deferred taxes on remittance of these funds are not expected to be material.
Unrecognized Tax Benefits
Effective January 1, 2007, the Corporation adopted the authoritative guidance for accounting for uncertainty in income taxes. Upon the adoption of this guidance, the Corporation recognized a transition gain of $267 million in equity. The gain reflected the recognition of several refund claims, partly offset by increased liability reserves.
The Corporation is subject to income taxation in many jurisdictions around the world. Unrecognized tax benefits reflect the difference between positions taken or expected to be taken on income tax returns and the amounts recognized in the financial statements. Resolution of the related tax positions through negotiations with the relevant tax authorities or through litigation will take many years to complete. It is difficult to predict the timing of resolution for individual tax positions since such timing is not entirely within the control of the Corporation. However, it is reasonably possible that resolutions could be reached with tax jurisdictions within the next 12 months that could result in a decrease of up to 15 percent in the total amount of unrecognized tax benefits. Given the long time periods involved in resolving individual tax positions, the Corporation does not expect that the recognition of unrecognized tax benefits will have a material impact on the Corporation’s effective income tax rate in any given year.
The following table summarizes the movement in unrecognized tax benefits.
| Gross unrecognized tax benefits |
2009 |
2008 |
2007 |
|||||||||
| (millions of dollars) | ||||||||||||
| Balance at January 1 |
$ | 4,976 | $ | 5,232 | $ | 4,583 | ||||||
| Additions based on current year’s tax positions |
547 | 656 | 832 | |||||||||
| Additions for prior years’ tax positions |
262 | 294 | 463 | |||||||||
| Reductions for prior years’ tax positions |
(594 | ) | (328 | ) | (609 | ) | ||||||
| Reductions due to lapse of the statute of limitations |
— | (27 | ) | (84 | ) | |||||||
| Settlements with tax authorities |
(592 | ) | (681 | ) | (25 | ) | ||||||
| Foreign exchange effects/other |
126 | (170 | ) | 72 | ||||||||
| Balance at December 31 |
$ | 4,725 | $ | 4,976 | $ | 5,232 | ||||||
The additions and reductions in unrecognized tax benefits shown above include effects related to net income and equity, and timing differences for which the ultimate deductibility is highly certain but for which there is uncertainty about the timing of such deductibility. The 2009, 2008 and 2007 changes in unrecognized tax benefits did not have a material effect on the Corporation’s net income or cash flow.
The following table summarizes the tax years that remain subject to examination by major tax jurisdiction:
| Country of Operation |
Open Tax Years | |
| Abu Dhabi |
2000 - 2009 | |
| Angola |
2005 - 2009 | |
| Australia |
2000 - 2009 | |
| Canada |
1994 - 2009 | |
| Equatorial Guinea |
2004 - 2009 | |
| Germany |
1999 - 2008 | |
| Japan |
2002 - 2009 | |
| Malaysia |
2004 - 2009 | |
| Nigeria |
1998 - 2009 | |
| Norway |
1993 - 2009 | |
| United Kingdom |
2003 - 2009 | |
| United States |
1989 - 2009 |
The Corporation classifies interest on income tax-related balances as interest expense or interest income and classifies tax-related penalties as operating expense.
The Corporation incurred approximately $135 million, $137 million and $128 million in interest expense on income tax reserves in 2009, 2008 and 2007 respectively, and had a related interest payable of $771 million and $671 million at December 31, 2009, and 2008, respectively.
93
SUPPLEMENTAL INFORMATION ON OIL AND GAS EXPLORATION AND PRODUCTION ACTIVITIES (unaudited)
The results of operations for producing activities shown below do not include earnings from other activities that ExxonMobil includes in the Upstream function, such as oil and gas transportation operations, LNG liquefaction and transportation operations, coal and power operations, technical service agreements, other nonoperating activities and adjustments for noncontrolling interests. These excluded amounts for both consolidated and equity companies totaled $536 million in 2009, $3,834 million in 2008 and $2,271 million in 2007. Oil sands mining operations were in the excluded amounts for 2008 and 2007. However, beginning in 2009, oil sands mining operations are included in the results of operations in accordance with revised Securities and Exchange Commission and Financial Accounting Standards Board rules. The amounts included for oil sands mining operations in the results of operations for 2009 are shown in footnote 1 below.
| Results of Operations – Consolidated Subsidiaries |
United States |
Canada/ South America(1) |
Europe |
Africa |
Asia Pacific/ Middle East |
Russia/ Caspian |
Total | ||||||||||||||
| (millions of dollars) | |||||||||||||||||||||
| 2009 – Revenue |
|||||||||||||||||||||
| Sales to third parties |
$ | 1,859 | $ | 1,345 | $ | 5,900 | $ | 3,012 | $ | 2,875 | $ | 348 | $ | 15,339 | |||||||
| Transfers |
5,652 | 4,538 | 5,977 | 11,868 | 5,446 | 1,053 | 34,534 | ||||||||||||||
| $ | 7,511 | $ | 5,883 | $ | 11,877 | $ | 14,880 | $ | 8,321 | $ | 1,401 | $ | 49,873 | ||||||||
| Production costs excluding taxes |
2,255 | 2,428 | 2,675 | 2,027 | 1,427 | 206 | 11,018 | ||||||||||||||
| Exploration expenses |
219 | 339 | 375 | 662 | 340 | 86 | 2,021 | ||||||||||||||
| Depreciation and depletion |
1,670 | 948 | 2,078 | 2,293 | 702 | 309 | 8,000 | ||||||||||||||
| Taxes other than income |
730 | 78 | 593 | 1,343 | 1,241 | 2 | 3,987 | ||||||||||||||
| Related income tax |
1,127 | 597 | 4,277 | 4,667 | 2,892 | 167 | 13,727 | ||||||||||||||
| Results of producing activities for consolidated subsidiaries |
$ | 1,510 | $ | 1,493 | $ | 1,879 | $ | 3,888 | $ | 1,719 | $ | 631 | $ | 11,120 | |||||||
| Results of Operations – Equity Companies |
|||||||||||||||||||||
| 2009 – Revenue |
|||||||||||||||||||||
| Sales to third parties |
$ | 818 | $ | — | $ | 4,889 | $ | — | $ | 4,466 | $ | 1,682 | $ | 11,855 | |||||||
| Transfers |
686 | — | 53 | — | 2,542 | 418 | 3,699 | ||||||||||||||
| $ | 1,504 | $ | — | $ | 4,942 | $ | — | $ | 7,008 | $ | 2,100 | $ | 15,554 | ||||||||
| Production costs excluding taxes |
481 | — | 248 | — | 91 | 160 | 980 | ||||||||||||||
| Exploration expenses |
1 | — | 12 | — | — | — | 13 | ||||||||||||||
| Depreciation and depletion |
163 | — | 168 | — | 127 | 239 | 697 | ||||||||||||||
| Taxes other than income |
37 | — | 2,233 | — | 2,006 | 114 | 4,390 | ||||||||||||||
| Related income tax |
— | — | 902 | — | 2,656 | 465 | 4,023 | ||||||||||||||
| Results of producing activities for equity companies |
$ | 822 | $ | — | $ | 1,379 | $ | — | $ | 2,128 | $ | 1,122 | $ | 5,451 | |||||||
| Total results of operations |
$ | 2,332 | $ | 1,493 | $ | 3,258 | $ | 3,888 | $ | 3,847 | $ | 1,753 | $ | 16,571 | |||||||
| (1) | The impact of including synthetic oil reserves and bitumen mining operations in the results of operations for 2009 was $1,447 million in revenue and $279 million in earnings. Cold Lake bitumen operations had no net impact as they had already been included in the results of operations in previous years as an oil and gas operation. |
94
| Results of Operations |
United States |
Canada/ South America |
Europe |
Africa |
Asia Pacific/ Middle East |
Russia/ Caspian |
Total | ||||||||||||||
| (millions of dollars) | |||||||||||||||||||||
| 2008 – Revenue |
|||||||||||||||||||||
| Sales to third parties |
$ | 3,980 | $ | 4,591 | $ | 11,239 | $ | 2,284 | $ | 4,356 | $ | 746 | $ | 27,196 | |||||||
| Transfers |
8,525 | 3,518 | 10,859 | 18,361 | 9,083 | 2,026 | 52,372 | ||||||||||||||
| $ | 12,505 | $ | 8,109 | $ | 22,098 | $ | 20,645 | $ | 13,439 | $ | 2,772 | $ | 79,568 | ||||||||
| Production costs excluding taxes |
2,143 | 1,686 | 2,623 | 1,603 | 1,152 | 280 | 9,487 | ||||||||||||||
| Exploration expenses |
189 | 232 | 180 | 439 | 341 | 60 | 1,441 | ||||||||||||||
| Depreciation and depletion |
1,303 | 906 | 2,510 | 2,471 | 794 | 350 | 8,334 | ||||||||||||||
| Taxes other than income |
1,983 | 58 | 971 | 1,815 | 2,996 | 2 | 7,825 | ||||||||||||||
| Related income tax |
3,191 | 1,501 | 10,715 | 8,119 | 5,248 | 508 | 29,282 | ||||||||||||||
| Results of producing activities for consolidated subsidiaries |
$ | 3,696 | $ | 3,726 | $ | 5,099 | $ | 6,198 | $ | 2,908 | $ | 1,572 | $ | 23,199 | |||||||
| Proportional interest in results of producing activities of equity companies |
$ | 1,885 | $ | — | $ | 1,918 | $ | — | $ | 3,057 | $ | 1,509 | $ | 8,369 | |||||||
| 2007 – Revenue |
|||||||||||||||||||||
| Sales to third parties |
$ | 3,677 | $ | 3,720 | $ | 7,282 | $ | 807 | $ | 3,363 | $ | 678 | $ | 19,527 | |||||||
| Transfers |
6,554 | 2,783 | 9,780 | 17,048 | 7,276 | 2,087 | 45,528 | ||||||||||||||
| $ | 10,231 | $ | 6,503 | $ | 17,062 | $ | 17,855 | $ | 10,639 | $ | 2,765 | $ | 65,055 | ||||||||
| Production costs excluding taxes |
1,827 | 1,492 | 2,859 | 1,180 | 961 | 243 | 8,562 | ||||||||||||||
| Exploration expenses |
280 | 264 | 164 | 470 | 226 | 67 | 1,471 | ||||||||||||||
| Depreciation and depletion |
1,377 | 1,121 | 2,441 | 2,101 | 763 | 453 | 8,256 | ||||||||||||||
| Taxes other than income |
1,313 | 111 | 718 | 1,599 | 2,067 | 1 | 5,809 | ||||||||||||||
| Related income tax |
2,429 | 1,041 | 7,236 | 7,263 | 4,105 | 598 | 22,672 | ||||||||||||||
| Results of producing activities for consolidated subsidiaries |
$ | 3,005 | $ | 2,474 | $ | 3,644 | $ | 5,242 | $ | 2,517 | $ | 1,403 | $ | 18,285 | |||||||
| Proportional interest in results of producing activities of equity companies |
$ | 1,342 | $ | — | $ | 1,465 | $ | — | $ | 2,138 | $ | 996 | $ | 5,941 | |||||||
95
SUPPLEMENTAL INFORMATION ON OIL AND GAS EXPLORATION AND PRODUCTION ACTIVITIES (unaudited)
Oil and Gas Exploration and Production Costs
The amounts shown for net capitalized costs of consolidated subsidiaries are $2,910 million less at year-end 2009 and $5,779 million less at year-end 2008 than the amounts reported as investments in property, plant and equipment for the Upstream in note 8. This is due to the exclusion from capitalized costs of certain transportation and research assets and assets relating to LNG operations. Assets related to oil sands and oil shale mining operations were excluded in 2008 but have been included in the capitalized costs for 2009 in accordance with revised Financial Accounting Standards Board rules.
| Capitalized Costs – Consolidated Subsidiaries(1) |
United States |
Canada/ South America |
Europe |
Africa |
Asia Pacific/ Middle East |
Russia/ Caspian |
Total | ||||||||||||||
| (millions of dollars) | |||||||||||||||||||||
| As of December 31, 2009 |
|||||||||||||||||||||
| Property (acreage) costs – Proved |
$ | 3,225 | $ | 3,940 | $ | 204 | $ | 927 | $ | 1,463 | $ | 610 | $ | 10,369 | |||||||
| – Unproved |
1,233 | 1,117 | 52 | 416 | 390 | 45 | 3,253 | ||||||||||||||
| Total property costs |
$ | 4,458 | $ | 5,057 | $ | 256 | $ | 1,343 | $ | 1,853 | $ | 655 | $ | 13,622 | |||||||
| Producing assets |
40,435 | 20,357 | 43,913 | 26,621 | 19,911 | 4,063 | 155,300 | ||||||||||||||
| Incomplete construction |
3,315 | 3,701 | 999 | 6,872 | 4,457 | 5,139 | 24,483 | ||||||||||||||
| Total capitalized costs |
$ | 48,208 | $ | 29,115 | $ | 45,168 | $ | 34,836 | $ | 26,221 | $ | 9,857 | $ | 193,405 | |||||||
| Accumulated depreciation and depletion |
29,934 | 15,707 | 32,236 | 13,919 | 14,501 | 1,699 | 107,996 | ||||||||||||||
| Net capitalized costs for consolidated subsidiaries |
$ | 18,274 | $ | 13,408 | $ | 12,932 | $ | 20,917 | $ | 11,720 | $ | 8,158 | $ | 85,409 | |||||||
| Capitalized Costs – Equity Companies |
|||||||||||||||||||||
| As of December 31, 2009 |
|||||||||||||||||||||
| Property (acreage) costs – Proved |
$ | 76 | $ | — | $ | 8 | $ | — | $ | — | $ | — | $ | 84 | |||||||
| – Unproved |
1 | — | — | — | — | — | 1 | ||||||||||||||
| Total property costs |
$ | 77 | $ | — | $ | 8 | $ | — | $ | — | $ | — | $ | 85 | |||||||
| Producing assets |
3,224 | — | 5,574 | — | 2,543 | 4,326 | 15,667 | ||||||||||||||
| Incomplete construction |
128 | — | 336 | — | 714 | 171 | 1,349 | ||||||||||||||
| Total capitalized costs |
$ | 3,429 | $ | — | $ | 5,918 | $ | — | $ | 3,257 | $ | 4,497 | $ | 17,101 | |||||||
| Accumulated depreciation and depletion |
1,340 | — | 4,493 | — | 949 | 1,099 | 7,881 | ||||||||||||||
| Net capitalized costs for equity companies |
$ | 2,089 | $ | — | $ | 1,425 | $ | — | $ | 2,308 | $ | 3,398 | $ | 9,220 | |||||||
| Capitalized Costs |
|||||||||||||||||||||
| As of December 31, 2008 |
|||||||||||||||||||||
| Property (acreage) costs – Proved |
$ | 3,238 | $ | 3,431 | $ | 182 | $ | 316 | $ | 601 | $ | 552 | $ | 8,320 | |||||||
| – Unproved |
647 | 569 | 48 | 461 | 991 | 45 | 2,761 | ||||||||||||||
| Total property costs |
$ | 3,885 | $ | 4,000 | $ | 230 | $ | 777 | $ | 1,592 | $ | 597 | $ | 11,081 | |||||||
| Producing assets |
38,114 | 13,637 | 35,359 | 24,700 | 17,603 | 3,829 | 133,242 | ||||||||||||||
| Incomplete construction |
2,858 | 997 | 874 | 3,996 | 4,060 | 3,660 | 16,445 | ||||||||||||||
| Total capitalized costs |
$ | 44,857 | $ | 18,634 | $ | 36,463 | $ | 29,473 | $ | 23,255 | $ | 8,086 | $ | 160,768 | |||||||
| Accumulated depreciation and depletion |
28,323 | 11,987 | 26,390 | 11,676 | 13,366 | 1,392 | 93,134 | ||||||||||||||
| Net capitalized costs for consolidated subsidiaries |
$ | 16,534 | $ | 6,647 | $ | 10,073 | $ | 17,797 | $ | 9,889 | $ | 6,694 | $ | 67,634 | |||||||
| Proportional interest of net capitalized costs of equity companies |
$ | 2,008 | $ | — | $ | 1,404 | $ | — | $ | 1,490 | $ | 3,525 | $ | 8,427 | |||||||
| (1) | The impact of including oil sands and oil shale mining operations in the capitalized costs for 2009 was $7,369 million in total capitalized costs and $6,173 million in net capitalized costs. Cold Lake bitumen operations had no net impact as they had already been included in capitalized costs in previous years as an oil and gas operation. |
96
Oil and Gas Exploration and Production Costs (continued)
The amounts reported as costs incurred include both capitalized costs and costs charged to expense during the year. Costs incurred also include new asset retirement obligations established in the current year, as well as increases or decreases to the asset retirement obligation resulting from changes in cost estimates or abandonment date. Total consolidated costs incurred in 2009 were $20,507 million, up $4,691 million from 2008, due primarily to higher exploration and development costs as well as the inclusion in 2009 of costs incurred related to oil sands mining operations (see footnote 1 below). 2008 costs were $15,816 million, up $3,741 million from 2007, due primarily to higher exploration and development costs. Total equity company costs incurred in 2009 were $1,019 million, down $200 million from 2008, due primarily to lower development costs.
| Costs incurred in property acquisitions, exploration and development activities – Consolidated Subsidiaries |
United States |
Canada/ South America(1) |
Europe |
Africa |
Asia Pacific/ Middle East |
Russia/ Caspian |
Total | ||||||||||||||
| (millions of dollars) | |||||||||||||||||||||
| During 2009 |
|||||||||||||||||||||
| Property acquisition costs – Proved |
$ | 17 | $ | — | $ | — | $ | 600 | $ | — | $ | 59 | $ | 676 | |||||||
| – Unproved |
188 | 353 | 1 | 5 | 62 | — | 609 | ||||||||||||||
| Exploration costs |
548 | 498 | 471 | 880 | 601 | 58 | 3,056 | ||||||||||||||
| Development costs |
2,482 | 2,394 | 3,384 | 4,596 | 1,563 | 1,747 | 16,166 | ||||||||||||||
| Total costs incurred for consolidated subsidiaries |
$ | 3,235 | $ | 3,245 | $ | 3,856 | $ | 6,081 | $ | 2,226 | $ | 1,864 | $ | 20,507 | |||||||
| Costs incurred in property acquisitions, exploration and development activities – Equity Companies |
|||||||||||||||||||||
| Property acquisition costs – Proved |
$ | — | $ | — | $ | — | $ | — | $ | — | $ | — | $ | — | |||||||
| – Unproved |
— | — | — | — | — | — | — | ||||||||||||||
| Exploration costs |
1 | — | 54 | — | — | — | 55 | ||||||||||||||
| Development costs |
305 | — | 255 | — | 272 | 132 | 964 | ||||||||||||||
| Total costs incurred for equity companies |
$ | 306 | $ | — | $ | 309 | $ | — | $ | 272 | $ | 132 | $ | 1,019 | |||||||
| During 2008 |
|||||||||||||||||||||
| Property acquisition costs – Proved |
$ | — | $ | 1 | $ | — | $ | — | $ | 5 | $ | 55 | $ | 61 | |||||||
| – Unproved |
281 | 125 | 25 | 82 | 81 | 8 | 602 | ||||||||||||||
| Exploration costs |
453 | 306 | 389 | 686 | 346 | 61 | 2,241 | ||||||||||||||
| Development costs |
2,255 | 907 | 1,634 | 4,783 | 1,904 | 1,429 | 12,912 | ||||||||||||||
| Total costs incurred for consolidated subsidiaries |
$ | 2,989 | $ | 1,339 | $ | 2,048 | $ | 5,551 | $ | 2,336 | $ | 1,553 | $ | 15,816 | |||||||
| Proportional interest of costs incurred of equity companies |
$ | 484 | $ | — | $ | 241 | $ | — | $ | 159 | $ | 335 | $ | 1,219 | |||||||
| During 2007 |
|||||||||||||||||||||
| Property acquisition costs – Proved |
$ | 24 | $ | — | $ | — | $ | 3 | $ | — | $ | 10 | $ | 37 | |||||||
| – Unproved |
39 | 93 | — | 10 | 15 | — | 157 | ||||||||||||||
| Exploration costs |
375 | 222 | 201 | 584 | 261 | 80 | 1,723 | ||||||||||||||
| Development costs |
1,558 | 645 | 1,826 | 2,846 | 2,156 | 1,127 | 10,158 | ||||||||||||||
| Total costs incurred for consolidated subsidiaries |
$ | 1,996 | $ | 960 | $ | 2,027 | $ | 3,443 | $ | 2,432 | $ | 1,217 | $ | 12,075 | |||||||
| Proportional interest of costs incurred of equity companies |
$ | 303 | $ | — | $ | 218 | $ | 1 | $ | 249 | $ | 414 | $ | 1,185 | |||||||
| (1) | Costs incurred on synthetic oil reserves and bitumen mining operations in 2009 were $1,872 million, primarily on unproved property acquisition and development costs. Cold Lake bitumen operations had been included in costs incurred in previous years as an oil and gas operation. |
97
SUPPLEMENTAL INFORMATION ON OIL AND GAS EXPLORATION AND PRODUCTION ACTIVITIES (unaudited)
Oil and Gas Reserves
The following information describes changes during the years and balances of proved oil and gas reserves at year-end 2007, 2008 and 2009.
The definitions used are in accordance with the Securities and Exchange Commission’s amended Rule 4-10 (a) of Regulation S-X.
Proved oil and gas reserves are those quantities of oil and gas, which, by analysis of geoscience and engineering data, can be estimated with reasonable certainty to be economically producible – from a given date forward, from known reservoirs, and under existing economic conditions, operating methods and government regulations – prior to the time at which contracts providing the right to operate expire, unless evidence indicates that renewal is reasonably certain. In some cases, substantial new investments in additional wells and related facilities will be required to recover these proved reserves.
In accordance with the Securities and Exchange Commission’s amended rules, the year-end reserves volumes for 2009 as well as the reserves change categories for 2009 shown in the following tables were calculated using average prices during the 12-month period prior to the ending date of the period covered by the report, determined as an unweighted arithmetic average of the first-day-of-the-month price for each month within such period. The year-end reserves volumes for 2007 and 2008 as well as the reserves change categories for 2007 and 2008 shown in the following tables were calculated using December 31 prices and costs. These reserves quantities are also used in calculating unit-of-production depreciation rates and in calculating the standardized measure of discounted net cash flow.
Revisions can include upward or downward changes in previously estimated volumes of proved reserves for existing fields due to the evaluation or re-evaluation of (1) already available geologic, reservoir or production data, (2) new geologic, reservoir or production data or (3) changes in average prices and year-end costs that are used in the estimation of reserves. This category can also include significant changes in either development strategy or production equipment/ facility capacity.
Proved reserves include 100 percent of each majority-owned affiliate’s participation in proved reserves and ExxonMobil’s ownership percentage of the proved reserves of equity companies, but exclude royalties and quantities due others. Gas reserves exclude the gaseous equivalent of liquids expected to be removed from the gas on leases, at field facilities and at gas processing plants. These liquids are included in net proved reserves of crude oil and natural gas liquids.
In the proved reserves tables, consolidated reserves and equity company reserves are reported separately. However, the Corporation does not view equity company reserves any differently than those from consolidated companies.
Reserves reported under production sharing and other nonconcessionary agreements are based on the economic interest as defined by the specific fiscal terms in the agreement. The production and reserves that we report for these types of arrangements typically vary inversely with oil and gas price changes. As oil and gas prices increase, the cash flow and value received by the company increase; however, the production volumes and reserves required to achieve this value will typically be lower because of the higher prices. When prices decrease, the opposite effect generally occurs. The percentage of total liquids and natural gas proved reserves (consolidated subsidiaries plus equity companies) at year-end 2009 that were associated with production sharing contract arrangements was 17 percent of liquids, 13 percent of natural gas and 15 percent on an oil-equivalent basis (gas converted to oil-equivalent at 6 billion cubic feet = 1 million barrels).
Net proved developed reserves are those volumes that are expected to be recovered through existing wells with existing equipment and operating methods or in which the cost of the required equipment is relatively minor compared to the cost of a new well. Net proved undeveloped reserves are those volumes that are expected to be recovered from new wells on undrilled acreage, or from existing wells where a relatively major expenditure is required for recompletion.
Crude oil and natural gas liquids and natural gas production quantities shown are the net volumes withdrawn from ExxonMobil’s oil and gas reserves. The natural gas quantities differ from the quantities of gas delivered for sale by the producing function as reported in the Operating Summary due to volumes consumed or flared and inventory changes.
As a result of the Securities and Exchange Commission’s amended Rule 4-10, bitumen extracted through mining activities and hydrocarbons from other non-traditional resources are permitted to be reported as oil and gas reserves. Included in 2009 reported proved reserves for the first time were synthetic oil reserves of 691 million barrels, representing the Corporation’s interest in the Syncrude project in Canada and bitumen reserves of 1,356 million barrels, representing the Corporation’s interest in the Kearl project in Canada.
The amended rules also adopted a reliable technology definition that permits reserves to be added based on technologies that have been field tested and have been demonstrated to provide reasonably certain results with consistency and repeatability in the formation being evaluated.
The estimated impact of changing to an average of the first-day-of-the-month prices and the use of reliable technology was de minimis on the Corporation’s proved reserves volumes in 2009.
Major changes between 2008 year-end proved reserves and 2009 year-end proved reserves included the initial booking of the Gorgon Jansz liquefied natural gas (LNG) project in Australia and the Papua New Guinea LNG project and an upwards revision to the Kearl project.
98
Crude Oil, Natural Gas Liquids, Synthetic Oil and Bitumen Proved Reserves
| Crude Oil and Natural Gas Liquids |
Bitumen |
Synthetic Oil |
Total |
|||||||||||||||||||||||||||
| United States |
Canada/ S. Amer. (1) |
Europe |
Africa |
Asia Pacific/ Middle East |
Russia/ Caspian |
Total |
Canada/ S. Amer. (2) |
Canada/ S. Amer. (3) |
||||||||||||||||||||||
| (millions of barrels) | ||||||||||||||||||||||||||||||
| Net proved developed and undeveloped reserves of consolidated subsidiaries |
||||||||||||||||||||||||||||||
| January 1, 2007 |
1,884 | 1,395 | 748 | 2,089 | 1,287 | 791 | 8,194 | |||||||||||||||||||||||
| Revisions |
76 | 15 | 89 | 99 | 342 | (38 | ) | 583 | ||||||||||||||||||||||
| Improved recovery |
8 | 5 | 8 | 4 | — | — | 25 | |||||||||||||||||||||||
| Purchases |
— | — | — | — | — | — | — | |||||||||||||||||||||||
| Sales |
(8 | ) | (426 | )(4) | (1 | ) | — | — | — | (435 | ) | |||||||||||||||||||
| Extensions/discoveries |
2 | 45 | 2 | 128 | 1 | — | 178 | |||||||||||||||||||||||
| Production |
(111 | ) | (95 | ) | (173 | ) | (262 | ) | (120 | ) | (40 | ) | (801 | ) | ||||||||||||||||
| December 31, 2007 |
1,851 | 939 | 673 | 2,058 | 1,510 | 713 | 7,744 | |||||||||||||||||||||||
| Revisions |
(104 | ) | (70 | ) | 39 | 253 | 274 | 79 | 471 | |||||||||||||||||||||
| Improved recovery |
— | — | — | — | — | — | — | |||||||||||||||||||||||
| Purchases |
— | — | — | — | — | — | — | |||||||||||||||||||||||
| Sales |
(4 | ) | (2 | ) | (28 | ) | — | — | (52 | ) | (86 | ) | ||||||||||||||||||
| Extensions/discoveries |
5 | 29 | 4 | 65 | 68 | — | 171 | |||||||||||||||||||||||
| Production |
(104 | ) | (84 | ) | (155 | ) | (239 | ) | (115 | ) | (27 | ) | (724 | ) | ||||||||||||||||
| December 31, 2008 |
1,644 | 812 | 533 | 2,137 | 1,737 | 713 | 7,576 | |||||||||||||||||||||||
| Proportional interest in proved reserves of equity companies |
||||||||||||||||||||||||||||||
| End of year 2007 |
374 | — | 26 | — | 1,428 | 808 | 2,636 | |||||||||||||||||||||||
| End of year 2008 |
327 | — | 27 | — | 1,335 | 870 | 2,559 | |||||||||||||||||||||||
| Net proved developed and undeveloped reserves of consolidated subsidiaries |
||||||||||||||||||||||||||||||
| January 1, 2009 |
1,644 | 812 | 533 | 2,137 | 1,737 | 713 | 7,576 | — | — | 7,576 | ||||||||||||||||||||
| Revisions |
82 | (610 | )(5) | 93 | (33 | ) | (58 | ) | (63 | ) | (589 | ) | 2,099 | (5) | 715 | 2,225 | ||||||||||||||
| Improved recovery |
— | — | — | — | — | — | — | — | — | — | ||||||||||||||||||||
| Purchases |
— | — | — | — | — | — | — | — | — | — | ||||||||||||||||||||
| Sales |
(1 | ) | — | (2 | ) | — | — | — | (3 | ) | — | — | (3 | ) | ||||||||||||||||
| Extensions/discoveries |
3 | — | — | 53 | 71 | 15 | 142 | — | — | 142 | ||||||||||||||||||||
| Production |
(112 | ) | (30 | ) | (137 | ) | (250 | ) | (104 | ) | (24 | ) | (657 | ) | (44 | ) | (24 | ) | (725 | ) | ||||||||||
| December 31, 2009 |
1,616 | 172 | 487 | 1,907 | 1,646 | 641 | 6,469 | 2,055 | 691 | 9,215 | ||||||||||||||||||||
| Proportional interest in proved reserves of equity companies |
||||||||||||||||||||||||||||||
| January 1, 2009 |
327 | — | 27 | — | 1,335 | 870 | 2,559 | — | — | 2,559 | ||||||||||||||||||||
| Revisions |
56 | — | 5 | — | (13 | ) | (41 | ) | 7 | — | — | 7 | ||||||||||||||||||
| Improved recovery |
— | — | — | — | — | 15 | 15 | — | — | 15 | ||||||||||||||||||||
| Purchases |
— | — | — | — | — | — | — | — | — | — | ||||||||||||||||||||
| Sales |
— | — | — | — | — | — | — | — | — | — | ||||||||||||||||||||
| Extensions/discoveries |
— | — | — | — | — | — | — | — | — | — | ||||||||||||||||||||
| Production |
(27 | ) | — | (2 | ) | — | (74 | ) | (42 | ) | (145 | ) | — | — | (145 | ) | ||||||||||||||
| December 31, 2009 |
356 | — | 30 | — | 1,248 | 802 | 2,436 | — | — | 2,436 | ||||||||||||||||||||
| Total liquids proved reserves at December 31, 2009 |
1,972 | 172 | 517 | 1,907 | 2,894 | 1,443 | 8,905 | 2,055 | 691 | 11,651 | ||||||||||||||||||||
(See footnotes on next page)
99
SUPPLEMENTAL INFORMATION ON OIL AND GAS EXPLORATION AND PRODUCTION ACTIVITIES (unaudited)
Crude Oil, Natural Gas Liquids, Synthetic Oil and Bitumen Proved Reserves (continued)
| Crude Oil and Natural Gas Liquids |
Bitumen |
Synthetic Oil |
Total | |||||||||||||||||
| United States |
Canada/ S. Amer. (1) |
Europe |
Africa |
Asia Pacific/ Middle East |
Russia/ Caspian |
Total |
Canada/ S. Amer. (2) |
Canada/ S. Amer. (3) |
||||||||||||
| (millions of barrels) | ||||||||||||||||||||
| Proved developed reserves, as of January 1, 2007 |
||||||||||||||||||||
| Consolidated subsidiaries |
1,466 | 902 | 557 | 1,279 | 1,090 | 108 | 5,402 | |||||||||||||
| Equity companies |
311 | — | 11 | — | 630 | 544 | 1,496 | |||||||||||||
| Proved developed reserves, as of December 31, 2007 |
||||||||||||||||||||
| Consolidated subsidiaries |
1,327 | 682 | 518 | 1,202 | 1,127 | 91 | 4,947 | |||||||||||||
| Equity companies |
299 | — | 8 | — | 670 | 511 | 1,488 | |||||||||||||
| Proved developed reserves, as of December 31, 2008 |
||||||||||||||||||||
| Consolidated subsidiaries |
1,257 | 580 | 410 | 1,284 | 1,157 | 105 | 4,793 | |||||||||||||
| Equity companies |
264 | — | 9 | — | 807 | 610 | 1,690 | |||||||||||||
| Proved developed reserves, as of December 31, 2009 |
||||||||||||||||||||
| Consolidated subsidiaries |
1,211 | 152 | 376 | 1,122 | 1,335 | 86 | 4,282 | 468 | 691 | 5,441 | ||||||||||
| Equity companies |
279 | — | 10 | — | 1,053 | 555 | 1,897 | — | — | 1,897 | ||||||||||
| Proved undeveloped reserves, as of December 31, 2009 |
||||||||||||||||||||
| Consolidated subsidiaries |
405 | 20 | 111 | 785 | 311 | 555 | 2,187 | 1,587 | — | 3,774 | ||||||||||
| Equity companies |
77 | — | 20 | — | 195 | 247 | 539 | — | — | 539 | ||||||||||
| Total liquids proved reserves at December 31, 2009 |
1,972 | 172 | 517 | 1,907 | 2,894 | 1,443 | 8,905 | 2,055 | 691 | 11,651 | ||||||||||
| (1) | Includes total proved reserves attributable to Imperial Oil Limited of 799 million barrels in 2007, 694 million barrels in 2008 and 63 million barrels in 2009, as well as proved developed reserves of 565 million barrels in 2007, 488 million barrels in 2008 and 62 million barrels in 2009, and in addition, proved undeveloped reserves of 1 million barrels in 2009, in which there is a 30.4 percent noncontrolling interest. |
| (2) | Includes total proved reserves attributable to Imperial Oil Limited of 1,661 million barrels in 2009, as well as proved developed reserves of 468 million barrels in 2009, and in addition, proved undeveloped reserves of 1,193 million barrels in 2009, in which there is a 30.4 percent noncontrolling interest. |
| (3) | Includes total proved reserves attributable to Imperial Oil Limited of 691 million barrels in 2009, as well as proved developed reserves of 691 million barrels in 2009, in which there is a 30.4 percent noncontrolling interest. |
| (4) | Includes 425 million barrels of proved reserves in Venezuela which were expropriated. See note 15, Litigation and Other Contingencies. |
| (5) | Total proved reserves of 630 million barrels at December 31, 2008, associated with the Cold Lake field in Canada are now reported as bitumen reserves under the amended Securities and Exchange Commission’s Rule 4-10 of Regulation S-X. |
100
Natural Gas and Oil-Equivalent Proved Reserves
| Natural Gas |
Oil-Equivalent |
|||||||||||||||||||||||
| United States |
Canada/ S. Amer. (1) |
Europe |
Africa |
Asia Pacific/ Middle East |
Russia/ Caspian |
Total |
Total All Products (2) |
|||||||||||||||||
| (billions of cubic feet) | (millions of oil-equivalent barrels) |
|||||||||||||||||||||||
| Net proved developed and undeveloped reserves of consolidated subsidiaries |
||||||||||||||||||||||||
| January 1, 2007 |
12,049 | 1,984 | 7,089 | 986 | 9,583 | 789 | 32,480 | |||||||||||||||||
| Revisions |
1,566 | 124 | 375 | (22 | ) | 813 | (43 | ) | 2,813 | |||||||||||||||
| Improved recovery |
— | 1 | — | — | — | — | 1 | |||||||||||||||||
| Purchases |
9 | — | — | — | — | — | 9 | |||||||||||||||||
| Sales |
(19 | ) | (231 | )(3) | (70 | ) | — | — | — | (320 | ) | |||||||||||||
| Extensions/discoveries |
208 | 8 | 13 | 81 | — | — | 310 | |||||||||||||||||
| Production |
(641 | ) | (327 | ) | (895 | ) | (39 | ) | (762 | ) | (19 | ) | (2,683 | ) | ||||||||||
| December 31, 2007 |
13,172 | 1,559 | 6,512 | 1,006 | 9,634 | 727 | 32,610 | |||||||||||||||||
| Revisions |
(1,056 | ) | 88 | (193 | ) | (55 | ) | 1,794 | 57 | 635 | ||||||||||||||
| Improved recovery |
— | — | — | — | — | — | — | |||||||||||||||||
| Purchases |
— | — | — | — | — | — | — | |||||||||||||||||
| Sales |
(12 | ) | (17 | ) | (8 | ) | — | — | (24 | ) | (61 | ) | ||||||||||||
| Extensions/discoveries |
229 | 16 | 10 | 12 | 419 | — | 686 | |||||||||||||||||
| Production |
(555 | ) | (263 | ) | (876 | ) | (45 | ) | (710 | ) | (19 | ) | (2,468 | ) | ||||||||||
| December 31, 2008 |
11,778 | 1,383 | 5,445 | 918 | 11,137 | 741 | 31,402 | |||||||||||||||||
| Proportional interest in proved reserves of equity companies |
||||||||||||||||||||||||
| End of year 2007 |
125 | — | 12,341 | — | 21,733 | 1,453 | 35,652 | |||||||||||||||||
| End of year 2008 |
112 | — | 11,839 | — | 21,005 | 1,521 | 34,477 | |||||||||||||||||
| Net proved developed and undeveloped reserves of consolidated subsidiaries |
||||||||||||||||||||||||
| January 1, 2009 |
11,778 | 1,383 | 5,445 | 918 | 11,137 | 741 | 31,402 | 12,810 | ||||||||||||||||
| Revisions |
320 | 248 | 79 | 45 | (936 | ) | (4 | ) | (248 | ) | 2,183 | |||||||||||||
| Improved recovery |
— | — | — | — | — | — | — | — | ||||||||||||||||
| Purchases |
8 | — | — | — | — | — | 8 | 1 | ||||||||||||||||
| Sales |
(10 | ) | (2 | ) | (1 | ) | — | — | — | (13 | ) | (5 | ) | |||||||||||
| Extensions/discoveries |
158 | — | — | — | 5,507 | 11 | 5,676 | 1,088 | ||||||||||||||||
| Production |
(566 | ) | (261 | ) | (800 | ) | (43 | ) | (692 | ) | (21 | ) | (2,383 | ) | (1,122 | ) | ||||||||
| December 31, 2009 |
11,688 | 1,368 | 4,723 | 920 | 15,016 | 727 | 34,442 | 14,955 | ||||||||||||||||
| Proportional interest in proved reserves of equity companies |
||||||||||||||||||||||||
| January 1, 2009 |
112 | — | 11,839 | — | 21,005 | 1,521 | 34,477 | 8,305 | ||||||||||||||||
| Revisions |
8 | — | 186 | — | 229 | (40 | ) | 383 | 71 | |||||||||||||||
| Improved recovery |
— | — | — | — | — | — | — | 15 | ||||||||||||||||
| Purchases |
— | — | — | — | — | — | — | — | ||||||||||||||||
| Sales |
— | — | — | — | — | — | — | — | ||||||||||||||||
| Extensions/discoveries |
— | — | 18 | — | — | — | 18 | 3 | ||||||||||||||||
| Production |
(6 | ) | — | (593 | ) | — | (661 | ) | (53 | ) | (1,313 | ) | (364 | ) | ||||||||||
| December 31, 2009 |
114 | — | 11,450 | — | 20,573 | 1,428 | 33,565 | 8,030 | ||||||||||||||||
| Total proved reserves at December 31, 2009 |
11,802 | 1,368 | 16,173 | 920 | 35,589 | 2,155 | 68,007 | 22,985 | ||||||||||||||||
(See footnotes on next page)
101
SUPPLEMENTAL INFORMATION ON OIL AND GAS EXPLORATION AND PRODUCTION ACTIVITIES (unaudited)
Natural Gas and Oil-Equivalent Proved Reserves (continued)
| Natural Gas |
Oil-Equivalent | |||||||||||||||
| United States |
Canada/ S. Amer. (1) |
Europe |
Africa |
Asia Pacific/ Middle East |
Russia/ Caspian |
Total |
Total All Products (2) | |||||||||
| (billions of cubic feet) | (millions of oil-equivalent barrels) | |||||||||||||||
| Proved developed reserves, as of January 1, 2007 |
||||||||||||||||
| Consolidated subsidiaries |
9,280 | 1,628 | 5,346 | 823 | 5,882 | 447 | 23,406 | |||||||||
| Equity companies |
109 | — | 9,985 | — | 7,906 | 811 | 18,811 | |||||||||
| Proved developed reserves, as of December 31, 2007 |
||||||||||||||||
| Consolidated subsidiaries |
8,373 | 1,303 | 5,064 | 773 | 5,570 | 395 | 21,478 | |||||||||
| Equity companies |
104 | — | 9,679 | — | 8,702 | 757 | 19,242 | |||||||||
| Proved developed reserves, as of December 31, 2008 |
||||||||||||||||
| Consolidated subsidiaries |
7,835 | 1,148 | 4,426 | 738 | 6,241 | 362 | 20,750 | |||||||||
| Equity companies |
96 | — | 9,284 | — | 11,755 | 864 | 21,999 | |||||||||
| Proved developed reserves, as of December 31, 2009 |
||||||||||||||||
| Consolidated subsidiaries |
7,492 | 1,200 | 3,920 | 739 | 8,351 | 318 | 22,020 | 9,111 | ||||||||
| Equity companies |
90 | — | 8,862 | — | 16,978 | 821 | 26,751 | 6,356 | ||||||||
| Proved undeveloped reserves, as of December 31, 2009 |
||||||||||||||||
| Consolidated subsidiaries |
4,196 | 168 | 803 | 181 | 6,665 | 409 | 12,422 | 5,844 | ||||||||
| Equity companies |
24 | — | 2,588 | — | 3,595 | 607 | 6,814 | 1,674 | ||||||||
| Total proved reserves at December 31, 2009 |
11,802 | 1,368 | 16,173 | 920 | 35,589 | 2,155 | 68,007 | 22,985 | ||||||||
| (1) | Includes total proved reserves attributable to Imperial Oil Limited of 635 billion cubic feet in 2007, 593 billion cubic feet in 2008 and 590 billion cubic feet in 2009, as well as proved developed reserves of 539 billion cubic feet in 2007, 513 billion cubic feet in 2008 and 526 billion cubic feet in 2009, and in addition, proved undeveloped reserves of 64 billion cubic feet in 2009, in which there is a 30.4 percent noncontrolling interest. |
| (2) | Natural gas is converted to oil-equivalent basis at six million cubic feet per one thousand barrels. |
| (3) | Includes 219 billion cubic feet of proved reserves in Venezuela which were expropriated. See note 15, Litigation and Other Contingencies. |
102
Standardized Measure of Discounted Future Cash Flows
As required by the Financial Accounting Standards Board, the standardized measure of discounted future net cash flows was computed through 2008 by applying year-end prices, costs and legislated tax rates and a discount factor of 10 percent to net proved reserves. Beginning in 2009, the standardized measure of discounted future net cash flow is computed by applying first-day-of-the-month average prices, year-end costs and legislated tax rates and a discount factor of 10 percent to proved reserves. The standardized measure includes costs for future dismantlement, abandonment and rehabilitation obligations. The Corporation believes the standardized measure does not provide a reliable estimate of the Corporation’s expected future cash flows to be obtained from the development and production of its oil and gas properties or of the value of its proved oil and gas reserves. The standardized measure is prepared on the basis of certain prescribed assumptions including first-day-of-the-month average prices, which represent discrete points in time and therefore may cause significant variability in cash flows from year to year as prices change.
| Standardized Measure of Discounted Future Cash Flows |
United States |
Canada/ South America (1) |
Europe |
Africa |
Asia Pacific/ Middle East |
Russia/ Caspian |
Total | ||||||||||||||||
| (millions of dollars) | |||||||||||||||||||||||
| Consolidated Subsidiaries |
|||||||||||||||||||||||
| As of December 31, 2007 |
|||||||||||||||||||||||
| Future cash inflows from sales of oil and gas |
$ | 216,287 | $ | 49,985 | $ | 115,741 | $ | 184,358 | $ | 162,727 | $ | 64,351 | $ | 793,449 | |||||||||
| Future production costs |
59,154 | 17,422 | 21,356 | 34,721 | 38,343 | 6,537 | 177,533 | ||||||||||||||||
| Future development costs |
18,950 | 5,487 | 10,166 | 13,983 | 6,321 | 7,513 | 62,420 | ||||||||||||||||
| Future income tax expenses |
61,100 | 7,383 | 54,065 | 81,846 | 83,293 | 13,387 | 301,074 | ||||||||||||||||
| Future net cash flows |
$ | 77,083 | $ | 19,693 | $ | 30,154 | $ | 53,808 | $ | 34,770 | $ | 36,914 | $ | 252,422 | |||||||||
| Effect of discounting net cash flows at 10% |
46,719 | 7,607 | 9,515 | 20,244 | 16,229 | 25,935 | 126,249 | ||||||||||||||||
| Discounted future net cash flows |
$ | 30,364 | $ | 12,086 | $ | 20,639 | $ | 33,564 | $ | 18,541 | $ | 10,979 | $ | 126,173 | |||||||||
| Proportional interest in standardized measure of discounted future net cash flows related to proved reserves of equity companies |
$ | 12,045 | $ | — | $ | 11,041 | $ | — | $ | 53,067 | $ | 18,365 | $ | 94,518 | |||||||||
| Consolidated Subsidiaries |
|||||||||||||||||||||||
| As of December 31, 2008 |
|||||||||||||||||||||||
| Future cash inflows from sales of oil and gas |
$ | 104,441 | $ | 22,952 | $ | 71,879 | $ | 74,426 | $ | 70,026 | $ | 20,725 | $ | 364,449 | |||||||||
| Future production costs |
44,230 | 13,113 | 19,485 | 24,403 | 23,018 | 5,142 | 129,391 | ||||||||||||||||
| Future development costs |
19,828 | 6,156 | 8,765 | 16,064 | 5,717 | 7,913 | 64,443 | ||||||||||||||||
| Future income tax expenses |
17,857 | 961 | 24,729 | 16,870 | 24,932 | 2,203 | 87,552 | ||||||||||||||||
| Future net cash flows |
$ | 22,526 | $ | 2,722 | $ | 18,900 | $ | 17,089 | $ | 16,359 | $ | 5,467 | $ | 83,063 | |||||||||
| Effect of discounting net cash flows at 10% |
13,107 | (239 | ) | 7,602 | 8,052 | 8,222 | 5,750 | 42,494 | |||||||||||||||
| Discounted future net cash flows |
$ | 9,419 | $ | 2,961 | $ | 11,298 | $ | 9,037 | $ | 8,137 | $ | (283 | ) | $ | 40,569 | ||||||||
| Proportional interest in standardized measure of discounted future net cash flows related to proved reserves of equity companies |
$ | 2,354 | $ | — | $ | 12,507 | $ | — | $ | 25,494 | $ | 5,094 | $ | 45,449 | |||||||||
| (1) | Includes discounted future net cash flows attributable to Imperial Oil Limited of $6,304 million in 2007 and $1,033 million in 2008, in which there is a 30.4 percent noncontrolling interest. |
103
SUPPLEMENTAL INFORMATION ON OIL AND GAS EXPLORATION AND PRODUCTION ACTIVITIES (unaudited)
| Standardized Measure of Discounted Future Cash Flows (continued) |
United States |
Canada/ South America (1) |
Europe |
Africa |
Asia Pacific/ Middle East |
Russia/ Caspian |
Total | ||||||||||||||
| (millions of dollars) | |||||||||||||||||||||
| Consolidated Subsidiaries |
|||||||||||||||||||||
| As of December 31, 2009 |
|||||||||||||||||||||
| Future cash inflows from sales of oil and gas |
$ | 112,408 | $ | 147,597 | $ | 54,074 | $ | 110,475 | $ | 127,445 | $ | 32,792 | $ | 584,791 | |||||||
| Future production costs |
47,660 | 62,241 | 16,412 | 28,679 | 36,133 | 6,207 | 197,332 | ||||||||||||||
| Future development costs |
15,544 | 25,738 | 12,565 | 15,155 | 15,986 | 5,925 | 90,913 | ||||||||||||||
| Future income tax expenses |
22,058 | 14,572 | 16,065 | 32,784 | 46,428 | 4,597 | 136,504 | ||||||||||||||
| Future net cash flows |
$ | 27,146 | $ | 45,046 | $ | 9,032 | $ | 33,857 | $ | 28,898 | $ | 16,063 | $ | 160,042 | |||||||
| Effect of discounting net cash flows at 10% |
15,563 | 31,980 | 2,569 | 14,192 | 18,077 | 11,815 | 94,196 | ||||||||||||||
| Discounted future net cash flows |
$ | 11,583 | $ | 13,066 | $ | 6,463 | $ | 19,665 | $ | 10,821 | $ | 4,248 | $ | 65,846 | |||||||
| Equity Companies |
|||||||||||||||||||||
| As of December 31, 2009 |
|||||||||||||||||||||
| Future cash inflows from sales of oil and gas |
$ | 19,705 | $ | — | $ | 94,401 | $ | — | $ | 143,281 | $ | 36,972 | $ | 294,359 | |||||||
| Future production costs |
5,847 | — | 60,869 | — | 48,562 | 5,931 | 121,209 | ||||||||||||||
| Future development costs |
2,862 | — | 3,220 | — | 537 | 2,222 | 8,841 | ||||||||||||||
| Future income tax expenses |
— | — | 12,003 | — | 36,934 | 7,799 | 56,736 | ||||||||||||||
| Future net cash flows |
$ | 10,996 | $ | — | $ | 18,309 | $ | — | $ | 57,248 | $ | 21,020 | $ | 107,573 | |||||||
| Effect of discounting net cash flows at 10% |
6,332 | — | 9,845 | — | 30,693 | 11,393 | 58,263 | ||||||||||||||
| Discounted future net cash flows |
$ | 4,664 | $ | — | $ | 8,464 | $ | — | $ | 26,555 | $ | 9,627 | $ | 49,310 | |||||||
| Total consolidated and equity interests in standardized measure of discounted future net cash flows |
$ | 16,247 | $ | 13,066 | $ | 14,927 | $ | 19,665 | $ | 37,376 | $ | 13,875 | $ | 115,156 | |||||||
| (1) | Includes discounted future net cash flows attributable to Imperial Oil Limited of $10,088 million in 2009, in which there is a 30.4 percent noncontrolling interest. |
104
Change in Standardized Measure of Discounted Future Net Cash Flows Relating to Proved Oil and Gas Reserves
| Consolidated Subsidiaries |
2008 |
2007 |
||||||
| (millions of dollars) | ||||||||
| Prior year-end total of discounted future net cash flows |
$ | 126,173 | $ | 88,295 | ||||
| Value of reserves added during the year due to extensions, discoveries, improved recovery and net purchases less related costs |
(303 | ) | (1,680 | )(1) | ||||
| Changes in value of previous-year reserves due to: |
||||||||
| Sales and transfers of oil and gas produced during the year, net of production (lifting) costs |
(62,685 | ) | (51,093 | ) | ||||
| Development costs incurred during the year |
11,649 | 9,668 | ||||||
| Net change in prices, lifting and development costs |
(178,960 | ) | 112,237 | |||||
| Revisions of previous reserves estimates |
7,652 | 15,571 | ||||||
| Accretion of discount |
21,463 | 15,632 | ||||||
| Net change in income taxes |
115,580 | (62,457 | ) | |||||
| Total change in the standardized measure during the year for consolidated subsidiaries |
$ | (85,604 | ) | $ | 37,878 | |||
| Current year-end total of discounted future net cash flows |
$ | 40,569 | $ | 126,173 | ||||
| (1) | Includes impact of expropriation of proved reserves in Venezuela. See note 15, Litigation and Other Contingencies. |
Change in Standardized Measure of Discounted Future Net Cash Flows Relating to Proved Oil and Gas Reserves
| Consolidated and Equity Interests
|
2009 |
|||||||||||
| Consolidated Subsidiaries |
Share of Equity Method Investees |
Total Consolidated and Equity Interests |
||||||||||
| (millions of dollars) | ||||||||||||
| Discounted future net cash flows as of December 31, 2008 |
$ | 40,569 | $ | 45,449 | $ | 86,018 | ||||||
| Value of reserves added during the year due to extensions, discoveries, improved recovery and net purchases less related costs |
2,138 | 280 | 2,418 | |||||||||
| Changes in value of previous-year reserves due to: |
||||||||||||
| Sales and transfers of oil and gas produced during the year, net of production (lifting) costs |
(35,384 | ) | (10,288 | ) | (45,672 | ) | ||||||
| Development costs incurred during the year |
13,549 | 1,017 | 14,566 | |||||||||
| Net change in prices, lifting and development costs |
51,627 | 9,245 | 60,872 | |||||||||
| Revisions of previous reserves estimates |
8,805 | 858 | 9,663 | |||||||||
| Accretion of discount |
6,943 | 5,214 | 12,157 | |||||||||
| Net change in income taxes |
(22,401 | ) | (2,465 | ) | (24,866 | ) | ||||||
| Total change in the standardized measure during the year |
$ | 25,277 | $ | 3,861 | $ | 29,138 | (1)(2) | |||||
| Discounted future net cash flows as of December 31, 2009 |
$ | 65,846 | $ | 49,310 | $ | 115,156 | ||||||
| (1) | Discounted future net cash flows associated with synthetic oil reserves and bitumen mining operations in 2009 were $5,268 million. Cold Lake bitumen operations had been included in discounted future net cash flows in previous years as an oil and gas operation. |
| (2) | The estimated impact of adopting the reliable technology definition and changing from year-end price to first-day-of-the-month average prices in the Securities and Exchange Commission’s Rule 4-10 of Regulation S-X was de minimis on discounted future net cash flows for consolidated and equity subsidiaries in 2009. |
105
| 2009 |
2008 |
2007 |
2006 |
2005 | ||||||
| (thousands of barrels daily) | ||||||||||
| Production of crude oil, natural gas liquids, synthetic oil and bitumen |
||||||||||
| Net production |
||||||||||
| United States |
384 | 367 | 392 | 414 | 477 | |||||
| Canada/South America |
267 | 292 | 324 | 354 | 395 | |||||
| Europe |
379 | 428 | 480 | 520 | 546 | |||||
| Africa |
685 | 652 | 717 | 781 | 666 | |||||
| Asia Pacific/Middle East |
490 | 506 | 518 | 485 | 332 | |||||
| Russia/Caspian |
182 | 160 | 185 | 127 | 107 | |||||
| Worldwide |
2,387 | 2,405 | 2,616 | 2,681 | 2,523 | |||||
| (millions of cubic feet daily) | ||||||||||
| Natural gas production available for sale |
||||||||||
| Net production |
||||||||||
| United States |
1,275 | 1,246 | 1,468 | 1,625 | 1,739 | |||||
| Canada/South America |
643 | 640 | 808 | 935 | 1,006 | |||||
| Europe |
3,689 | 3,949 | 3,810 | 4,086 | 4,315 | |||||
| Africa |
19 | 32 | 26 | – | – | |||||
| Asia Pacific/Middle East |
3,494 | 3,114 | 3,162 | 2,596 | 2,114 | |||||
| Russia/Caspian |
153 | 114 | 110 | 92 | 77 | |||||
| Worldwide |
9,273 | 9,095 | 9,384 | 9,334 | 9,251 | |||||
| (thousands of oil-equivalent barrels daily) | ||||||||||
| Oil-equivalent production (1) |
3,932 | 3,921 | 4,180 | 4,237 | 4,065 | |||||
| (thousands of barrels daily) | ||||||||||
| Refinery throughput |
||||||||||
| United States |
1,767 | 1,702 | 1,746 | 1,760 | 1,794 | |||||
| Canada |
413 | 446 | 442 | 442 | 466 | |||||
| Europe |
1,548 | 1,601 | 1,642 | 1,672 | 1,672 | |||||
| Asia Pacific |
1,328 | 1,352 | 1,416 | 1,434 | 1,490 | |||||
| Other Non-U.S. |
294 | 315 | 325 | 295 | 301 | |||||
| Worldwide |
5,350 | 5,416 | 5,571 | 5,603 | 5,723 | |||||
| Petroleum product sales (2) |
||||||||||
| United States |
2,523 | 2,540 | 2,717 | 2,729 | 2,822 | |||||
| Canada |
413 | 444 | 461 | 473 | 498 | |||||
| Europe |
1,625 | 1,712 | 1,773 | 1,813 | 1,824 | |||||
| Asia Pacific and other Eastern Hemisphere |
1,588 | 1,646 | 1,701 | 1,763 | 1,902 | |||||
| Latin America |
279 | 419 | 447 | 469 | 473 | |||||
| Worldwide |
6,428 | 6,761 | 7,099 | 7,247 | 7,519 | |||||
| Gasoline, naphthas |
2,573 | 2,654 | 2,850 | 2,866 | 2,957 | |||||
| Heating oils, kerosene, diesel oils |
2,013 | 2,096 | 2,094 | 2,191 | 2,230 | |||||
| Aviation fuels |
536 | 607 | 641 | 651 | 676 | |||||
| Heavy fuels |
598 | 636 | 715 | 682 | 689 | |||||
| Specialty petroleum products |
708 | 768 | 799 | 857 | 967 | |||||
| Worldwide |
6,428 | 6,761 | 7,099 | 7,247 | 7,519 | |||||
| (thousands of metric tons) | ||||||||||
| Chemical prime product sales |
||||||||||
| United States |
9,649 | 9,526 | 10,855 | 10,703 | 10,369 | |||||
| Non-U.S. |
15,176 | 15,456 | 16,625 | 16,647 | 16,408 | |||||
| Worldwide |
24,825 | 24,982 | 27,480 | 27,350 | 26,777 | |||||
Operating statistics include 100 percent of operations of majority-owned subsidiaries; for other companies, crude production, gas, petroleum product and chemical prime product sales include ExxonMobil’s ownership percentage and refining throughput includes quantities processed for ExxonMobil. Net production excludes royalties and quantities due others when produced, whether payment is made in kind or cash.
| (1) | Gas converted to oil-equivalent at 6 million cubic feet = 1 thousand barrels. |
| (2) | Petroleum product sales data reported net of purchases/sales contracts with the same counterparty. |
106
PROXY INFORMATION SECTION
TABLE OF CONTENTS
| 108 | ||
| 108 | ||
| 109 | ||
| 110 | ||
| 111 | ||
| 113 | ||
| 115 | ||
| 117 | ||
| 117 | ||
| 118 | ||
| 118 | ||
| 119 | ||
| 120 | ||
| 136 | ||
107
The Board has adopted guidelines outlining the qualifications sought when considering non-employee director candidates and they are published on our Web site at exxonmobil.com/governance.
In part, the guidelines describe the necessary experiences and skills expected of director candidates as follows:
“Candidates for non-employee director of Exxon Mobil Corporation should be individuals who have achieved prominence in their fields, with experience and demonstrated expertise in managing large, relatively complex organizations, and/or, in a professional or scientific capacity, be accustomed to dealing with complex situations preferably those with worldwide scope.”
The key criteria the Board seeks across its membership to achieve a balance of experiences important to the Corporation include: financial expertise; experience as the CEO of a significant company or organization or as a next-level executive with responsibilities for global operations; experience managing large, complex organizations; experience on one or more boards of significant public or non-profit organizations; and expertise resulting from significant academic, scientific or research activities.
The table below describes the particular experience, qualifications, attributes, and skills of each director that led the Board to conclude that such person should serve as a director of the Company.
| M.J. Boskin | • Public finance, tax, budget and macroeconomic policy experience as senior fellow at the Hoover Institution and the T.M. Friedman Professor of Economics at Stanford University
• Financial expertise
• Government/research experience as chairman of the President’s Council of Economic Advisors and an associate at the National Bureau of Economic Research
• Experience advising the federal government, heads of state, finance ministries, and central banks around the world
• Outside board experience as a director of Oracle, Shinsei Bank, and the Vodaphone Group | |
| L.R. Faulkner | • Leadership position as president of the Houston Endowment
• Leadership experience as President of the University of Texas at Austin
• Financial expertise
• Academic/administration experience at major universities such as the University of Illinois and Harvard University
• Expertise in chemistry, electrochemistry, and materials
• Outside board experience as a director of Temple-Inland and Guaranty Financial Group
• Recognition by the American Academy of Arts and Sciences and leadership of the National Mathematics Advisory Panel | |
| K.C. Frazier | • Global leadership position as executive vice president and president of Global Human Health at Merck & Co.
• Affiliation with leading legal, business and public policy associations (the Council on Foreign Relations, the American Law Institute, and the European Federation of Pharmaceutical Industries and Associations)
• Outside board experience at non-profit organizations
• Recipient of award for extraordinary achievement in pro bono and public service | |
| W.W. George | • Global business experience as former chairman, president, and chief executive officer at Medtronic
• Leadership position as professor of management practice at Harvard University
• Academic experience at Harvard Business School and Yale School of Management
• Outside board experience as a director of Goldman Sachs, Novartis, and Target
• Authorship of books and articles on leadership and corporate governance |
108
| R.C. King | • Global business experience as vice president at General Mills
• Leadership experience as former chairman of the board of trustees of General Mills Foundation
• Chemical research, education, and academic administration background
• Outside board experience at Lennox Group and Wells Fargo | |
| M.C. Nelson | • Global business experience as chairman and chief executive officer at Carlson
• Recipient of leadership awards from Forbes magazine and U.S. News and World Report
• Outside board experience at Carlson and as a director of Rezidor
• Affiliation with leading business associations (the World Economic Forum’s International Business Council, the National Women’s Business Council, the World Travel and Tourism Council, the Foreign Policy Association, and the Business Roundtable) | |
| S.J. Palmisano | • Global business experience as chairman, president, and chief executive officer of IBM
• Outside board experience at IBM
• Affiliation with leading business and public policy associations (Business Roundtable and the Executive Committee of the Council on Competitiveness)
• Awarded honorary fellowship from the London Business School | |
| S.S Reinemund | • Global business experience as former chairman, president, and chief executive officer of PepsiCo
• Leadership position as dean of business at Wake Forest University
• Academic experience as professor of leadership and strategy at Wake Forest University
• Financial expertise
• Outside board experience as a director of American Express, Marriott, and Johnson & Johnson
• Affiliation with leading charitable and business associations (United States Naval Academy Foundation, National Minority Supplier Development Council, and National Advisory Board of the Salvation Army) | |
| R.W. Tillerson | • Global business experience as chairman and chief executive officer of ExxonMobil since January of 2006 with demonstrated leadership skills resulting from a more than 34-year career involving positions of increasing responsibility with the Company’s domestic and international business operations
• Affiliation with leading business and public policy associations (the Executive Committee and the Policy Committee of the American Petroleum Institute, the Center for Strategic and International Studies, the National Petroleum Council, the Business Council, the Business Roundtable and its Energy Task Force, the Business Council for International Understanding, and the Emergency Committee for American Trade)
• Leadership as a member of the Executive Board of the Boy Scouts of America, a director of the United Negro College Fund, and vice-chairman of the Ford’s Theatre Society | |
| E.E. Whitacre, Jr. | • Global business experience as chairman and chief executive officer of General Motors Company
• Global business experience as former chairman and chief executive officer of AT&T and SBC Communications
• Outside board experience at General Motors and as a director of Burlington Northern Santa Fe and Anheuser Busch
• Affiliation with leading business and community organizations (Institute for International Economics, the Business Council, Boy Scouts of America, Board of Regents of Texas Tech University, and the United Way) |
Our Corporate Governance Guidelines require that a substantial majority of the Board consist of independent directors. In general the Guidelines require that an independent director must have no material relationship with ExxonMobil, directly or indirectly, except as a director. The Board determines independence on the basis of the standards specified by the New York Stock Exchange (NYSE), the additional standards referenced in our Corporate Governance Guidelines, and other facts and circumstances the Board considers relevant.
Under ExxonMobil’s Corporate Governance Guidelines, a director will not be independent if a reportable
109
“related person transaction” exists with respect to that director or a member of the director’s family for the current or most recently completed fiscal year. See the Guidelines for Review of Related Person Transactions posted on the Corporate Governance section of our Web site and described in more detail under “Related Person Transactions and Procedures” on pages 111-112.
The Board has reviewed relevant relationships between ExxonMobil and each non-employee director and director nominee to determine compliance with the NYSE standards and ExxonMobil’s additional standards. The Board has also evaluated whether there are any other facts or circumstances that might impair a director’s independence. Based on that review, the Board has determined that all ExxonMobil non-employee directors and director nominees are independent. The Board has also determined that each member of the Audit, Board Affairs, Compensation, and Public Issues and Contributions Committees is independent.
In recommending that each director and nominee be found independent, the Board Affairs Committee reviewed the following transactions, relationships, or arrangements. All matters described below fall within the NYSE and ExxonMobil independence standards.
| Name | Matters Considered | |
| K.C. Frazier | Ordinary course business with Merck (purchases of pharmaceuticals; sales of chemicals and oils) | |
| M.C. Nelson | Ordinary course business with Carlson (purchases of travel, hotel, and event services; sales of lubricants) | |
| S.J. Palmisano | Ordinary course business with IBM (purchases of consulting and IT maintenance services) | |
| E.E. Whitacre, Jr. | Ordinary course business with General Motors (purchases of fleet vehicles; sales of lubricants, plastics, and specialty chemicals) |
Code of Ethics and Business Conduct
The Board maintains policies and procedures (which we refer to as the “Code”) that represent both the code of ethics for the principal executive officer, principal financial officer, and principal accounting officer under SEC rules, and the code of business conduct and ethics for directors, officers, and employees under NYSE listing standards. The Code applies to all directors, officers, and employees. The Code includes a Conflicts of Interest Policy under which directors, officers, and employees are expected to avoid any actual or apparent conflict between their own personal interests and the interests of the Corporation.
The Code is posted on the ExxonMobil Web site at exxonmobil.com/governance. The Code is also included as an exhibit to our Annual Report on Form 10-K. Any amendment of the Code will be posted promptly on our Web site.
The Corporation maintains procedures for administering and reviewing potential issues under the Code, including procedures that allow employees to make complaints without identifying themselves. The Corporation also conducts periodic mandatory business practice training sessions and requires each regular employee and non-employee director to make an annual compliance certification.
The Board Affairs Committee will initially review any suspected violation of the Code involving an executive officer or director and will report its findings to the Board. The Board does not envision that any waiver of the Code will be granted. Should such a waiver occur, it will be promptly disclosed on our Web site.
110
Related Person Transactions and Procedures
In accordance with SEC rules, ExxonMobil maintains Guidelines for Review of Related Person Transactions. These Guidelines are available on the Corporate Governance section of our Web site.
In accordance with the Related Person Transaction Guidelines, all executive officers, directors, and director nominees are required to identify, to the best of their knowledge after reasonable inquiry, business and financial affiliations involving themselves or their immediate family members that could reasonably be expected to give rise to a reportable related person transaction. Covered persons must also advise the Secretary of the Corporation promptly of any change in the information provided, and will be asked periodically to review and re-affirm their information.
For the above purposes, “immediate family member” includes a person’s spouse, parents, siblings, children, in-laws, and step-relatives.
Based on this information, we review the Company’s own records and make follow-up inquiries as may be necessary to identify potentially reportable transactions. A report summarizing such transactions and including a reasonable level of detail is then provided to the Board Affairs Committee. The Committee oversees the Related Person Transaction Guidelines generally and reviews specific items to assess materiality.
In assessing materiality for this purpose, information will be considered material if, in light of all the circumstances, there is a substantial likelihood a reasonable investor would consider the information important in deciding whether to buy or sell ExxonMobil stock or in deciding how to vote shares of ExxonMobil stock. A director will abstain from the decision on any transactions involving that director or his or her immediate family members.
Under SEC rules, certain transactions are deemed not to involve a material interest (including transactions in which the amount involved in any 12-month period is less than $120,000 and transactions with entities where a related person’s interest is limited to service as a non-employee director). In addition based on a consideration of ExxonMobil’s facts and circumstances, the Committee will presume that the following transactions do not involve a material interest for purposes of reporting under SEC rules:
| • | Transactions in the ordinary course of business with an entity for which a related person serves as an executive officer, provided (1) the affected director or executive officer did not participate in the decision on the part of ExxonMobil to enter into such transactions; and, (2) the amount involved in any related category of transactions in a 12-month period is less than 1 percent of the entity’s gross revenues. |
| • | Grants or membership payments in the ordinary course of business to nonprofit organizations, provided (1) the affected director or executive officer did not participate in the decision on the part of ExxonMobil to make such payments; and, (2) the amount of general-purpose grants in a 12-month period is less than 1 percent of the recipient’s gross revenues. |
| • | Payments under ExxonMobil plans and arrangements that are available generally to U.S. salaried employees (including contributions under the ExxonMobil Foundation’s Educational and Cultural Matching Gift Programs and payments to providers under ExxonMobil health care plans). |
| • | Employment by ExxonMobil of a family member of an executive officer, provided the executive officer does not participate in decisions regarding the hiring, performance evaluation, or compensation of the family member. |
111
Transactions or relationships not covered by the above standards will be assessed by the Committee on the basis of the specific facts and circumstances.
The following disclosures are made as of February 24, 2010, the date of the most recent Board Affairs Committee review of potential related person transactions.
ExxonMobil and its affiliates have about 81,000 employees around the world and employees related by birth or marriage may be found at all levels of the organization. The spouse of T.R. Walters, a Vice President of the Corporation, retired from ExxonMobil in 2009. Excluding pension and other retirement-related distributions, her partial-year compensation was less than $120,000.
ExxonMobil employees do not receive preferential treatment by reason of being related to an executive officer, and executive officers do not participate in hiring, performance evaluation, or compensation decisions for family members. ExxonMobil’s employment guidelines state: “Relatives of Company employees may be employed on a non-preferential basis. However an employee should not be employed by or assigned to work under the direct supervision of a relative, or to report to a supervisor who in turn reports to a relative of the employee.” Accordingly, consistent with ExxonMobil’s Related Person Transaction Guidelines, we do not consider the relationship noted above to be material within the meaning of the related person transaction disclosure rules.
P.T. Mulva (Vice President and Controller) has a brother currently serving as Chairman and CEO of ConocoPhillips. As is the case with most other major companies in the oil and gas industry, ExxonMobil has a variety of business transactions with ConocoPhillips. These transactions include routine purchases and sales of crude oil, petroleum products, and pipeline transportation capacity. Affiliates of ExxonMobil and ConocoPhillips have joint ownership of a refinery in Germany and a number of pipelines, terminals, emergency response companies, and service companies, and also have undivided interests in a variety of exploration, development, and production projects. All of these transactions are entered into in the ordinary course of business without influence from P.T. Mulva. Neither P.T. Mulva nor, to our knowledge after reasonable inquiry, his brother, has any interest in these transactions different from the general interest of other employees and shareholders. Accordingly, consistent with ExxonMobil’s Related Person Transaction Guidelines, we do not consider these transactions to be material within the meaning of the related person transaction disclosure rules.
S.R. LaSala (retired Vice President and General Tax Counsel) has a son who is a partner of a law firm that performs work for ExxonMobil. Mr. LaSala is not involved in decisions to retain the firm, and, therefore, we do not consider the relationship to be material within the meaning of the related person transaction disclosure rules.
S.J. Glass, Jr. (Vice President) has a brother who is a partner of a law firm that performs work for ExxonMobil. Mr. Glass is not involved in decisions to retain the firm, and, therefore, we do not consider the relationship to be material within the meaning of the related person transaction disclosure rules.
The Board Affairs Committee also reviewed ExxonMobil’s ordinary course business with companies for which non-employee directors serve as executive officers and determined that, in accordance with the categorical standards described above, none of those matters represent reportable related person transactions. See “Director Independence” on page 109.
We are not aware of any related person transaction required to be reported under applicable SEC rules since the beginning of the last fiscal year where our policies and procedures did not require review, or where such policies and procedures were not followed.
The Corporation’s Related Person Transaction Guidelines are intended to assist the Corporation in complying with its disclosure obligations under SEC rules. These procedures are in addition to, not in lieu of, the Corporation’s Code of Ethics and Business Conduct.
112
| Michael J. Boskin
Age 64 Director since 1996 |
Principal Occupation: T.M. Friedman Professor of Economics and Senior Fellow, Hoover Institution, Stanford University
Business Experience: Dr. Boskin is also a Research Associate, National Bureau of Economic Research. He is Chief Executive Officer and President of Boskin & Co., an economic consulting company.
Current Public Company Directorships: Oracle Past Public Company Directorships: Shinsei Bank; Vodafone | |
| Larry R. Faulkner
Age 65 Director since 2008 |
Principal Occupation: President, Houston Endowment; President Emeritus, the University of Texas at Austin
Business Experience: Dr. Faulkner served as President of the University of Texas at Austin from 1998 to 2006. He also served on the chemistry faculties of the University of Texas, the University of Illinois, and Harvard University. At the University of Illinois, he also held a number of positions in academic administration including Provost and Vice Chancellor for Academic Affairs.
Current Public Company Directorships: Temple-Inland Past Public Company Directorships: Guaranty Financial Group | |
| Kenneth C. Frazier
Age 55 Director since 2009 |
Principal Occupation: Executive Vice President and President, Global Human Health, Merck & Co.
Business Experience: Mr. Frazier was elected Executive Vice President and President, Global Human Health, at Merck in 2007, and Executive Vice President and General Counsel in 2006. He served as Senior Vice President and General Counsel at Merck from 1999 to 2006.
Current Public Company Directorships: None Past Public Company Directorships: None | |
| William W. George
Age 67 Director since 2005 |
Principal Occupation: Professor of Management Practice, Harvard University
Business Experience: Mr. George was elected Chairman of Medtronic in 1996, and retired in 2002; Chief Executive Officer in 1991; and President and Chief Operating Officer in 1989.
Current Public Company Directorships: Goldman Sachs Past Public Company Directorships: Novartis; Target | |
113
| Reatha Clark King
Age 71 Director since 1997 |
Principal Occupation: Former Chairman, Board of Trustees, General Mills Foundation
Business Experience: Dr. King was elected Chairman, Board of Trustees, General Mills Foundation in 2002, and retired in 2003; President and Executive Director, General Mills Foundation; and Vice President, General Mills, Inc. from 1988 to 2002. Prior to joining the General Mills Foundation, Dr. King held a variety of positions in chemical research, education, and academic administration.
Current Public Company Directorships: None Past Public Company Directorships: Lenox Group; Wells Fargo | |
| Marilyn Carlson Nelson
Age 70 Director since 1991 |
Principal Occupation: Chairman of the Board, Carlson
Business Experience: Mrs. Nelson was elected Chairman and Chief Executive Officer of Carlson in 1998, and relinquished the role of CEO in 2008. She has held a number of other management positions at Carlson including President, Chief Operating Officer, Vice Chair, and Senior Vice President.
Current Company Directorships: Carlson Past Public Company Directorships: Rezidor | |
| Samuel J. Palmisano
Age 58 Director since 2006 Presiding Director since 2008 |
Principal Occupation: Chairman of the Board, President, and Chief Executive Officer, IBM
Business Experience: Mr. Palmisano was elected Chairman, President, and Chief Executive Officer of IBM in 2003. Mr. Palmisano also served as President, Senior Vice President, and Group Executive for IBM’s Enterprise Systems Group, IBM Global Services, and IBM’s Personal Systems Group.
Current Public Company Directorships: IBM Past Public Company Directorships: None | |
| Steven S Reinemund
Age 61 Director since 2007 |
Principal Occupation: Dean of Business, Wake Forest University
Business Experience: Mr. Reinemund served as Executive Chairman of the Board of PepsiCo from 2006 to 2007, and retired in 2007; was elected Chief Executive Officer and Chairman of the Board in 2001; President and Chief Operating Officer in 1999; and Director in 1996. He was also elected President and CEO of Frito-Lay in 1992 and Pizza Hut in 1986.
Current Public Company Directorships: American Express; Marriott Past Public Company Directorships: Johnson & Johnson; PepsiCo | |
114
| Rex W. Tillerson
Age 57 Director since 2004 |
Principal Occupation: Chairman of the Board and Chief Executive Officer, Exxon Mobil Corporation
Business Experience: Mr. Tillerson was elected Chairman and Chief Executive Officer of ExxonMobil in 2006; President and Director in 2004; and Senior Vice President in 2001. Mr. Tillerson has held a variety of management positions in domestic and foreign operations since joining the Exxon organization in 1975, including President, Exxon Yemen Inc. and Esso Exploration and Production Khorat Inc.; Vice President, Exxon Ventures (CIS) Inc.; President, Exxon Neftegas Limited; and Executive Vice President, ExxonMobil Development Company.
Current Public Company Directorships: None Past Public Company Directorships: None | |
| Edward E. Whitacre, Jr.
Age 68 Director since 2008 |
Principal Occupation: Chairman of the Board and Chief Executive Officer, General Motors; Chairman Emeritus, AT&T
Business Experience: Mr. Whitacre joined General Motors in July 2009 as Chairman and became CEO in December 2009. At AT&T, Mr. Whitacre was elected Chairman and Chief Executive Officer upon its merger with SBC Communications in 2005, and retired in 2007. He was elected Chairman and Chief Executive Officer of SBC in 1990; and President and Chief Operating Officer in 1988.
Current Public Company Directorships: General Motors Past Public Company Directorships: Anheuser Busch; AT&T; Burlington Northern Santa Fe | |
|
| ||
Director compensation elements are designed to:
| • | Ensure alignment with long-term shareholder interests; |
| • | Ensure the Company can attract and retain outstanding director candidates who meet the selection criteria outlined in the Guidelines for Selection of Non-Employee Directors, which can be found on the Corporate Governance section of our Web site; |
| • | Recognize the substantial time commitments necessary to oversee the affairs of the Corporation; and, |
| • | Support the independence of thought and action expected of directors. |
Non-employee director compensation levels are reviewed by the Board Affairs Committee each year, and resulting recommendations are presented to the full Board for approval. The Committee uses an independent consultant, Pearl Meyer & Partners, to provide information on current developments and practices in director compensation. Pearl Meyer & Partners is the same consultant retained by the Compensation Committee to advise on executive compensation, but performs no other work for ExxonMobil.
ExxonMobil employees receive no additional pay for serving as directors.
115
Non-employee directors receive compensation consisting of cash and equity in the form of restricted stock. Non-employee directors are also reimbursed for reasonable expenses incurred to attend board meetings or other functions relating to their responsibilities as a director of Exxon Mobil Corporation.
The annual cash retainer for non-employee directors is $100,000 per year. Chairs of the Audit and Compensation Committees and the Presiding Director (effective January 2010) receive an additional $10,000 per year.
A significant portion of director compensation is paid in restricted stock to align director compensation with the long-term interests of shareholders. The annual restricted stock award grant for incumbent non-employee directors is 2,500 shares. A new non-employee director receives a one-time grant of 8,000 shares of restricted stock upon first being elected to the Board.
While on the Board, the non-employee director receives the same cash dividends on restricted shares as a holder of regular common stock, but the non-employee director is not allowed to sell the shares. The restricted shares may be forfeited if the non-employee director leaves the Board early, i.e., before the retirement age of 72, as specified for non-employee directors.
Current and former non-employee directors of Exxon Mobil Corporation are eligible to participate in the ExxonMobil Foundation’s Educational and Cultural Matching Gift Programs under the same terms as the Corporation’s U.S. employees.
Director Compensation for 2009
| Name | Fees Earned or Paid in Cash ($) |
Stock Awards ($)(a) |
Option Awards ($) |
Non-Equity Incentive Plan Compensation ($) |
Change in Earnings ($) |
Other Compensation ($)(b) |
Total ($) | |||||||
| M.J. Boskin |
105,962 | 201,263 | 0 | 0 | 0 | 388 | 307,613 | |||||||
| L.R. Faulkner |
100,000 | 201,263 | 0 | 0 | 0 | 388 | 301,651 | |||||||
| K.C. Frazier |
59,615 | 554,280 | 0 | 0 | 0 | 388 | 614,283 | |||||||
| W.W. George |
110,000 | 201,263 | 0 | 0 | 0 | 388 | 311,651 | |||||||
| J.R. Houghton |
44,423 | 201,263 | 0 | 0 | 0 | 388 | 246,074 | |||||||
| R.C. King |
100,000 | 201,263 | 0 | 0 | 0 | 388 | 301,651 | |||||||
| M.C. Nelson |
100,000 | 201,263 | 0 | 0 | 0 | 388 | 301,651 | |||||||
| S.J. Palmisano |
100,000 | 201,263 | 0 | 0 | 0 | 388 | 301,651 | |||||||
| S.S Reinemund |
100,000 | 201,263 | 0 | 0 | 0 | 388 | 301,651 | |||||||
| W.V. Shipley |
40,385 | 201,263 | 0 | 0 | 0 | 388 | 242,036 | |||||||
| E.E. Whitacre, Jr. |
100,000 | 201,263 | 0 | 0 | 0 | 388 | 301,651 |
| (a) | In accordance with SEC rules, the valuation of stock awards in this table represents fair value on the date of grant. Dividends on stock awards are not shown in the table because those amounts are factored into the grant date fair value. |
Each director (other than Mr. Frazier, who joined the Board in May 2009) received an annual grant of 2,500 restricted shares in January 2009. The valuation of these awards is based on a market price of $80.51 on the date of grant.
Mr. Frazier received a one-time grant of 8,000 restricted shares upon being first elected to the Board in May 2009. The valuation of this award is based on a market price of $69.29 on the date of grant.
116
At year-end 2009, the aggregate number of restricted shares held by each director was as follows:
| Name | Restricted Shares (#) | |||
| M.J. Boskin |
49,300 | |||
| L.R. Faulkner |
10,500 | |||
| K.C. Frazier |
8,000 | |||
| W.W. George |
21,000 | |||
| R.C. King |
48,100 | |||
| M.C. Nelson |
53,300 | |||
| S.J. Palmisano |
17,000 | |||
| S.S Reinemund |
13,000 | |||
| E.E. Whitacre, Jr. |
10,500 |
| (b) | The amount shown for each director is the prorated cost of travel accident insurance covering death, dismemberment, or loss of sight, speech, or hearing under a policy purchased by the Corporation with a maximum benefit of $500,000 per individual. |
The non-employee directors are not entitled to any additional payments or benefits as a result of leaving the Board or death except as described above. The non-employee directors are not entitled to any payments or benefits resulting from a change in control of the Corporation.
Based on our review of ownership reports filed with the SEC, the firm listed below is the only beneficial owner of more than 5 percent of ExxonMobil’s outstanding common stock as of December 31, 2009.
| Name and Address of Beneficial Owner |
Shares Owned |
Percent of Class | ||
| BlackRock Inc. 40 East 52nd Street New York, NY 10022 |
273,289,117 | 5.76 | ||
DIRECTOR AND EXECUTIVE OFFICER STOCK OWNERSHIP
These tables show the number of ExxonMobil common stock shares each executive named in the “Summary Compensation Table” on page 136 and each non-employee director or director nominee owned on January 31, 2010. In these tables, ownership means the right to direct the voting or the sale of shares, even if those rights are shared with someone else. None of these individuals owns more than 0.04 percent of the outstanding shares.
| Named Executive Officer | Shares Owned | Shares Covered by Exercisable Options | |||||||
| R.W. Tillerson |
1,325,547 | (1) | 327,307 | ||||||
| D.D. Humphreys |
615,360 | (2) | 175,097 | ||||||
| M.J. Dolan |
388,715 | (3) | 59,998 | ||||||
| H.R. Cramer |
818,476 | 250,000 | |||||||
| S.D. Pryor |
839,415 | (4) | 350,000 | ||||||
| (1) | Includes 1,525 shares owned by dependent child. |
| (2) | Includes 69,179 shares jointly owned with spouse. |
| (3) | Includes 37,599 shares jointly owned with spouse. |
| (4) | Includes 23,022 shares owned by spouse. |
117
| Non-Employee Director/Nominee | Shares Owned | |
| M.J. Boskin |
51,800 | |
| L.R. Faulkner |
13,000 | |
| K.C. Frazier |
10,500 | |
| W.W. George |
33,500(1) | |
| R.C. King |
53,404(2) | |
| M.C. Nelson |
73,800(3) | |
| S.J. Palmisano |
19,500 | |
| S.S Reinemund |
17,775(4) | |
| E.E. Whitacre, Jr. |
13,000 |
| (1) | Includes 10,000 shares held as co-trustee of family foundation. |
| (2) | Includes 1,000 shares owned by spouse. |
| (3) | Includes 18,000 shares held as co-trustee of family trusts. |
| (4) | Includes 1,100 shares held in family trust of which spouse is a trustee, and 1,175 shares held by family foundation of which Mr. Reinemund is a director. |
On January 31, 2010, ExxonMobil’s incumbent directors and executive officers (28 people) together owned 8,481,906 shares of ExxonMobil stock and 1,924,903 shares covered by exercisable options, representing about 0.2 percent of the outstanding shares.
Section 16(a) Beneficial Ownership Reporting Compliance
Section 16(a) of the Securities and Exchange Act of 1934 requires that our executive officers and directors file reports of their ownership and changes in ownership of ExxonMobil stock on Forms 3, 4, and 5 with the SEC and NYSE. We are not aware of any unfiled reports and are not aware of any late reports for 2009.
The Audit Committee has appointed PricewaterhouseCoopers LLP (PwC) to audit ExxonMobil’s financial statements for 2010.
Total Fees
The total fees for PwC professional services rendered to ExxonMobil for the year ended December 31, 2009, were $33.5 million, a decrease of $1.4 million from 2008. The Audit Committee reviewed and pre-approved all services in accordance with the service pre-approval policies and procedures, which can be found on the ExxonMobil Web site at exxonmobil.com/governance. The Audit Committee did not use the “de minimis” exception to pre-approval that is available under SEC rules. The following table summarizes the fees, which are described in more detail below.
| 2009 |
2008 | |||
| (millions of dollars) | ||||
| Audit Fees |
26.2 | 24.8 | ||
| Audit-Related Fees |
5.4 | 6.1 | ||
| Tax Fees |
1.9 | 4.0 | ||
| All Other Fees |
— | — | ||
| Total |
33.5 | 34.9 | ||
Audit Fees
The aggregate fees for PwC professional services rendered for the annual audits of ExxonMobil’s financial statements for the year ended December 31, 2009, and for the reviews of the financial statements included in our quarterly reports on Form 10-Q for that year were $26.2 million (versus $24.8 million for 2008).
118
Audit-Related Fees
The aggregate fees for PwC Audit-Related services rendered to ExxonMobil for the year ended December 31, 2009, were $5.4 million (versus $6.1 million in 2008). These services were mainly related to asset dispositions, benefit plan and joint venture audits, and attestation procedures related to cost certifications.
Tax Fees
The aggregate fees for PwC Tax services rendered to ExxonMobil for the year ended December 31, 2009, were $1.9 million (versus $4.0 million for 2008). These services are described below.
| • | PwC assisted various ExxonMobil affiliates with the preparation of local tax filings and related tax services. These fees were $1.6 million for 2009 (versus $1.4 million in 2008). |
| • | PwC also assisted in preparing tax returns for individual ExxonMobil expatriate employees. These fees were $0.3 million for 2009 (versus $2.6 million for 2008). The transition of tax return preparation assistance to another service provider is under way. |
All Other Fees
The aggregate fees for PwC services rendered to ExxonMobil, other than the services described above under “Audit Fees,” “Audit-Related Fees,” and “Tax Fees,” for the year ended December 31, 2009, were zero (also zero in 2008).
PwC has been ExxonMobil’s independent auditing firm for many years, and we believe they are well-qualified for the job. A PwC representative will be at the annual meeting to answer appropriate questions and to make a statement if he desires.
The Compensation Committee of the Board of Directors has reviewed and discussed the “Compensation Discussion and Analysis” for 2009 with management of the Corporation. Based on that review and discussion, we recommended to the Board that the “Compensation Discussion and Analysis” be included in the Corporation’s proxy statement for the 2010 annual meeting of shareholders, and also in the Corporation’s Annual Report on Form 10-K for the year ended December 31, 2009.
| William W. George, Chair | Samuel J. Palmisano | |||
| Reatha Clark King | Edward E. Whitacre, Jr. |
119
COMPENSATION DISCUSSION AND ANALYSIS
The Compensation Discussion and Analysis and Executive Compensation Tables are organized as follows:
120
Overview
Providing energy to meet the world’s demands is a complex business. We meet this challenge by taking a long-term view rather than reacting to short-term business cycles. The compensation program of ExxonMobil aligns with and supports the long-term business fundamentals and core business strategies outlined below and illustrated in the model on page 123.
| • | Long investment horizons; |
| • | Large capital investments; |
| • | Worldwide diverse resources and markets; and, |
| • | Commodity-based, cyclical product prices. |
| • | Long-term growth in shareholder value; |
| • | Disciplined, selective, and long-term focus in making investments; |
| • | Operational excellence; and, |
| • | Industry-leading returns on capital and superior cash flow. |
Key Elements of the Compensation Program
The key elements of our compensation program and staffing objectives that support the business fundamentals and strategies are:
| • | Long-term career orientation with high individual performance standards (see page 124); |
| • | Base salary that rewards individual experience and performance (see page 124); |
| • | Annual bonus grants based on business performance, as well as individual experience and performance (see pages 124-125); |
| • | Payment of a large portion of executive compensation in the form of equity with long mandatory holding periods that extend beyond retirement (see pages 125-127); and, |
| • | Retirement benefits (pension and savings plans) that provide for financial security after employment (see page 128). |
Other Supporting Compensation and Staffing Practices
| • | Executives are “at-will” employees of the Company. They do not have employment contracts, a severance program, or any benefits triggered by a change in control. |
| • | A strong program of management development and succession planning is in place to reinforce a career orientation and provide continuity of leadership. |
| • | We do not believe that our compensation policies and practices create any material adverse risks for the Company. Inappropriate risk-taking is discouraged by requiring senior executives to hold a substantial portion of their equity incentive award for their entire career and beyond retirement. These lengthy holding periods are tailored to our business model. Furthermore, payout of 50 percent of the annual bonus is delayed and subject to risk of forfeiture. The timing of the payout is determined by earnings performance. |
121
| • | All U.S. executives, including the CEO, the other Named Executive Officers, and about 1,200 other U.S. executives, participate in common programs (the same salary, incentive, and retirement programs). Within these programs, the compensation of executives is differentiated based on individual experience, level of responsibility, and performance assessment. |
| • | No tax assistance is provided by the Company on any elements of executive officer compensation or perquisites other than relocation. The relocation policy is a broad-based program that applies to all transferred U.S. professional and executive employees. |
| • | Substantial amounts of executive compensation are at risk of forfeiture in case of detrimental activity, unapproved early termination, or material negative restatement of financial or operating results. |
| • | The Company does not reprice equity incentive awards. The utilization of restricted stock instead of stock options and the determination of annual grants on a share-denominated versus price basis help reinforce this practice. |
| • | Equity compensation is not included in pension calculations. |
Business Performance and Basis for Compensation Decisions
| • | Compensation decisions are based on the results achieved in the following areas over multiple year periods: |
| – | Total shareholder return; |
| – | Earnings; |
| – | Return on capital employed; |
| – | Cash returned to shareholders; |
| – | Safety, health, and environmental performance; |
| – | Operating performance of the Upstream, Downstream, and Chemical segments; |
| – | Business controls; and, |
| – | Effectiveness of actions that support the long-term, strategic direction of the Company. |
| • | The decision-making process with respect to compensation requires judgment, taking into account business and individual performance and responsibility. Quantitative targets or formulas are not used to assess individual performance or determine the amount of compensation. The Compensation Committee assesses the results described above against a broad range of goals and objectives and takes into consideration multiple external factors that influence these results. |
Key Changes for Named Executive Officers in 2009
| • | Bonus awards to the Named Executive Officers in 2009 were reduced by amounts ranging from 32 to 40 percent versus 2008. |
| • | Equity awards were granted in the form of restricted stock in 2009. The Named Executive Officers were granted the same number of shares as in 2008, except for Mr. Dolan, whose grant was increased. The grant date fair value of each restricted share for the 2009 grant was 4 percent lower versus 2008. |
122
People and Business Strategies Model
The following summary illustrates how the compensation and executive development strategies support and integrate with ExxonMobil’s business model. This integrated approach supports long-term growth in shareholder value.
Fully Integrated People and Business Strategies Model
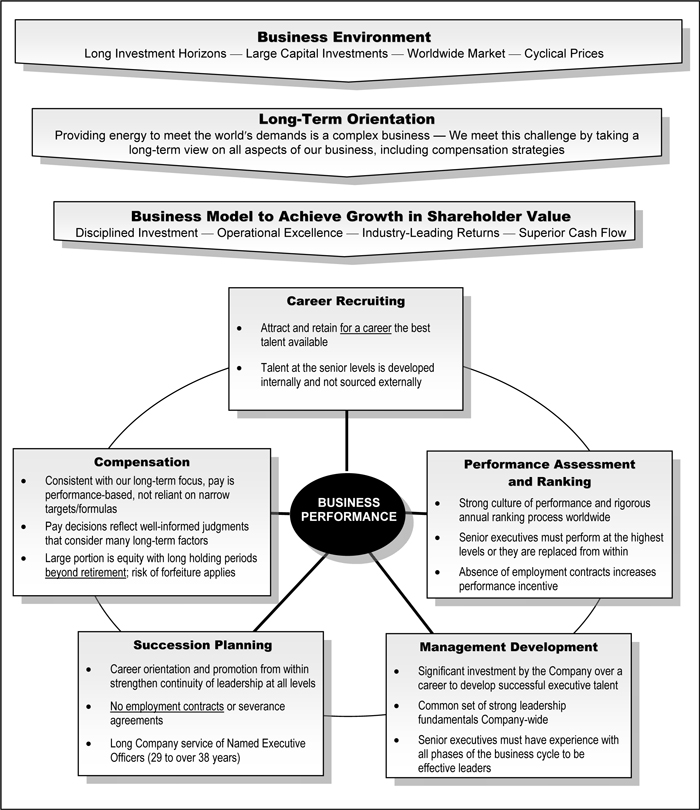
123
Key Elements of the Compensation Program
| • | It is our objective to attract and retain for a career the best talent available. |
| • | It takes a long period of time and a significant investment to develop the experienced executive talent necessary to succeed in the oil and gas business; senior executives must have experience with all phases of the business cycle to be effective leaders. |
| • | Career orientation among a dedicated and highly skilled workforce, combined with the highest performance standards, contributes to the Company’s leadership in the industry and serves the interests of shareholders in the long term. |
| • | The long Company service of executive officers reflects this strategy at all levels of the organization. |
| – | The Named Executive Officers have career service ranging from 29 to over 38 years. |
| – | The other executive officers of the Corporation have career service ranging from 28 to over 38 years. |
| • | Consistent with our long-term career orientation, high-performing executives typically earn substantially higher levels of compensation in the final years of their careers than in the earlier years. |
| – | This pay practice reinforces the importance of a long-term focus in making decisions that are key to business success. |
| – | Because the compensation program emphasizes individual experience and long-term performance, executives holding similar positions may receive substantially different levels of compensation. |
| • | Salaries provide executives with a base level of income. |
| • | The level of annual salary is based on the executive’s responsibility, performance assessment, and career experience. |
| • | Salary decisions directly affect the level of retirement benefits since salary is included in retirement-benefit formulas. The level of retirement benefits is, therefore, performance-based like other elements of compensation. |
| • | The 2009 annual bonus pool was $139 million versus $232 million in 2008, a decrease of 40 percent. This reflects the combined value at grant of cash and Earnings Bonus Units. |
| • | The annual bonus program is highly variable depending on annual financial and operating results. |
| • | The size of the annual bonus pool is based on the annual earnings of the Company and other business performance factors as described under “Business Results Considered” on page 131. |
| • | In setting the size of the annual bonus pool and individual executive awards, the Compensation Committee: |
| – | Secures input from the Chairman on the performance of the Company and from the Compensation Committee’s external consultant regarding compensation trends across industries. |
124
| – | Uses judgment to determine the overall size of the annual bonus pool, taking into consideration the cyclical nature and long-term orientation of the business. |
| • | To recognize the cyclical nature of the commodities business in which we operate and the long-term orientation of our business model, the annual bonus pool and individual grants are managed to recognize only a portion of the change in annual earnings performance both on the upside and downside. For example, when earnings increase, the full percentage change in earnings is not reflected in the bonus pool. The size of the individual awards within the bonus pool is differentiated among participants based on individual performance assessments, experience, and level of responsibility. |
| • | The annual bonus program incorporates unique elements to further reinforce retention and recognize performance. Awards under this program are generally delivered as: |

| • | Earnings Bonus Units are cash awards that are tied to future cumulative earnings per share. Earnings Bonus Units pay out when a specified level of cumulative earnings per share is achieved or within three years at a reduced level. |
| – | For bonus awards granted in 2009, the trigger or cumulative earnings per share required for payout of the delayed portion is $5.75 per unit, which is the same as 2008. |
| – | If cumulative earnings per share do not reach $5.75 within three years, the delayed portion of the bonus would be reduced to an amount equal to the number of units times the actual cumulative earnings per share over the period. |
| – | The intent of the earnings per share trigger is to tie the timing of the bonus payment to the rate of the Corporation’s future earnings and not to decrease the amount of the payment, although it is at risk of forfeiture as described below. Thus the trigger of $5.75 is intentionally set at a level that is expected to be achieved within the three-year period. |
| – | Prior to payment, the delayed portion of a bonus may be forfeited if the executive leaves the Company before the standard retirement age, or engages in activity that is detrimental to the Company. |
| – | Cash and Earnings Bonus Unit payments are subject to recoupment in the event of material negative restatement of the Corporation’s reported financial or operating results. Even though a restatement is unlikely given ExxonMobil’s high ethical standards and strict compliance with accounting and other regulations applicable to public companies, a recoupment policy was approved by the Board of Directors to reinforce the well-understood philosophy that incentive awards are at risk of forfeiture and that how we achieve results is as important as the actual results. |
| • | Equity compensation accounts for a substantial portion of total compensation to align the personal financial interests of executives with the long-term interests of shareholders. |
| • | It is the objective to grant 50 to 70 percent of a senior executive’s total compensation in the form of restricted stock as measured by grant date fair market value, as described beginning on page 133. |
| • | The Compensation Committee makes grant decisions on a share-denominated basis rather than a price basis. The Committee does not support a practice of offsetting the loss or gain of prior |
125
| restricted stock grants by the value of current year grants. This practice would minimize the risk/reward profile of equity-based awards and undermine the long-term view that executives are expected to adopt. |
| • | The Corporation also compares the total value of restricted stock grants against the combined value of all forms of long term awards by comparator companies through an annual benchmarking process, and makes adjustments as necessary (see page 129). |
Rationale
| • | Given the long-term orientation of our business, granting equity in the form of restricted stock with long vesting provisions keeps executives focused on the fundamental premise that decisions made currently affect the performance of the Corporation and Company stock many years into the future. |
| • | Long restricted stock vesting periods that extend beyond retirement support a long-term risk/reward profile that aligns with underlying business fundamentals and discourages inappropriate risk taking. |
| • | The long restriction periods reinforce the Company’s focus on growing shareholder value over the long term by subjecting a large percentage of executive compensation and personal net worth to the long-term return on ExxonMobil stock realized by shareholders. |
| • | Restricted stock removes employee discretion on the sale of Company-granted stock holdings and reinforces the retention objectives of the compensation program. |
Restriction Periods
| • | The restriction periods for ExxonMobil’s stock grants to the most senior executives are among the longest of public companies. |
| – | 50 percent of each grant is restricted for five years; and, |
| – | The balance is restricted for 10 years or until retirement, whichever is later. |
| • | For the most senior executives, more than half of the total amount of restricted stock may not be sold or transferred until after the executive retires. |
| • | The restricted period for stock awards is not subject to acceleration, except in the case of death. |
Forfeiture Risk and Hedging Policy
| • | Restricted stock is subject to forfeiture if an executive: |
| – | Leaves the Company before standard retirement time (defined as age 65 for U.S. employees). In the event of early retirement prior to the age of 65 (i.e., age 55 to 64), the Compensation Committee must approve the retention of awards by an executive officer. |
| – | Engages in activity that is detrimental to the Company, even if such activity occurs or is discovered after retirement. |
| • | Company policy prohibits all employees, including executives, from entering into put or call options on ExxonMobil common stock or futures contracts on oil or gas. |
Share Utilization
| • | The Compensation Committee establishes a ceiling each year for annual stock awards. The overall number of shares granted in the restricted stock program in 2009 represents dilution of 0.2 percent, which is well below the average of the other large U.S.-based companies benchmarked for compensation and incentive program purposes based on historical grant patterns. |
| • | The Company has a long-established practice of purchasing shares in the marketplace to eliminate the dilutive effect of stock-based incentive awards. |
126
Prior Stock Programs
| • | All equity awards granted since 2003 are granted under the Corporation’s 2003 Incentive Program. All equity-based awards (including stock options and restricted stock) granted prior to 2003 that remain outstanding were granted under the Corporation’s 1993 Incentive Program (other than awards granted by Mobil Corporation prior to the merger). No further grants can be made under the 1993 Incentive Program. |
| • | Prior to 2002, ExxonMobil granted Career Shares to the Company’s most senior executives. |
| – | Career Shares vest the year following an executive’s retirement and are subject to forfeiture on substantially the same terms as current grants of restricted stock. The long vesting period further aligns the personal financial interests of executives with the long-term interests of shareholders, and helps ExxonMobil retain senior executives for the duration of their careers. |
| – | The Corporation ceased granting Career Shares in 2002 when the Corporation began granting restricted stock to the broader executive population in lieu of stock options. |
| – | Restricted stock and long mandatory holding periods achieve the same objectives as Career Shares, and, therefore, it is unnecessary to grant both Career Shares and the current form of restricted stock. |
| – | Career Shares could be granted again in the future under the Corporation’s 2003 Incentive Program, but there are no current plans to make such grants. |
| • | Before the merger, Mobil Corporation granted retention awards under the former Mobil Corporation Management Retention Plan. Retention awards are stock units that settle in cash in a single lump sum payment as soon as practicable after retirement (taking into account the required six-month delay in payment required under the American Jobs Creation Act of 2004). Messrs. Cramer and Pryor have outstanding retention awards. |
Stock Ownership
| • | The table below shows stock ownership as a multiple of salary and the percentage of shares that are still subject to restrictions for the Named Executive Officers and the average for all other executive officers as of year-end 2009. Valuation for this purpose is based on the year-end stock price. These levels of ownership ensure executive officers have a significant stake in the sustainable long-term success of the Corporation. |
| Name | Dollar Value of Stock Ownership as a Multiple of Salary |
Percent of Shares Restricted |
|||
| R.W. Tillerson |
44 | 88 | % | ||
| D.D. Humphreys |
42 | 84 | % | ||
| H.R. Cramer |
63 | 62 | % | ||
| M.J. Dolan |
31 | 88 | % | ||
| S.D. Pryor |
61 | 61 | % | ||
| All Other U.S. Dollar-Paid Executive Officers (average) |
32 | 71 | % |
127
Common Programs
| • | Senior executives participate in the same tax-qualified pension and savings plans as most other U.S. employees. Senior executives also participate in the same nonqualified defined benefit and defined contribution plans as other U.S. executives. |
| • | A key principle on which the pension and savings programs are based is commonality of design for all employees, except where the American Jobs Creation Act of 2004 requires delayed timing of nonqualified plan distributions for higher-level executives. The same principle of commonality applies to the Company health care benefits (see page 146). |
Pension Plans
| • | The tax-qualified and nonqualified pension plans, described in more detail beginning on page 143, provide an annual benefit of 1.6 percent of final average pay per year of service, with an offset for Social Security benefits. |
| • | Pay for the purpose of pension calculations includes base salary and bonus but does not include equity compensation. |
| • | Bonus includes the amounts that are paid at grant and the amounts delayed by the Company, as described beginning on page 124. |
| • | The portion of annual bonus subject to delayed payment is expected to pay out subject to forfeiture provisions and therefore is included for pension purposes in the year of grant rather than the year of payment, as described on page 144. |
| • | Pension benefits are paid upon retirement as follows: |
| – | Qualified pension plan benefits are payable, at the election of the employee, in a lump sum or in one of various forms of annuity payments. |
| – | Nonqualified pension plan benefits are paid in the form of an equivalent lump sum six months after retirement. |
Qualified Savings Plan
| • | The qualified savings plan described on page 139 permits employees to make pre- or post-tax contributions and receive a Company-matching contribution of 7 percent of eligible salary, subject to Internal Revenue Code (“Code”) limits on the amount of pay taken into account and the total amount of contributions. |
| • | To receive the Company-matching contribution, employees must contribute a minimum of 6 percent of salary. |
| • | Qualified benefits are payable in a single lump sum or in partial withdrawals at any time after retirement. |
| • | The Code generally requires distributions to commence after the employee has attained age 70-1/2. |
Nonqualified Savings Plan
| • | The nonqualified savings plan described on pages 139 and 146 does not permit employee contributions, but provides 7 percent of eligible pay to restore matching contributions that could not be made to the qualified plan due to Code limits. |
| • | The nonqualified savings plan balance is paid in a single lump sum six months after retirement. |
128
Compensation Committee Decisions
The Committee sets the compensation for the Named Executive Officers and certain other senior executives. The following describes the basis on which the Committee made decisions in 2009.
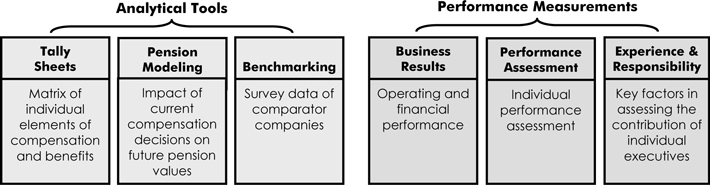
| • | A tally sheet is a matrix used by the Compensation Committee that shows the individual elements of compensation and benefits for each Named Executive Officer. The total of all compensation and benefit plan elements is included to reflect the full employment costs for each Named Executive Officer. |
| • | Tally sheets were used for the following principal purposes: |
| – | To understand how decisions on each individual element of compensation affect total compensation for each senior executive; |
| – | To gauge total compensation for each senior executive against publicly available data for similar positions at comparator companies; and, |
| – | To confirm that equity compensation represents a substantial portion of each senior executive’s total compensation. |
| • | A pension modeling tool was used to determine how current compensation decisions would affect pension values upon retirement. |
| • | Compensation is benchmarked annually. The primary benchmark for the Named Executive Officers is a select group of large companies across industries. |
| • | Comparator Companies |
| – | The following criteria are used to select comparator companies: |
| • | U.S. companies; |
| • | International operations; |
| • | Large scope and complexity; |
| • | Capital intensive; and, |
| • | Proven sustainability/permanence. |
129
| – | The 12 companies benchmarked are listed below. The comparator group included the same companies as noted in the 2009 Proxy Statement, except that Altria and Citigroup were removed from the overall analysis. Altria was removed due to the reduction in the scope of its operations when the U.S. and international businesses were separated through the formation of Philip Morris International. Citigroup was removed due to the uncertain future regarding the stability of its business model. The changes aligned the comparator group more closely with ExxonMobil’s current business circumstances and the above selection criteria. |
|
AT&T Boeing Chevron
|
ConocoPhillips General Electric Hewlett-Packard
|
IBM Johnson & Johnson Pfizer
|
Procter & Gamble United Technologies Verizon
|
| – | In the United States, only Chevron and ConocoPhillips have the size, complexity, and geographic scope in the oil and gas business to provide reasonable comparisons. Other smaller oil companies in the United States do not have the international scale or functional integration to make comparisons meaningful for our senior executives. |
| • | Principles |
| – | Consistent with the Compensation Committee’s practice of using well-informed judgment rather than formulas to determine executive compensation, the Committee does not target any particular percentile among comparator companies at which to align compensation. |
| – | When the Committee cross-checks compensation levels against comparator companies, the focus is on a broader and more flexible orientation, generally a range around the median of comparator company compensation, which provides the ability to: |
| • | Better respond to changing business conditions; |
| • | Manage salaries based on a career orientation; |
| • | Minimize the potential for automatic ratcheting-up of compensation that could occur with an inflexible and narrow target among benchmarked companies; and, |
| • | Differentiate compensation based on experience and performance levels among executives. |
| – | These benchmarking principles apply to salaries and the annual incentive program that includes bonus awards and stock grants. |
| – | For the purpose of its analysis, the Compensation Committee does not adjust for differences in the types or nature of businesses. Consideration is given, however, to the differences in size, scope, and complexity among ExxonMobil and the comparator companies. This is one of several judgmental factors the Committee considers and is not based on a formula. |
| – | The Compensation Committee uses an independent consultant to assist in this analysis. |
Decisions made by the Compensation Committee in 2009 were based on the Company’s operating and financial performance, as well as individual performance, experience and level of responsibility as described below.
130
The operating and financial performance measurements listed below and the Company’s continued maintenance of sound business controls and a strong corporate governance environment formed the basis for the salary and incentive award decisions made by the Committee in 2009. The Committee considered the results in the aggregate and over multiple years, in recognition of the long-term nature of our business.
| • | Earnings of $19.3 billion in 2009, down by 57 percent versus 2008. Five-year annual average of $36.1 billion. |
| • | Total shareholder return was a negative 12.6 percent in 2009 versus the S&P 500 of 26.5 percent. Ten-year annual average of 7.7 percent, versus the S&P 500 of negative 1.0 percent. |
| • | $26 billion distributed to shareholders as dividends and share repurchases in 2009. $213 billion in dividends plus share repurchases since the beginning of 2000. Dividend payments per share increased for the 27th consecutive year. |
| • | Strong results in the areas of safety, health, and environment. Best-ever lost-time incident rate for combined employee and contractor workforce and leading the industry. |
| • | Industry-leading return on average capital employed of 16.3 percent, with a five-year average of 29.2 percent. |
Performance Assessment Process
| • | The above business results form the context in which the Committee assesses the individual performance of each senior executive, taking into account experience and level of responsibility. |
| • | During the annual executive development review with the Board of Directors in October of each year, the CEO reviews the performance of the Management Committee and all officers in achieving results in line with the long-term business strategies (see page 121). |
| • | The same long-term business strategies and results are key elements in the assessment of the CEO’s performance by the Compensation Committee. |
| • | The performance of all officers is also assessed by the Board of Directors throughout the year during specific business reviews and Board committee meetings that provide reports on strategy development; operating and financial results; safety, health, and environmental results; business controls; and, other areas pertinent to the general performance of the Company. |
| • | The Committee does not use quantitative targets or formulas to assess executive performance or determine compensation. The Compensation Committee does not assign weights to the factors considered. Formula-based performance assessments and compensation typically require emphasis on two or three business metrics. For the Company to be an industry leader and effectively manage the technical complexity and global scope of ExxonMobil, the most senior executives must advance multiple strategies and objectives in parallel, versus emphasizing one or two at the expense of others that require equal attention. |
| • | An executive’s performance must be high in all key performance areas for the executive to receive an overall superior evaluation. Outstanding performance in one area will not cancel out poor performance in another. For example: |
| – | A problem in safety, health, or environmental performance in a business unit for which the executive is responsible could result in an executive’s incentive award being reduced even though the executive’s performance against financial and other criteria was superior. |
131
| – | A violation of the Company’s code of business conduct could result in elimination of an executive’s incentive award for the year, as well as termination of employment and/or cancelation of all previously granted awards that have not yet vested or been paid. |
| • | The Management Committee and all other executive officers are expected to perform at the highest level or they are replaced. If it is determined that another executive is ready and would make a stronger contribution than one of the current executive officers, a succession plan is implemented. |
| • | The fact that executives do not have employment contracts, severance agreements, or change-in-control arrangements eliminates any real or perceived “safety net” with respect to job security. This increases the risk and consequences to the individual of performance that does not meet the highest standards. |
Individual Experience and Responsibility
Experience and assigned responsibilities are factors in assessing the contribution of individual executives. The current responsibilities, tenure in the current job, and recent past experience of each Named Executive Officer are described below. Refer to page 136 for information on the leadership structure of the Company.
| • | Management Committee |
| – | Mr. Tillerson was a Senior Vice President before becoming President and a member of the Board in 2004, and Chairman of the Board and CEO in 2006. |
| – | Mr. Humphreys was Vice President and Controller, and then Vice President and Treasurer before becoming Senior Vice President and Treasurer in 2006. |
| – | Mr. Dolan was President of ExxonMobil Chemical Company before becoming Senior Vice President in 2008. |
| • | Other Named Executive Officers |
| – | Mr. Cramer has been President of ExxonMobil Fuels Marketing Company since 1999. |
| – | Mr. Pryor was President of ExxonMobil Refining & Supply Company since 2004 before becoming President of ExxonMobil Chemical Company in 2008. |
As discussed on page 124, the career service for Named Executive Officers ranges from 29 to over 38 years.
Pay Awarded to Named Executive Officers
| • | Within the context of the compensation program structure and performance assessment processes described above, the Compensation Committee aligned the value of 2009 incentive awards and 2010 salary adjustments with the: |
| – | Performance of the Company; |
| – | Individual performance; |
| – | Long-term strategic plan of the business; and, |
| – | Annual compensation of comparator companies. |
| • | The Committee’s decisions reflect judgment taking all factors into consideration, rather than application of formulas or targets. The Committee approved the individual elements of compensation and the total compensation as shown in the tables beginning on page 136. |
132
CEO
| • | The higher level of compensation for Mr. Tillerson, CEO, versus the other Named Executive Officers reflects his greater level of responsibility, including the ultimate responsibility for the performance of the Corporation and oversight of the other senior executives. |
Other Named Executive Officers
| • | The higher level of compensation for Mr. Humphreys, versus the other Named Executive Officers, reflects his level of responsibility as Senior Vice President and Treasurer and tenure as a member of the Management Committee. Mr. Humphreys reports to the CEO. |
| • | The compensation for the other Named Executive Officers is lower than that of the CEO and Mr. Humphreys based on combined salary, bonus, and the annual stock grant (calculated using the fair market value on date of grant). This occurs because Mr. Dolan has short tenure as Senior Vice President and Messrs. Cramer and Pryor report to designated members of the Management Committee (CEO and Senior Vice Presidents). |
Compensation Allocation
| • | To achieve alignment with the interests of shareholders, it is the objective that 50 to 70 percent of annual total remuneration be in the form of stock with long holding periods as described on page 125. |
| • | To further tie compensation to the performance of the business, the objective is to have 10 to 20 percent of annual total remuneration in the form of variable annual bonus awards, which are described beginning on page 124. |
| • | Salary represents less than 10 percent of annual total remuneration, with pension accruals and other forms of compensation comprising the remainder. |
| • | Whether an executive’s total compensation is near, substantially below, or substantially above the comparator group median is a qualitative factor the Compensation Committee considers along with experience, level of responsibility, and performance (see page 130). |
| • | The allocation of compensation in 2009 for the CEO and the average for the other Named Executive Officers is illustrated in the chart below. |
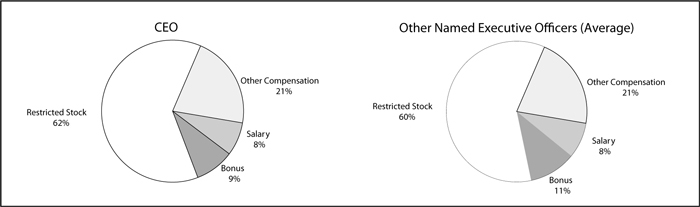
Salary
| • | The changes in salary for the Named Executive Officers from the prior year, as shown in the “Summary Compensation Table” primarily reflect adjustment to the competitive position of the base salary program for all U.S. executives, taking into account increased individual experience and level of responsibility. |
133
Bonus
| • | Annual bonuses (consisting of cash plus the full value of EBU awards) for the Named Executive Officers other than Mr. Dolan were reduced 40 percent compared to 2008. Mr. Dolan’s bonus was reduced 32 percent. |
| • | The changes primarily reflect a lower level of Company earnings in 2009. |
| • | The relative difference in Mr. Dolan’s bonus compared to the other Named Executive Officers reflects his transition to a higher-level position. Mr. Dolan first joined the Company’s Management Committee in 2008. |
Restricted Stock
| • | The number of shares granted as restricted stock in 2009 to each Named Executive Officer was the same as their 2008 grant except for Mr. Dolan, whose grant level was increased. |
| • | The grant date fair value of each restricted share was 4 percent lower in 2009, in line with the lower stock price on the 2009 grant date compared to 2008. |
| • | The increase in the number of shares granted to Mr. Dolan from 2008 reflects his transition to a higher-level position as previously noted. |
Other Compensation
| • | This category comprises the change in pension value and all other compensation as shown in the “Summary Compensation Table.” |
| • | The Compensation Committee grants incentive awards to the Company’s senior executives at their regular November meeting, which is held either the day of or the day before the regularly scheduled November Board of Directors meeting. |
| – | The Board of Directors meeting is scheduled over a year in advance and is held on the last Wednesday of the month (or on Tuesday if the last Wednesday immediately precedes Thanksgiving). |
| – | This firm timing of award grants is reinforced through a decision-making process in which the Corporation does not grant awards by written consent. |
| • | A committee comprising ExxonMobil’s Chairman and Senior Vice Presidents grants incentive awards to other eligible managerial, professional, and technical employees, within the parameters of the bonus and equity award ceilings approved by the Compensation Committee. The schedule of the November meeting of the Compensation Committee as described above determines when this committee meets to approve the annual incentive grants for employees under its purview. |
| • | The Company has not granted stock options since 2001. |
| • | Previously granted stock options that remain outstanding were granted on the same annual schedule described above except for grants in 1999. Due to the fact that the merger of Exxon Corporation and Mobil Corporation closed on November 30 of that year, the regular annual grant meeting date was moved to December 8. Grants to other managerial, professional, and technical employees were made on December 8, and also to additional grantees on April 26, 2000, after employee data for the two companies had been more fully integrated. |
| • | The exercise price for each stock option grant was the average of the high and low sale prices reported on the NYSE on the date of the grant meeting. |
134
| • | U.S. income tax law limits the amount ExxonMobil can deduct for compensation paid to the CEO and the other three most highly paid executives other than the Principal Financial Officer (PFO). Performance-based compensation that meets Internal Revenue Service requirements is not subject to this limit. |
| – | The short term awards and restricted stock grants described above are intended to meet these requirements so that ExxonMobil can deduct the related expenses. Under the material terms of performance goals previously approved by shareholders, the Corporation must achieve positive net income (earnings) in order to make any incentive awards to the covered executives. If positive earnings are achieved, individual awards to these executives are subject to a maximum cap of 0.2 percent of earnings in the case of short term awards, and 0.5 percent of earnings in the case of long term awards. Restricted stock awards to the covered executives for purposes of Section 162(m) of the Internal Revenue Code are only made under the “performance stock” provisions of the 2003 Incentive Program, which include the shareholder-approved goal and cap. The Compensation Committee has no authority to amend or change the shareholder-approved goals. |
| • | These terms have been established to meet tax regulations and do not represent the actual operational goals we expect our senior executives to achieve. Actual award levels are determined based on a subjective consideration of all the factors previously discussed in this report and have been significantly less than the shareholder-approved caps. |
| – | Salaries for senior executives may be set at levels that exceed the U.S. income tax law limitation on deductibility. The primary drivers for determining the amount and form of executive compensation are the retention and motivation of superior executive talent rather than the Internal Revenue Code. |
| • | In 2005, the Compensation Committee eliminated the ability of executives to defer payment of incentive awards. No element of compensation for executives can be deferred prior to retirement. |
| • | Tax assistance is not provided by the Company for either the short term or long term incentive awards discussed above. |
| • | The Company has designed all nonqualified pension and other benefits in a manner intended to avoid tax penalties that potentially could be imposed on the recipients of such amounts by Section 409A of the Code by fixing the form and timing of distributions to eliminate executive and Company discretion. |
| • | The above discussion of tax consequences is based on the Company’s interpretation of current tax laws. |
| • | As discussed in Item 3, a purported shareholder complaint has been filed alleging, among other things, that certain incentive compensation awarded to the Named Executive Officers is not tax deductible by the Company. |
135
Summary Compensation Table for 2009
| Name and Principal Position |
Year |
Salary ($) |
Bonus ($) |
Stock ($) |
Option ($) |
Non- Equity ($) |
Change in Value
and ($) |
All Other ($) |
Total ($) | |||||||||
| R.W. Tillerson Chairman and CEO |
2009 | 2,057,000 | 2,400,000 | 16,963,875 | 0 | 0 | 5,466,517 | 280,925 | 27,168,317 | |||||||||
| 2008 | 1,870,000 | 4,000,000 | 17,604,000 | 0 | 0 | 8,290,253 | 446,826 | 32,211,079 | ||||||||||
| 2007 | 1,750,000 | 3,360,000 | 16,120,900 | 0 | 0 | 5,511,588 | 429,792 | 27,172,280 | ||||||||||
| D.D. Humphreys PFO; Senior Vice President |
2009 | 1,010,000 | 1,418,000 | 8,022,028 | 0 | 0 | 1,296,163 | 124,403 | 11,870,594 | |||||||||
| 2008 | 910,000 | 2,364,000 | 8,324,736 | 0 | 0 | 4,599,191 | 108,989 | 16,306,916 | ||||||||||
| 2007 | 830,000 | 1,859,000 | 7,912,312 | 0 | 0 | 3,919,806 | 86,689 | 14,607,807 | ||||||||||
| M.J. Dolan Senior Vice President |
2009 | 845,000 | 1,046,997 | 5,805,415 | 0 | 0 | 1,902,652 | 94,733 | 9,694,797 | |||||||||
| H.R. Cramer Vice President; President, ExxonMobil Fuels Marketing Company |
2009 | 882,500 | 1,046,997 | 5,805,415 | 0 | 0 | 2,537,500 | 90,219 | 10,362,631 | |||||||||
| 2008 | 843,333 | 1,744,598 | 6,024,480 | 0 | 0 | 3,215,127 | 87,522 | 11,915,060 | ||||||||||
| 2007 | 807,917 | 1,586,000 | 6,709,780 | 0 | 0 | 2,294,584 | 86,202 | 11,484,483 | ||||||||||
| S.D. Pryor Vice President; President, ExxonMobil Chemical Company |
2009 | 940,000 | 1,046,997 | 5,805,415 | 0 | 0 | 2,644,266 | 119,858 | 10,556,536 | |||||||||
| 2008 | 905,000 | 1,744,598 | 6,024,480 | 0 | 0 | 3,571,656 | 311,614 | 12,557,348 | ||||||||||
Leadership Structure
| • | The disclosure regulations result in a roster of Named Executive Officers different from the most senior management team leading the Company, which is referred to as the Management Committee. The Management Committee comprises the following: |
| – | Chairman and CEO: R.W. Tillerson |
| – | Senior Vice Presidents who report directly to the CEO: |
| • | D.D. Humphreys; |
| • | M.W. Albers; |
| • | M.J. Dolan; and, |
| • | A.P. Swiger. |
| • | All members of the Management Committee are shown as Named Executive Officers except for Messrs. Albers and Swiger. Consistent with our career orientation, which is supported by a career-based compensation strategy, their individual compensation levels do not currently place them among the Named Executive Officers. |
| • | Although each member of the Management Committee is responsible for specific business activities, together they share responsibility for the performance of the Company. |
Employment Arrangements
ExxonMobil’s Compensation Committee believes senior executives should be “at will” employees of the Corporation. Accordingly, the CEO and other executive officers, including the other officers named in these tables, do not have employment contracts, severance agreements, or change-in-control arrangements with the Company.
136
Salary
| • | Effective January 1, 2010, the annual salary of the Named Executive Officers increased as follows: Mr. Tillerson’s to $2,207,000, Mr. Humphreys’ to $1,085,000, and Mr. Pryor’s to $955,000. Effective April 1, 2010, the annual salary of Mr. Dolan will increase to $935,000. |
| • | The 2009 and 2010 salary increases reflect adjustments to the competitive position of the base salary program for U.S. executives, taking into account individual experience and level of responsibility. |
| • | Salary (together with other compensation related to fringe benefits or perquisites) is not deductible by the Corporation to the extent that it exceeds $1 million for any Named Executive Officer. |
Bonus
| • | As described in more detail in the “Compensation Discussion and Analysis” (CD&A), the 2009 bonus shown was paid half in cash at the time of grant. The Company delays payment of the balance until cumulative earnings reach $5.75 per share. |
| • | Delayed bonus amounts do not earn interest. |
| • | The bonus and the stock awards described below are intended to meet the requirements of Section 162(m) of the Internal Revenue Code. See “Tax Matters” on page 135. |
Stock Awards
| • | In accordance with disclosure regulations, the valuation of “Stock Awards” in this table represents the grant date fair value which is equal to the number of shares awarded times the grant price, which is deemed to be the average of the high and low sale prices on the NYSE on the grant date ($75.40 on November 24, 2009; $78.24 on November 25, 2008; and $87.14 on November 28, 2007). |
| • | See the narrative accompanying the “Grants of Plan-Based Awards” table for information regarding the terms of restricted stock. |
| • | Dividends on stock awards are not shown in the table because those amounts are reflected in the grant date fair value. |
Change in Pension Value and Nonqualified Deferred Compensation Earnings
The amounts shown in this column in the “Summary Compensation Table” for years 2009 and 2008 represent the change in pension value. For year 2007, the amount also includes nonqualified deferred earnings for Messrs. Tillerson, Humphreys, and Cramer.
Pension Value
| • | The change in pension value shown in the table for 2009 is the increase between year-end 2008 and year-end 2009 in the present value of each executive’s pension benefits under the plans described in more detail in the text following the “Pension Benefits” table on page 143. |
| • | For each year end, the data reflect an annuity beginning at age 60 (or current age if over 60) equal to 1.6 percent of the participant’s covered compensation multiplied by year-end service. These values are converted to lump sums using the plan’s applicable factors and then discounted in the case of employees under age 60 to present values based on the time difference between the individual’s age at year-end 2008 and age 60 (and at year-end 2009 and age 60) using the interest rates for financial reporting of pension obligations as of each year end. The difference between the two year-end amounts represents the annual increase in the value of the pension shown in the “Summary Compensation Table.” |
| • | The lump sum interest rate applied for an employee who worked through the end of 2008 was 4.25 percent. The lump sum interest rate applied for an employee who worked through the end of 2009 was 4 percent. |
137
| • | The discount rate for determining the present value of benefits was 6.25 percent as of year-end 2008 and 6 percent as of year-end 2009. The reduction in the lump sum interest rate and the discount rate results in an increase in the present value of age 60 benefits shown for the Named Executive Officers. |
Nonqualified Deferred Earnings
| • | The portion of annual earnings on each executive’s principal balance under the Corporation’s nonqualified supplemental savings plan that exceeds 120 percent of the long-term Applicable Federal Rate, compounded monthly, as prescribed under Section 1274(d) of the Internal Revenue Code, is required to be disclosed. As of January 1, 2008, the basis for the interest rate during the term of a participant’s employment was changed from the Citibank prime lending rate to 120 percent of the long-term Applicable Federal Rate. As a result, reportable earnings on nonqualified deferred compensation have not been incurred since 2007. |
All Other Compensation
The following table breaks down the amounts included in the “All Other Compensation” column of the “Summary Compensation Table.” Note the table has been changed from last year as follows: removed the columns “Relocation” and “Tax Assistance” since the Named Executive Officers did not have any relocation costs or receive any tax assistance in 2009.
| Name | Life Insurance ($) |
Savings ($) |
Personal ($) |
Personal Use of Company |
Financial ($) |
Total ($) | ||||||||||
| Aircraft ($) |
Properties ($) |
Car ($) |
||||||||||||||
| R.W. Tillerson |
42,135 | 143,990 | 63,550 | 21,222 | 578 | 0 | 9,450 | 280,925 | ||||||||
| D.D. Humphreys |
31,733 | 70,700 | 3,201 | 6,441 | 2,872 | 6 | 9,450 | 124,403 | ||||||||
| M.J. Dolan |
17,234 | 59,150 | 7,971 | 0 | 903 | 25 | 9,450 | 94,733 | ||||||||
| H.R. Cramer |
18,163 | 61,775 | 831 | 0 | 0 | 0 | 9,450 | 90,219 | ||||||||
| S.D. Pryor |
29,687 | 65,800 | 14,801 | 0 | 0 | 1,170 | 8,400 | 119,858 | ||||||||
Life Insurance
| • | The Company offers senior executives term life insurance or a Company-paid death benefit. |
| • | Coverage under either option equals four times base salary until age 65, and a declining multiple thereafter until age 75, at which point the multiple remains at 2.5 times salary. |
| • | For executives with life insurance coverage, the premium cost in any year depends on overall financial and mortality experience under the group policy. |
| • | For executives electing the death benefit, there is no cash cost until the executive dies, as benefits are paid directly by the Company. |
| • | The amount shown is based on Internal Revenue Service tables used to value the term cost of such coverage. This valuation is applied since the actual life insurance premium is a single payment for a large group of executives that does not represent the cost of insuring one specific individual and because several of the Named Executive Officers have elected the death benefit, the long-term cost of which is comparable to the insurance. |
| • | The Company eliminated the executive term life insurance and Company-paid death benefit for all newly eligible executives as of October 1, 2007, and retained it for all current participants, including the Named Executive Officers. |
138
Savings Plan
| • | The amount shown is the value of Company-matching contributions under ExxonMobil’s tax-qualified defined contribution (401(k)) plan and Company credits under the related nonqualified supplemental plan. The Company credit was previously 6 percent and was increased to 7 percent effective January 1, 2008. |
| • | The nonqualified supplemental plan provides all affected employees with the 7-percent Company credit to which they would otherwise be entitled as a matching contribution under the qualified plan but for limitations under the Internal Revenue Code. All affected employees participate in the nonqualified supplemental plan on the same basis. |
| • | The value of the credits to the nonqualified supplemental plan is also disclosed in the “Nonqualified Deferred Compensation” table on page 145. |
Personal Security
| • | The Company provides security for its employees as appropriate based on an assessment of risk. The assessment includes consideration of the employee’s position and work location. |
| • | The Company does not consider any such security costs to be personal benefits since these costs arise from the nature of the employee’s employment by the Company; however, the disclosure regulations require certain security costs to be reported as personal benefits. |
| • | The amounts shown in the table include the following types of security-related costs: security systems at executive residences; security services and personnel (at residences and/or during personal travel); car and personal security driver; and Company mobile phones. Costs of security relating to travel for business purposes are not included. |
| • | Cars provided for security reasons and used primarily for commuting are valued based on the annualized cost of the car plus maintenance and fuel. Reported costs for rental cars utilized due to security concerns during personal travel are the actual incremental costs. |
| • | For security personnel employed by the Company, the cost is the actual incremental cost of expenses incurred by the security personnel. Total salary, wages, and benefits for security personnel are not allocated because the Company already incurs these costs for business purposes. |
| • | For security contractors, the cost is the actual incremental cost of such contractors associated with the executive’s personal time. |
| • | For Mr. Tillerson, the amount shown includes $27,440 for car and $30,822 for residential security. The remainder is for mobile phones and other communications equipment for conducting business in a secure manner, and cost of security relating to personal travel. |
Aircraft
| • | Incremental cost for personal use of the aircraft is based on direct operating costs (fuel, airport fees, incremental pilot costs, etc.) and does not include capital costs of the aircraft since the Company already incurs these capital costs for business purposes. |
| • | For security reasons, the Board requires the Chairman and CEO to use Company aircraft for both business and personal travel. |
| • | The Committee considers these costs to be necessary, security-related business expenses rather than perquisites, but per the disclosure regulations, we report the incremental cost of aircraft usage for personal travel. |
139
Properties
| • | The Company owns or leases various venues for the purpose of business entertainment, including boxes and season tickets to sporting events and recreation and conference retreat properties. When these venues are not otherwise in use for business entertainment, the tickets and properties may be available for use by Company executives and other personnel. |
| • | The table shows the incremental cost incurred for any personal use of these venues by the Named Executive Officers. |
| • | Cost for this purpose is based solely on incremental operating costs (catering, transportation, incremental employee or contractor costs, etc.) and does not include annual or capital costs of these venues since the Company already incurs these costs for business purposes. |
Car
| • | Incremental cost for personal use of company car by executives other than Mr. Tillerson (whose car-related expenses are included under “Personal Security”) is based on an assumed cost in 2009 of $0.55 per mile. Driver personnel costs are not allocated because the Company already incurs these costs for business purposes. |
Financial Planning
| • | The Company provides financial planning services to senior executives, which includes tax preparation. This benefit is valued based on the actual charge for the services. |
Grants of Plan-Based Awards for 2009
| Name |
Grant Date |
Estimated Future Payouts Under Non-Equity Incentive Plan Awards |
Estimated Future Payouts Under Equity Incentive Plan Awards |
All Other Stock Awards: Number of Shares of Stock |
All Other Option Awards: Number of Securities Underlying |
Exercise Base of |
Grant
Date Value of and Option | |||||||||||||||
| Threshold ($) |
Target ($) |
Maximum ($) |
Threshold (#) |
Target (#) |
Maximum (#) |
or Units (#) |
Options (#) |
Awards ($/Sh) |
Awards ($) | |||||||||||||
| R.W. Tillerson |
11/24/2009 | 0 | 0 | 0 | 0 | 0 | 0 | 225,000 | 0 | 0 | 16,963,875 | |||||||||||
| D.D. Humphreys |
11/24/2009 | 0 | 0 | 0 | 0 | 0 | 0 | 106,400 | 0 | 0 | 8,022,028 | |||||||||||
| M.J. Dolan |
11/24/2009 | 0 | 0 | 0 | 0 | 0 | 0 | 77,000 | 0 | 0 | 5,805,415 | |||||||||||
| H.R. Cramer |
11/24/2009 | 0 | 0 | 0 | 0 | 0 | 0 | 77,000 | 0 | 0 | 5,805,415 | |||||||||||
| S.D. Pryor |
11/24/2009 | 0 | 0 | 0 | 0 | 0 | 0 | 77,000 | 0 | 0 | 5,805,415 | |||||||||||
The awards granted in 2009 are in the form of restricted stock.
Restrictions and Forfeiture Risk
| • | These grants are restricted (1) for half the shares, until five years after the grant date; and, (2) for the balance, until 10 years after the grant date or retirement, whichever occurs later. These restricted periods are not subject to acceleration, except upon death, and thus, shares may remain subject to restriction for many years after an executive’s retirement. |
| • | During the restricted period, the executive receives the same cash dividends as a holder of regular common stock and may vote the shares; however, the executive may not sell or transfer the shares, or use them as collateral. |
| • | The shares also remain subject to forfeiture during the restricted period in case of an unapproved early termination of employment or in case the executive is found to have engaged in activity that is |
140
| detrimental to the Company. Detrimental activity may include conduct that violates the Company’s Ethics or Conflicts of Interest policies. |
Grant Date
| • | The grant date is the same as the date on which the Compensation Committee of the Board met to approve the awards, as described beginning on page 134. |
| • | Grant date fair value is equal to the number of shares awarded times the grant price, which is deemed to be the average of the high and low sale prices on the NYSE on the grant date (November 24, 2009; $75.40). |
Outstanding Equity Awards at Fiscal Year-End for 2009
| Name | Option Awards | Stock Awards | ||||||||||||||||
| Number of Securities Underlying Unexercised Options (#) Exercisable |
Number of Securities Underlying Unexercised Options (#) Unexercisable |
Equity Plan Awards: |
Option Exercise Price ($) |
Option Date |
Number of That Have Not |
Market Value of |
Equity Awards: Rights Have Not |
Equity Incentive Awards: Market or Rights That Vested ($) | ||||||||||
| R.W. Tillerson |
130,000 | 0 | 0 | 45.21875 | 11/28/2010 | 1,161,000 | 79,168,590 | 0 | 0 | |||||||||
| 197,307 | 37.12000 | 11/27/2011 | ||||||||||||||||
| D.D. Humphreys |
87,790 | 0 | 0 | 45.21875 | 11/28/2010 | 519,150 | 35,400,839 | 0 | 0 | |||||||||
| 87,307 | 37.12000 | 11/27/2011 | ||||||||||||||||
| M.J. Dolan |
59,998 | 0 | 0 | 37.12000 | 11/27/2011 | 343,150 | 23,399,399 | 0 | 0 | |||||||||
| H.R. Cramer |
80,000 | 0 | 0 | 45.21875 | 11/28/2010 | 540,688 | 36,869,515 | 0 | 0 | |||||||||
| 170,000 | 37.12000 | 11/27/2011 | ||||||||||||||||
| S.D. Pryor |
170,000 | 0 | 0 | 45.21875 | 11/28/2010 | 529,641 | 36,116,220 | 0 | 0 | |||||||||
| 180,000 | 37.12000 | 11/27/2011 | ||||||||||||||||
Option Awards
| • | The option awards shown are exercisable and outstanding as of year end. The actual gain on an option exercise, if any, will depend on the market price of ExxonMobil stock at the time of exercise. ExxonMobil has not granted stock options since 2001. |
Stock Awards (Restricted Stock/Units)
| • | See the narrative accompanying the “Grants of Plan-Based Awards” table for more information regarding the terms of restricted stock. |
| • | For Mr. Dolan, the table also includes 10,000 shares granted prior to the time he became an executive officer in 2004. Restrictions will lapse on those shares on November 26, 2010. The remaining shares have the same restriction periods as described in the “Grants of Plan-Based Awards” table. The restriction periods are not subject to acceleration, except upon death. |
| • | For Messrs. Cramer and Pryor, the table above also includes the retention awards granted by Mobil Corporation before the merger. Retention awards are stock units settled in cash after retirement. During employment, dividend equivalents are credited and reinvested in additional units up to the total dollar amount of the retention award. Both Messrs. Cramer and Pryor reached the dividend |
141
| equivalent cap in 2007, and therefore did not receive any further dividend equivalents on these awards in 2008 or 2009. |
| • | The table below shows the dates on which the respective restricted periods for the restricted stock shown in the previous table expire, assuming the awards are not forfeited and the executive is alive when the restrictions lapse. |
| Name | Date Restrictions Lapse and Number of Shares | |||||||||||||||||||||||||||||
| 11/26/2010 | 11/30/2010 | 11/28/2011 | 11/28/2012 | 11/25/2013 | 11/24/2014 | 10 Years or Retirement, Whichever Occurs Later |
Retirement* | |||||||||||||||||||||||
| R.W. Tillerson |
0 | 75,000 | 92,500 | 92,500 | 112,500 | 112,500 | 658,000 | 18,000 | ||||||||||||||||||||||
| D.D. Humphreys |
0 | 28,000 | 40,000 | 45,400 | 53,200 | 53,200 | 279,350 | 20,000 | ||||||||||||||||||||||
| M.J. Dolan |
10,000 | 23,400 | 27,500 | 32,200 | 35,350 | 38,500 | 176,200 | 0 | ||||||||||||||||||||||
| H.R. Cramer |
0 | 38,500 | 38,500 | 38,500 | 38,500 | 38,500 | 293,700 | 54,488 | ||||||||||||||||||||||
| S.D. Pryor |
0 | 38,500 | 38,500 | 38,500 | 38,500 | 38,500 | 298,900 | 38,241 | ||||||||||||||||||||||
| * | Restrictions lapse on Career Shares on the first day of the calendar year following retirement with the exception of the restricted stock units granted to Messrs. Cramer and Pryor by Mobil Corporation under the Management Retention Plan, which are converted to a cash value at retirement and then paid in a single lump sum (36,488 units for Mr. Cramer and 18,241 units for Mr. Pryor). |
Option Exercises and Stock Vested for 2009
| Name | Option Awards | Stock Awards | ||||||||||||
| Number of Shares Acquired on Exercise (#) |
Value Realized on Exercise ($) |
Number of Shares Acquired on Vesting (#) |
Value Realized on Vesting ($) | |||||||||||
| R.W. Tillerson |
0 | 0 | 66,000 | 4,992,240 | ||||||||||
| D.D. Humphreys |
0 | 0 | 24,200 | 1,830,488 | ||||||||||
| M.J. Dolan |
0 | 0 | 29,250 | 2,204,670 | ||||||||||
| H.R. Cramer |
208,000 | 6,001,045 | 38,500 | 2,912,140 | ||||||||||
| S.D. Pryor |
179,090 | 5,441,068 | 38,500 | 2,912,140 | ||||||||||
Option Awards
| • | The value realized on option awards represents the difference between the option exercise price and the market price of ExxonMobil stock on date of exercise. |
| • | The net number of shares acquired as a result of all exercises during 2009: 85,747 for Mr. Cramer; and 103,982 for Mr. Pryor. |
Stock Awards/Restriction Lapse in 2009
| • | Restrictions lapsed on 50 percent of stock awards that were granted in 2004. Mr. Dolan also had restrictions lapse on 50 percent of stock awards that were granted in 2002. |
| • | The number of shares acquired on vesting is the gross number of shares to which the award relates. |
| • | The value realized is the gross number of shares times the market price, which is the average of the high and low sale prices on the NYSE on the date that restrictions lapse. |
| • | The net number of shares acquired (gross number of shares less shares withheld for taxes): 41,943 for Mr. Tillerson; 15,972 for Mr. Humphreys; 19,410 for Mr. Dolan; 22,253 for Mr. Cramer; and, 24,466 for Mr. Pryor. |
142
| • | Refer to the “Equity” section beginning on page 125 for additional information on restricted stock awards. |
| Name | Plan Name | Number of (#) |
Present Value of ($) |
Payments During Last Fiscal Year ($) | ||||||||
| R.W. Tillerson |
ExxonMobil Pension Plan | 34.58 | 1,558,307 | 0 | ||||||||
| ExxonMobil Supplemental Pension Plan | 34.58 | 11,917,263 | 0 | |||||||||
| ExxonMobil Additional Payments Plan | 34.58 | 24,327,689 | 0 | |||||||||
| D.D. Humphreys |
ExxonMobil Pension Plan | 33.40 | 1,608,155 | 0 | ||||||||
| ExxonMobil Supplemental Pension Plan | 33.40 | 5,139,516 | 0 | |||||||||
| ExxonMobil Additional Payments Plan | 33.40 | 14,974,672 | 0 | |||||||||
| M.J. Dolan |
ExxonMobil Pension Plan | 29.42 | 1,223,043 | 0 | ||||||||
| ExxonMobil Supplemental Pension Plan | 29.42 | 2,795,558 | 0 | |||||||||
| ExxonMobil Additional Payments Plan | 29.42 | 7,652,554 | 0 | |||||||||
| H.R. Cramer |
ExxonMobil Pension Plan | 36.58 | 1,850,974 | 0 | ||||||||
| ExxonMobil Supplemental Pension Plan | 36.58 | 5,194,026 | 0 | |||||||||
| ExxonMobil Additional Payments Plan | 36.58 | 13,926,451 | 0 | |||||||||
| S.D. Pryor |
ExxonMobil Pension Plan | 38.17 | 1,960,893 | 0 | ||||||||
| ExxonMobil Supplemental Pension Plan | 38.17 | 5,985,944 | 0 | |||||||||
| ExxonMobil Additional Payments Plan | 38.17 | 14,715,685 | 0 |
Pension Plan
| • | The tax-qualified pension plan provides a benefit calculated as an annual annuity beginning at age 65 (the Plan’s normal retirement age) equal to 1.6 percent of the participant’s final average salary multiplied by years of credited service, minus an offset for Social Security benefits. |
| – | Final average salary is the average of the highest 36 consecutive months in the 10 years of service prior to retirement. |
| – | Final average salary included and benefits paid are subject to the limits on compensation ($245,000 for 2009) and benefits prescribed under the Internal Revenue Code. |
| • | The benefit is available as a lump sum or in various annuity forms. |
| • | The defined benefit pension arrangements (qualified and nonqualified) help to attract and retain employees at all levels of the Corporation. |
| • | The defined benefit pension plan provides a strong incentive for employees to stay until retirement age. |
| • | The plan uses final average pay applied to all years of service, and thus, the increase in pension values is greatest late in career, when compensation tends to be highest. This retention feature is strong for high performers, whose compensation increases as their job responsibilities continue to expand throughout their career, making their level of retirement income performance-based. |
Supplemental Pension Plan
| • | The nonqualified Supplemental Pension Plan provides a benefit calculated as an annuity on salary above the Internal Revenue Code limit. |
| • | It is calculated as an annual annuity beginning at age 65 equal to 1.6 percent of the participant’s final average salary over the Internal Revenue Code limit multiplied by years of credited service. |
| • | To help meet the retention and performance objectives described for U.S. salaried employees, the Supplemental Pension Plan provides pension benefits to the extent annual pay exceeds the amount |
143
| that can be considered in determining qualified pension benefits ($245,000 for 2009, adjusted each year based on inflation). |
| • | Without the Supplemental Pension Plan, the retention power of the overall pension plan would be greatly reduced for employees earning more than that amount, since the increase in their pension values in mid- to late-career would be based on relatively flat final average pay. |
Additional Payments Plan
| • | The nonqualified Additional Payments Plan provides a benefit calculated as an annual annuity beginning at age 65 equal to 1.6 percent of the participant’s average annual bonus multiplied by years of credited service. |
| – | The plan uses the average of the annual bonus for the three highest grants of the last five prior to retirement (including the portion of the annual bonus that is paid at time of grant and the portion that is paid on a delayed basis as described on page 128). |
| • | Benefits under the Additional Payments Plan are forfeited if an employee resigns prior to completion of 15 years of service and attainment of age 55. All of the Named Executive Officers have satisfied these conditions. |
| • | The objective of the Additional Payments Plan is to support retention and performance objectives in light of the Compensation Committee’s practice of putting higher percentages of annual cash compensation at risk at higher executive levels. |
| • | The Compensation Committee believes that even though a large percentage of annual cash compensation is discretionary and based on Corporate business performance, it should not be excluded from the pension calculation. Inclusion of discretionary bonuses in the pension formula strengthens the performance basis of such bonuses. |
| • | By limiting bonuses to those granted in the five years prior to retirement, there is a strong motivation for executives to continue to perform at a high level. |
| • | The Additional Payments Plan is designed to be a powerful retention tool, since benefits are forfeited if the employee resigns prior to completion of 15 years of service and attainment of age 55. The plan applies on the same terms to all U.S. salaried employees who receive a bonus. |
Present Value Pension Calculations
| • | The present value of accumulated benefits shown in the “Pension Benefits” table is determined by converting the annuity values earned as of year end to lump sum values payable at age 60 (or at the employee’s actual age, if older) using the mortality tables and interest rate (4 percent) that would apply to a participant who worked through the end of 2009, and retired in the first quarter of 2010. |
| • | The actual lump sum conversion factors that will apply when each executive retires could be different. For executives who were not yet 60, the present value as of year-end 2009 of each executive’s age 60 lump sum is determined using a discount rate of 6 percent, the rate used for valuing pension obligations for purposes of the Corporation’s financial statements for 2009. |
Other Plan Terms
| • | All three pension plans require attainment of age 55 and completion of 15 years of service to be eligible for early retirement. All Named Executive Officers have satisfied this requirement. |
| • | The Named Executive Officers have not received any additional service credit. Actual service is reflected in the above table. |
| • | The early retirement benefit consists of an annuity that is undiscounted for retirement ages of 60 years or over, with a discount of 5 percent for each year under age 60. |
144
| • | In addition the Social Security offset is waived for annuity payments scheduled to be paid prior to age 62. |
| • | Because early retirement benefits are subject to a smaller discount than a full actuarial equivalent discount, they can be more valuable than the present value of the executives’ earned normal retirement age benefits. |
| • | Messrs. Tillerson, Dolan, and Cramer were eligible for early retirement prior to age 60 under the plans as of year-end 2009. |
| • | The table below shows the lump sum early retirement benefits under the three plans for the Named Executive Officers who are under age 60 as of year-end 2009. The lump sum early retirement benefits for Messrs. Humphreys and Pryor as of year-end 2009 are the amounts shown in the “Pension Benefits” table. |
| Name | Plan Name | Lump Sum Early Retirement Benefit ($) | ||
| R.W. Tillerson |
ExxonMobil Pension Plan | 1,666,590 | ||
| ExxonMobil Supplemental Pension Plan | 12,617,272 | |||
| ExxonMobil Additional Payments Plan | 25,756,674 | |||
| M.J. Dolan |
ExxonMobil Pension Plan | 1,350,721 | ||
| ExxonMobil Supplemental Pension Plan | 3,038,323 | |||
| ExxonMobil Additional Payments Plan | 8,317,098 | |||
| H.R. Cramer |
ExxonMobil Pension Plan | 1,866,968 | ||
| ExxonMobil Supplemental Pension Plan | 5,232,630 | |||
| ExxonMobil Additional Payments Plan | 14,029,957 |
Nonqualified Deferred Compensation for 2009
| Name | Executive ($) |
Registrant ($) |
Aggregate Earnings in Last FY ($) |
Aggregate ($) |
Aggregate Balance at Last FYE ($) | |||||
| R.W. Tillerson |
0 | 126,840 | 31,745 | 0 | 774,951 | |||||
| D.D. Humphreys |
0 | 53,550 | 18,955 | 0 | 453,202 | |||||
| M.J. Dolan |
0 | 42,000 | 14,619 | 0 | 351,521 | |||||
| H.R. Cramer |
0 | 44,625 | 59,012 | 0 | 1,332,938 | |||||
| S.D. Pryor |
0 | 48,650 | 48,729 | 0 | 1,108,029 |
| • | The table above shows the value of the Company credits under ExxonMobil’s nonqualified supplemental savings plan. The Company credits for 2009 are also included in the “Summary Compensation Table” under the column labeled “All Other Compensation.” |
| • | The amounts in the “Summary Compensation Table” include both Company contributions to the tax-qualified plan and Company credits to the nonqualified plan, whereas the registrant contributions in the table above represent only the Company credits to the nonqualified plan. |
| • | The amount of Company contributions to the tax-qualified savings plan was limited to the Internal Revenue Service contribution and salary maximums. For this reason, $17,150 was the maximum Company match in 2009 to the qualified savings plan. |
| • | The aggregate balance at the last fiscal year end shown above includes amounts reported as Company contributions in the “Summary Compensation Table” of the current statement and in prior-year proxy statements as follows: $580,090 for Mr. Tillerson; $170,300 for Mr. Humphreys; $42,000 for Mr. Dolan; $155,708 for Mr. Cramer; and, $95,900 for Mr. Pryor. |
145
| • | The nonqualified savings plan provides employees with the 7-percent Company-matching contribution to which they would otherwise be entitled under the qualified plan but for limitations on covered compensation and total contributions under the Internal Revenue Code. |
| – | All eligible employees participate in the nonqualified plan on the same basis. |
| – | The rate at which the nonqualified savings plan account bears interest during the term of a participant’s employment is 120 percent of the long-term Applicable Federal Rate. |
| • | The tax-qualified and nonqualified savings plans are designed to help attract and retain employees. The matching design is intended to encourage employees to contribute their own funds to the plan to receive the tax benefits available under the Internal Revenue Code. The supplemental savings plan serves similar purposes for salary or contributions in excess of the Internal Revenue Code limits referenced above. |
Administrative Services for Retired Employee Directors
| • | The Company provides certain administrative support to retired employee directors. |
| • | The support provided generally involves, but is not limited to, assistance with correspondence and travel arrangements relating to activities the retired directors are involved with that continue from their employment, such as board positions with nonprofit organizations. Given the nature of the support provided, a retired director’s spouse may also benefit from the support provided. |
| • | The Company also allows retired employee directors to use otherwise vacant office space at the Company’s headquarters. |
| • | It is not possible to estimate the future cost that may be incurred by the Company for providing these services to Mr. Tillerson, who is currently the only employee director. |
| • | The aggregate incremental cost of providing these services for all currently covered persons is approximately $150,000 per year. |
| – | This amount represents the compensation and benefit cost for support personnel allocated based on their estimated time dedicated to providing this service, as well as other miscellaneous office support costs. |
| • | ExxonMobil does not provide any special executive health care benefits. |
| • | Executives and their families are eligible to participate in the Company’s health care programs, including medical, dental, prescription drug, and vision care, on the same basis as all other U.S. salaried employees. |
| • | The terms and conditions of the programs for both current employees and retirees do not discriminate in scope, terms, or operation in favor of executive officers. |
| • | All U.S. salaried employees are entitled to payment of salary for any accumulated but unused vacation days at retirement or other termination of employment. |
| • | Payment for unused vacation is included in final payments of earned salary. |
146
Termination and Change in Control
| • | ExxonMobil executive officers are not entitled to any additional payments or benefits relating to termination of employment other than the retirement benefits previously described in the preceding compensation tables and narrative. |
| • | Executives are “at-will” employees of the Company. They do not have employment contracts, a severance program, or any benefits triggered by a change in control. |
| • | As discussed in greater detail above, unexercised stock options, unvested restricted stock, and any unpaid portion of an annual bonus are subject to forfeiture at the discretion of the Compensation Committee if an executive: |
| – | Engages in detrimental activity; or, |
| – | Terminates employment prior to standard retirement age (currently age 65 for U.S. executives), whether such termination is voluntary or involuntary. |
| • | The Board has a policy to recoup compensation in the event of a material negative restatement of the Corporation’s reported financial or operating results as described on page 125. |
Payments in the Event of Death
The only event that results in acceleration of the normal payment or vesting schedule of any benefit is death. In that event, the vesting period of outstanding restricted stock awards would be accelerated. Also in the event of death, the executive’s estate or beneficiaries would be entitled to payment of the life insurance or death benefit as described beginning on page 138. At year-end 2009, the amount of that life insurance benefit for each Named Executive Officer is as follows:
| Name | Life Insurance Benefit ($) | |
| R.W. Tillerson |
8,228,000 | |
| D.D. Humphreys |
4,040,000 | |
| M.J. Dolan |
3,500,000 | |
| H.R. Cramer |
3,520,000 | |
| S.D. Pryor |
3,760,000 |
147
Pursuant to the requirements of Section 13 or 15(d) of the Securities Exchange Act of 1934, the registrant has duly caused this report to be signed on its behalf by the undersigned, thereunto duly authorized.
| EXXON MOBIL CORPORATION | ||
| By: |
/s/ REX W. TILLERSON | |
| (Rex W. Tillerson, Chairman of the Board) | ||
Dated February 26, 2010
POWER OF ATTORNEY
Each person whose signature appears below constitutes and appoints Beverley A. Babcock, Randall M. Ebner and Robert N. Schleckser and each of them, his or her true and lawful attorneys-in-fact and agents, with full power of substitution and resubstitution, for him or her and in his or her name, place and stead, in any and all capacities, to sign any and all amendments to this Annual Report on Form 10-K, and to file the same, with all exhibits thereto, and other documents in connection therewith, with the Securities and Exchange Commission, granting unto said attorneys-in-fact and agents, and each of them, full power and authority to do and perform each and every act and thing requisite and necessary to be done, as fully to all intents and purposes as he or she might or could do in person, hereby ratifying and confirming all that said attorneys-in-fact and agents or any of them, or their or his or her substitute or substitutes, may lawfully do or cause to be done by virtue hereof.
Pursuant to the requirements of the Securities Exchange Act of 1934, this report has been signed below by the following persons on behalf of the registrant and in the capacities and on the dates indicated.
| /s/ REX W. TILLERSON (Rex W. Tillerson) |
Chairman of the Board (Principal Executive Officer) |
February 26, 2010 | ||
| /s/ MICHAEL J. BOSKIN (Michael J. Boskin) |
Director | February 26, 2010 | ||
| /s/ LARRY R. FAULKNER (Larry R. Faulkner) |
Director | February 26, 2010 | ||
148
| /s/ KENNETH C. FRAZIER (Kenneth C. Frazier) |
Director | February 26, 2010 | ||
| /s/ WILLIAM W. GEORGE (William W. George) |
Director | February 26, 2010 | ||
| /s/ REATHA CLARK KING (Reatha Clark King) |
Director | February 26, 2010 | ||
| /s/ MARILYN CARLSON NELSON (Marilyn Carlson Nelson) |
Director | February 26, 2010 | ||
| /s/ SAMUEL J. PALMISANO (Samuel J. Palmisano) |
Director | February 26, 2010 | ||
| /s/ STEVEN S REINEMUND (Steven S Reinemund) |
Director | February 26, 2010 | ||
| /s/ EDWARD E. WHITACRE, JR. (Edward E. Whitacre, Jr.) |
Director | February 26, 2010 | ||
| /s/ DONALD D. HUMPHREYS (Donald D. Humphreys) |
Treasurer (Principal Financial Officer) |
February 26, 2010 | ||
| /s/ PATRICK T. MULVA (Patrick T. Mulva) |
Controller (Principal Accounting Officer) |
February 26, 2010 | ||
149
| 3(i) | Restated Certificate of Incorporation, as restated November 30, 1999, and as further amended effective June 20, 2001 (incorporated by reference to Exhibit 3(i) to the Registrant’s Quarterly Report on Form 10-Q for the quarter ended June 30, 2006). |
|||
| 3(ii) | By-Laws, as revised to July 31, 2002 (incorporated by reference to Exhibit 3(ii) to the Registrant’s Quarterly Report on Form 10-Q for the quarter ended June 30, 2007). |
|||
| 10(iii)(a.1) | 2003 Incentive Program (incorporated by reference to Exhibit 10(iii)(a.1) to the Registrant’s Quarterly Report on Form 10-Q for the quarter ended March 31, 2008).* |
|||
| 10(iii)(a.2) | Form of stock option granted to executive officers.* |
|||
| 10(iii)(a.3) | Form of restricted stock agreement with executive officers (incorporated by reference to Exhibit 99.2 to the Registrant’s Report on Form 8-K on December 1, 2009).* |
|||
| 10(iii)(b.1) | Short Term Incentive Program, as amended (incorporated by reference to Exhibit 99.3 to the Registrant’s Report on Form 8-K on December 1, 2009).* |
|||
| 10(iii)(b.2) | Form of Earnings Bonus Unit granted to executive officers (incorporated by reference to Exhibit 99.1 to the Registrant’s Report on Form 8-K on December 1, 2009).* |
|||
| 10(iii)(c.1) | ExxonMobil Supplemental Savings Plan (incorporated by reference to Exhibit 99.1 to the Registrant’s Report on Form 8-K on November 2, 2007).* |
|||
| 10(iii)(c.2) | ExxonMobil Supplemental Pension Plan (incorporated by reference to Exhibit 10(iii)(c.2) to the Registrant’s Report on Form 8-K on October 12, 2006).* |
|||
| 10(iii)(c.3) | ExxonMobil Additional Payments Plan (incorporated by reference to Exhibit 10(iii)(c.3) to the Registrant’s Report on Form 8-K on October 12, 2006).* |
|||
| 10(iii)(d) | ExxonMobil Executive Life Insurance and Death Benefit Plan (incorporated by reference to Exhibit 10(iii)(d) to the Registrant’s Quarterly Report on Form 10-Q for the quarter ended September 30, 2007).* |
|||
| 10(iii)(f.1) | 2004 Non-Employee Director Restricted Stock Plan (incorporated by reference to Exhibit 10(iii)(f.1) to the Registrant’s Quarterly Report on Form 10-Q for the quarter ended March 31, 2009).* |
|||
| 10(iii)(f.2) | Standing resolution for non-employee director restricted grants dated September 26, 2007 (incorporated by reference to Exhibit 99.2 to the Registrant’s Report on Form 8-K on September 27, 2007).* |
|||
| 10(iii)(f.3) | Form of restricted stock grant letter for non-employee directors.* |
|||
| 10(iii)(f.4) | Standing resolution for non-employee director cash fees dated September 28, 2009 (incorporated by reference to Exhibit 99.1 to the Registrant’s Report on Form 8-K on October 28, 2009).* |
|||
150
INDEX TO EXHIBITS—(continued)
| 10(iii)(g.3) | 1984 Mobil Compensation Management Retention Plan, as amended and restated on September 27, 2007 (incorporated by reference to Exhibit 99.1 to the Registrant’s Report on Form 8-K on September 27, 2007).* |
|||
| 12 | Computation of ratio of earnings to fixed charges. |
|||
| 14 | Code of Ethics and Business Conduct (incorporated by reference to Exhibit 14 to the Registrant’s Annual Report on Form 10-K for 2008). |
|||
| 21 | Subsidiaries of the registrant. |
|||
| 23 | Consent of PricewaterhouseCoopers LLP, Independent Registered Public Accounting Firm. |
|||
| 31.1 |
Certification (pursuant to Securities Exchange Act Rule 13a-14(a)) by Chief Executive Officer. |
|||
| 31.2 |
Certification (pursuant to Securities Exchange Act Rule 13a-14(a)) by Principal Financial Officer. |
|||
| 31.3 |
Certification (pursuant to Securities Exchange Act Rule 13a-14(a)) by Principal Accounting Officer. |
|||
| 32.1 |
Section 1350 Certification (pursuant to Sarbanes-Oxley Section 906) by Chief Executive Officer. |
|||
| 32.2 |
Section 1350 Certification (pursuant to Sarbanes-Oxley Section 906) by Principal Financial Officer. |
|||
| 32.3 |
Section 1350 Certification (pursuant to Sarbanes-Oxley Section 906) by Principal Accounting Officer. |
|||
| 101 |
Interactive data files. |
|||
| * | Compensatory plan or arrangement required to be identified pursuant to Item 15(a)(3) of this Annual Report on Form 10-K. |
The registrant has not filed with this report copies of the instruments defining the rights of holders of long-term debt of the registrant and its subsidiaries for which consolidated or unconsolidated financial statements are required to be filed. The registrant agrees to furnish a copy of any such instrument to the Securities and Exchange Commission upon request.
151