 EXHIBIT 99.2 |
| EXHIBIT 99.2 |
 cautionary statement or the subsequent discussion period are forward-looking statements. Actual future results,
including demand growth and mix; ExxonMobil’s own production growth and mix; the amount and
mix of capital expenditures; resource additions and recoveries; finding and development costs;
project plans, timing, costs, and capacities; revenue enhancements and cost efficiencies;
industry margins; margin enhancements and integration benefits; product mix; and the impact of
technology could differ materially due to a number of factors. These include changes in
long-term oil or gas prices or other market conditions affecting the oil, gas, and petrochemical industries; reservoir performance; timely completion of development projects; war and other political or
security disturbances; changes in law or government regulation; the outcome of commercial
negotiations; the actions of competitors; unexpected technological developments; the occurrence
and duration of economic recessions; unforeseen technical difficulties; and other factors
discussed here and under the heading "Factors Affecting 2008 Form 10-K. Forward-looking statements are based on management’s knowledge and
reasonable expectations on the date hereof, and we assume no duty to update these statements as
of any future date. include quantities of oil and gas that are not yet classified as proved reserves but that we believe will
likely be moved into the proved reserves category and produced in the future. The discussion of
reserves in this presentation generally excludes the effects of year-end price/cost revisions
and includes reserves attributable to equity companies and our Canadian oil sands
operations. For definitions of, and information regarding, reserves, return on average
capital employed, normalized earnings, cash flow from operations and asset sales, and other terms
used in this presentation, including information required by SEC Regulation G, see the "Frequently Used Terms" posted on the Investors section of our Web site. The Financial and
Operating Review on our Web site also shows ExxonMobil's net interest in specific projects.
Future Results" in the Investors section of our Web site at exxonmobil.com. See also Item 1A of ExxonMobil’s Forward-Looking Statements. Outlooks, projections, estimates, targets, and business plans in this presentation Frequently Used Terms. References to resources, resource base, recoverable resources, and similar terms 2 |
 3 Corporate Overview |
 4 • industry-leading safety performance • record financial performance – net income $45.2 B – ROCE 34 % – cash flow from operations and asset sales $66 B • total distributions to shareholders* $40 B • capex $26 B • reserves replacement** 103 % • total shareholder return -13 % *includes dividends and share purchases to reduce shares outstanding **excludes year-end price/cost effects and includes Canadian oil sands operations and
asset sales 2008 results |
 5 safety leadership lost time incident rate U.S. petroleum industry employee benchmark* *2008 industry data not available U.S. petroleum industry contractor benchmark* Nobody Gets Hurt employee contractor incidents per 200K hours 0.5 0.4 0.3 0.2 0.1 0.0 '01 '02 '03 '04 '05 '06 '07 '08 '01 '02 '03 '04 '05 '06 '07 '08 |
 6 environmental performance • reducing spills to the environment – zero spills from company-operated and long-term chartered marine vessels • reducing GHG emissions from operations – improving energy efficiency – increasing cogeneration – reducing flaring Protect Tomorrow. Today. 0 200 400 600 '04 '05 '06 '07 '08 spills of more than one barrel number of spills hydrocarbon flaring from Upstream oil and gas production 0 2 4 6 8 10 '04 '05 '06 '07 '08 million metric tons |
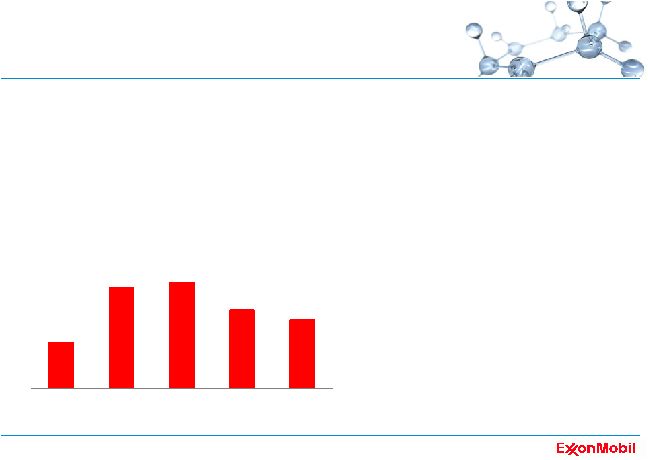
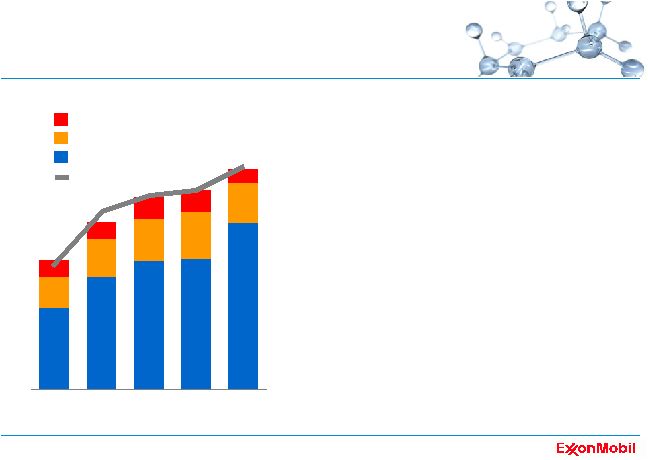 7 record earnings • superior results in all business segments • commitment to operational excellence • capitalizing on competitive advantages 0 10 20 30 40 50 '04 '05 '06 '07 '08 Chemical Downstream Upstream net income $B normalized earnings |
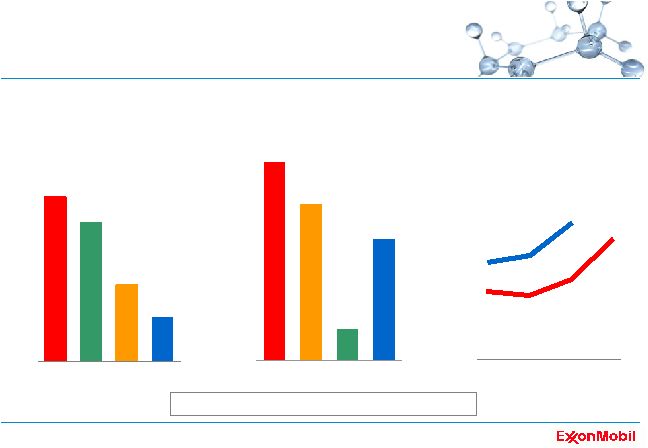
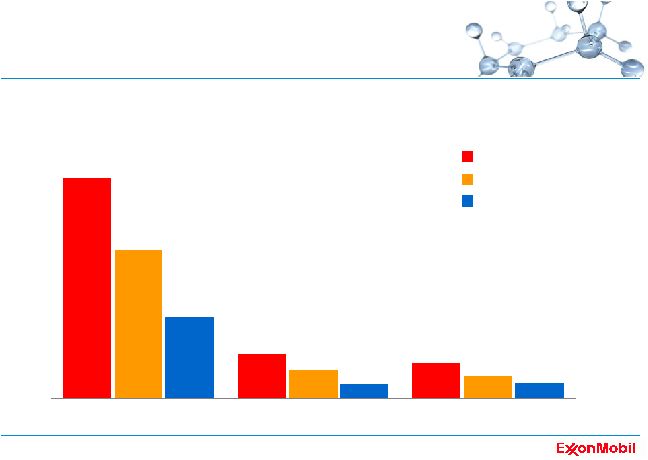
 8 *competitor data estimated on a consistent basis with ExxonMobil, and based on public
information superior ROCE • industry-leading returns • strength of integrated portfolio • consistent execution of business model • disciplined investment across the business cycle 2008 return on average capital employed* 2008 return on average capital employed* 0 10 20 30 40 50 60 XOM CVX RDS BP % Upstream Downstream Chemical |
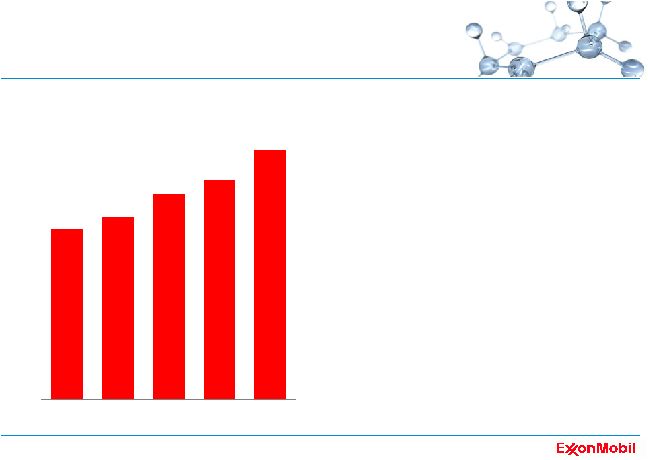
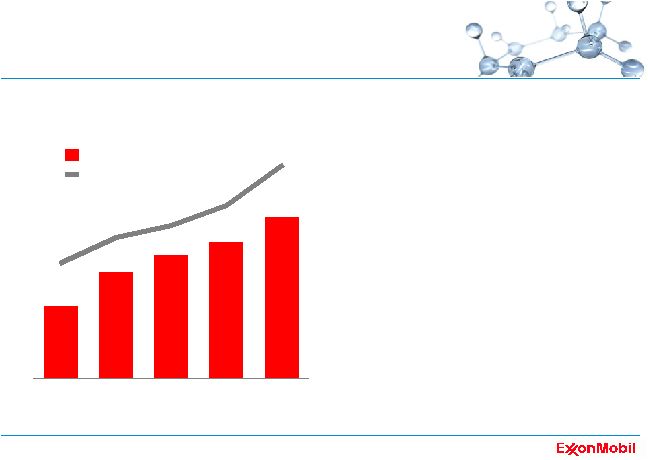
 9 record cash flow • record $60 billion in 2008 • average $50 billion per year from 2004 to 2008 • disciplined cash management *excludes asset sales 0 20 40 60 '04 '05 '06 '07 '08 cash flow from operating activities * $B |
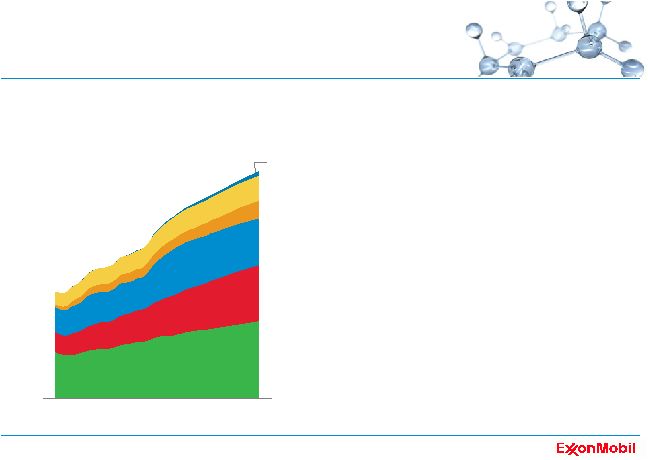
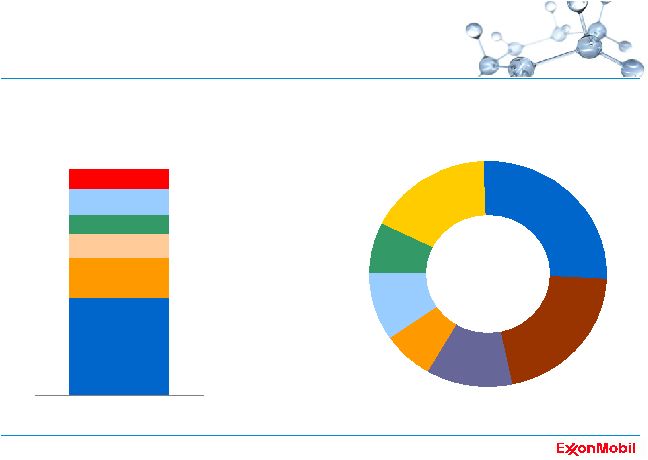
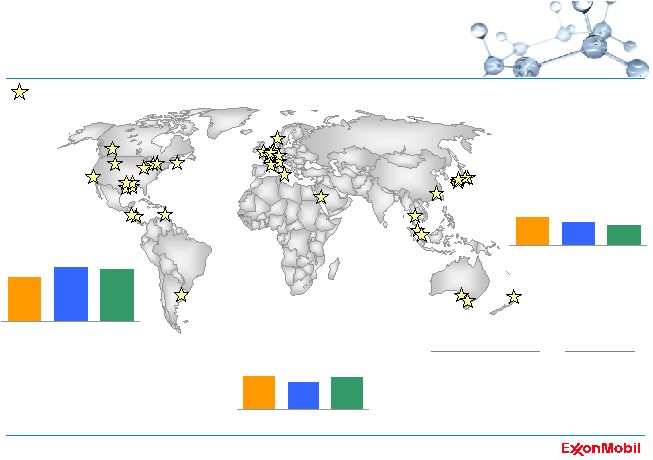
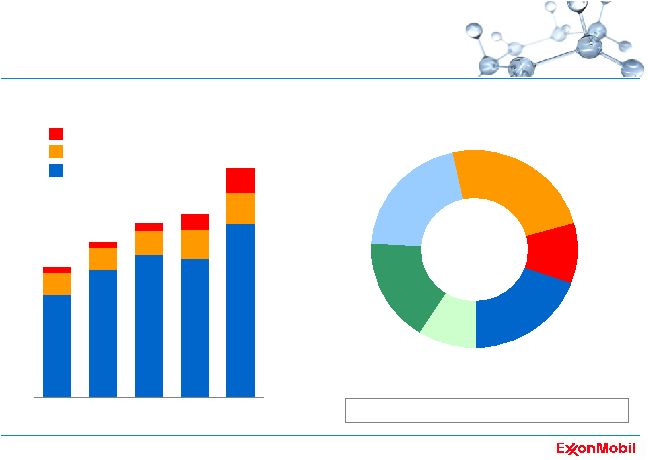 10 disciplined investments *average capex 2004 - 2008 0 5 10 15 20 25 30 '04 '05 '06 '07 '08 geographic capex distribution* U.S. Europe Africa Asia Pacific / Middle East Russia / Caspian Canada / Latin America $99 billion invested from 2004 to 2008 Chemical / Other Downstream Upstream capex by business line $B |
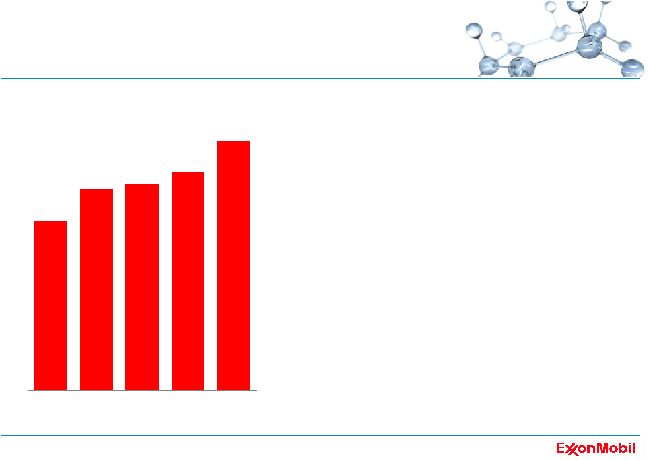
 11 reliable and growing dividends • paid dividends each year for more than 100 years • dividends per share increased each year since 1983 • dividends per share increased 58% over the last 5 years – average growth 9.6% per year – U.S. inflation average 3.2% per year* 0.00 0.40 0.80 1.20 1.60 '04 '05 '06 '07 '08 dividends per share $ / share *All Urban CPI, average of 2003 – 2008 time period |
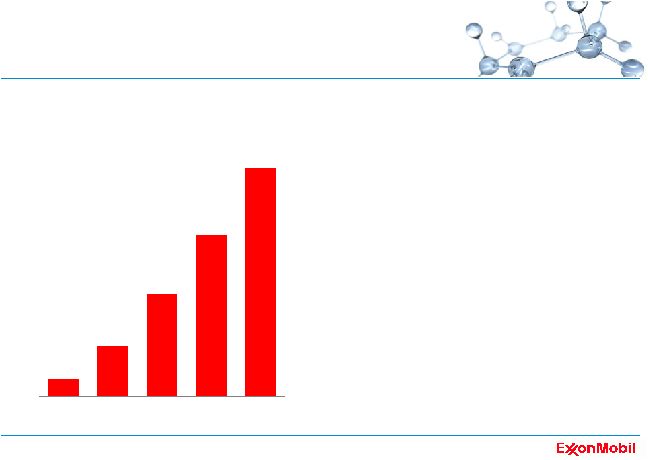 12 cumulative share purchases • record $32 billion distributed in 2008 • $109 billion distributed over the last five years • reduced shares outstanding by 24% since beginning of 2004 0 30 60 90 120 '04 '05 '06 '07 '08 purchases to reduce shares outstanding $B |
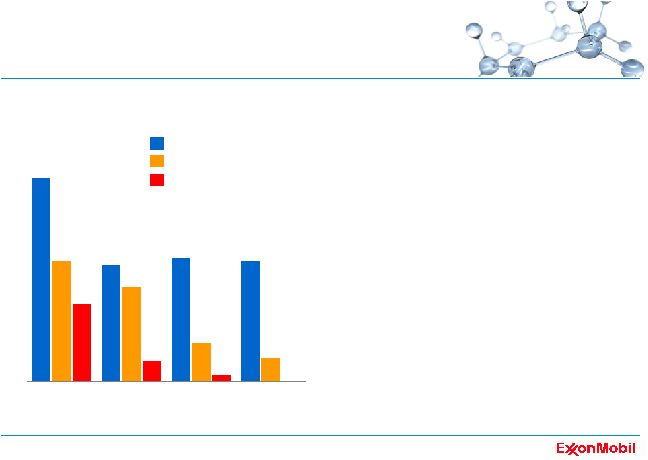
 13 total shareholder distributions • $40 billion total distribution to shareholders – dividends $8 billion – share purchases $32 billion – larger than total distributions of competitors combined • total distribution yield 7.9% 2008 *competitor data estimated on a consistent basis with ExxonMobil, and based on public information distributions* yield* XOM RDS BP XOM RDS BP % 0 8 6 4 2 CVX CVX $B 0 8 16 24 32 40 distributions* yield* XOM RDS BP XOM RDS BP % 0 8 6 4 2 0 8 6 4 2 CVX CVX $B 0 8 16 24 32 40 |
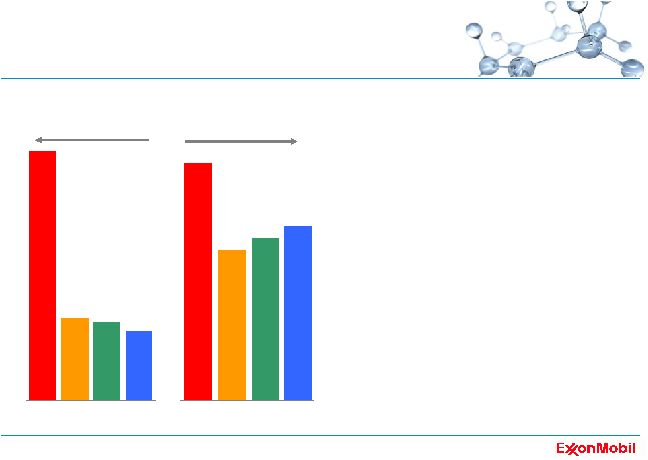
 14 -20 -10 0 10 20 30 % growth per share since 2004* XOM BP CVX RDS XOM BP CVX RDS production proved reserves** refinery throughput *competitor data estimated on a consistent basis with ExxonMobil, and based on public
information **2008 reserves data estimated for CVX based on Q4 2008 earnings release; 2007 reserves data used for BP and RDS as 2008 data not yet available increasing ownership • increasing ownership per share • strong per share growth in key business metrics • ahead of competition |
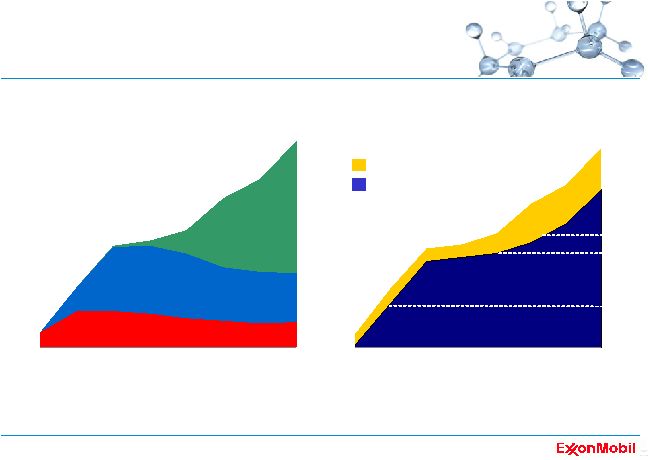
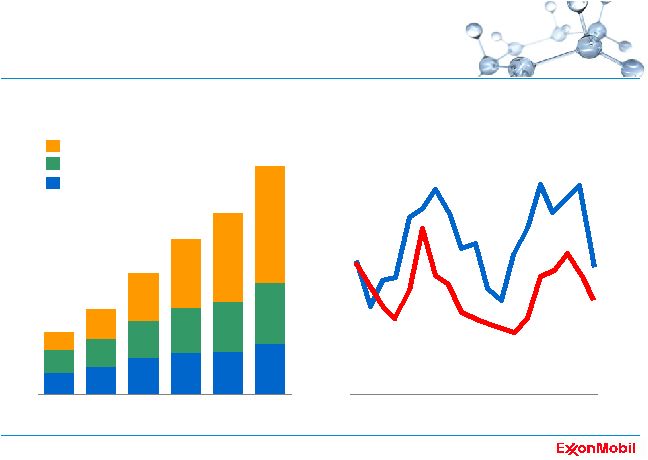
 15 increasing value per share • average 22% EPS growth per year • captured upside • growth driven by – strong business performance – higher commodity prices and margins – share purchases contributed $2.26 to 2008 EPS** 0 3 6 9 12 '04 '05 '06 '07 '08 *cash flow from operating activities **versus number of shares outstanding on January 1, 2001 $ / share earnings and cash flow per share earnings cash flow* |
 16 recent business environment • volatile commodity prices and margins • changing near-term demand • dramatic financial market changes • adjustments by competitors to business plans ExxonMobil well-positioned, now and for the future |
 17 • economic progress driving global energy demand higher • oil and natural gas are indispensable • requirements to meet rising demand: – integrated solutions – technology innovations – massive investments – timely execution energy demand to 2030 0 50 100 150 200 250 300 350 '80 '05 '30 energy demand MBDOE gas oil wind, solar & biofuels biomass, hydro & geothermal nuclear coal average growth / year 2005 – 2030 1.2% |
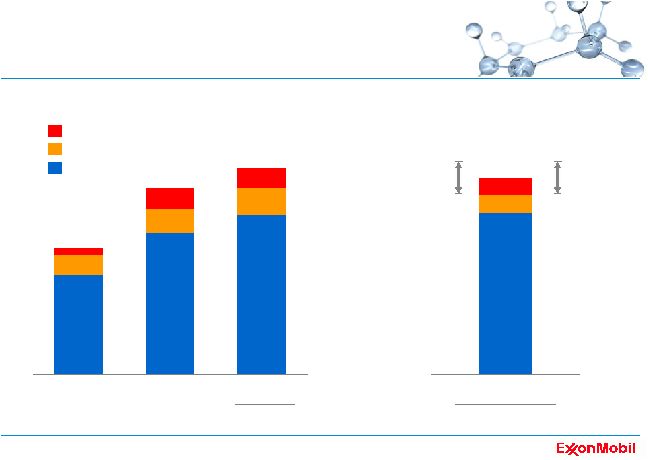 18 investing for the future 0 5 10 15 20 25 30 '10 - '13 average 0 5 10 15 20 25 30 '03 - '07 average '08 '09 estimate $B estimate range $B capex by business line estimate Chemical / Other Downstream Upstream |
 19 ExxonMobil strengths • portfolio quality • global integration • discipline and consistency • value maximization • long-term perspective underpinned by superior technology, organization, and financial strength industry leadership through the business cycle |
 20 Upstream Overview |
 21 2008 highlights • earnings $35.4 B • ROCE 53.6 % • production volumes 3.9 MOEBD • resource adds 2.2 BOEB • proved reserves adds 1.5 BOEB • capex $19.7 B |
 22 Upstream strategies • ensure operations integrity: best-in-class performance • identify and capture all attractive exploration opportunities • invest in projects that deliver superior returns • maximize profitability of existing oil and gas production • capitalize on growing natural gas and power markets • maximize resource value through highest impact technologies and integrated solutions |
 23 ExxonMobil strengths • portfolio quality • global integration • discipline and consistency • value maximization • long-term perspective combining our strategies and strengths allows us to: - capture the highest-quality resources - develop them more cost effectively and in less time than others - conduct operations with the highest standards of integrity - deliver superior value to our shareholders and to resource owners industry leadership through the business cycle |
 24 superior resource base BOEB resource type resource distribution 0 40 80 YE '08 Americas Europe Russia / Caspian Africa 72 Asia Pacific Middle East LNG unconventional gas conventional deepwater arctic heavy oil acid / sour gas |
 25 adding to the resource base • 2.2 BOEB resource additions in 2008, with key contributions from: – onshore U.S. – deepwater Gulf of Mexico – Athabasca – West Africa • completed 77 exploratory wells – 60% wildcat success rate • 2008 finding cost of $1.3 per OEB 0 1 2 3 4 5 '00 '02 '04 '06 '08 average '04 to '08 BOEB resource base additions discovered undeveloped by-the-bit conventional LNG acid / sour gas deepwater unconventional gas arctic heavy oil |
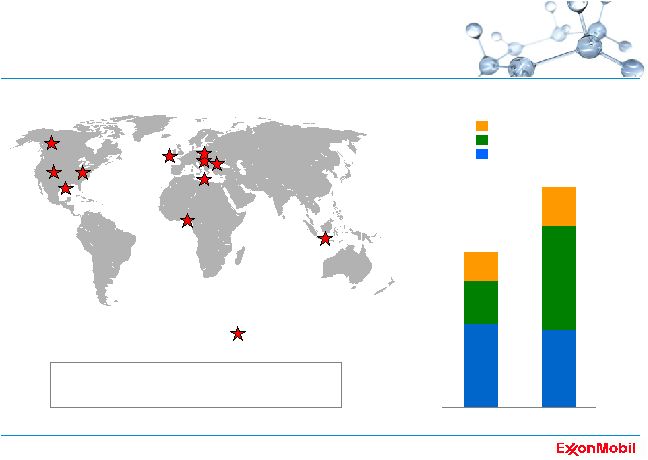 26 increasing prospective acreage key 2008 captures 42% increase in net exploration acreage from 2003 to 2008 0 20 40 60 80 '03 '08 million acres Americas Europe, Africa Asia, Middle East, Russia net exploration acreage |
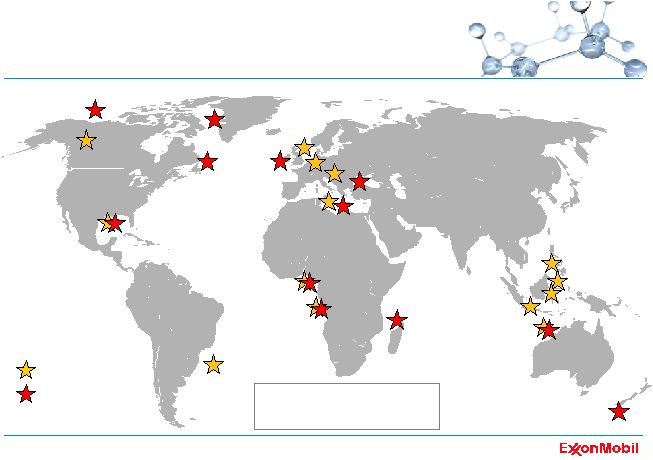 27 key exploration wells 2009 2010+ Brazil Canada Orphan Madagascar Australia U.S. Gulf of Mexico Angola Nigeria Indonesia Cepu Libya New Zealand UK North Sea Germany Canada Beaufort Ireland Philippines Hungary Romania Canada Horn River 3 new deepwater rigs under contract Indonesia Makassar West Greenland |
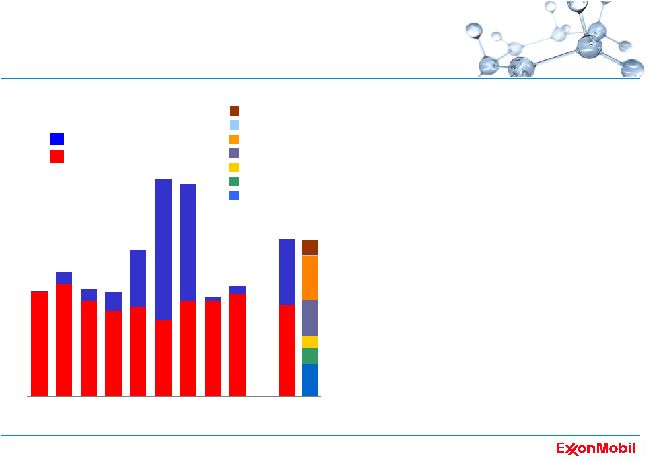
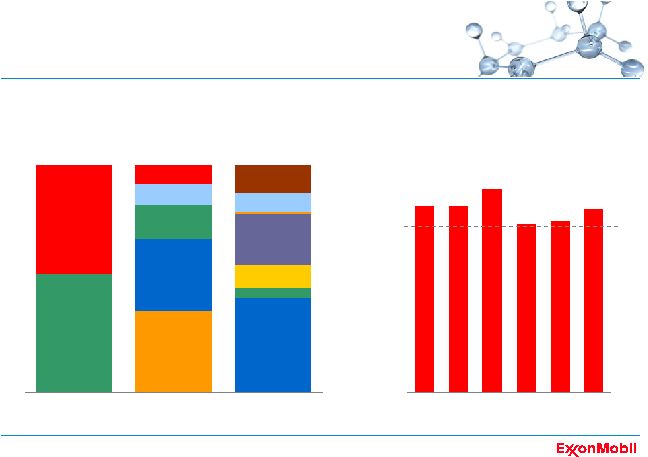 28 reserves base: size and diversity 0 5 10 15 20 25 product region resource 0 50 100 150 '04 '05 '06 '07 '08 '04-'08 average *excludes year-end price/cost effects and includes Canadian oil sands operations and asset sales
Asia Pacific / Middle East Americas Europe Africa Russia / Caspian oil gas BOEB proved reserves* (YE '08) conventional LNG acid / sour gas arctic heavy oil deepwater % proved reserves replacement* unconv’l gas |
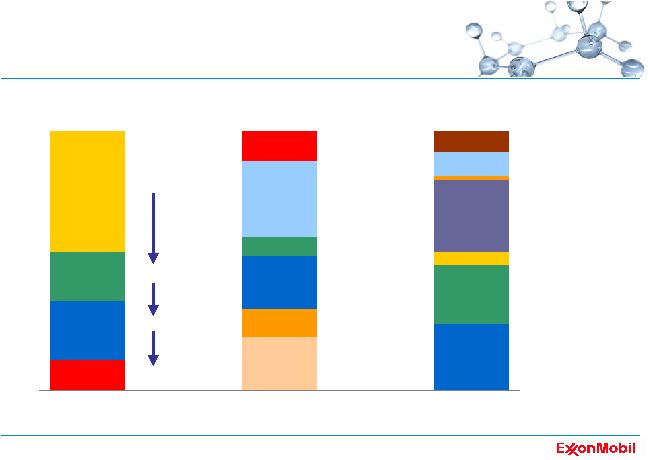 29 strong project inventory number of projects (YE '08) 0 25 50 75 100 125 project stage geography resource Middle East Americas Europe Africa Russia / Caspian conventional LNG arctic heavy oil / oil sands deepwater Asia Pacific unconventional gas acid / sour gas operating executing defining planning / selecting |
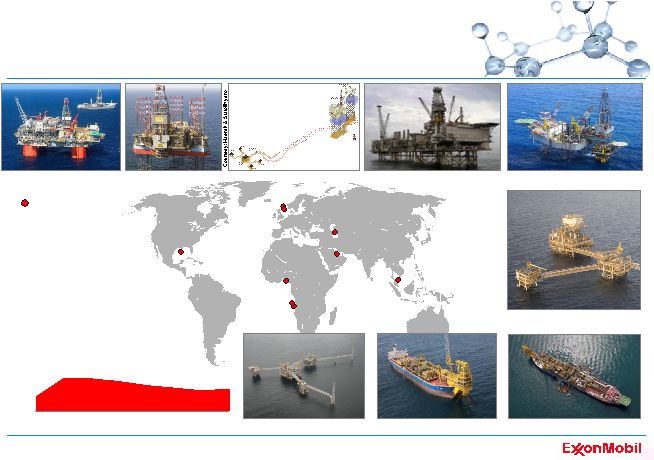
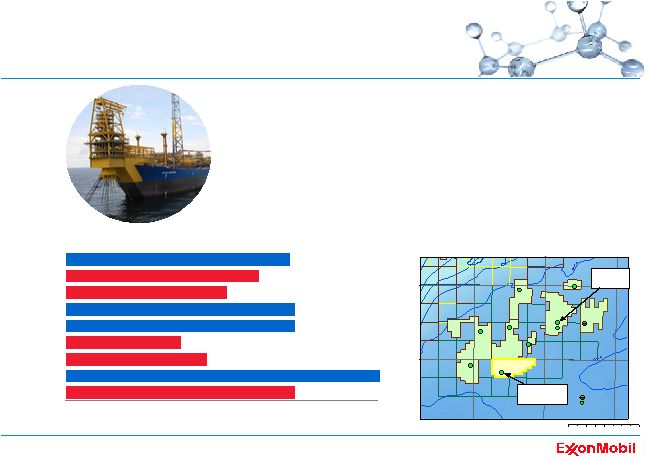 30 Angola and Nigeria* project cycle time • 7 operated deepwater projects in West Africa – 270 KBD net production – two FPSO start-ups in 2008 – leveraged designs reduce cycle time and cost – Kizomba uptime of 98% • GoM: 7 wells and 141 new blocks in 2008 • first deepwater Santos Basin wildcat • new plays: Libya, Black Sea, SE Asia, Australia… 42°0'0"W 42°0'0"W 43°0'0"W 43°0'0"W 44°0'0"W 44°0'0"W 25°0'0"S 25°0'0"S 26°0'0"S 26°0'0"S 0 50 100 25 BM-S-22 JUPITER TUPI CARIOCA BEM-TE-VI PARATI IARA BM-S-10 BM-S-11 BM-S-24 BMS11 -S11 -11 BM-S8 -8 BM-S21 -21 BMS9 -S9 -9 BM-S9 -9 CARAMBA AZULÃO GUARA Oil Discoveries TUPI SUL Gas/Oil Discovery kilometers Tupi Azulão 42°0'0"W 42°0'0"W 43°0'0"W 43°0'0"W 44°0'0"W 44°0'0"W 25°0'0"S 25°0'0"S 26°0'0"S 26°0'0"S 0 50 100 25 BM-S-22 JUPITER TUPI CARIOCA BEM-TE-VI PARATI IARA BM-S-10 BM-S-11 BM-S-24 BMS11 -S11 -11 BM-S8 -8 BM-S21 -21 BMS9 -S9 -9 BM-S9 -9 CARAMBA AZULÃO GUARA Oil Discoveries TUPI SUL Gas/Oil Discovery kilometers Tupi Azulão 0 10 20 30 40 50 60 Erha* Competitor* Kiz C - S/B Kiz C - Mondo Competitor Competitor Kizomba B Kizomba A Competitor months 2001 2004 2005 2006 2007 2008 2008 2006 2005 deepwater resources |
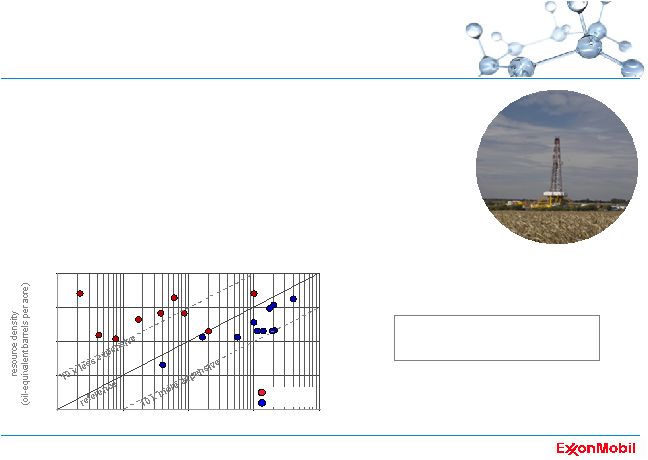 31 acquisition cost* (unit cost) 10 100 1,000 10,000 100,000 10 100 1,000 10,000 100,000 ExxonMobil competitor entry cost (U.S. $ per acre) unconventional gas resources • global approach to capture highest-quality opportunities – acreage in high-value gas markets (Europe, North America) – drilling programs under way in U.S., Canada, Germany, Hungary – Piceance Phase 1 tight gas development start-up Q1 2009 – proprietary fracturing technologies reducing development costs • disciplined, targeted approach – pursuit of high-quality, material opportunities based on global ranking – entered high-potential plays at lower average cost than competitors – European opportunities: larger, contiguous and near attractive gas markets captured 1.8 million net acres in 2007 and 2008 *competitor data based on publicly announced deals |
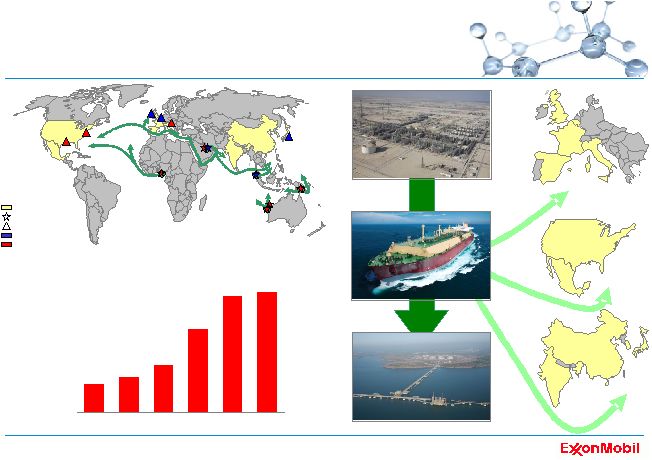 32 0 2 4 6 8 10 '05 '06 '07 '08 '09 '10 ExxonMobil JV LNG shipping capacity million m³ global LNG integration Nigeria Gorgon -Jansz Arun Qatar Scarborough PNG existing LNG production future LNG terminal major LNG market existing LNG production future LNG terminal major LNG market |
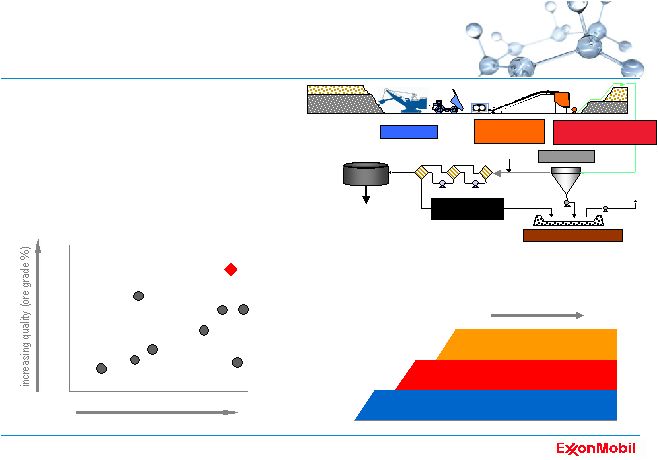 33 • very high-quality oil sands portfolio • proprietary froth treatment process removes need for upgrader – lowest unit development cost • Kearl: phased development of 4 BBO • new resource additions in 2008 oil sands resources diluent to markets froth mining slurry preparation oil sands hydro transport / conditioning diluted bitumen froth treatment extraction tailings storage *ratio of Total Volume to Bitumen in Place, or TV:BIP source: owner data and regulatory applications 0 100 200 300 400 large, long-plateau flowstream KBD, net Phase 1 Phase 3 Phase 2 T > 30 years 12 11 10 9 8 7 increasing mining efficiency* 12.0 10.0 11.5 10.5 11.0 12.5 Kearl Phase 1 industry-proposed projects oil sands resource quality |
 34 Saxi / Batuque 2008 major project start-ups East Area NGL II Thunder Horse Starling Mondo Volve Jerneh B ACG Phase 3 Qatargas II Train 4 offshore 2008 KOEBD, net 0 300 600 900 08 09 10 11 12 13 14 15 2008 start-ups KOEBD, net 0 300 600 900 08 09 10 11 12 13 14 15 2008 start-ups ' ' ' ' ' ' ' ' |
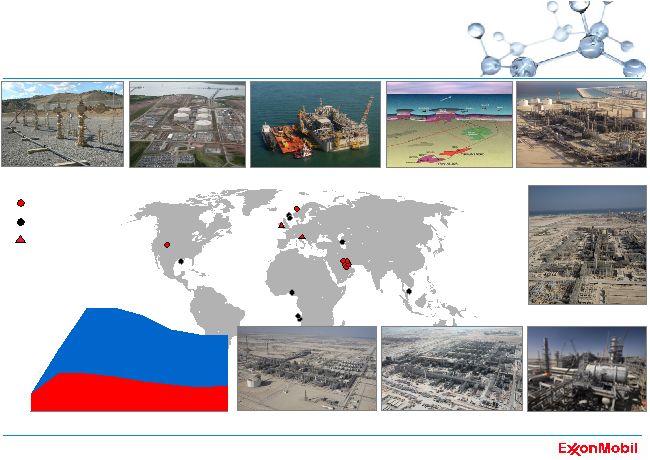 35 2009 major project start-ups Adriatic LNG Terminal Qatargas II Train 5 RasGas Train 6 Al Khaleej Gas Phase 2 RasGas Train 7 Tyrihans 2009 2008 LNG Terminal South Hook Terminal Piceance Phase 1 Qatargas II Train 4 0 300 600 900 08 09 10 11 12 13 14 15 2008 start-ups 2009 start-ups KOEBD, net ' ' ' ' ' ' ' ' 0 300 600 900 2008 start-ups 2009 start-ups KOEBD, net ' ' ' ' ' ' ' ' |
 36 0 300 600 900 1200 1500 '08 '09 '10 '11 '12 '13 '14 '15 KOEBD, net 2010+ major project start-ups 2010+ start-ups long-plateau volumes build-up 2009 start-ups 2008 start-ups other flowstreams long-plateau volumes 0 300 600 900 1200 1500 '08 '09 '10 '11 '12 '13 '14 '15 AKG Ph 2, Qatargas II Train 5, RasGas Train 6 & 7 Qatargas II Train 4, East Area NGL II Kearl Ph 1 PNG LNG Kashagan KOEBD, net • approximately 1.5 MOEBD net new production capacity added by 2015 • more than 80% of total volume adds are long-plateau volumes future capacity growth |
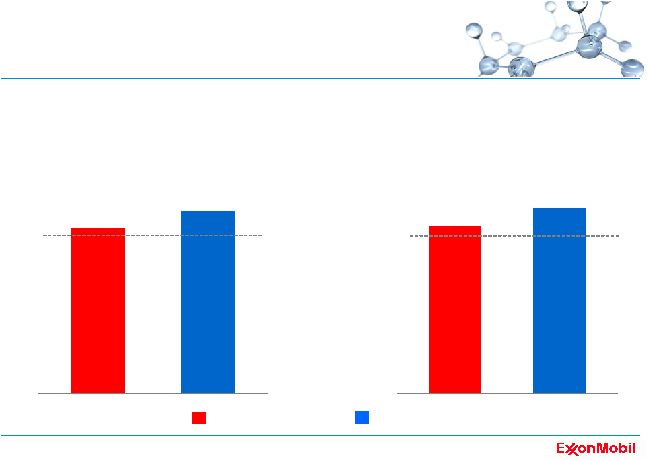 37 project execution 0 50 100 150 schedule performance 114% 103% 0 50 100 150 116% 105% variance: actual versus funded (%), '04 to '08 start-ups cost performance ExxonMobil operated operated by others |
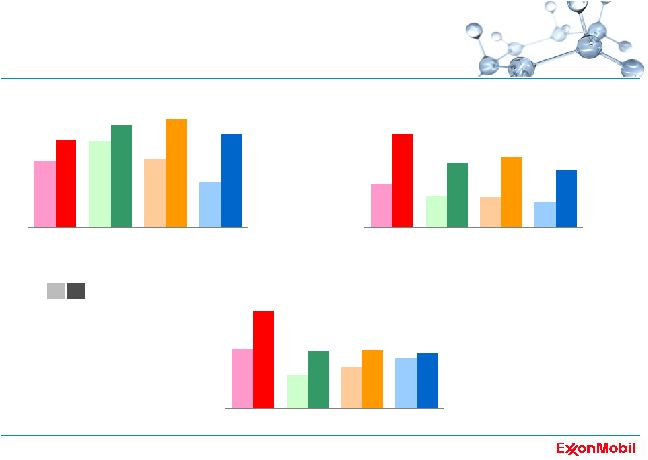
 38 adding reserves at lower cost '04 -'07 proved reserves additions* '04 - '07 exploration and development capex 0 2 4 6 8 XOM BP RDS CVX BOEB $B 0 5 10 15 20 XOM BP RDS CVX '04-'07 reserves replacement cost** $ per OEB 0 20 40 60 80 XOM BP RDS CVX *calculated using year-end pricing; includes Canada oil sands; excludes asset sales.
2008 competitor data not available for all companies due to later SEC filing
deadline **costs incurred in property acquisition and exploration plus development activities, divided by proved oil-equivalent reserves additions, including purchases. Competitor data estimated on a consistent basis with ExxonMobil, and based on public information |
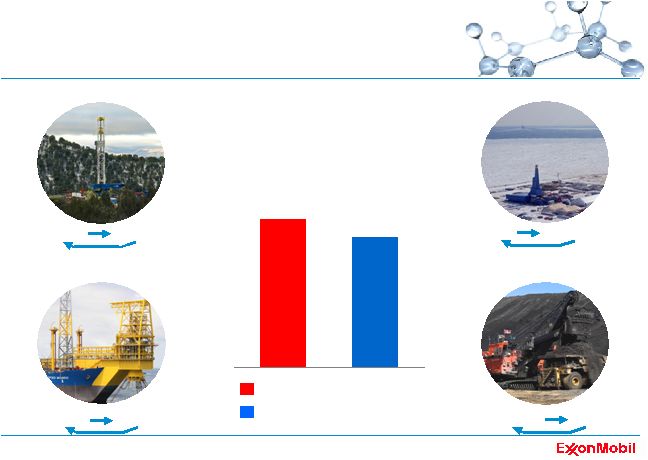 39 tight gas Piceance Hungary global best operating practices heavy oil operations Syncrude Kearl FPSO projects West Africa Kizomba C extended reach drilling SYU Sakhalin 1 80 85 90 95 100 operations uptime, '04 to '08 93% 91% ExxonMobil operated operated by others % |
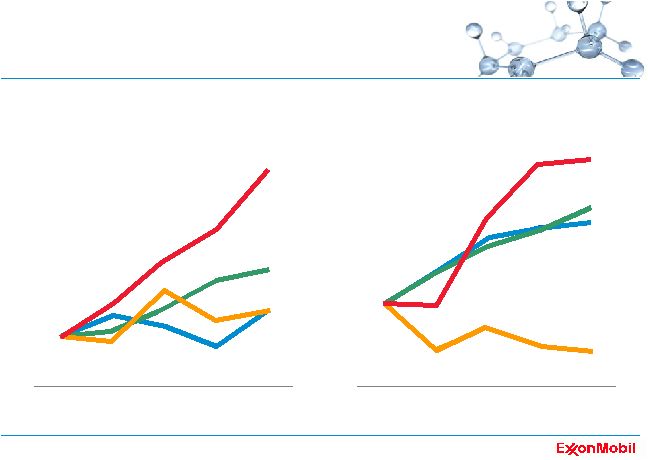
 40 industry-leading cost management *Upstream technical costs (FAS 69) normalized using 10-K/20-F information;
2008 competitor data not available for all companies due to later SEC filing
deadline cash costs per OEB, indexed* total costs per OEB, indexed* 100 120 140 160 180 '04 '05 '06 '07 XOM RDS BP CVX 100 120 140 160 180 200 220 '04 '05 '06 '07 XOM RDS BP CVX |
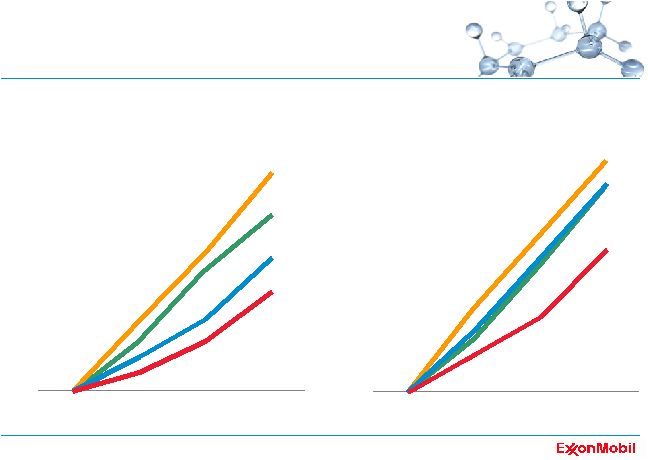
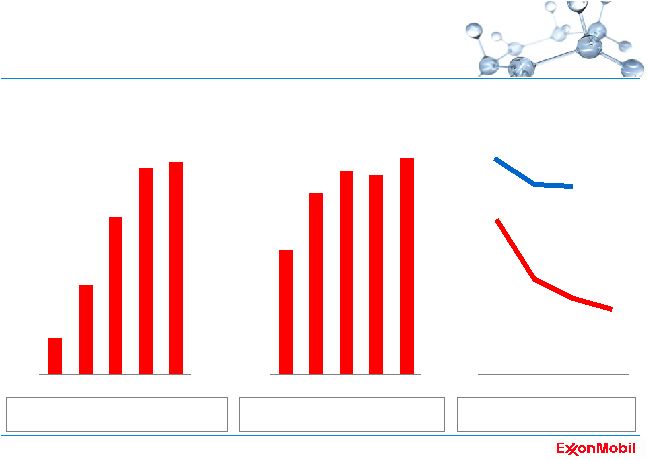
 41 industry-leading volumes per share *competitor data estimated using a consistent basis with ExxonMobil, and based on public
information; 2008 reserves data estimated for CVX based on Q4 2008 earnings
release; 2007 reserves data used for BP and RDS as 2008 data not yet available 90 100 110 120 130 140 '04 '05 '06 '07 '08 reserves per share, indexed* XOM BP RDS CVX 90 100 110 120 '04 '05 '06 '07 '08 production per share, indexed* XOM BP RDS CVX |
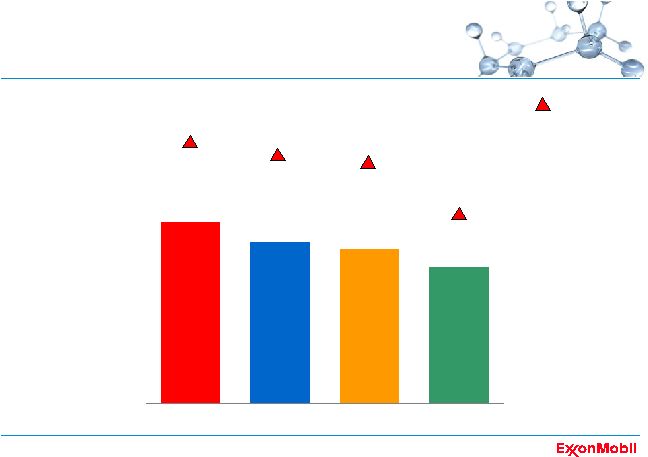 42 0 5 10 15 20 25 XOM CVX RDS BP industry-leading earnings '04-'08 net income per barrel $ / OEB 2008 2008 *competitor data estimated on a consistent basis with ExxonMobil, and based on public information
|
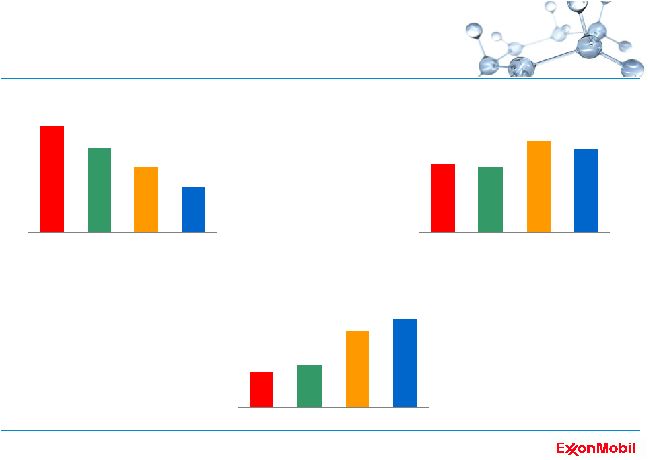
 43 industry-leading returns *competitor data estimated on a consistent basis with ExxonMobil, and based on public
information 0 20 40 60 XOM BP RDS CVX average capital employed* reported net income* return on average capital employed* $B $B % 0 20 40 60 80 XOM BP RDS CVX 0 10 20 30 40 XOM BP RDS CVX '04 '08 '04 '08 |
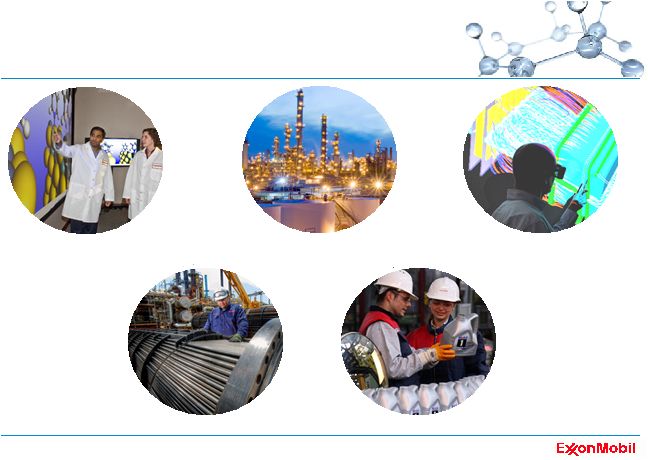
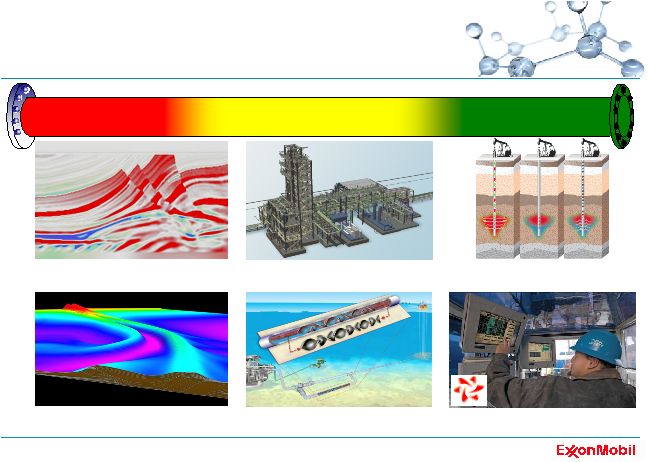 44 long-term commitment to research commercial applications identified opportunities evaluation Fast Drill Process LASER Controlled Freeze Zone™ EMColdFlow™ Sub-Seismic Reservoir Characterization Advanced Subsurface Imaging |
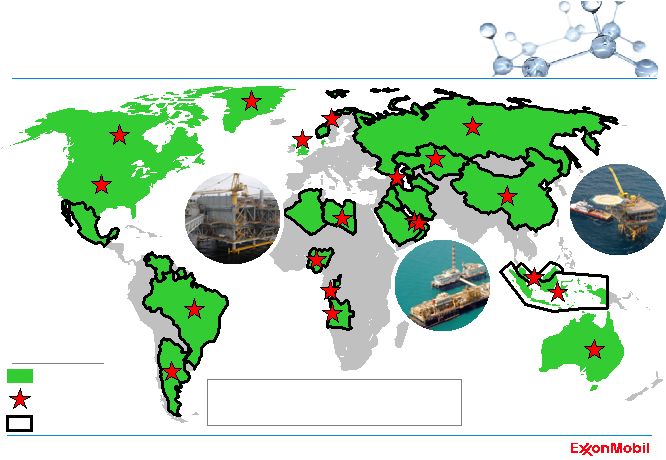 45 long-term partner of choice West Africa Asia Pacific Middle East 125 years of experience working with host countries with NOC resource owners from USGS with ExxonMobil Upstream participation top 30 countries |
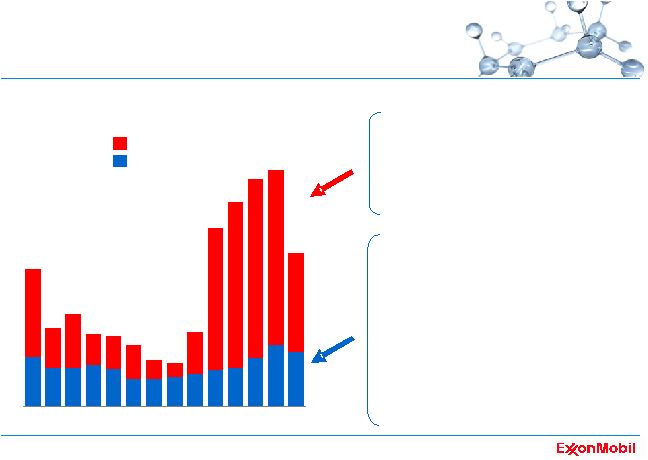
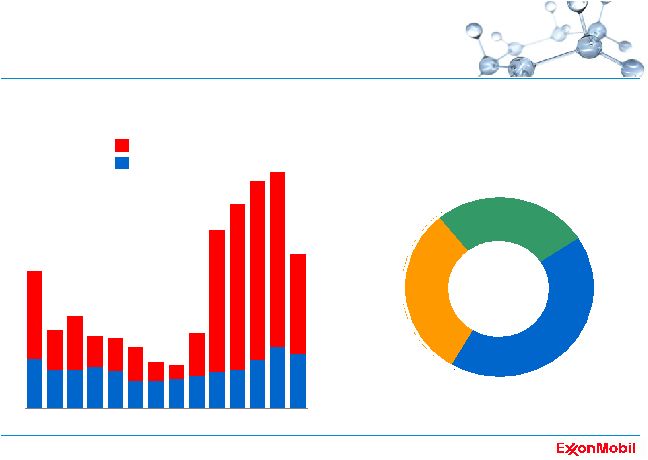
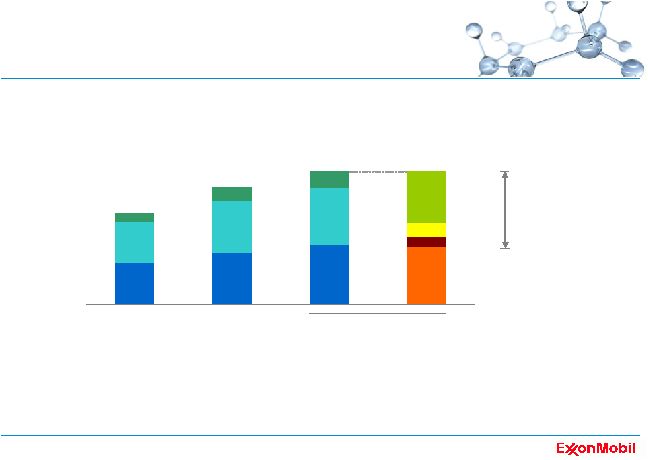 46 long-term investing for future growth • ExxonMobil continues to take a long-term view and invest in attractive
projects – financial strength to invest through the cycle – increased development project investment to deliver near- to mid-term volumes – increased exploration activity driven by quality opportunity captures 0 10 20 30 '03-'07 average '08 Upstream capex existing operations new volumes: start-up timing '09 new projects major new projects exploration existing operations 2009 2010 - 2011 2012+ $B |
 47 0 1 2 3 4 5 '08 '09 '10 '11 '12 '13 total production outlook 0 1 2 3 4 5 '08 '09 '10 '11 '12 '13 MOEBD, net liquids gas Asia Pacific / Middle East Americas Africa Russia / Caspian Europe MOEBD, net profitable production growth |
 48 Upstream summary • largest, highest-quality opportunity portfolio • lowest life-cycle cost, exploration to production • highest standards of integrity • proprietary suite of industry-leading technologies • superior value for our shareholders and for resource owners • uniquely positioned for attractive growth |
 49 Downstream Overview |
 50 • strong financial performance – earnings $ 8.2 B – ROCE 31.8 % – refinery throughput 5.4 MBD – petroleum product sales 6.8 MBD • focus on operational excellence • maintaining capital discipline • results underpinned by technology, efficiency, integration, and margin enhancement 2008 highlights |
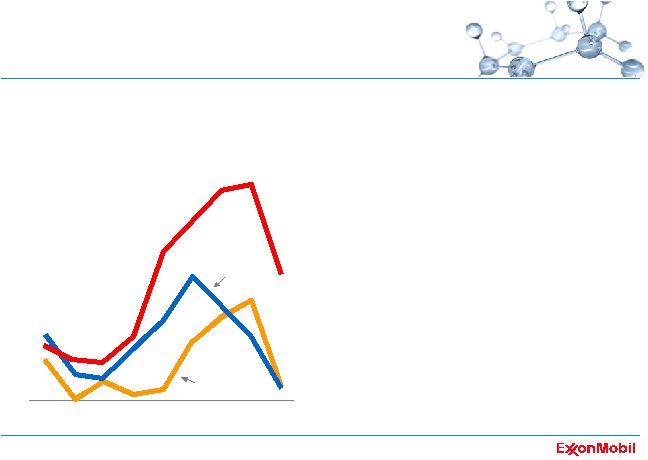
 51 downstream industry environment *ExxonMobil estimates • 2005 – 2030 products growth averages about 1% per year • diesel demand driving growth • gasoline demand slowing 0 1 2 3 '80-'90 '90-'00 '00-'10 '10-'20 '20-'30 global products demand* annual compound growth % |
 52 Downstream strategies • maintain best-in-class operations, in all respects • provide quality, valued products and services to our customers • lead industry in efficiency and effectiveness • capitalize on integration with other ExxonMobil businesses • selectively invest for resilient, advantaged returns • maximize value from leading-edge technologies |
 53 operational excellence project execution controls integrity reliability energy efficiency safety and environment product quality |
 54 sales volume refining capacity 1.7 MBD 1.4 MBD 23% 27% retail sites 20% 6.7 #K Asia Pacific Americas sales volume refining capacity 2.6 MBD 3.4 MBD 51% 42% retail sites 50% 14.5 #K business overview refineries (37 total) total YE '08 refining capacity 6.2 MBD retail sites 28.7 K sales volume 6.8 MBD Europe / Africa / Middle East sales volume refining capacity 1.9 MBD 2.0 MBD 26% 31% retail sites 30% 7.5 #K |
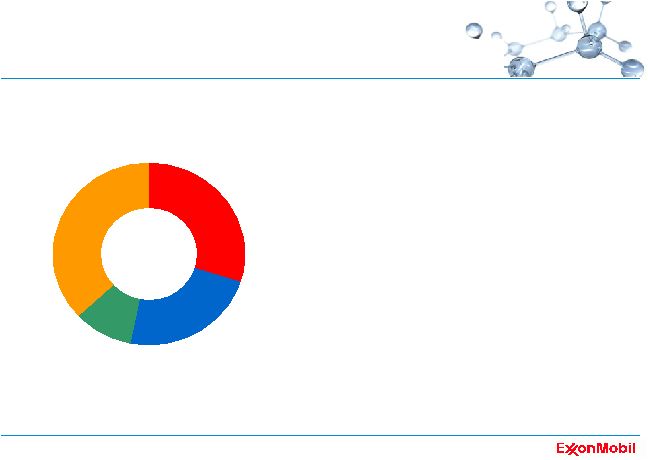 55 fuels marketing structural advantages • largest supplier / marketer of petroleum products • leveraging integration with Refining • broad spectrum of customer channels • product placement for highest value • global systems, work processes and best practices global fuel sales Industrial & Wholesale 23% Retail 30% Aviation / Marine 10% Supply 37% Industrial & Wholesale 23% Retail 30% Aviation / Marine 10% Supply 37% |
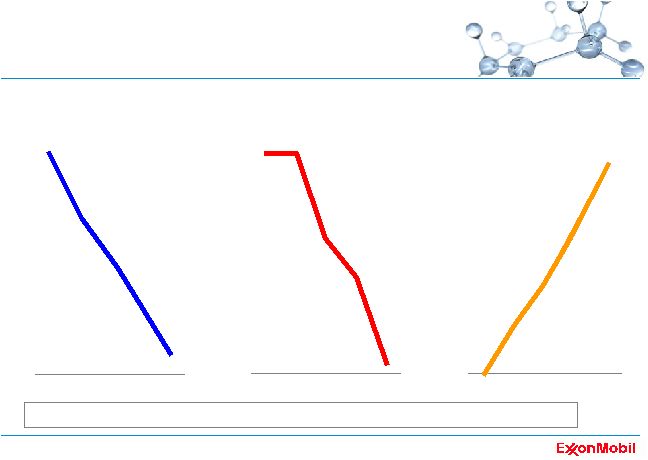 56 fuels marketing self-help improved efficiency and portfolio highgrading delivers higher returns *all data at constant foreign exchange rates; operating cost efficiency at constant
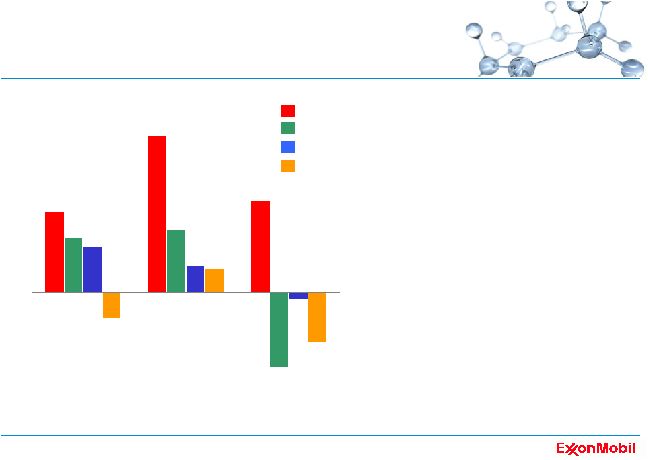
foreign exchange rates and energy price 0 15 30 45 60 '04 '06 '08 -10 -5 0 '04 '06 '08 -50 -40 -30 -20 -10 0 '04 '06 '08 capital productivity* sales volume per dollar average capital employed, percent change average capital employed, percent change operating cost efficiency* asset efficiency* operating expenses, percent change |
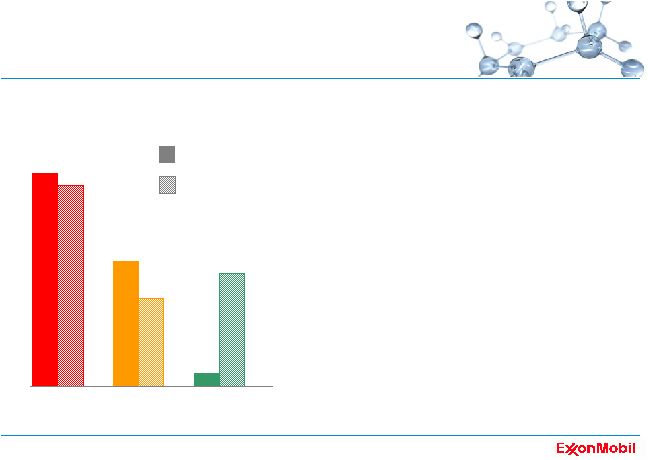 57 lubes structural advantages • largest global manufacturer of lube basestocks • leveraging integration with Refining and Chemical • leading synthetic lube brands • renowned for innovation and technology leadership • strong relationships with original equipment manufacturers source: ExxonMobil estimates based on available industry data and public
information 0 5 10 15 20 XOM RDS BP % 2008 market share basestocks synthetic lubes |
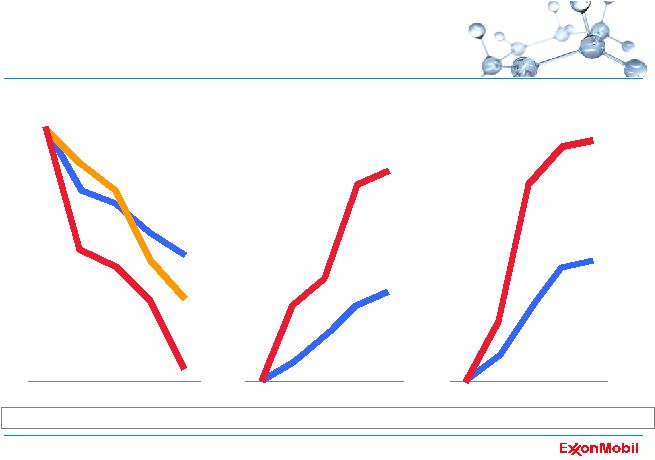 58 -70 -60 -50 -40 -30 -20 -10 0 '04 '06 '08 0 10 20 30 40 '04 '06 '08 0 10 20 30 40 '04 '06 '08 lubes self -help synthetic lubricants growth key growth markets* sales, percent change ExxonMobil Industry ExxonMobil Industry operating efficiencies business simplification, leadership in brand and technology ensure long-term competitive advantage number, percent change order centers products blend plants sales, percent change source: ExxonMobil estimates based on available industry data and public
information *passenger, commercial and industrial finished lubricants sold in
key growth markets |
 59 capacity and scale advantage 80 90 100 110 120 130 140 '02 '04 '06 '08 unit cash operating expense* indexed ExxonMobil Industry 80 90 100 110 120 130 140 '02 '04 '06 '08 unit cash operating expense* indexed ExxonMobil Industry 100 150 200 250 average refinery size KBD 100 150 200 250 average refinery size KBD XOM BP RDS Industry integration with chemicals or lubes % 30 40 50 60 70 80 XOM RDS BP Industry integration with chemicals or lubes % 30 40 50 60 70 80 XOM RDS BP Industry refining structural advantages source: equity share capacity calculated on consistent basis using public
information source: unit cash operating expense based on data from Solomon
Associates and ExxonMobil estimates *only even-year Solomon data available
through ‘06; '08 estimated by ExxonMobil; data at constant foreign exchange rates and energy price; unit cash operating expense data indexed to ExxonMobil
('02) |
 60 refining self-help *ExxonMobil capacity share excluding divestments and acquisitions **only even-year Solomon data available through '06; '08 estimated by ExxonMobil;
data indexed to ExxonMobil ('02) source: energy intensity based on data from
Solomon Associates and ExxonMobil estimates 0 40 80 120 160 '04 '05 '06 '07 '08 new crudes to individual refineries conversion capacity growth* number effectively adding a new unit every two years applying technology to capture new crude incentives advantage versus competition 90 95 100 105 '02 '04 '06 '08 energy intensity** indexed ExxonMobil Industry 0 20 40 60 80 100 '04 '05 '06 '07 '08 incremental KBD vs '03 |
 61 improved catalysts technology leadership site optimization advanced modeling advanced lubricants efficiency and reliability |
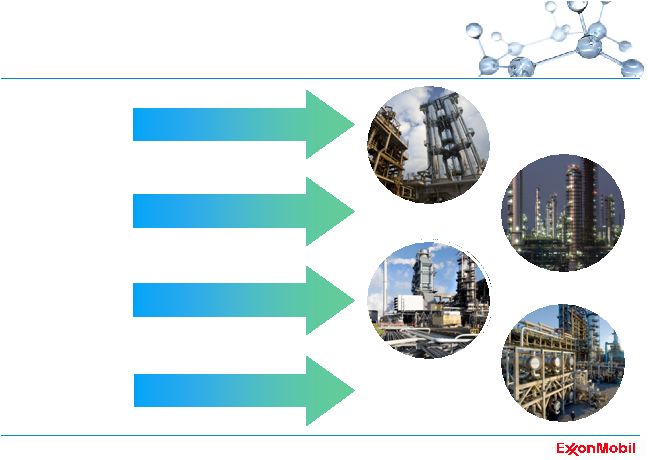 62 advantaged investments product demand integrated projects efficiency unit expansions and debottlenecks lower-sulfur diesel Fujian joint venture cogeneration increased conversion capacity |
 63 portfolio highgrading major business restructuring activities '00 - '08* *announced/completed in one or more Downstream business functions
|
 64 industry-leading returns • proven business strategies • leveraging corporate strengths • significant competitive advantage *competitor data estimated on a consistent basis with ExxonMobil, and based on public
information % return on average capital employed* 0 10 20 30 40 '00 '02 '04 '06 '08 ExxonMobil Competition |
 Chemical Overview 65 |
 66 2008 highlights • earnings of $3.0 B, ROCE of 20.4 % – global scale – integration and feedstock flexibility • operational excellence continues – safety – efficiency • capex of $2.8 B – advantaged Asia Pacific growth – specialty business growth |
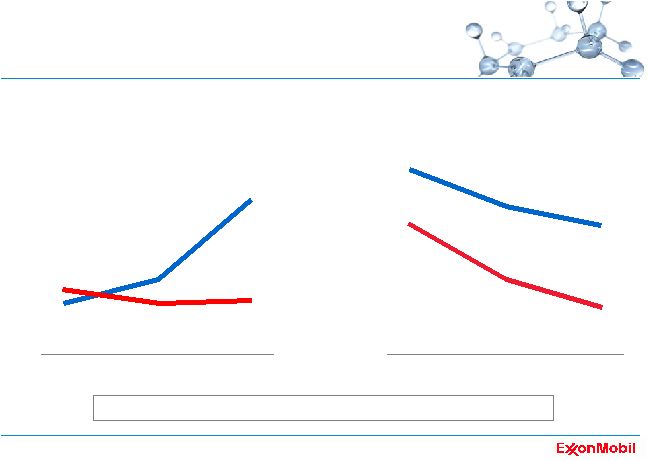
 0 50 100 150 200 '90 '95 '00 '05 '10 '15 PE, PP, PX demand* MTA paraxylene (PX) polypropylene (PP) polyethylene (PE) chemical industry environment *ExxonMobil estimates 67 |
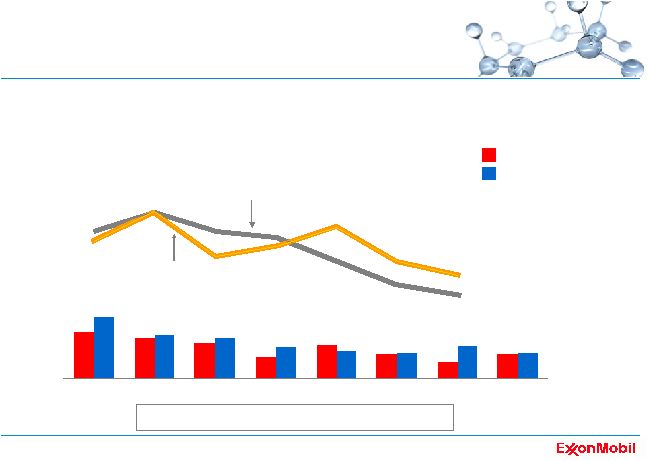
 0 50 100 150 200 '90 '95 '00 '05 '10 '15 margin, nominal, indexed PE, PP, PX trends* capacity util., % 0 50 100 150 200 '90 '95 '00 '05 '08 92 88 84 80 76 margin capacity utilization PE, PP, PX demand* MTA Asia Pacific Europe / Middle East / Africa Americas chemical industry environment *ExxonMobil estimates 68 |
 Chemical strategies • unique portfolio of global businesses • integration across ExxonMobil operations • relentless focus on operational excellence • disciplined investment in advantaged projects • technology leadership long-term strategy built on ExxonMobil’s strengths 69 |
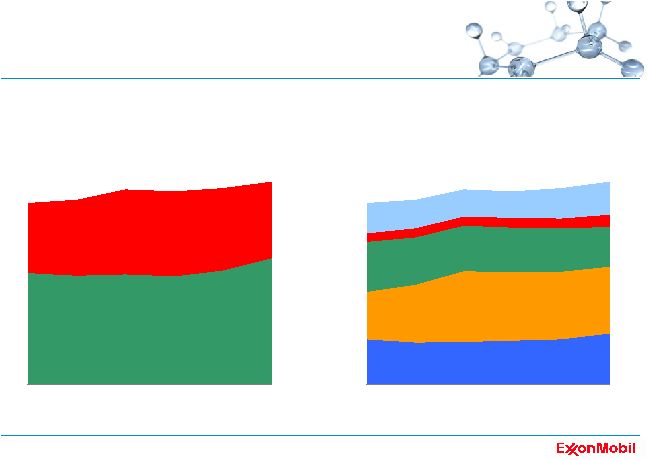
 70 earnings, $B business mix high-performing business portfolio '95 '05 0 1 2 3 4 5 aromatics polyethylene polypropylene olefins cyclical commodity businesses butyl polymers specialty elastomers adhesive polymers fluids oxo alcohols synthetics films less cyclical specialty businesses petroleum additives commodity specialty '00 |
 71 high-performing business portfolio geographic mix 2008 sales volume earnings, $B business mix '95 '05 0 1 2 3 4 5 commodity specialty '00 Americas Asia Pacific Europe / Middle East / Africa |
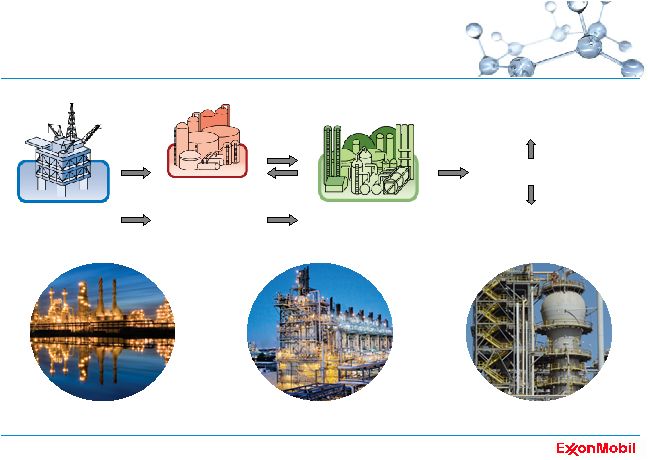 72 value through integration basic chemicals polymers / intermediates specialties chemical plant refinery production gas processing refinery steam cracker polyethylene plant |
 73 operational excellence source: Solomon Associates *only odd-year Solomon data available '03-'07, data indexed to ExxonMobil
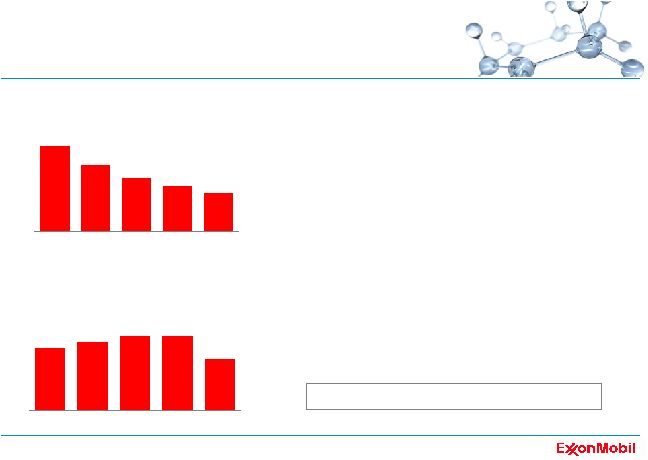
('03) 90 95 100 105 '03 '05 '07 80 100 120 140 '03 '05 '07 global steam cracker efficiency, indexed North America steam cracker fixed costs, indexed operating costs* widening our efficiency advantage versus industry energy efficiency* Industry ExxonMobil Industry ExxonMobil |
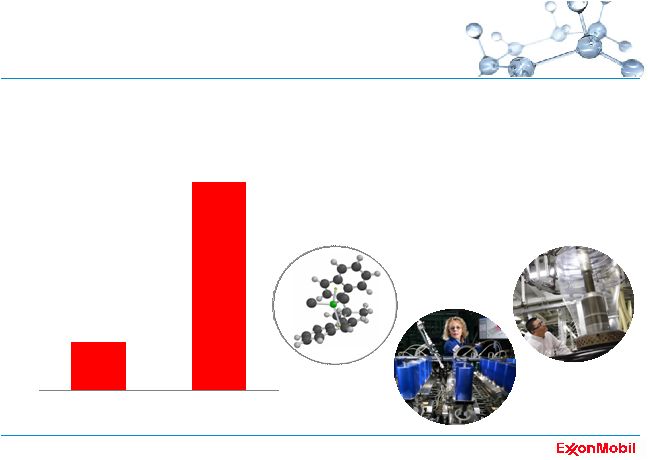 74 80 100 120 140 160 180 '04 '08 metallocene products sales growth indexed premium product growth focus areas • solutions to customer needs • technology investment • commodity differentiation • Asia demand growth |
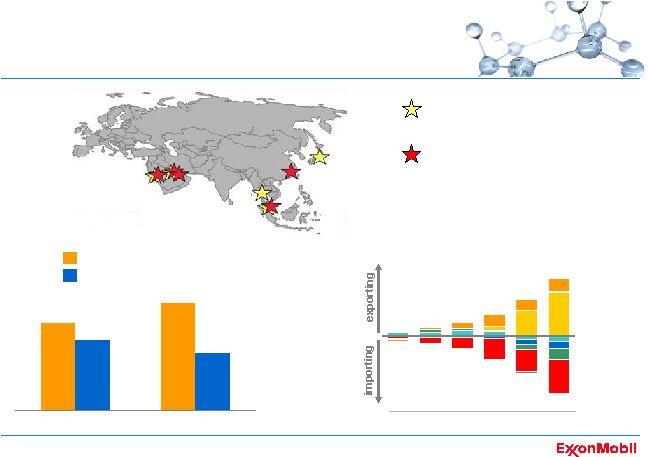 75 major growth projects MT PE, PP, PX demand growth* existing large / integrated sites in Asia Pacific and the Middle East NA SA India Europe Other China Middle East MTA '90 '95 '00 '05
'10 '15 PE, PP, PX net trade* Asia rest of world 0 20 40 '95-'05 '05-'15 major growth projects currently under development *ExxonMobil estimates |
 76 delivering superior returns • proven business strategies • leveraging corporate strengths • significant competitive advantage *competitor data estimated on a consistent basis with ExxonMobil, and based on public
information **BP (through '04), RDS, CVX 0 10 20 30 40 ExxonMobil Dow Chemical Integrated Oils** ' 00 '02 ' 04 '06 ' 08 % return on average capital employed* |
 77 Summary |
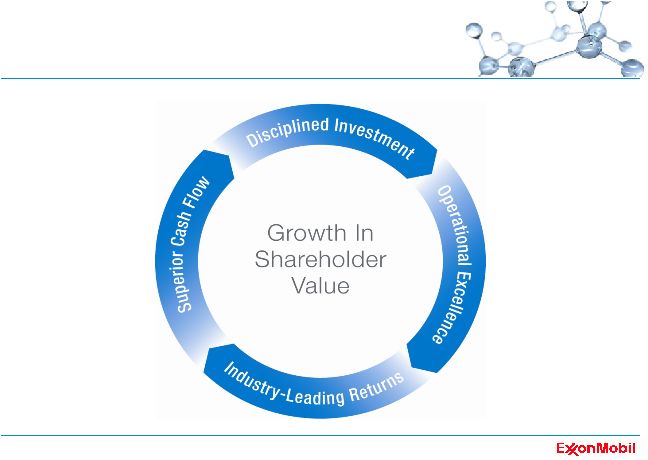 78 proven business model |
 79 risk management • long-term planning • commitment to technology • consistent financial approach • global systems and processes • operational excellence • enduring business controls disciplined, comprehensive approach delivering long-term success |
 80 growth in shareholder value *RDS, CVX and BP 0 3 6 9 12 15 20 years 10 years 5 years ExxonMobil competitor average* S&P 500 value of $1,000 invested $K shareholder returns |
 81 ExxonMobil • industry-leading portfolio of businesses and assets • disciplined and consistent approach across the business • commitment to technology leadership • superior financial flexibility • relentless focus on maximizing long-term value • uniquely well-positioned for the future |