 Analyst
Meeting New York - March 5, 2008 Analyst Meeting New York - March 5, 2008 Exhibit 99.2 |
| Analyst
Meeting New York - March 5, 2008 Analyst Meeting New York - March 5, 2008 Exhibit 99.2 |
 Cautionary Statement Forward-Looking Statements. Outlooks, projections, estimates, targets, and business plans in this presentation or the subsequent discussion period are forward-looking statements. Actual future
results, including demand growth and mix; ExxonMobil’s own production
growth and mix; the amount and mix of capital expenditures; resource additions
and recoveries; finding and development costs; project plans, timing, costs, and capacities; revenue enhancements and cost efficiencies; industry margins; margin enhancements and integration
benefits; and the impact of technology could differ materially due to a number
of factors. These include changes in long-term oil or gas prices or other
market conditions affecting the oil, gas, and petrochemical industries; reservoir performance; timely completion of development projects; war and other political or security disturbances;
changes in law or government regulation; the outcome of commercial
negotiations; the actions of competitors; unexpected technological developments; the occurrence and duration of economic recessions; unforeseen technical
difficulties; and other factors discussed here and under the heading
"Factors Affecting Future Results" in the Investor section of our Web site at exxonmobil.com. See also Item 1A of ExxonMobil’s 2007 Form 10-K. Forward-looking statements are based on management’s knowledge and reasonable expectations on the date hereof, and we
assume no duty to update these statements as of any future date. Frequently Used Terms. References to resources, resource base, recoverable resources, and similar terms include quantities of oil and gas that are not yet classified as proved reserves but that we believe will likely be moved into the proved reserves category and produced in the future. The discussion of
reserves in this presentation generally excludes the effects of year-end
price/cost revisions and includes reserves attributable to equity companies and our Syncrude operations. For definitions of, and information regarding,
reserves, return on average capital employed, normalized earnings, cash flow
from operations and asset sales, and other terms used in this presentation, including information required by SEC Regulation G, see the "Frequently Used
Terms" posted on the Investor section of our Web site. The Financial and
Operating Review on our Web site also shows ExxonMobil's net interest in specific projects. 2 |
 Corporate Overview Analyst Meeting March 5, 2008 3 |
 • Industry-leading safety performance • Record financial performance – Net Income $40.6 B – ROCE 32 % – Cash flow from Operations and Asset Sales $56 B • Total Distributions to $36 B Shareholders * • Capex $21 B • Reserves Replacement ** 101 % • Total Shareholder Return 24 % 2007 – Record Results * Includes dividends and share purchases to reduce shares outstanding ** Excludes year-end price/cost effects and includes Canadian oil sands operations
4 |
 Disciplined Investment Operational Excellence Industry Leading Returns Superior Cash Flow Growth in Shareholder Value Proven Long-Term Approach 5 |
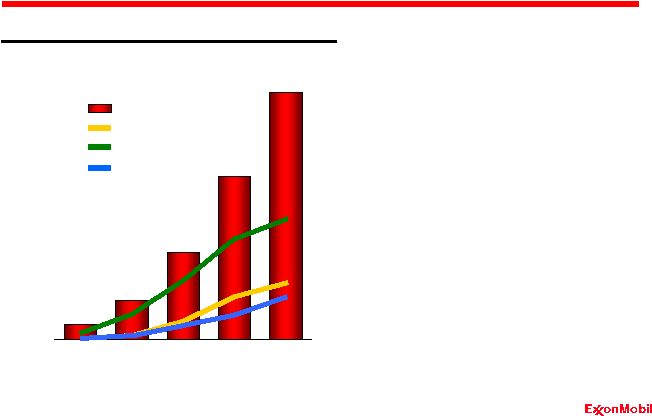
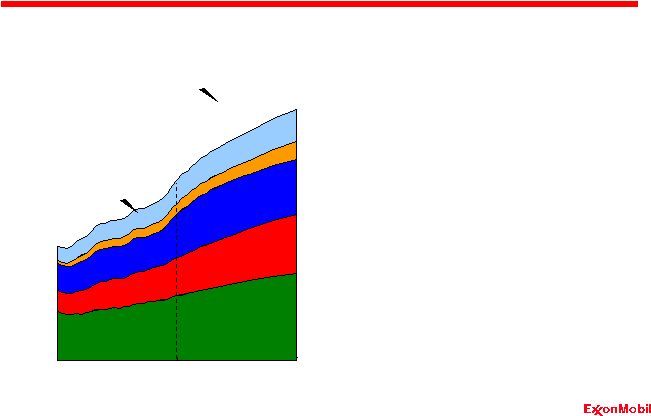 Energy
Demand • Economic progress driving global energy demand higher • Oil and natural gas are indispensable • Requirements to meet rising demand: – Massive investments – Technology innovations – Integrated solutions – Timely execution 0 50 100 150 200 250 300 350 1980 2005 2030 Oil Gas Coal Nuclear Renewables 1.5% 1.7% 0.9% 2.0% 1.2% 1.3% Average Growth / Yr. 2005 – 2030 MBDOE 6 |
 Company
Strengths Portfolio Quality Global Integration Discipline and Consistency Value Maximization
Long-Term
Perspective Growing Competitive Advantage Growing Competitive Advantage 7 |
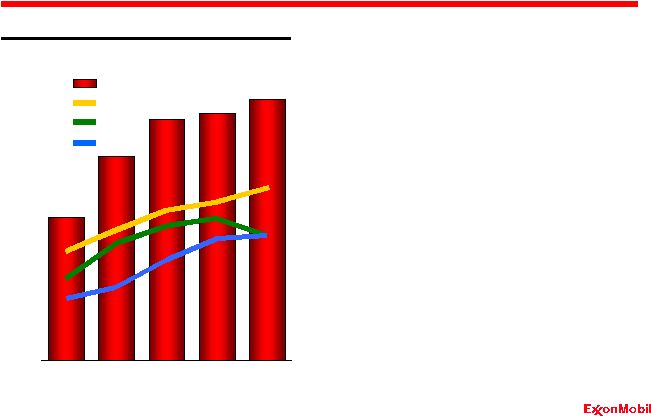
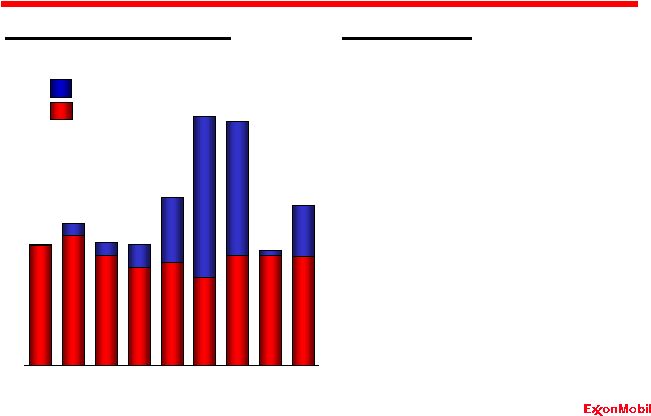
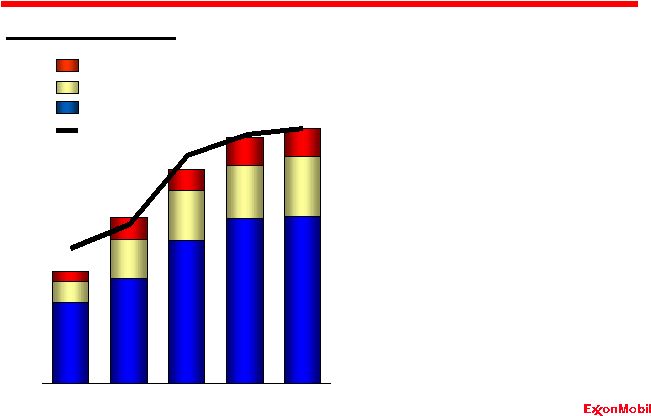 Record
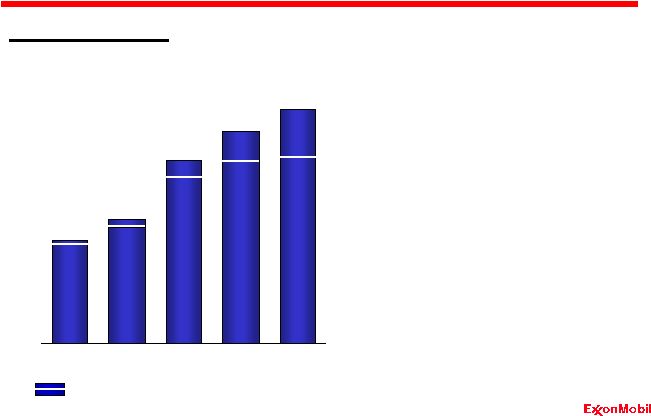
Results Portfolio Quality • Superior results in all business segments • Commitment to operations excellence • Capitalizing on competitive advantages Normalized Earnings $B Chemical Downstream Upstream Net Income 0 5 10 15 20 25 30 35 40 45 '03 '04 '05 '06 '07 8 |
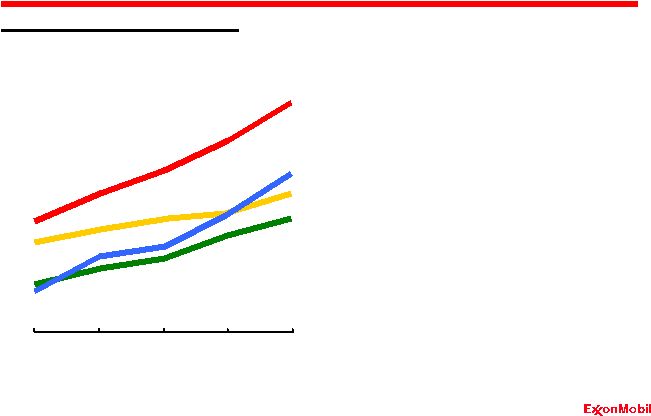 Superior ROCE Portfolio Quality * Competitor data estimated using a consistent basis with ExxonMobil, and based on public
information • Consistently outperform competition • Results from implementation of business model – Capital discipline – Operational excellence – Asset management RDS BP CVX Return on Capital Employed * 5-Year Rolling Average % XOM 6 10 14 18 22 26 30 '03 '04 '05 '06 '07 9 |
 Superior ROCE Portfolio Quality * Competitor data estimated using a consistent basis with ExxonMobil, and based on public
information • Industry-leading returns in all business segments • Consistent execution of business model • Disciplined investment across the business cycles • Strength of integrated portfolio Upstream Downstream Chemical % Return on Capital Employed * 2007 - Business Segments 0 5 10 15 20 25 30 35 40 45 50 XOM CVX RDS BP 10 |
 Investing in Our Future – People Global Integration • Long-term commitment to recruitment, development, and training • Global approach • Common development systems and processes • Outstanding employee capabilities • Unmatched opportunities 11 |
 Functional Organization Global Integration • Industry-leading approach • Long-term investment in enabling systems and procedures • Consistent global execution of business processes • Facilitates rapid deployment of new technology and best practices • Continuing to develop and mature • Delivering differentiated results 12 |
 Common Processes and Systems Global Integration ExxonMobil Capital Project System Operations Integrity Management System GEMS Global Energy Management System GRS Global Reliability System Controls Integrity Management System Plan Plan Select Select Define Define Execute Execute Operate Operate 13 |
 Safety
Leadership Discipline and Consistency Lost Time Incident Rate Incidents per 200k hours 0.2 0.3 U. S. Petroleum Industry Employee Benchmark* * 2007 Industry data not available U. S. Petroleum Industry Contractor Benchmark* Nobody Gets Hurt Employee Contractor 0.0 0.1 0.4 0.5 '01 '02 '03 '04 '05 '06 '07 14 |
 • Safely and reliably meeting energy demand • Reducing environmental impact – Preventing spills and releases – Protecting biodiversity • Reducing GHG emissions from energy production – Energy efficiency and cogeneration – Flare reduction • Improving consumer use of energy Discipline and Consistency Operations Excellence Disciplined Investments Environmental Planning Technology Applications Protect Tomorrow. Today. Energy Security & Environmental Leadership 15 |
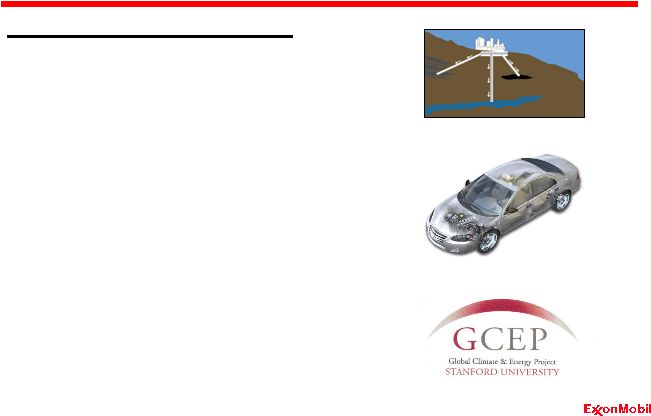 • World energy demand growing • Identifying breakthrough technologies – Efficient and cost-effective – Global and large scale deployment • Strategic research initiatives – Carbon capture and sequestration – Advanced vehicles and fuels – Global Climate & Energy Project Discipline and Consistency Energy Security & Environmental Leadership Investing in Solutions Beyond 2030 Advanced Vehicles and Fuels Carbon Capture and Sequestration Saline Aquifers Depleted Oil & Gas Reservoirs Coal Beds Pipelines Saline Aquifers Depleted Oil & Gas Reservoirs Coal Beds Pipelines 16 |
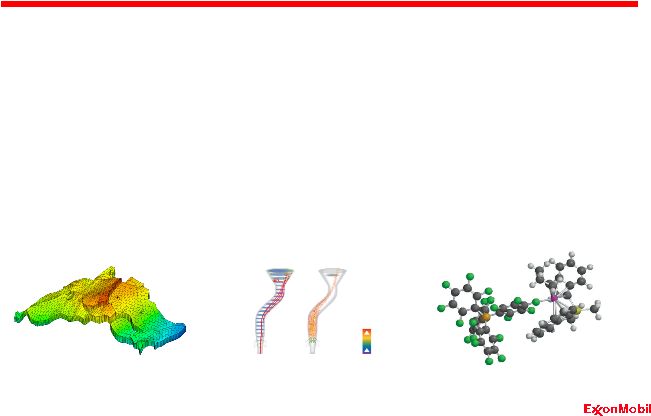 Technology Leadership • Delivering long-term competitive advantage • Unwavering commitment to research • Disciplined, focused investment – more than $3.5 billion since 2003 • Research priorities determined by business requirements • Value capture maximized through rapid, global deployment Value Maximization EM power Advanced Reservoir Simulation Complex Modeling Tools Proprietary Catalyst Increasing Temperature 17 |
 • Unique integration capabilities • Advantaged technology • Project and operations management • Global systems and processes • Centralized common support activities • Maximizing resource value Integration Value Maximization 18 |
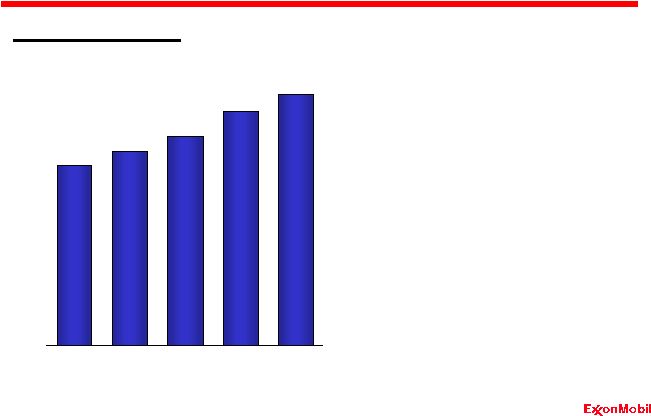
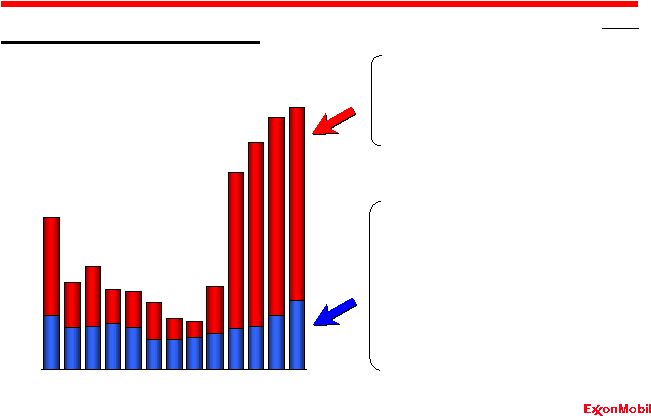
 Superior Cash Flow Value Maximization 0 10 20 30 40 50 '03 '04 '05 '06 '07 Cash Flow from Operating Activities * $B * Excludes asset sales, 2007 competitor data estimated based on publicly available data
XOM RDS BP CVX • Record $52 billion in 2007 • Average $44 billion per year from 2003 to 2007 • Capturing the upside • $9.43/share in 2007 19 |
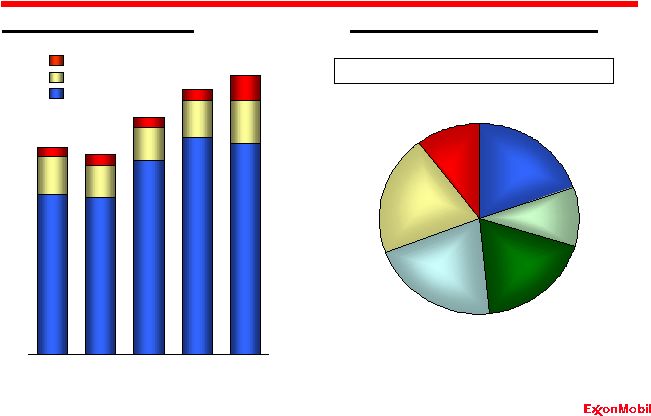 Investing for the Future Value Maximization Capex by Business Line $B Chemical/ Other Downstream Upstream 0 4 8 12 16 20 '03 '04 '05 '06 '07 U.S. Geographic Capex Distribution Europe Africa Asia Pacific / Middle East Russia / Caspian Canada / South America $89 Billion Invested from 2003 to 2007 20 |
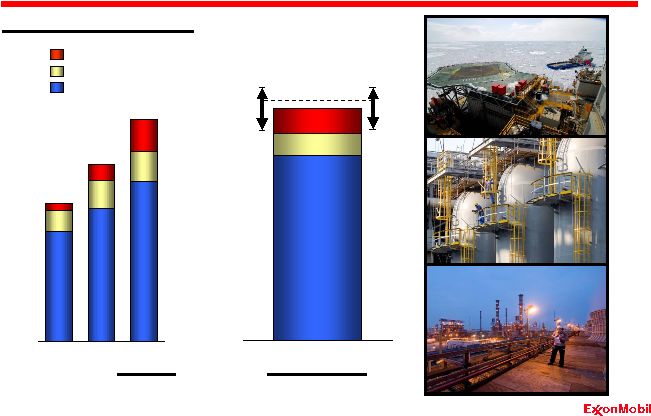 Investing for the Future Capex by Business Line $B Value Maximization Chemical/ Other Downstream Upstream Estimate Avg '02-'06 0 5 10 15 20 25 30 '07 '08 Estimate $B Estimate Range 0 5 10 15 20 25 30 '09-'12 Average 21 |
 Reliable and Growing Dividends • Distributed $36 billion over past five years • Paid dividends each year for more than 100 years • Annual per share increases since 1983 • Dividends per share increased 40% from 2003 vs. CPI of 13% Value Maximization Dividends per Share $/share 0.00 0.20 0.40 0.60 0.80 1.00 1.20 1.40 '03 '04 '05 '06 '07 22 |
 Cumulative Share Purchases • Distributed $82 billion during last five years and $28 billion in 2007 • Reduced shares outstanding by 20% since beginning of 2003 • Flexible and efficient distribution tool to manage capital structure $B Purchases to Reduce Shares Outstanding* Value Maximization XOM RDS BP CVX * Competitor data estimated using a consistent basis with ExxonMobil, and based on public
information 0 50 60 70 80 '03 '04 '05 '06 '07 40 10 20 30 23 |
 Increasing Ownership Indexed Growth per Share Since 2003* • Increasing ownership per share • Strong per share growth in key business metrics • Contributes to increased earnings per share *2007 metric per average share vs. 2003 metric per average share Production Proved Reserves Refinery Throughput Chemical Prime Product Sales Value Maximization % 0 5 10 15 20 25 24 |
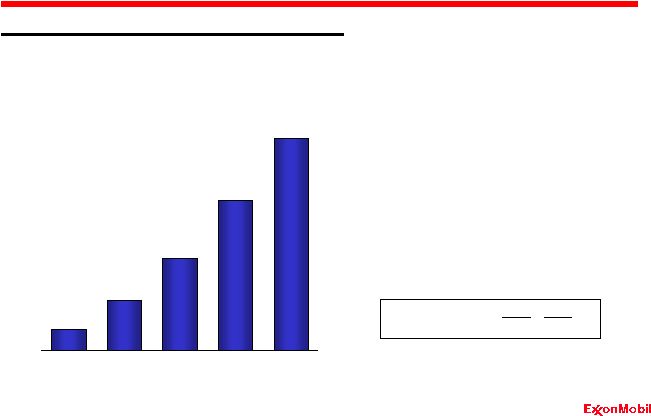
 0.0 1.0 2.0 3.0 4.0 5.0 6.0 7.0 8.0 '03 '04 '05 '06 '07 Increasing Value per Share Earnings per Share $/share • Annualized growth of 23% • Captured upside • Growth driven by – Higher commodity prices and refining margins – Strong business performance – Share purchases contributed $1.50 to 2007 EPS* Value Maximization * Versus number of shares outstanding on January 1, 2001 Contribution from share repurchases 25 |
 • Cumulative distributions of $118 billion 2003 to 2007 • Annual distributions tripled • Market capitalization more than doubled % Market Capitalization at YE 2002 Long-Term Perspective Total Shareholder Distributions Market 2002 2007 Capitalization ($B) 234 504 Cumulative Total Distributions Since 2003 0 10 20 30 40 50 60 '03 '04 '05 '06 '07 26 |
 Growth
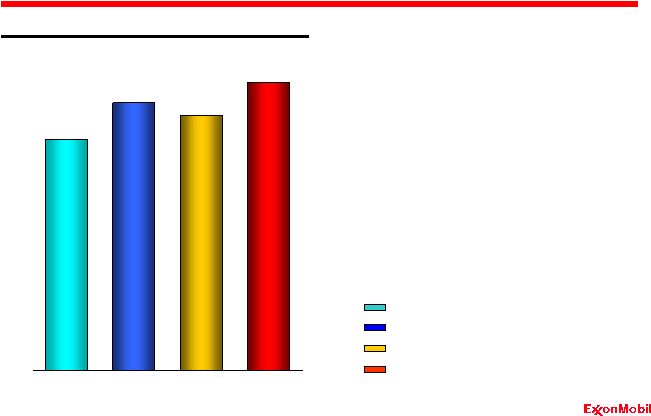
in Shareholder Value Long-Term Perspective Shareholder Returns Disciplined Investment Operational Excellence Industry Leading Returns Superior Cash Flow Growth in Shareholder Value ExxonMobil Competitor Average* S&P 500 * Shell, BP and Chevron Growing Competitive Advantage $K Value of $1,000 Invested 0 2 4 6 8 10 12 14 16 18 20 20 Years 10 Years 5 Years 27 |
 Upstream Overview Analyst Meeting March 5, 2008 28 |
 2007
Highlights Upstream • Earnings $26.5 B • ROCE 41.7 % • Production volumes 4.2 MOEBD
• Resource adds 2.0 BOEB • Proved reserves adds 1.6 BOEB • Capex $15.7 B 29 |
 Upstream Strategies • Focus on operations integrity – best-in-class performance • Identify and pursue all attractive exploration opportunities • Invest in projects that deliver superior returns • Maximize profitability of existing oil and gas production • Capitalize on growing natural gas and power markets • Maximize resource value through highest impact technologies and integrated solutions Upstream 30 |
 Company
Strengths Portfolio Quality Global Integration Discipline and Consistency Value Maximization
Long-Term
Perspective Growing Competitive Advantage Growing Competitive Advantage 31 |
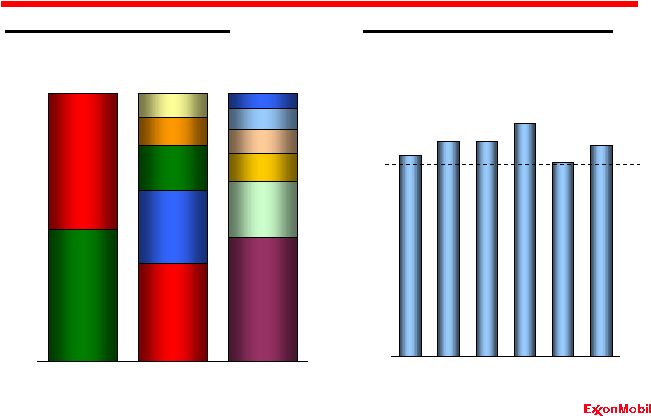
 Size,
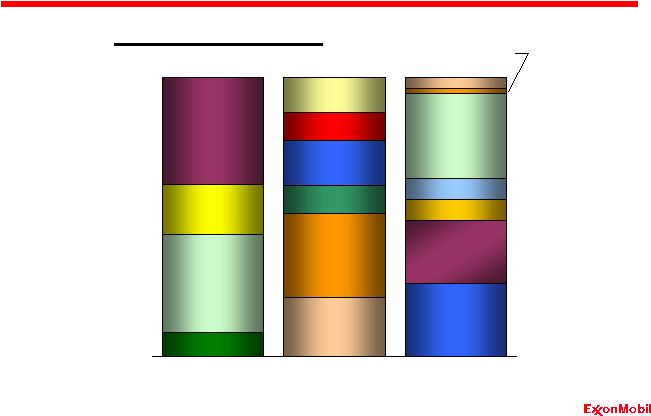
Diversity and Superior Quality Upstream: Portfolio Quality Resource Base Americas Europe Russia/Caspian Africa 72 BOEB Asia Pacific / Middle East 0 40 80 YE '07 Resource Type LNG Tight Gas Conventional Deepwater Arctic Heavy Oil / Oil Sands Acid / Sour Gas BOEB 32 |
 Adding to the Resource Base Upstream: Portfolio Quality Annual Resource Additions BOEB Discovered Undeveloped By-The-Bit 2007 Highlights • 2 BOEB resource additions, key adds include: – Piceance Basin, U.S. – West Africa – Asia Pacific • Completed 55 wildcat and 12 appraisal wells – 55% wildcat success rate • Average finding cost of $0.97 per OEB '00 '01 '02 '03 '04 '05 '06 '07 Average 0 1 2 3 4 5 33 |
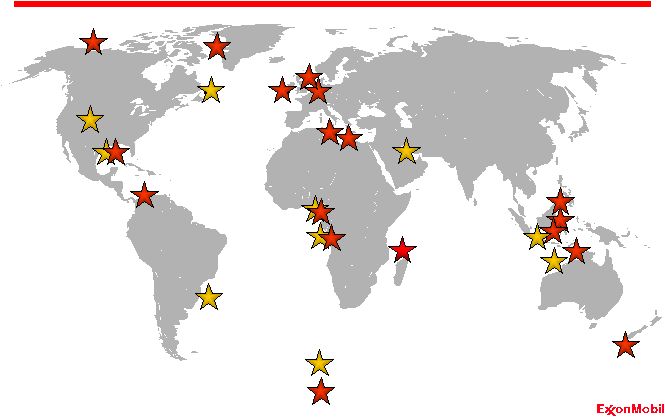
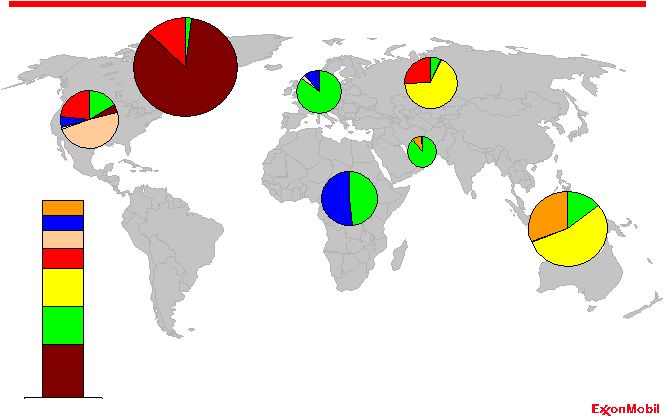
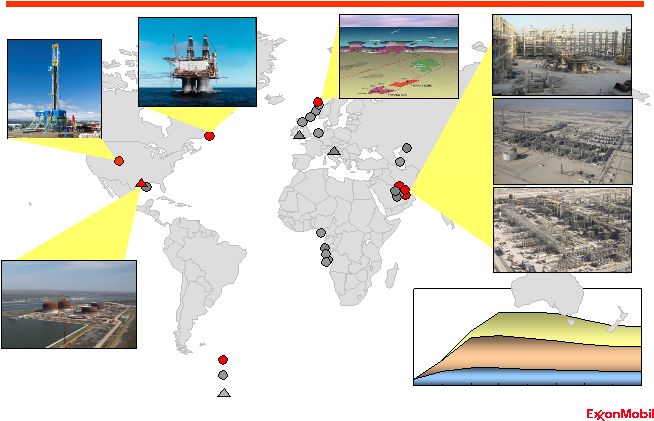
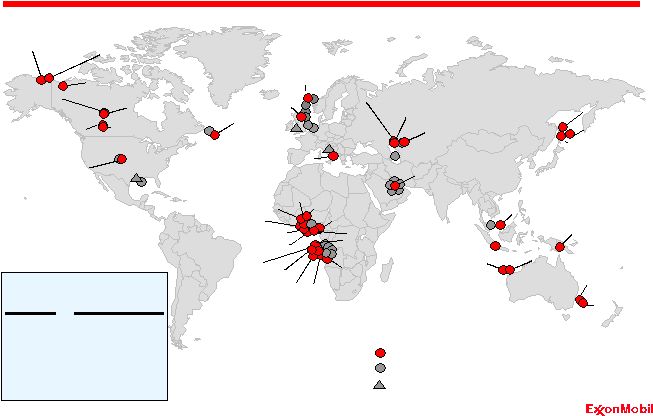
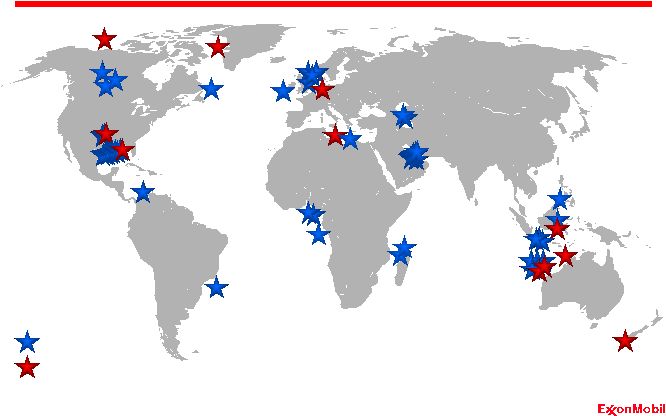 Opportunity Capture Spans the Globe Upstream: Portfolio Quality 2000 - 2006 • Over 60 worldwide opportunity captures since 2000 • Diverse, global portfolio 2007 34 |
 Key
Wells Upstream: Portfolio Quality 2008 2009+ Brazil Santos U.S. LaBarge Canada Orphan Madagascar Majunga Qatar B2 Australia NW Shelf U.S. Gulf of Mexico Angola Blocks 15, 31, 32 Nigeria B214 / JV Indonesia Cepu Libya CA20/44 Indonesia Makassar New Zealand GSB UK Mid North Sea High Germany LSB Colombia Tayrona Canada Beaufort West Greenland Ireland Porcupine Philippines SC56 35 |
 Reserves Base – Size and Diversity Upstream: Portfolio Quality 0 5 10 15 20 25 Product Region Resource Type BOEB Proved Reserves* (YE 2007) Conventional Conventional LNG LNG Acid/Sour Gas Acid/Sour Gas HO/Oil Sands HO/Oil Sands Arctic Arctic Deepwater Deepwater Asia Pacific/ Middle East Asia Pacific/ Middle East Americas Americas Europe Europe Africa Africa Russia/Caspian Russia/Caspian Oil Oil Gas Gas 0 50 100 150 '03 '04 '05 '06 '07 5-yr Avg Proved Reserves* Replacement (Including asset sales) * ExxonMobil reserves excluding year-end price/cost effects and including Canadian oil
sands operations HO = Heavy Oil % 36 |
 Diverse Inventory of Undeveloped Opportunities Upstream: Portfolio Quality 12 5 3 1 6 8 15 Arctic Deepwater Acid / Sour Gas Tight Gas Heavy Oil / Oil Sands Conventional 50 BOEB LNG 37 |
 0 40 80 120 Project Stage Geography Resource Type Strong Project Inventory Upstream: Portfolio Quality # of Projects (YE 2007) Planning/ Selecting Defining Executing Operating Russia/ Caspian Asia Pacific Americas Europe Africa Middle East Deepwater Conventional Acid / Sour Gas Arctic LNG HO/Oil Sands Tight Gas HO = Heavy Oil 38 |
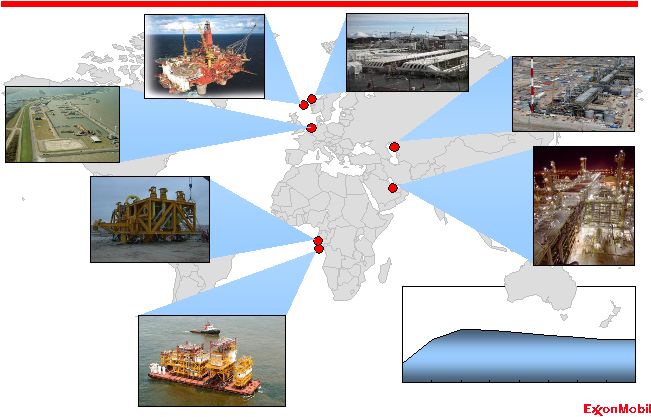 0 200 400 2007 2009 2011 2013 2015 2007 Major Project Start-Ups Upstream: Portfolio Quality Tengiz Phase 1 RasGas Train 5 2007 Start-Ups 2007 Start-Ups KOEBD, Net Statfjord Late Life Rosa Marimba Waddenzee Ormen Lange 39 |
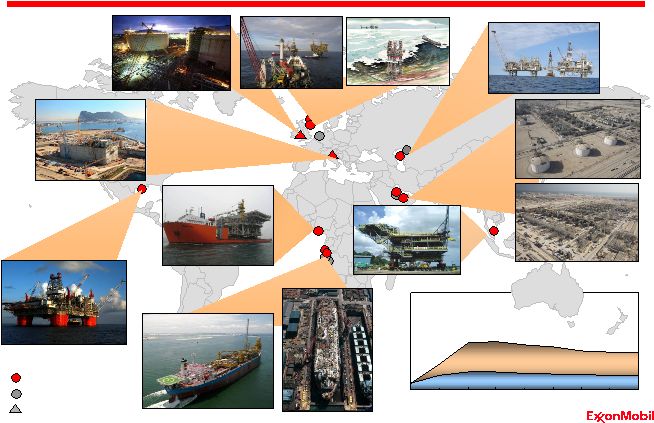 0 400 800 1200 2007 2009 2011 2013 2015 2008 Major Project Start-Ups Upstream: Portfolio Quality Starling KOEBD, Net East Area NGL II 2007 Start-Ups 2007 Start-Ups 2008 Start-Ups 2008 Start-Ups Adriatic Terminal South Hook Terminal Saxi/Batuque Mondo ACG Phase 3 Volve 2008 2007 LNG Terminal Qatargas II Train 4 RasGas Train 6 Thunder Horse Jerneh B 40 |
 0 400 800 1200 2007 2009 2011 2013 2015 2009/2010 Major Project Start-Ups Upstream: Portfolio Quality 2007 Start-Ups 2007 Start-Ups 2008 Start-Ups 2008 Start-Ups 2009-10 Start-Ups 2009-10 Start-Ups KOEBD, Net Al Khaleej Gas Phase 2 Tyrihans Piceance Tight Gas Phase 1 LNG Terminal 2009 / 2010 2007 - 2008 Qatargas II Train 5 RasGas Train 7 Golden Pass Hibernia Southern Expansion 41 |
 2011+
Major Project Start-Ups Upstream: Portfolio Quality Tempa Rossa Alaska Gas / Point Thomson Mackenzie Gas Project Kearl Phase 1 Kearl (Future Phases) Piceance (Future Phases) Kashagan Phase 1 Kashagan (Future Phases) Tengiz Expansion Sakhalin-1 Future Phases Natuna PNG Pazflor CLOV Bonga N Bonga SW Bosi Usan Satellite Projects LNG IPP Project Greater Gorgon 2007 7 2008 19 2009 / '10 26 2011+ 66 Year Cumulative Start-Ups Prudhoe Bay Western Region Development Scarborough Hebron PSVM GCG Fram Barzan LNG Terminal Arkutun Dagi PAJ Erha N. Phase 2 Odoptu Banyu Urip Cold Lake Expansion LASER Future Expansion Trestakk Usari Pressure Maint. Kizomba Satellites Kipper/Tuna Turrum 2011+ 2007- 2010 42 |
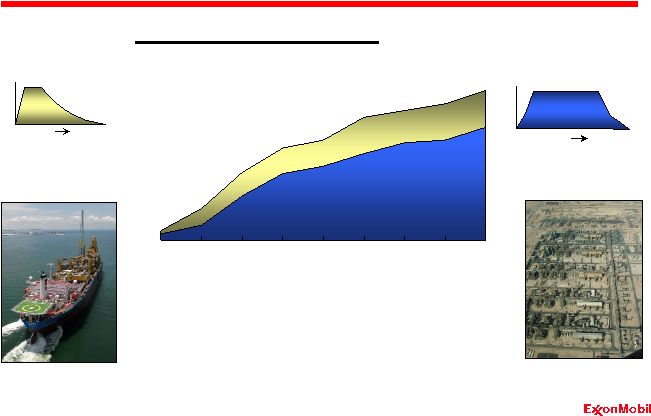 0.0 0.8 1.6 '07 '08 '09 '10 '11 '12 '13 '14 '15 Strong Foundation for Long-Term Capacity Upstream: Portfolio Quality Other Flowstreams T Long-Plateau Flowstreams T RasGas • Over 1.5 MOEBD capacity to be added by 2015 • 75% of new capacity from long-plateau flowstreams 2007- 2015 Major Project Start-Ups MOEBD, Net Other Long-Plateau Kizomba 43 |
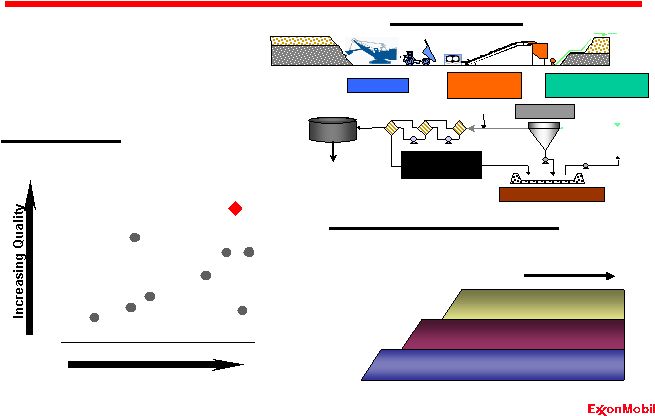 Kearl
– Oil Sands Upstream: Portfolio Quality • Very high quality oil sands resource • Phased development of > 4 BBO; ~300 KBD for at least 30 years • Phase 1 FEED / Execution Planning Large Long-Plateau Flowstream 12 11
10 9 8 7
Ratio of Total Volume to Bitumen In-Place Increasing Mining Efficiency 12.0 10.0 11.5 10.5 11.0 12.5 Ore Grade % Source: Owner data/regulatory applications Kearl Phase 1 Industry- Proposed Projects Resource Quality Project Schematic Diluent Diluent To Markets To Markets Froth Froth Mining Mining Slurry Slurry Preparation Preparation Oil Sands Oil Sands Hydro Transport Hydro Transport / / Conditioning Conditioning Diluted Diluted Bitumen Bitumen Froth Froth Treatment Treatment Extraction Extraction Tailings Storage Tailings Storage 0 100 200 300 400 KBD Phase 1 Phase 3 Phase 2 T > 30 years 44 |
 Company
Strengths Portfolio Quality Global Integration Discipline and Consistency Value Maximization
Long-Term
Perspective Growing Competitive Advantage Growing Competitive Advantage 45 |
 Integrating Technology for Success Upstream: Global Integration Fast Drill Process Reduced Drilling Costs Technology Application Identification of New Opportunities New Plays Concept Reservoir Evolution Fluid Flow and Seals Global Controls CFZ™ Separation Sour Gas Commercialization Efficient Bitumen Separation High-Temp. Paraffinic Froth Treatment Flocs 120 100 80 60 40 20 0 United Kingdom Canada East Australia Qatar Sakhalin Worldwide Results % Increase (ft/day) Methane Sales/ LNG Feed Conventional Distillation Conventional Distillation Feed Gas Acid Gas to Injection Well 46 CFZ™ Section |
 Integrated Global LNG Portfolio Upstream: Global Integration Existing Market LNG Production Future LNG Terminal ExxonMobil LNG Flow in 2010+ Nigeria Gorgon-Jansz Arun Qatar Scarborough PNG Australia PNG Nigeria Australia PNG Nigeria MTA ExxonMobil LNG Sales in 2010 Other Liquid Markets Operating Under Construction LNG Production 2005 2006 2007 2008 2009 2010+ RasGas 1-4 RasGas 1-4 QatarGas 1-3 QatarGas 1-3 RasGas 5 RasGas 5 RasGas 6 RasGas 6 Qatargas II 4 Qatargas II 4 Qatargas II 5 Qatargas II 5 RasGas 7 RasGas 7 Future / Potential Arun Arun BCFD Gross 100 50 0 15 10 5 0 47 |
 Company
Strengths Portfolio Quality Global Integration Discipline and Consistency Value Maximization
Long-Term
Perspective Growing Competitive Advantage Growing Competitive Advantage 48 |
 Project Execution Excellence Upstream: Discipline and Consistency 0 20 40 60 80 0 25 50 75 100 125 Average 03-07 2007 Actual vs. Funded, % EM Project Execution Performance Months Cost Schedule XOM Competitors Ras Gas Train 5* > 4.0 MTA Trains Deepwater West Africa Sakhalin - 1 Sakhalin - 2** Cycle Time vs. Competitors ' ' Operate Operate Execute Execute Define Define Select Select Plan Plan * ExxonMobil and Qatar Petroleum ** Publicly sourced
information 49 |
 Production Reliability Upstream: Discipline and Consistency Uptime Performance XOM Operated Operated by Others Readiness Checks Planning Scoping Execution Follow-Up 2003 2004 2005 2006 2007 XOM-Interest Facilities, % 100 95 90 85 80 75 50 |
 Company
Strengths Portfolio Quality Global Integration Discipline and Consistency Value Maximization
Long-Term
Perspective Growing Competitive Advantage Growing Competitive Advantage 51 |
 Maximizing Base Recovery Upstream: Value Maximization 20 50 80 2005 2006 2007 0 100 200 2005 2010 2015 2020 0 90 180 1965 1975 1985 1995 2005 Australia - Gippsland Work Program Recovery Factor 13% 17% 25% 30+% Base Uplift Uplift Base Base Uplift Uplift Canada - Cold Lake Production Growth Nigeria - East Area Projects Abu Dhabi - Upper Zakum Capacity Expansion 800 600 400 Current Future 2008 52 |
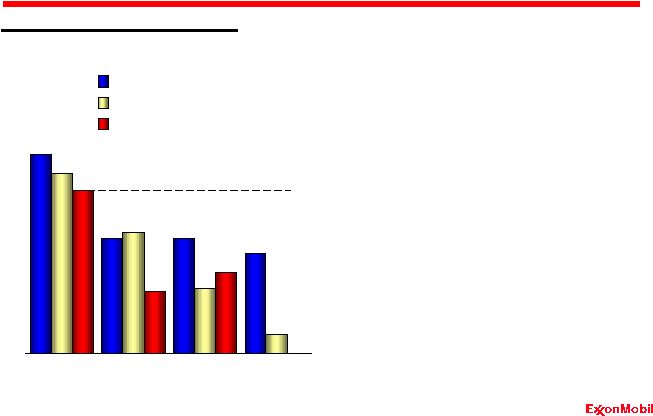
 Superior Cost Management Upstream: Value Maximization Indexed Cash Costs per OEB* FAS 69 basis indexed to 2003; competitor data estimated using a consistent basis with
ExxonMobil, and based on public information Cash costs equal production costs
excluding taxes plus exploration expenses; total costs add depreciation and depletion 2007 comparison not included because data for BP and RDS not available due to later SEC
filing deadline '03 '04 '05 '06 XOM RDS BP CVX % * 100 160 220 XOM RDS BP CVX Indexed Total Costs per OEB* % '03 '04 '05 '06 100 150 200 53 |
 Company
Strengths Portfolio Quality Global Integration Discipline and Consistency Value Maximization
Long-Term
Perspective Growing Competitive Advantage Growing Competitive Advantage 54 |
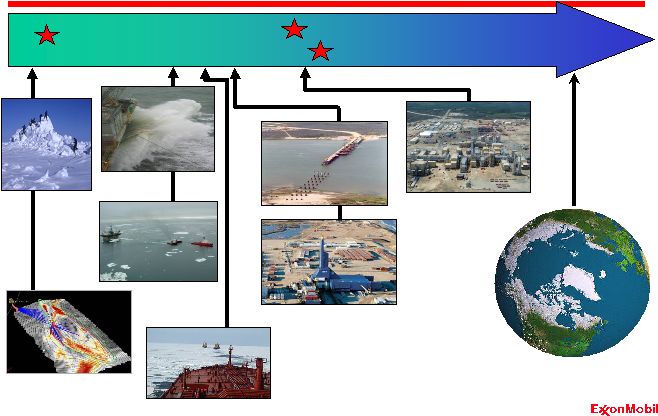 Upstream: Long-Term Perspective Sakhalin-1 Example 1995
2000 2005
PSA Signed Extended Reach Drilling at Yastreb Start-Up Full Field Start-Up Future Arctic Bridge over Chayvo Bay Modular Construction 3D Seismic Analysis Chayvo Orlan Towed from Alaska Wave Analysis Ice Breaking Tanker Trials Ice Load & Seismic Studies 55 |
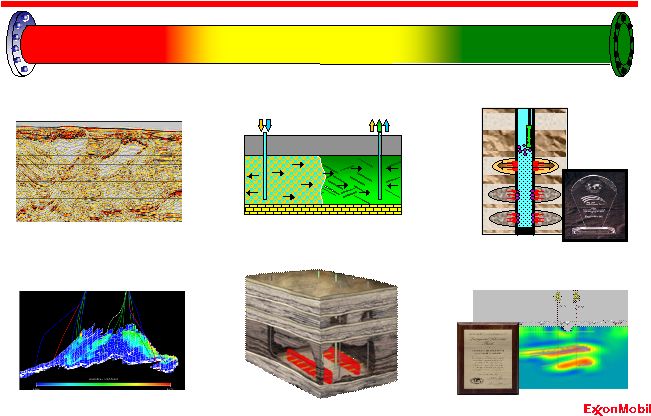 Breakthrough Technology Upstream: Long-Term Perspective Advanced Hydrocarbon Detection (R³MSM) Economic Recovery from Thin Bitumen Reservoirs Next-Generation Seismic Imaging Commercial Successes Identified Opportunities Evaluation In Situ Shale Oil Recovery Rapid Reservoir Performance Prediction Unlocking Tight Gas (MZST) 56 |
 National Content Development Upstream: Long-Term Perspective National Content Supplier Development Supplier Development Workforce Development Workforce Development Strategic Community Investments Strategic Community Investments 57 |
 Company
Strengths Portfolio Quality Global Integration Discipline and Consistency Value Maximization
Long-Term
Perspective Growing Competitive Advantage Growing Competitive Advantage 58 |
 Industry-Leading Reserves Upstream: Growing Competitive Advantage Years Remaining
14.2 12.8 10.6 11.7 BOEB Proved Reserves* (YE 2007) * ExxonMobil reserves include year-end price/cost revisions and Canadian oil sands
operations Competitor data estimated using a consistent basis with ExxonMobil,
and based on public information ** RDS 2006 reserves data, 20-F basis ** 0 5 10 15 20 25 XOM BP RDS CVX 59 |
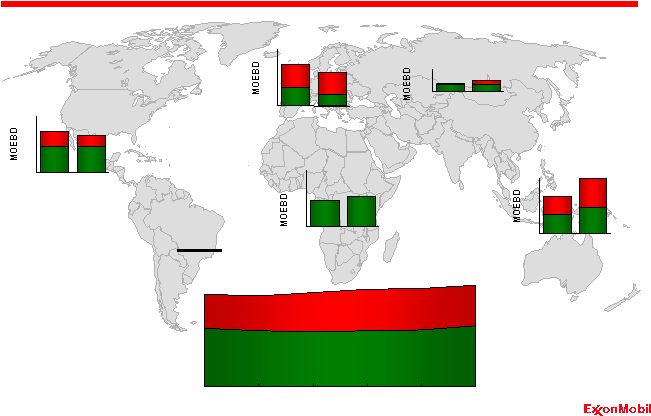 Upstream: Growing Competitive Advantage Delivering Profitable Capacity Growth Americas 0 1.5 2007 2012 Europe 0 1.5 2007 2012 Africa 0 1 2007 2012 0 1 2 3 4 5 2007 2008 2009 2010 2011 2012 MOEBD, Net Liquids Liquids Gas Gas Total 0 0.5 2007 2012 Russia / Caspian Asia Pacific / Middle East 0 1.5 2007 2012 60 |
 Key
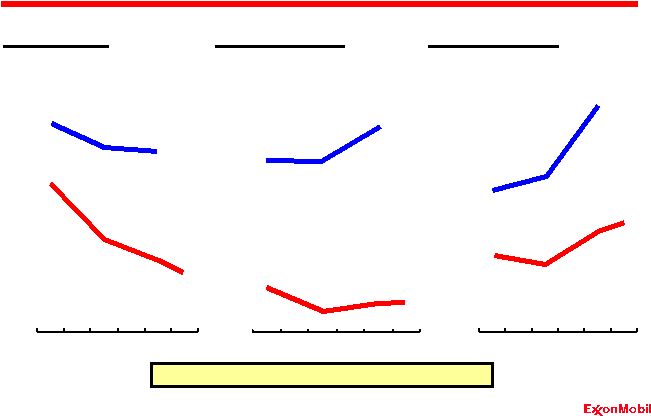
Upstream per Share Metrics Upstream: Growing Competitive Advantage Indexed Growth Per Share Since 2003* Competitor data estimated using a consistent basis with ExxonMobil, and based on public
information 2007 Reserves data estimated for BP and CVX; 2006 reserves data used
for RDS because 2007 estimate not available; includes year-end price/cost
effects for all Production % % 90 110 130 '03 '04 '05 '06 '07 Earnings 90 140 190 240 '03 '04 '05 '06 '07 Proved Reserves Competitors (RDS, BP, CVX) % * ** 90 110 130 '03 '04 '05 '06 '07 ** ** 61 |
 Industry-leading Earnings per Barrel Upstream: Growing Competitive Advantage * Competitor data estimated using a consistent basis with ExxonMobil, and based on
public information 2007 $/OEB 2003-2007 Earnings per Barrel* 0 10 20 XOM CVX RDS BP 62 |
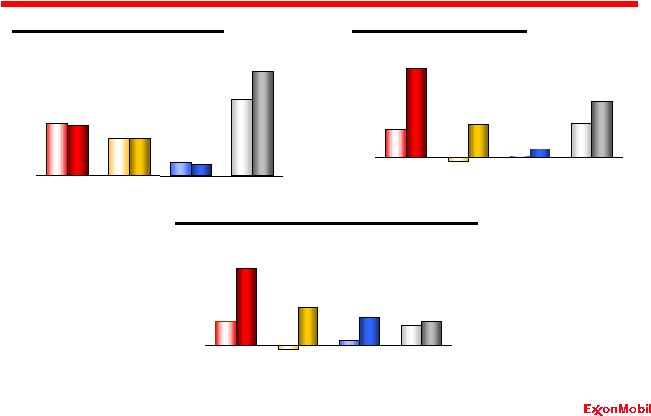
 Industry-Leading Returns Upstream: Growing Competitive Advantage Average Capital Employed* $B XOM RDS BP '03 '07 '03 '07 '03 '07 '03 '07 CVX 0 40 80 Reported Net Income* $B '03 '07 '03 '07 '03 '07 '03 '07 0 15 30 *Competitor data estimated using a consistent basis with ExxonMobil, and based on public
information Return on Average Capital Employed* % '03 '07 '03 '07 '03 '07 '03 '07 0 25 50 63 |
 Downstream Overview Analyst Meeting March 5, 2008 64 |
  • Record financial performance – Earnings $9.6 B – ROCE 37.8 % – Refinery throughput 5.6 MBD – Petroleum product sales 7.1 MBD • Operational excellence continues – Environmental, energy efficiency • Strategic initiatives delivering results – More than $1B “self-help” each year • Capital discipline maintained 2007 Highlights Downstream Refining & Supply Lubes Marketing Fuels Marketing 65 |
 Business Strategies • Maintain best-in-class operations, in all respects • Provide quality, valued products and services to customers • Lead industry in efficiency and effectiveness • Capitalize on integration with other ExxonMobil businesses • Selectively invest for resilient, advantaged returns • Maximize value from leading-edge technology Downstream 66 |
 Company Strengths Portfolio Quality Global Integration Discipline and Consistency Value Maximization
Long-Term
Perspective Growing Competitive Advantage Growing Competitive Advantage 67 |
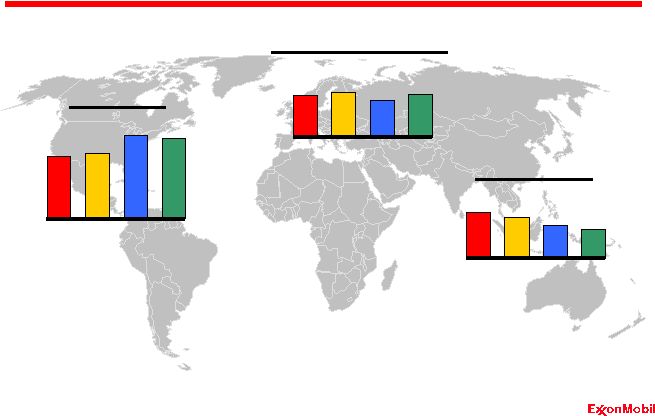 Business Overview – 2007 Downstream: Portfolio Quality / Global Integration • Largest global refiner • Largest global supplier & marketer of petroleum products • Largest manufacturer & marketer of basestocks and synthetic lubes AMERICAS Sales Ref Capacity 2.6 MBD 3.6 MBD 52% 41% Refineries Retail Sites 15 51% 39% 16.9k EUROPE / AFRICA / ME Sales Ref Capacity 1.9 MBD 2.1 MBD 25% 31% Refineries Retail Sites 11 29% 29% 8.1k ASIA PACIFIC Sales Ref Capacity 1.4 MBD 23% 28% Refineries Retail Sites 12 20% 32% 7.4k 1.8 MBD 68 |
 0 2 4 6 Average Refinery Size KBD XOM BP RDS Industry Source: Equity share capacity calculated on consistent basis using public information Refining Structural Advantages Downstream: Portfolio Quality / Global Integration % Integration with Chemicals or Lubes XOM RDS BP Industry Capacity and Geographic Mix MBD XOM
RDS BP Americas
EAME AP AP World’s largest refiner with global scale and integration advantages 100 150 200 250 30 40 50 60 70 80 69 |
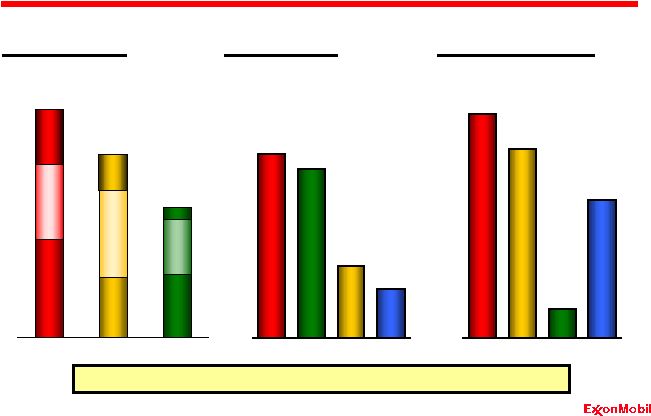
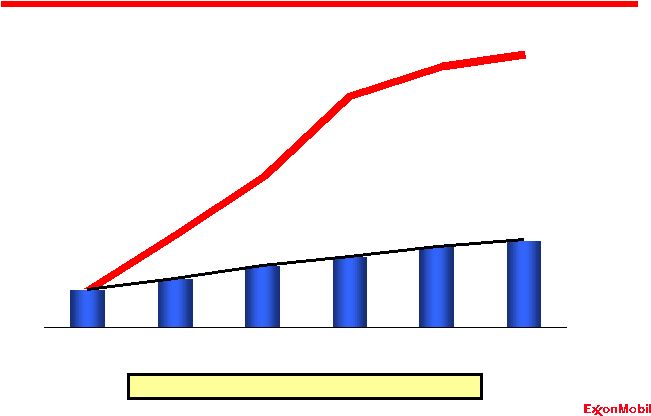
 Self-Help: Refining Margin Enhancement Downstream: Value Maximization Capacity Growth KBD Adding the equivalent of an average sized refinery every 3 yrs 0 200 400 600 800 '95 '01 '07 Conversion Distillation Advantaged Raw Materials Indexed, % Processing challenged crudes at twice the industry average 100 120 140 160 '03 '04 '05 '06 '07 Molecule Management Improving profitability with proprietary technology $M/Yr Margin, Before-Tax 0 200 400 600 800 1,000 '03 '04 '05 '06 '07 70 |
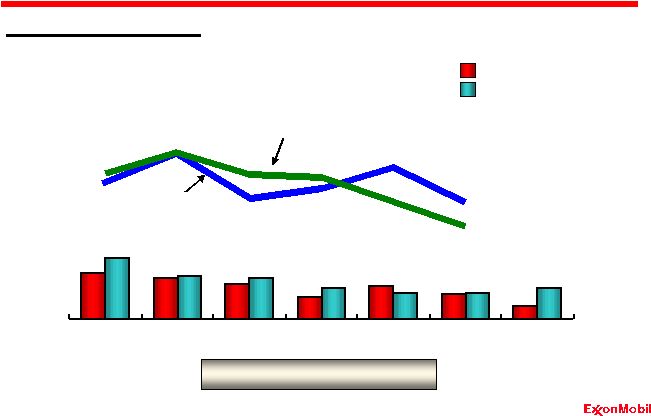
 Self-Help: Refining Operating Efficiency Downstream: Discipline and Consistency * 2007 Estimated – Solomon survey only prepared in even years Widening our efficiency advantage versus industry Energy Index Indexed Source: Solomon Industry XOM * 90 95 100 105 '02 '04 '06 '07 * Unit Cash Cost Industry Indexed XOM * 90 100 110 120 '02 '04 '06 '07 Indexed Personnel Index Industry XOM 90 100 110 120 130 140 '02 '04 '06 '07 71 |
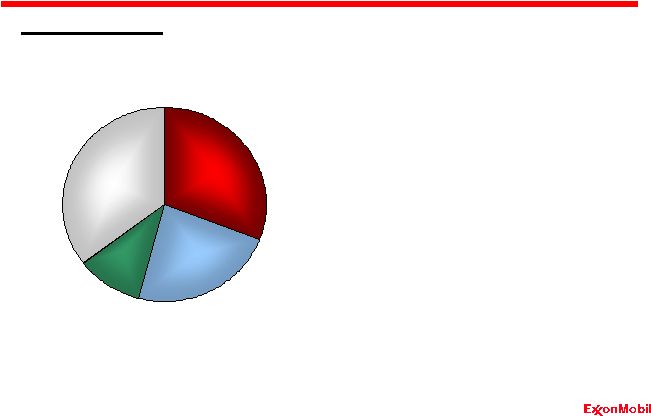 Downstream: Portfolio Quality / Global Integration Fuels Marketing Structural Advantages Aviation & Marine Sales 11% • Largest supplier and marketer of petroleum products • Leveraging integration with refining • Broad spectrum of customer channels • Product placement for highest value • Global systems, work processes and best practices Global Fuel Sales I&W Sales 23% Retail Sales 31% Supply Sales 35% Volume % 72 |
 Fuels
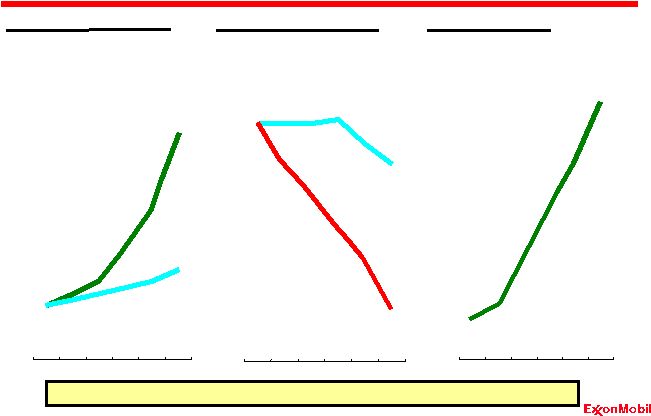
Marketing Self-Help Downstream: Value Maximization / Discipline and
Consistency Portfolio highgrading and improved efficiency delivering increased
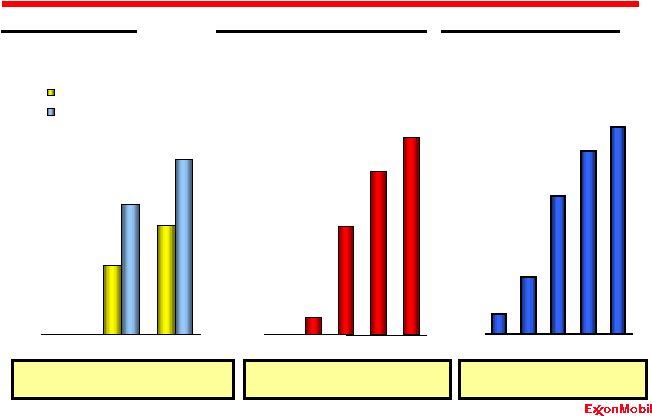
profitability Fuel Retail Site Productivity (Fuels Volume and Nonfuels Margin per Site) Indexed Nonfuel -10 10 30 '03 '05 '07 Operating Efficiencies Indexed Workforce Opex -40 -30 -20 -10 0 10 '03 '05 '07 Indexed Capital Efficiency (Sales per Dollar Capital Employed) -10 10 30 50 '03 '05 '07 73 |
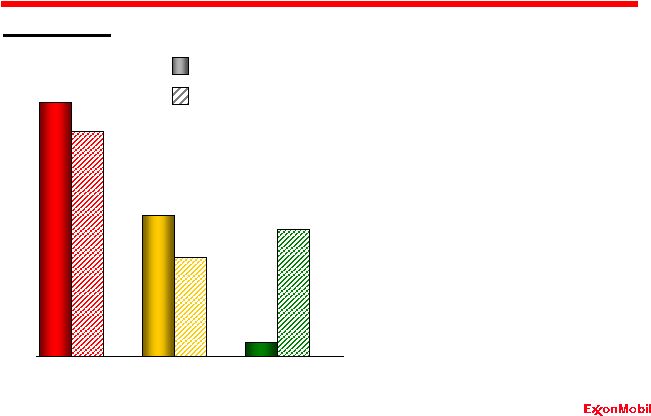 Downstream: Portfolio Quality / Global Integration Lubes Marketing Structural Advantages • Largest manufacturer and marketer of lube basestocks • Leveraging integration with refining • Leader in marketing synthetic lubes • Strong OEM relationships • Technically advanced products Market Share % Basestocks Synthetic Lubes Source: Estimated based on industry sources and public information 0 5 10 15 20 XOM RDS BP 74 |
 Lubes
and Specialties Self-Help Downstream: Value Maximization / Discipline and Consistency Key Growth Markets Simplification, targeted growth & technology leadership providing long-term
competitive advantage Source: Based on industry sources and public information.
Operating Efficiencies Blend Plants Products Indexed Workforce Order Centers '01 '04 '07 -90 -80 -70 -60 -50 -40 -30 -20 -10 0 ExxonMobil Industry Indexed (Finished Lube Sales) '01 '04 '07 0 20 40 60 80 Indexed Synthetics Sales Growth ExxonMobil Industry '01 '04
'07 0 20 40 60 80 75 |
 Downstream Self-Help Downstream: Value Maximization / Discipline and Consistency • Delivering >$1B AT Self-Help per year – Advantaged raw materials – Capacity growth – Molecule management – Higher value products – Operating efficiency $B After-Tax Margin Enhancements Opex Efficiencies 0 1 2 '03 - '06 Avg '07 76 |
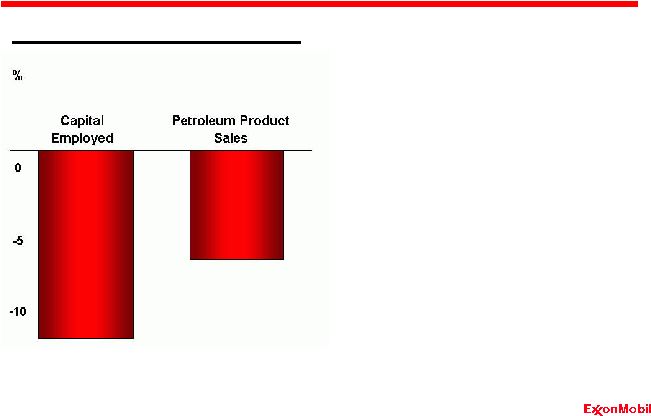 Divestment Impacts Versus '03 Base Downstream: Portfolio Quality Downstream High-grading • Active portfolio high-grading • Key to maintaining flat capital employed profile • Improved capital efficiency • Positive impact on ROCE 77 |
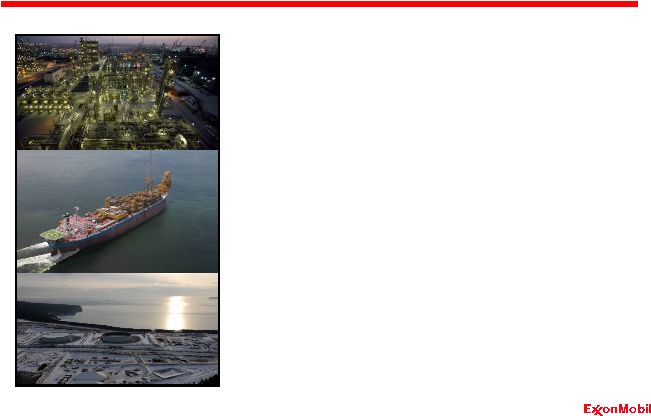
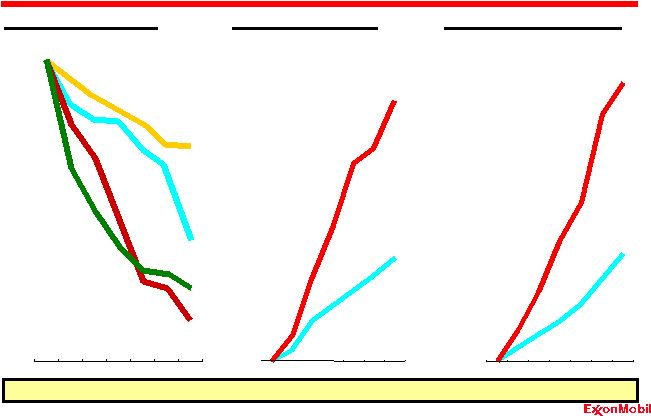
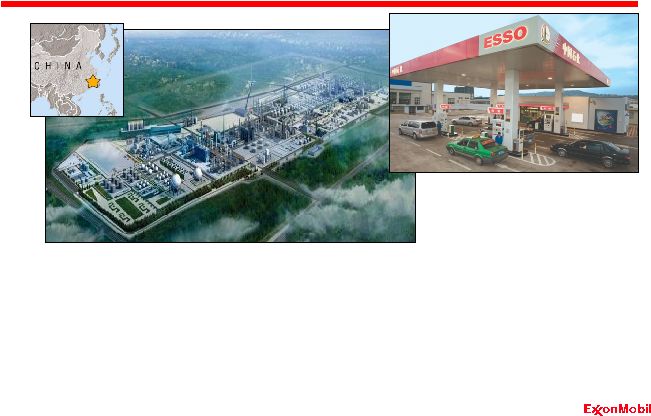 Fujian World Class Integrated Complex Downstream and Chemical: Long-Term Perspective • Fujian venture formed in mid-2007 – World-scale, integrated refining and chemical complex – Fuels marketing JV including approximately 750 retail sites • Plant expansion start-up expected in 2009; Base refinery and Fuels Marketing
Venture in operation • Participation across value chain; crude processing through marketing 78 |
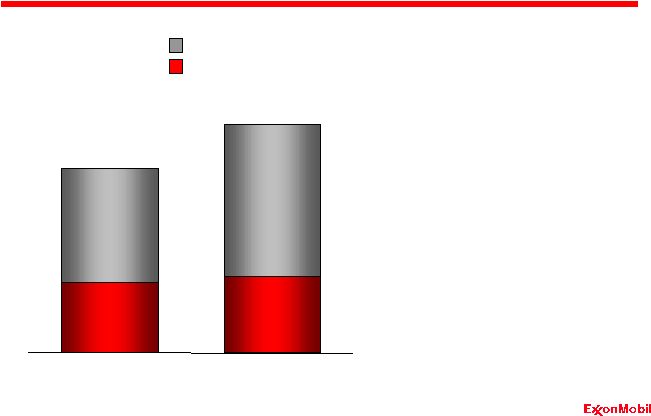
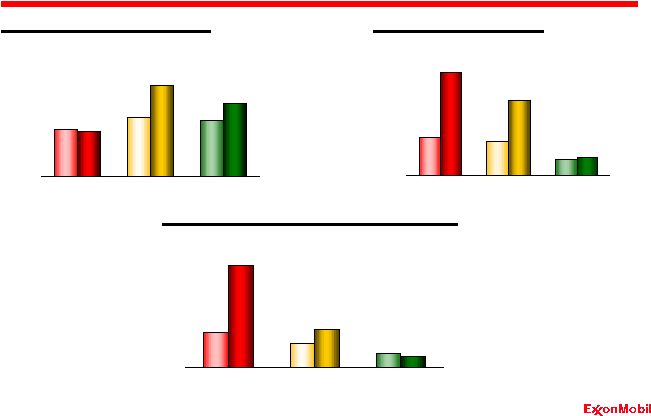 Industry-Leading Returns Downstream: Growing Competitive Advantage Average Capital Employed* $B XOM RDS BP '03 '07 '03 '07 '03 '07 0 15 30 45 60 Reported Net Income* $B '03 '07 '03 '07 '03 '07 0 2 4 6 8 10 *Competitor data estimated using a consistent basis with ExxonMobil, and based on public
information Return on Average Capital Employed* % '03 '07 '03 '07 '03 '07 0 10 20 30 40 79 |
 Downstream ROCE Performance ROCE at trendline margins* % Actual * At average turnaround level Improving ROCE by 1% per year at trendline margins Average +1% per year ROCE 0 10 20 30 40 2002 2003 2004 2005 2006 2007 80 |
 Chemical Overview Analyst Meeting March 5, 2008 81 |
 2007
Highlights Chemical • Record financial performance – Earnings
$4.6 B – ROCE
34.0 % • Operational excellence continues – Safety, reliability, energy efficiency • Strategic initiatives delivering results – Over $500M AT “self-help” per year • Investing in advantaged growth – Capex of $1.8B 82 |
 Business Strategies Long-term strategy built on ExxonMobil’s core competencies • Unique portfolio of global businesses • Integration across ExxonMobil operations • Relentless focus on operational excellence • Disciplined investment in advantaged projects • Technology leadership Chemical 83 |
 Company
Strengths Portfolio Quality Global Integration Discipline and Consistency Value Maximization
Long-Term
Perspective Growing Competitive Advantage Growing Competitive Advantage 84 |
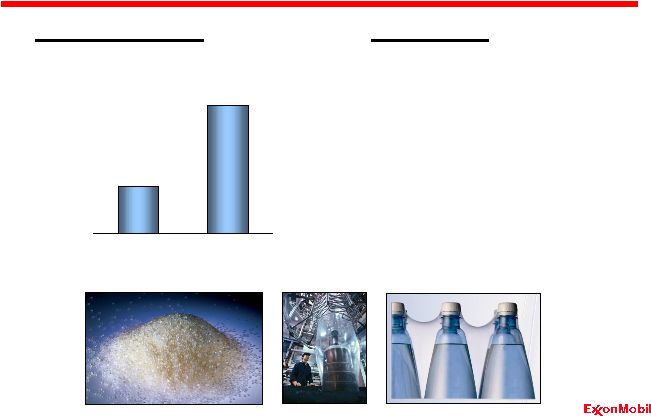
 High-Performing Business Portfolio Chemical: Portfolio Quality ExxonMobil Chemical Earnings $B Aromatics 1 Olefins 2 Polyethylene 2 Polypropylene 5 Specialty Businesses Commodity Businesses Rank* *Based on worldwide market position Butyl 1 Fluids 1 Oxo 1 Synthetics 1 Films 1 Adhesion 1 Specialty Elastomers 2 Additives 2 '95 '05 0.0 1.0 2.0 3.0 4.0 85 |
 Value
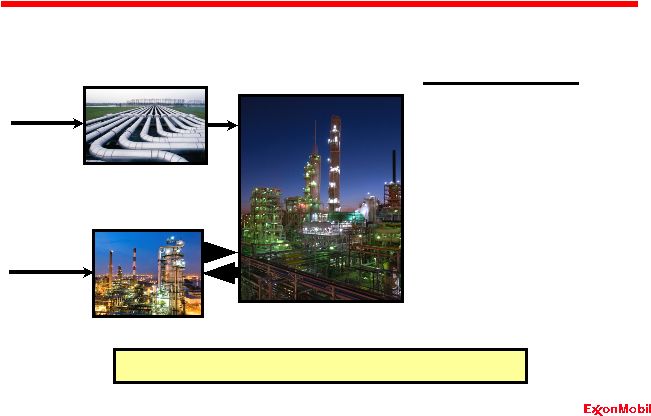
Through Integration Advantage Chemical: Global Integration Petrochemical Plant Gas Processing Refinery Areas of Synergy • Advantaged feed access • Molecule optimization • Energy integration • Shared site services • Global processes / systems Natural Gas Cumulative integration benefits > $850M BT since 2002 Crude Oil and Feedstocks 86 |
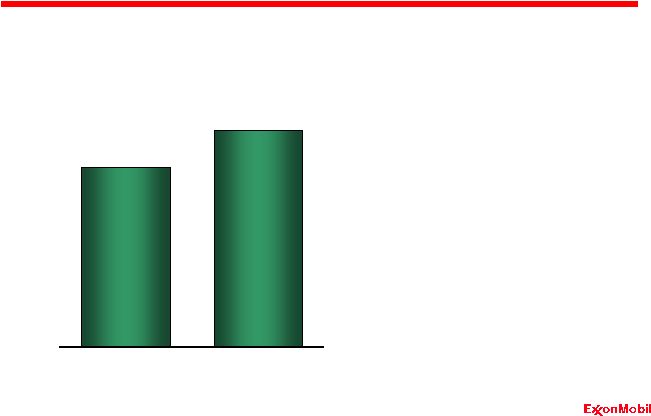
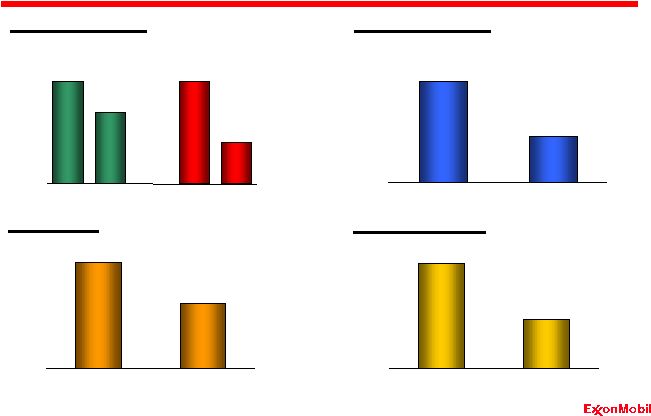 Operational Excellence Chemical: Discipline and Consistency #, Indexed Energy Efficiency Per Unit of Production, Indexed Workforce Steamcracking Other Operations 80 90 100 '03 '07 '03 '07 80 90 100 '03 '07 '07 $, Indexed Operating Costs Reliability Losses %, Indexed 0 50 100 '03 '07 80 90 100 '03 '07 87 |
 Advantaged Feedstocks Chemical: Value Maximization Advantaged Steamcracking Feeds Focus Areas • Feedstock flexibility • Cracker technology • Middle East ethane MT, Indexed 80 100 120 '03 '07 88 |
 Premium Product Growth Chemical: Value Maximization Focus Areas • Solution to customer needs • Technology investment • Faster growth • Commodity differentiation • Asia demand growth Premium Products MT, Indexed 80 100 120 140 '03 '07 89 |
 • Delivering >$500M AT Self-Help per year – Integration and synergy – Operational excellence – Advantaged feeds – Premium products • Improving ROCE at constant margins Self-Help Program Chemical: Value Maximization $M After-Tax 0 250 500 750 '03-'06 Avg '07 90 |
 Major
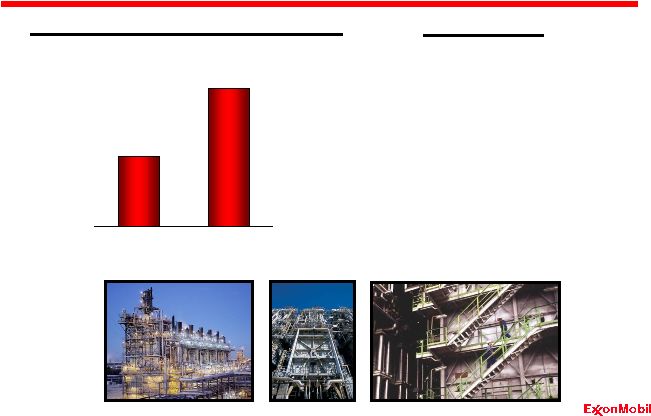
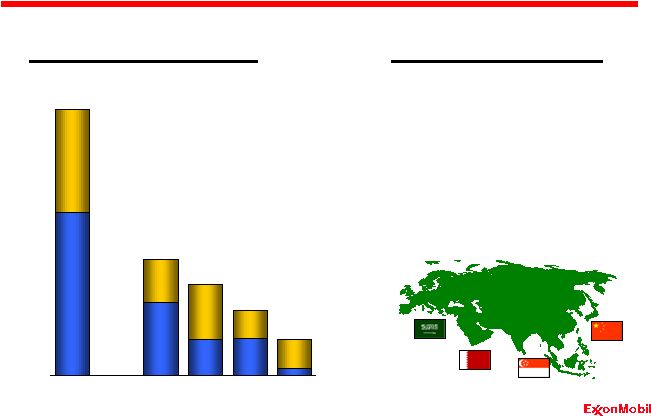
Growth Projects Chemical: Long-Term Perspective Fujian Singapore Qatar Saudi Arabia Fujian Fujian Singapore Singapore Qatar Qatar Saudi Arabia Saudi Arabia Sources of Advantage • Existing asset base • Integration and scale • Advantaged feedstocks • Premium product focus MT Announced Existing XOM
RDS Dow TOT CVX Asia Pacific /Middle East Ethylene Capacities 0 2 4 91 |
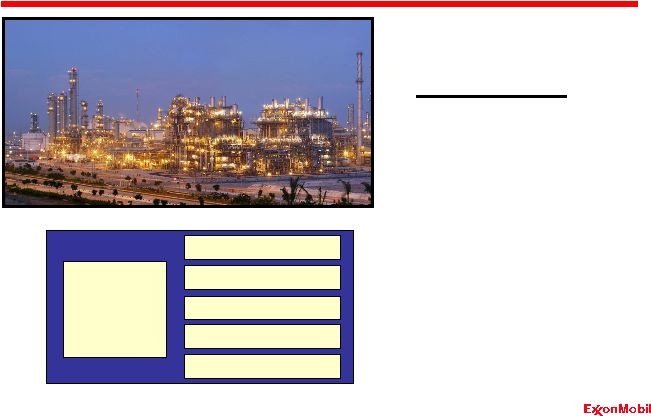 Singapore Expansion Project Chemical: Long-Term Perspective Singapore Steam Cracker #2 Polyethylene Polypropylene Aromatics Specialty Elastomers Oxo Alcohols Key Advantages • Refinery integration • Synergy with cracker #1 • Energy efficiency • Feed flexibility • Premium products 92 |
 Chemical: Growing Competitive Advantage Delivering Superior Returns XOM RDS CVX Dow Average Capital Employed* $B '03 '07 '03 '07 '03 '07 '03 '07 0 10 20 30 '03 '07 '03 '07 '03 '07 '03 '07 Reported Net Income* $B -1 0 1 2 3 4 5 *Competitor data estimated using a consistent basis with ExxonMobil, and based on public
information Return on Average Capital Employed* % '03 '07 '03 '07 '03 '07 '03 '07 -10 0 10 20 30 40 93 |
 Summary Analyst Meeting March 5, 2008 94 |
 Growing
Competitive Advantage • Industry-leading portfolio of businesses and assets • Unmatched integration capabilities • Global functional organization leveraging high quality people • Disciplined and consistent approach across the business • Commitment to technology leadership • Relentless focus on maximizing long-term value 95 |
 Delivering Superior Performance 2003 to 2007 • Industry-leading safety performance • Record earnings, superior ROCE in all businesses • Distributions to shareholders of $118 billion • Total shareholder returns of 24% per year • Invested $3.5 billion in research and development • Structural improvements in Downstream and Chemical • Reserves replacement at 110% per year • 46 major Upstream project start-ups 96 |
 Disciplined Investment Operational Excellence Industry Leading Returns Superior Cash Flow Growth in Shareholder Value Proven Long-Term Approach 97 |