 1 Analyst Meeting New York March 7, 2007 Exhibit 99.2 |
| 1 Analyst Meeting New York March 7, 2007 Exhibit 99.2 |
 2 Cautionary Statement Forward-Looking Statements. Outlooks, projections, estimates, targets, and business plans in this presentation or the subsequent discussion period are forward-looking statements. Actual future results, including demand growth and mix; ExxonMobil’s own production growth and mix; the amount and mix of capital expenditures; resource additions and recoveries; finding and development costs; project plans, timing, costs, and capacities; revenue enhancements and cost efficiencies; industry margins; margin enhancements and integration benefits; and the impact of technology could differ materially due to a number of factors. These include changes in long-term oil or gas prices or other market conditions affecting the oil, gas, and petrochemical industries; reservoir performance; timely completion of development projects; war and other political or security disturbances; changes in law or government regulation; the outcome of commercial negotiations; the actions of competitors; unexpected technological developments; the occurrence and duration of economic recessions; unforeseen technical difficulties; and other factors discussed here and under the heading “Factors Affecting Future Results” in the Investor Information section of our website at . See also Item 1A of ExxonMobil’s 2006 Form 10-K. Forward-looking statements are based on management’s knowledge and reasonable expectations on the date hereof, and we assume no duty to update these statements as of any future date. Frequently Used Terms. References to resources, resource base, recoverable resources, and similar terms include quantities of oil and gas that are not yet classified as proved reserves but that we believe will likely be moved into the proved reserves category and produced in the future. The discussion of reserves in this presentation generally excludes the effects of year-end price/cost revisions and includes reserves attributable to equity companies and our Syncrude operations. For definitions of, and information regarding, reserves, return on average capital employed, normalized earnings, cash flow from operations and asset sales, and other terms used in this presentation, including information required by SEC Regulation G, see the “Frequently Used Terms” posted on the Investor Information section of our website. The Financial and Operating Review on our website also shows ExxonMobil's net interest in specific projects. www.exxonmobil.com |
 3 Corporate Overview Analyst Meeting March 7, 2007 . . |
 4 Disciplined Investment Operational Excellence Industry Leading Returns Superior Cash Flow Growth in Shareholder Value Proven Long-Term Approach |
 5 • Industry-leading safety performance • Record financial performance – Net Income $39 B – ROCE 32% – Cash flow from Operations and Asset Sales $52 B • Total Distributions to $33 B Shareholders * • Capex $20 B 2006 – Record Results * Includes dividends and share purchases to reduce shares outstanding
|
 6 Company Strengths Growing Competitive Advantage Discipline and Consistency Value Maximization Long-Term Perspective Global Integration Portfolio Quality |
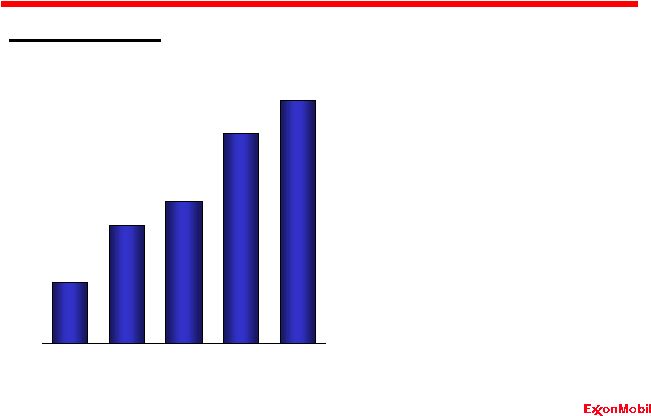
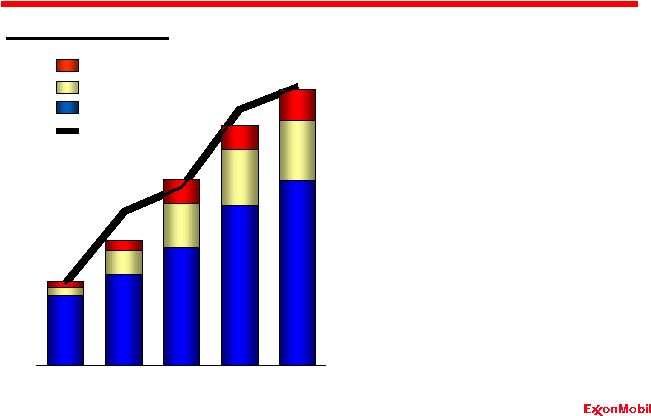 7 Normalized Earnings $B • Superior results in all business lines • Industry-leading results across the cycle • Capitalizing on competitive advantages Chemical Downstream Upstream Net Income Record Results Portfolio Quality 0 5 10 15 20 25 30 35 40 '02 '03 '04 '05 '06 |
 8 Superior ROCE RDS BP CVX Return on Capital Employed * 5-Year Rolling Average % * Competitor data estimated using a consistent basis with ExxonMobil, and based on public
information XOM • Consistently outperform competition • Results from implementation of business model – Capital discipline – Operational excellence – Asset management Portfolio Quality 6 10 14 18 22 26 '02 '03 '04 '05 '06 |
 9 Functional Organization • Consistent business approach • Common standards, processes and systems • Disciplined and globally-aligned investment decisions • Rapid deployment of new technology and best practices • Project management expertise for full range of development options • Industry-leading operations management Global Integration |
 10 Investing in Our People • Hire from the global talent pool • Deliver tailored technology and best practices training • Provide diverse, global work experiences • Long-term career orientation • Competitive, merit-based compensation Global Integration |
 11 Operations Integrity Management System Discipline and Consistency Need D/S image • Operations integrity management – Proactive risk assessment and mitigation embedded in work processes – Standardized processes, applied globally – Integrated into culture • Creates value – Enhances safety and environmental performance – Improves reliability – Lowers operating costs |
 12 Employee Contractor Lost Time Incident Rate Incidents per 200k hours U. S. Petroleum Industry Benchmark* Safety Leadership * 2006 Industry data not available Discipline and Consistency Nobody Gets Hurt 0.0 0.1 0.2 0.3 0.4 0.5 '02 '03 '04 '05 '06 |
 13 • Managed through Operations Integrity Management System • Uses science-based approach to assess risks and set objectives • Incorporates environmental planning in business decisions • Environmental focus areas – Reduce spills and releases – Improve energy efficiency – Reduce flaring Environmental Leadership Discipline and Consistency Protect Tomorrow. Today. |
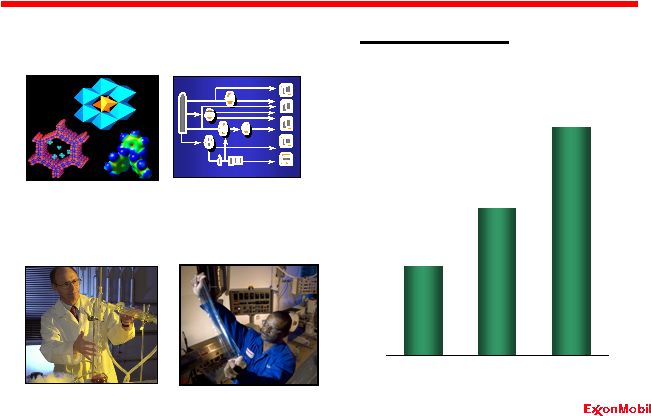
 14 Technology Leadership • Unwavering long-term commitment to research • Research priorities determined by business requirements • Rapid, global deployment enabled by functional organization • Invested $730 million in 2006 and more than $3 billion since 2002 Growing Competitive Advantage Research Global Deployment Business Need Innovation Discipline and Consistency |
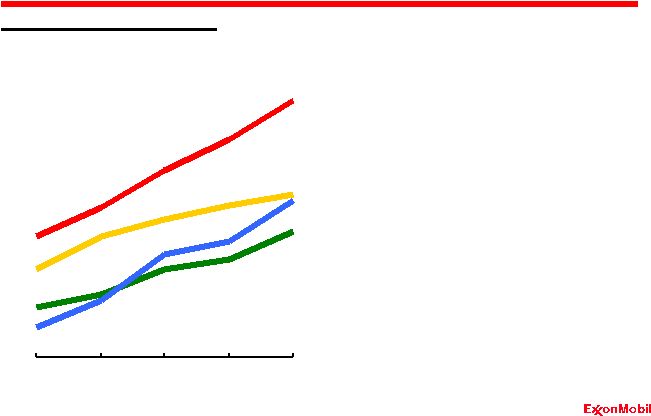
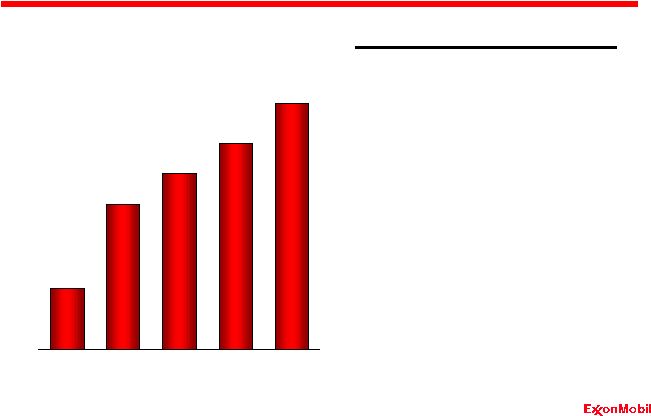
 15 Cash Flow from Operating Activities * $B Superior Cash Flow * Excludes asset sales XOM RDS BP CVX • Record $49 billion in 2006 • Average $38 billion per year from 2002 to 2006 • Capturing the upside • 132% growth since 2002 vs average 105% for competitors • $8.34/share in 2006 Value Maximization 0 10 20 30 40 50 '02 '03 '04 '05 '06 |
 16 Investing for the Future Capex by Business Line $B Chemical / Other Downstream Upstream North America Geographic Capex Distribution $B, avg. 2002-2006 Europe Africa Asia Pacific/ Middle East Russia/Caspian Other Long-Term Perspective 0 4 8 12 16 20 '02 '03 '04 '05 '06 |
 17 Investing for the Future Chemical / Other Downstream Upstream Estimate Estimate $B Capex by Business Line $B Long-Term Perspective 0 4 8 12 16 20 '02 '03 '04 '05 '06 '07 0 5 10 15 20 '08-'11 Average |
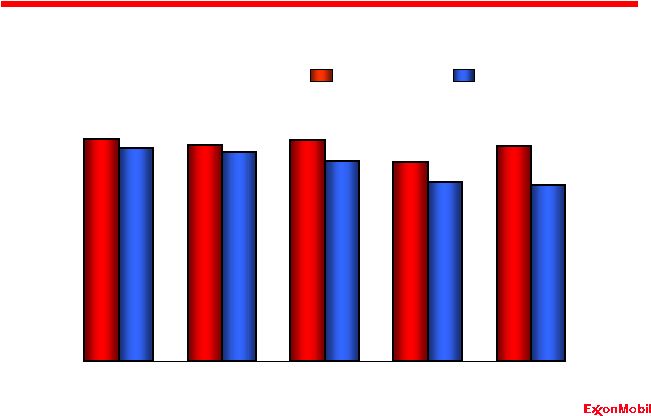
 18 Reliable and Growing Dividends • Distributed $34 billion over past five years • Paid dividends each year for more than 100 years • Annual per share increases since 1983 • Dividends per share increased 39% from 2002 vs. 24% for S&P 500 $ Per Share Growing Competitive Advantage 0.0 0.2 0.4 0.6 0.8 1.0 1.2 1.4 '02 '03 '04 '05 '06 |
 19 Growing Competitive Advantage Share Purchases • Distributed $58 billion during last five years and $25 billion in 2006 • Reduced shares outstanding by 16% since beginning of 2002 • Flexible and efficient distribution tool to manage capital structure $ Billion Purchases to reduce shares outstanding 0 5 10 15 20 25 '02 '03 '04 '05 '06 |
 20 Increasing Ownership Indexed Growth Per Share Since 2002* • Increasing ownership per share in operating assets • Strong per share growth in key business metrics • Contributes to increased earnings per share Growing Competitive Advantage *2006 metric per average share vs. 2002 metric per average share Production Proved Reserves Refinery Throughput Chemical Prime Product Sales 80 90 100 110 120 |
 21 Increasing Value per Share Earnings Per Share $/share • Captured upside • Growth driven by – Higher commodity prices and refining margins – Strong business performance – Share purchases contributed $0.88 to 2006 EPS* Growing Competitive Advantage * Versus number of shares outstanding on January 1, 2002 0.0 1.0 2.0 3.0 4.0 5.0 6.0 7.0 '02 '03 '04 '05 '06 |
 22 0 2 4 6 8 10 12 14 16 18 20 Years 10 Years 5 Years Growth in Shareholder Value Shareholder Returns Disciplined Investment Operational Excellence Industry Leading Returns Superior Cash Flow Growth in Shareholder Value ExxonMobil Competitor Average* S&P 500 * Shell, BP and Chevron Growing Competitive Advantage Range %/Yr |
 23 Upstream Overview Analyst Meeting March 7, 2007 . . |
 24 2006 Highlights • Earnings $26.2 B • ROCE 45.3 % • Production volumes 4.2 MOEBD • Resource adds 4.3 BOEB • Proved reserves adds 2.0 BOEB • Capex $16.2 B Upstream |
 25 Upstream Strategies • Identify and pursue all attractive exploration opportunities • Invest in projects that deliver superior returns • Maximize profitability of existing oil and gas production • Capitalize on growing natural gas and power markets Upstream |
 26 Company Strengths Growing Competitive Advantage Discipline and Consistency Value Maximization Long-Term Perspective Global Integration Portfolio Quality |
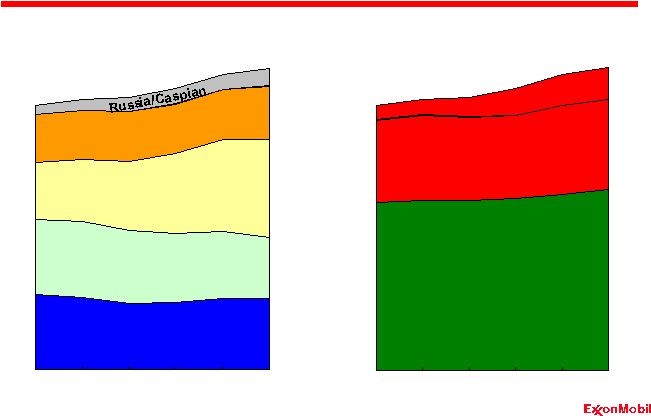
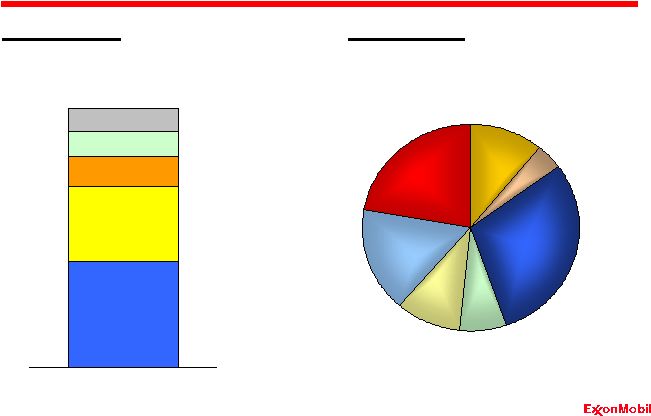 27 Size, Diversity and Superior Quality Resource Type Upstream: Portfolio Quality LNG Tight Gas Conventional Deepwater Arctic Heavy Oil Acid/Sour Gas Resource Base Americas Europe Russia/Caspian Africa 74 BOEB Asia Pacific / Middle East BOEB 0 40 80 YE '06 |
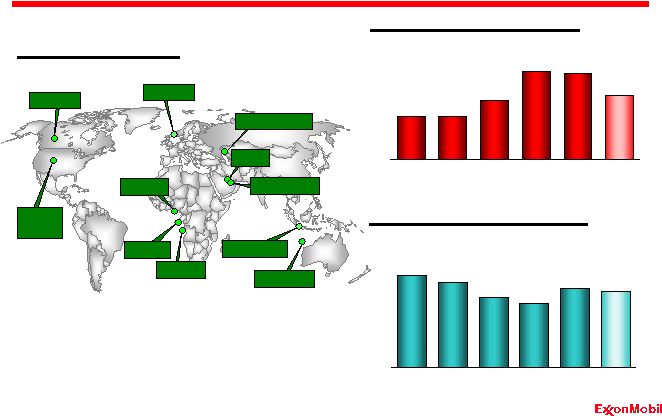 28 Indonesia Norway Angola Nigeria Kazakhstan Adding to the Resource Base Annual Resource Additions Average Annual Finding and Resource Acquisition Costs BOEB $/OEB Qatar 2006 Resource Adds Australia Upstream: Portfolio Quality Canada Avg. United States Congo Abu Dhabi Avg. 0.0 0.2 0.4 0.6 0.8 '02 '03 '04 '05 '06 5 Yr 0 1 2 3 4 5 '02 '03 '04 '05 '06 5 Yr |
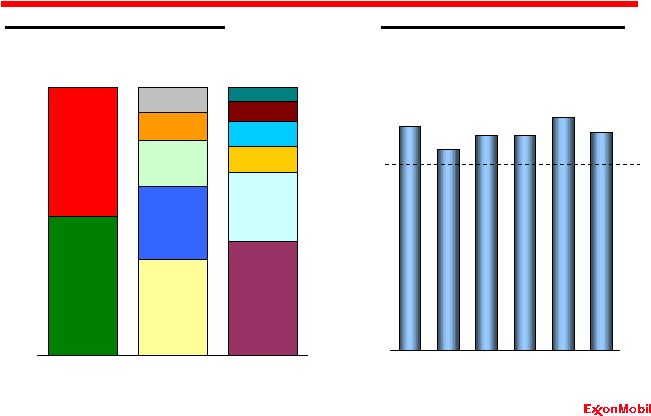 29 0 50 100 150 '02 '03 '04 '05 '06 5-yr Avg 0 5 10 15 20 25 Product Region Resource Type Proved Reserves* Replacement (Including asset sales) BOEB Proved Reserves* (YE 2006) Reserves Base – Size, Diversity and Growth Upstream: Portfolio Quality Conventional LNG Acid/Sour Gas HO/Oil Sands Arctic Deepwater Asia Pacific / Middle East Americas Europe Africa Russia/Caspian Oil Gas * ExxonMobil reserves excluding year-end price/cost effects and including Canadian oil
sands operations % |
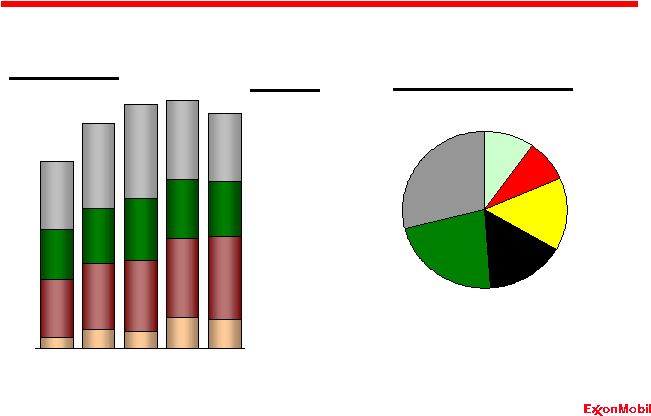 30 Strong Project Inventory Upstream: Portfolio Quality # of Projects Planning/ Selecting Defining Executing Operating Project Phase Resource By Type Deepwater Conventional Heavy Oil Arctic LNG Acid/Sour Gas 0 40 80 120 '02 '03 '04 '05 '06 |
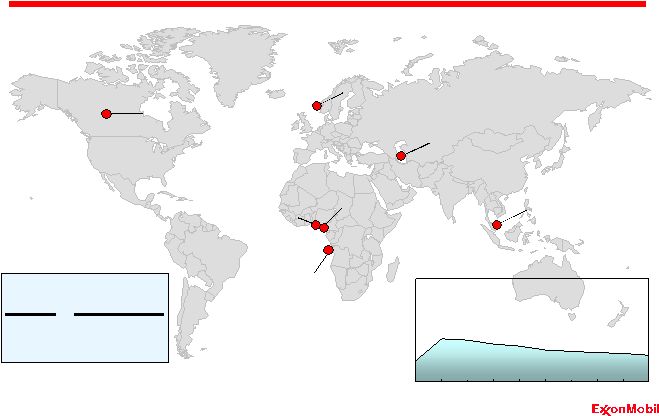 31 2006 Major Project Start-Ups Upstream: Portfolio Quality 2006 7 Year Cumulative Start-Ups Dalia Erha & Erha North Fram East Syncrude Upgrader Expansion Guntong Hub East Area Additional Oil Recovery Azeri-Chirag-Gunashli Phase 2 0 100 200 300 400 500 2006 2008 2010 2012 2014 2006 Start-Ups KOEBD, Net Interest |
 32 2007 Major Project Start-Ups Upstream: Portfolio Quality 2006 7 2007 14 Year Cumulative Start-Ups Rosa RasGas Train 5 Volve Statfjord Late Life Ormen Lange Marimba North Waddenzee KOEBD, Net Interest 0 100 200 300 400 500 2006 2008 2010 2012 2014 2006 Start-Ups 2007 Start-Ups |
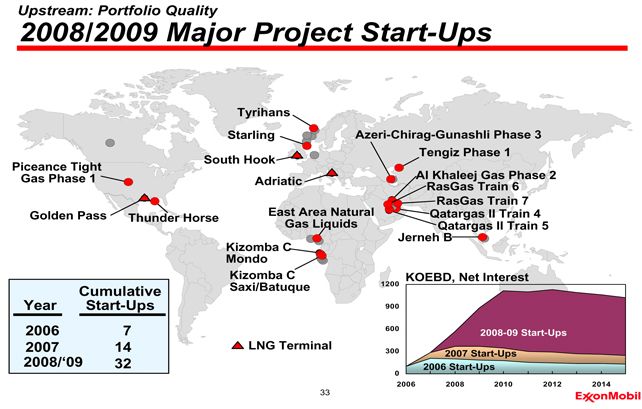 |
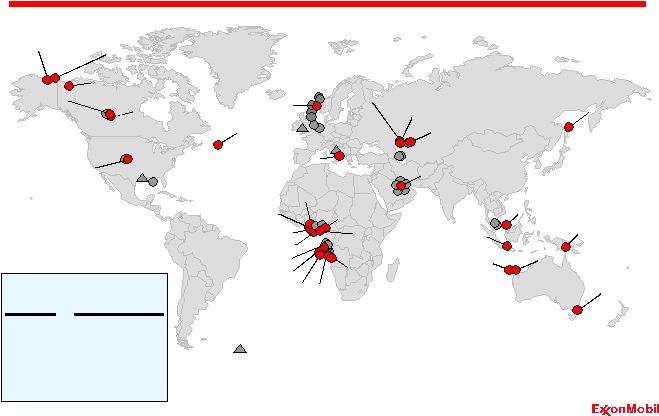 34 2010+ Major Project Start-Ups Upstream: Portfolio Quality Tempa Rossa Hebron Alaska Gas Project/ Point Thomson Mackenzie Gas Project Kearl Phase 1 Kearl (Future Phases) Piceance (Future Phases) Kashagan Phase 1 Kashagan (Future Phases) Tengiz Expansion Sakhalin-1 Future Phases Natuna PNG Pazflor CLOV Kizomba Satellites Bonga N, NW Bonga SW Bosi Usan Satellite Projects LNG IPP Project Greater Gorgon Banyu Urip 2006 7 2007 14 32 2010+ 63 Year Cumulative Start-Ups 2008/‘09 Prudhoe Bay Western Region Development Scarborough Kipper/Tuna PSVM GCG Fram Barzan LNG Terminal |
 35 Company Strengths Growing Competitive Advantage Discipline and Consistency Value Maximization Long-Term Perspective Global Integration Portfolio Quality |
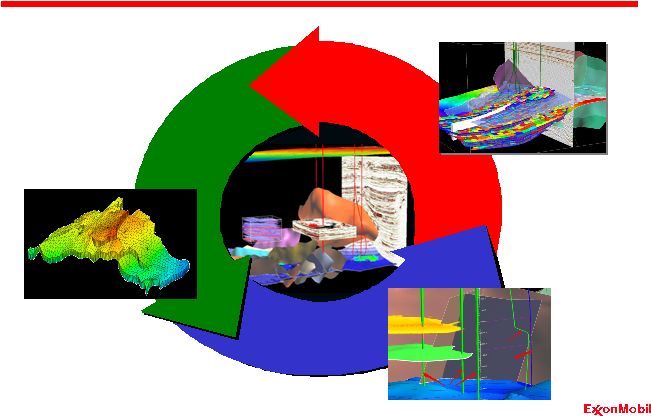
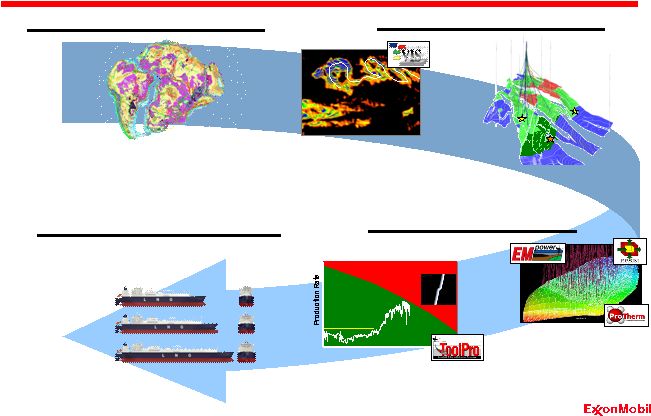 36 Integrating Technology for Success Upstream: Global Integration Understanding the Subsurface Commercializing the Resource Maximizing Ultimate Value New Hydrocarbon Play Concepts Improved Subsurface Interpretation Competitive Advantage Optimizing the Development Physics-Limit Drilling and Completions Integrated Reservoir Management Time Failure No Failure Traditional Rate Limit Time Failure No Failure Traditional Rate Limit Large Scale LNG 215,000 m ³ LNGC 260,000 m 3 LNGC Accurate Reservoir Connectivity Assessment TM |
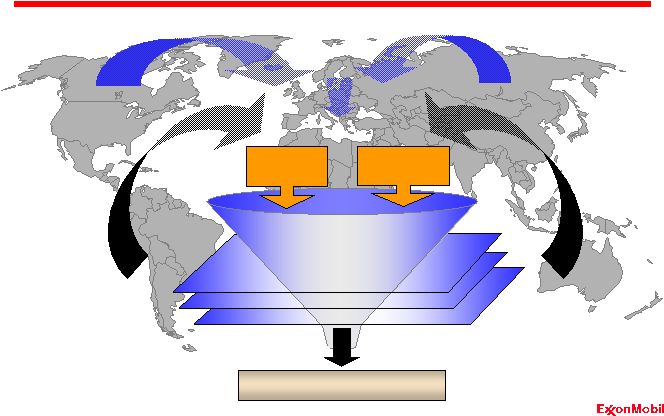
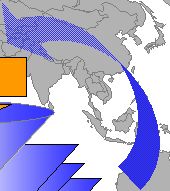
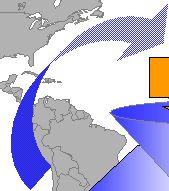
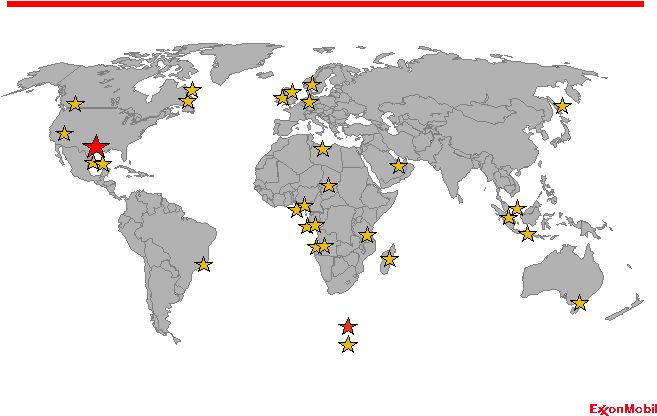 37 Global drilling office in Houston co-located with ExxonMobil Upstream Companies
(Exploration, Development and Production) Upstream: Global Integration Drill teams Global drilling office Global Drilling |
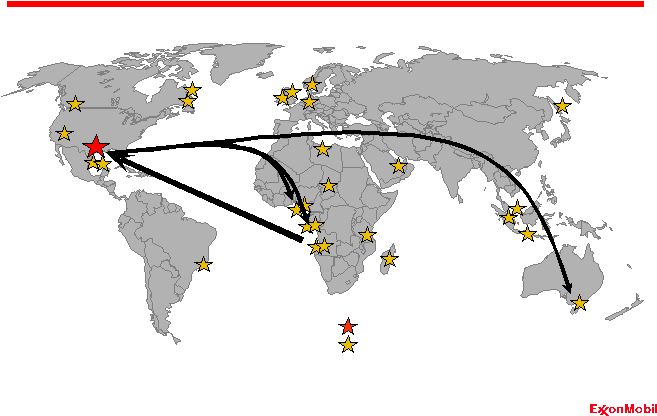 38 Upstream: Global Integration Global Drilling Well Well Testing Testing Drill teams Global drilling office |
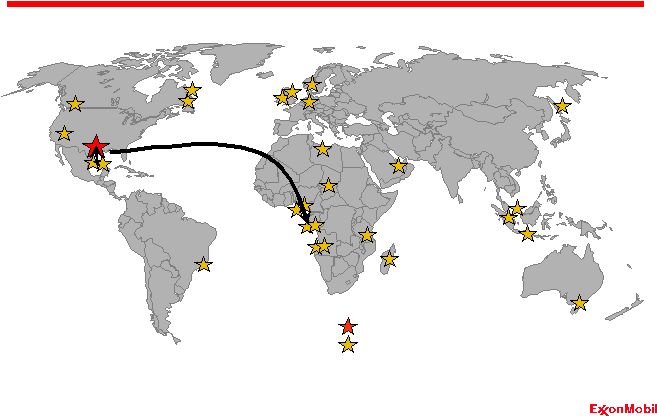 39 Upstream: Global Integration Global Drilling Deepwater Deepwater Completions Completions Drill teams Global drilling office |
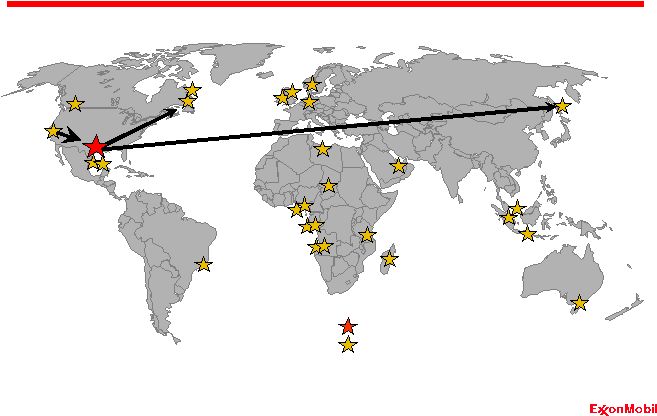 40 Upstream: Global Integration Global Drilling Extended Extended Reach Reach Drilling Drilling Drill teams Global drilling office |
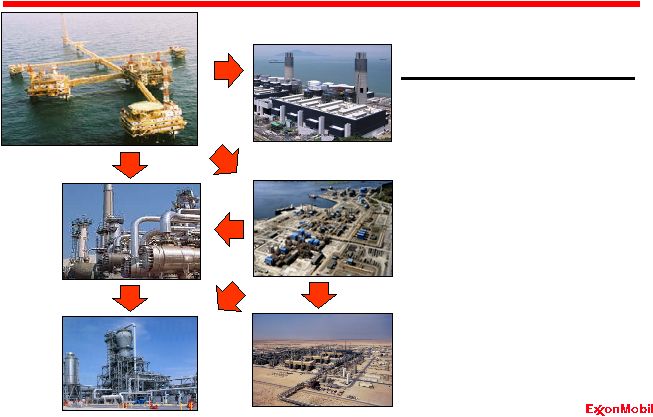 41 Integrated Concepts Upstream: Global Integration Oil & Gas Production Oil & Gas Production Power Plant Power Plant Refinery Refinery Chemical Plant Chemical Plant Gas Processing Gas Processing Maximize resource value • Utilize proprietary technology • Deliver scale advantages • Enhance energy integration • Produce premium products Competitively advantaged platform for growth Crude Oil Natural Gas LNG plant LNG plant |
 42 Company Strengths Growing Competitive Advantage Discipline and Consistency Value Maximization Long-Term Perspective Global Integration Portfolio Quality |
         43 Global Opportunity Identification and Prioritization Upstream: Discipline and Consistency Technical Quality Materiality Commerciality By The Bit Exploration Discovered Fields Quality Opportunities |
 44 Project Management System Upstream: Discipline and Consistency Operate Execute Define Select Planning for Development • Detailed Engineering • Contracting Strategy • Contractor Selection • Change Management Discipline • Build the Operating Organization • Completion and testing • Start-up / Handover to Operations • Integrity management • Reappraisal • Strategy • Commercial Feasibility • Resource Definition • Marketing Plan • Organization • Project Management Team • Front End Engineering • Optimization • Execution Planning • Funding Decision • Concept Selection • Technology Set • Commercial Agreements • Issues Management |
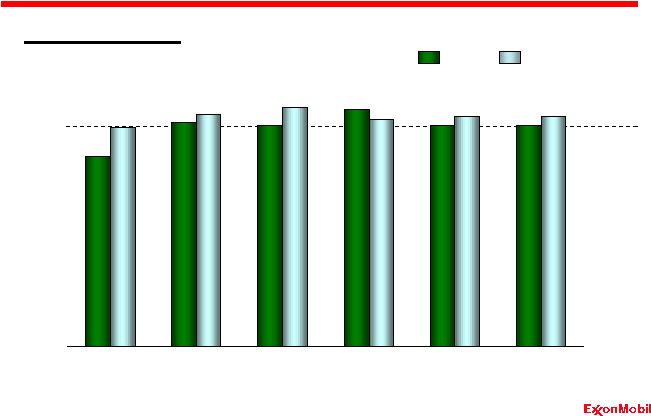 45 Demonstrated Performance Upstream: Discipline and Consistency % Actual vs. Funded* * ExxonMobil-operated projects Cost Schedule Start-Up year 0 20 40 60 80 100 120 2002 2003 2004 2005 2006 Avg '02-'06 |
 46 Company Strengths Growing Competitive Advantage Discipline and Consistency Value Maximization Long-Term Perspective Global Integration Portfolio Quality |
 47 Understand the Reservoir Upstream: Value Maximization Geoscience Drilling/ Subsurface Engineering Reservoir Engineering Shared Earth Environment Shared Earth Environment Well Path Options Well Path Options Pore Pressure Pore Pressure Fracture Gradient Fracture Gradient |
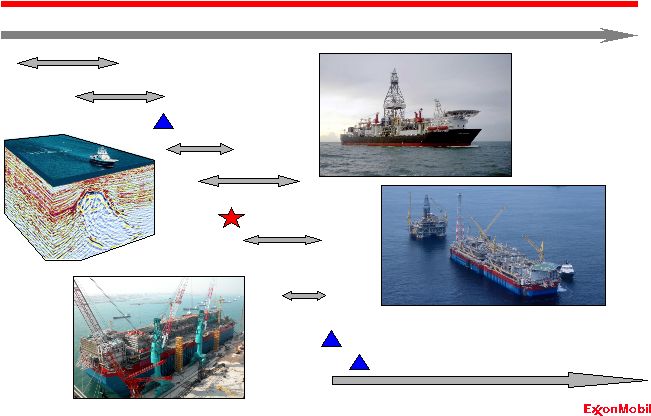
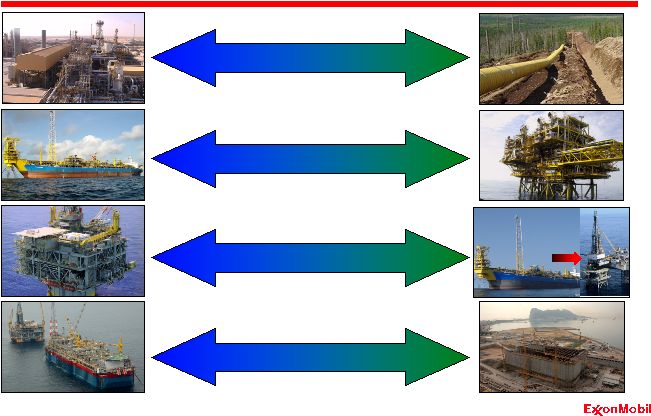 48 Identify the Right Concept LNG Pipeline Subsea Development Platform Full Field Development Phased Development Design One / Build Multiple Unique Solutions Qatar - RasGas Italy - Adriatic LNG Terminal Angola - Kizomba B Angola - Xikomba Russia - Sakhalin-1 USA – Hoover-Diana Malaysia - Angsi Upstream: Value Maximization Nigeria - Yoho |
 49 MOEBD-Net Optimize Drilling Results Upstream: Value Maximization *Cumulative production contribution from all non-project drill wells since January 1, 2002 • 40 rigs operating • $2B net investment • 150 KOEBD net average first-year build-up • 500 MOEB net average per-year reserve adds from revisions and improved recovery 2002-2006 Drilling Program* 0.0 0.5 1.0 '02 '03 '04 '05 '06 |
 50 Production Reliability Uptime % Upstream: Value Maximization EM Operated Operated by Others 75 80 85 90 95 100 2002 2003 2004 2005 2006 |
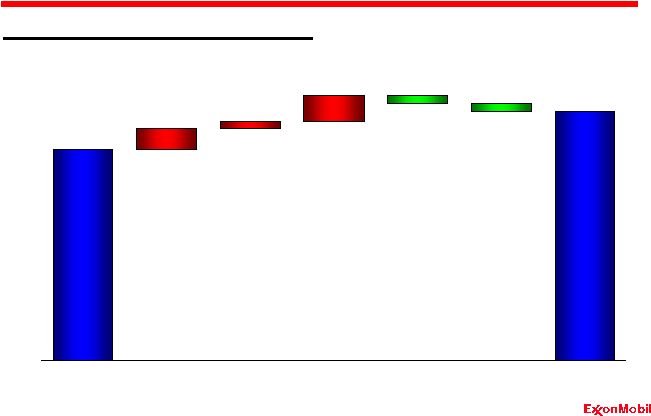 51 $G 2005 Actual Managing Production Costs 2006 Actual Activity / Other Fuel / Forex Market Asset Sales Efficiencies Upstream: Value Maximization Cash Production Costs Excluding Taxes 0 2 4 6 8 10 |
 52 Company Strengths Growing Competitive Advantage Discipline and Consistency Value Maximization Long-Term Perspective Global Integration Portfolio Quality |
 53 Acreage Acquired Discovery 1985 1990 1995 2000 2005 2010 2015 2020 Drill Ship Drill Ship Upstream: Long-Term Perspective Cycle Time – Angola Block 15 First Production – Kizomba A First Production – Kizomba B Regional Studies Negotiations 2D Seismic 3D Seismic Appraisal & Development Planning Fabrication Production Kizomba A Kizomba A FPSO Fabrication |
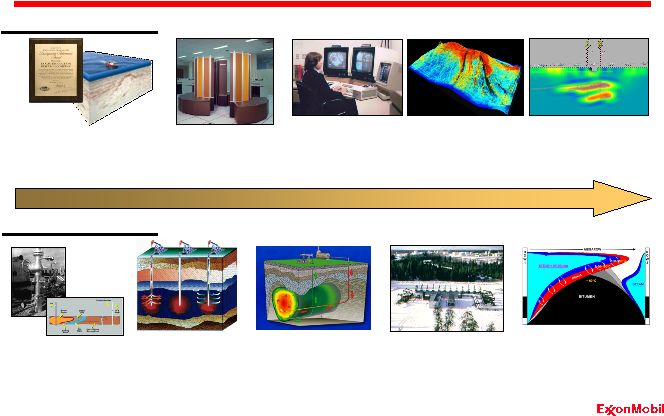 54 1960 2000 Upstream: Long-Term Perspective Upstream Firsts - Subsurface 1953: In Situ Combustion Field Test 1963: Invented 3D seismic exploration Subsurface Imaging Enhanced Recovery 2003: Patent and field test of diluent co-injection with steam (LASER) 2002: R3M electromagnetic reservoir imaging 1981: First use of super- computers for seismic data processing 1966: Cyclic Steam Stimulation (CSS) Patent 1984: First interactive seismic interpretation system 1982: Steam- Assisted Gravity Drainage (SAGD) Patent 1985: In Situ Large-Scale Bitumen Recovery at Cold Lake 1989: Volume visualization of seismic attributes 1980 |
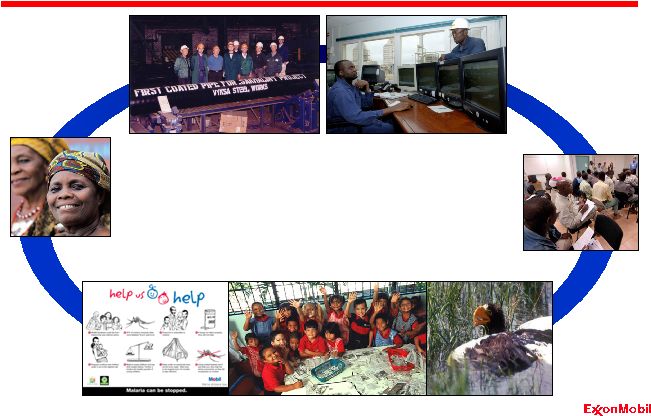 55 Community Development & Involvement Employment and Training Local Content Community, Health and Environment Upstream: Long-Term Perspective |
 56 Company Strengths Growing Competitive Advantage Discipline and Consistency Value Maximization Long-Term Perspective Global Integration Portfolio Quality |
 57 0 1 2 3 4 5 '06 '07 '08 '09 '10 '11 0 1 2 3 4 5 '06 '07 '08 '09 '10 '11 Upstream: Growing Competitive Advantage Delivering Profitable Capacity Growth MOEBD MOEBD Americas Europe Asia Pacific / Middle East Africa Liquids Gas LNG |
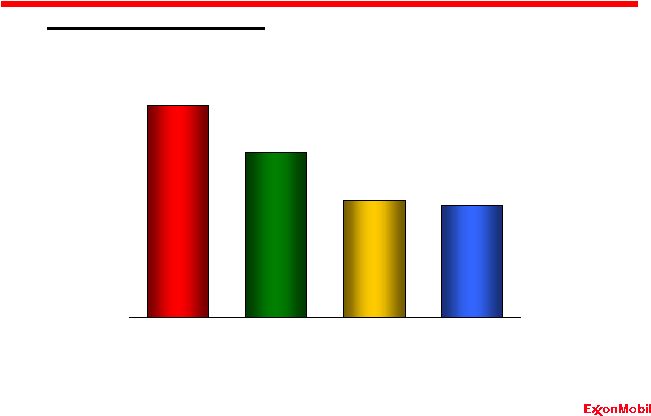 58 Industry-Leading Reserves Upstream: Growing Competitive Advantage Yrs Remaining 14.3 12.6 10.1 12.4 BOEB Proved Reserves* (YE 2006) * ExxonMobil reserves includes year-end price/cost revisions and Canadian oil sands
operations Competitor data estimated using a consistent basis with ExxonMobil,
and based on public information 0 5 10 15 20 25 XOM BP RDS CVX |
 59 Upstream Capital Discipline Upstream: Growing Competitive Advantage Average Capital Employed* BP XOM RDS CVX $B * Competitor data estimated using a consistent basis with ExxonMobil, and based on
public information. 0 20 40 60 80 2002 2003 2004 2005 2006 |
 60 * Competitor data estimated using a consistent basis with ExxonMobil, and based on
public information 2006 Industry-Leading Earnings per Barrel $/OEB 2002-2006 Earnings per Barrel* Upstream: Growing Competitive Advantage 0 5 10 15 20 XOM CVX RDS BP |
 61 Upstream: Growing Competitive Advantage Industry-Leading ROCE % 2002-2006 Average Return on Capital Employed* 2006 * Competitor data estimated using a consistent basis with ExxonMobil, and based on
public information 0 10 20 30 40 50 XOM RDS CVX BP |
 62 Downstream Overview Analyst Meeting March 7, 2007 . . |
 63 • Record financial performance - Earnings $8.5 B - ROCE 35.8 % - Refinery throughput 5.6 MBD - Petroleum product sales 7.2 MBD • Operational excellence continues - Safety and environmental - Energy efficiency • Strategic initiatives delivering - More than $1B “self-help” each year • Capital discipline maintained 2006 Highlights Downstream Refining & Supply Lubes Marketing Fuels Marketing |
 64 Business Strategies • Maintain best-in-class operations, in all respects • Provide quality, valued products and services to customers • Lead industry in efficiency and effectiveness • Capitalize on integration with other ExxonMobil businesses • Selectively invest for resilient, advantaged returns • Maximize value from leading-edge technology Downstream |
 65 Company Strengths Growing Competitive Advantage Discipline and Consistency Value Maximization Long-Term Perspective Global Integration Portfolio Quality |
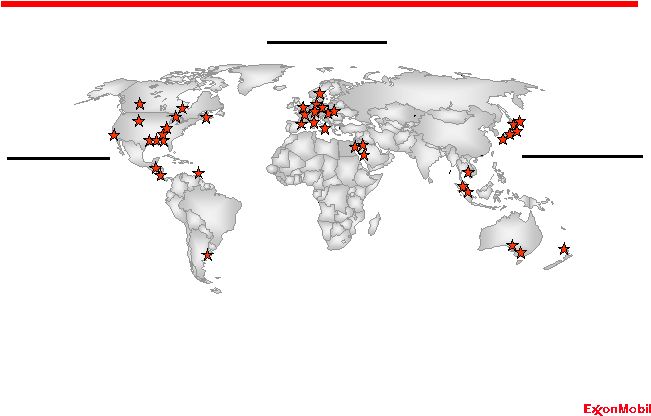 66 Americas 15 Refineries Europe/AME 14 Refineries Asia-Pacific 11 Refineries • Largest global refiner • Largest global supplier & marketer of petroleum products • Largest manufacturer & marketer of basestocks and synthetic lubes • Largest global producer of polyolefins and paraxylene Global Scale and Integration Downstream: Portfolio Quality / Global Integration |
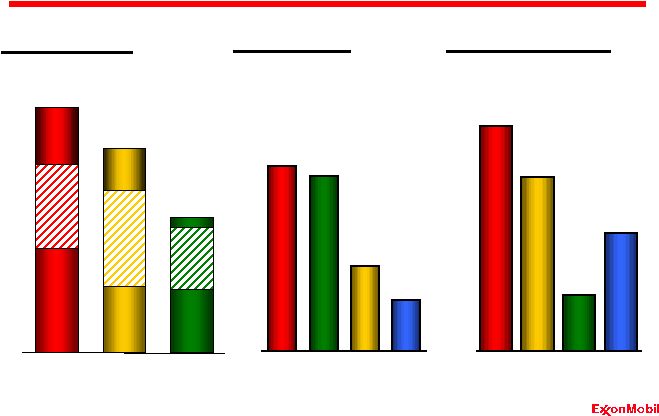 67 XOM RDS BP 0 2 4 6 Average Refinery Size KBD XOM BP RDS Industry Source: Equity capacity calculated on consistent basis using public information Refining Structural Advantages Downstream: Portfolio Quality / Global Integration Integration with Chemicals or Lubes XOM RDS BP Industry Capacity and Geographic Mix MBD Americas Americas EAME EAME AP AP % 80 70 60 50 40 100 150 200 250 |
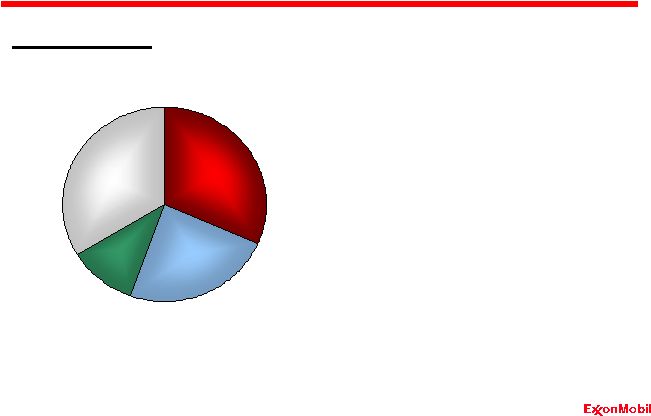 68 Global Fuel Sales Downstream: Portfolio Quality / Global Integration • Largest supplier & marketer of petroleum products • Leveraging integration with refining • Broad spectrum of customer channels • Product placement for highest value • Global systems, work processes and best practices I&W Sales 24% Retail Sales 32% Aviation & Marine Sales 11% Supply Sales 33% Volume Fuels Marketing Structural Advantages |
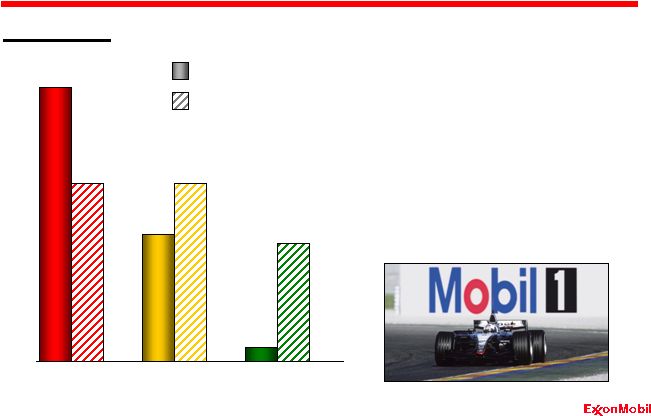 69 Market Share • Largest manufacturer and marketer of lube basestocks • Leveraging integration with refining • Leader in marketing finished lubes • Strong OEM relationships • Technically advanced products % Downstream: Portfolio Quality / Global Integration Basestocks Finished Lubes Lubes Marketing Structural Advantages Source: ExxonMobil based on industry sources and public information 0 5 10 15 20 XOM RDS BP |
 70 Company Strengths Growing Competitive Advantage Discipline and Consistency Value Maximization Long-Term Perspective Global Integration Portfolio Quality |
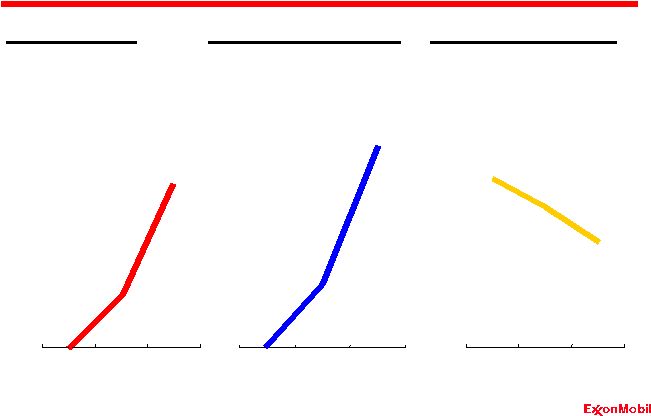
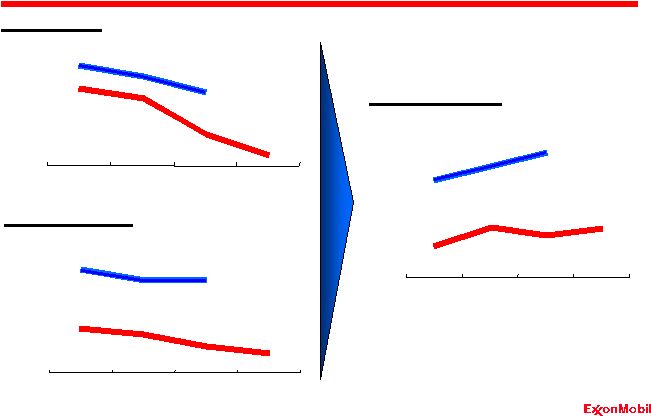 71 Source: Solomon Energy Index XOM Industry Personnel Index XOM Industry Unit Cash Costs XOM Industry Indexed Indexed Indexed Self-Help: Refining Operating Efficiency Downstream: Discipline and Consistency 92 94 96 98 100 102 2000 2002 2004 2006 80 90 100 110 120 130 2000 2002 2004 2006 95 100 105 110 115 2000 2002 2004 2006 |
 72 Self-Help: Marketing Operating Efficiencies Downstream: Discipline and Consistency Indexed Workforce Blend Plants Order Centers Product Complexity Lubes Operating Efficiencies Fuels Operating Efficiencies Workforce Order Centers Retail Sites Indexed Fuels Sales per Site Source: ExxonMobil ’01 ’02 ’03 ’04 ’05 ‘06 ’01 ’02 ’03 ’04 ’05 ‘06 100 50 0 100 50 0 |
 73 Company Strengths Growing Competitive Advantage Discipline and Consistency Value Maximization Long-Term Perspective Global Integration Portfolio Quality |
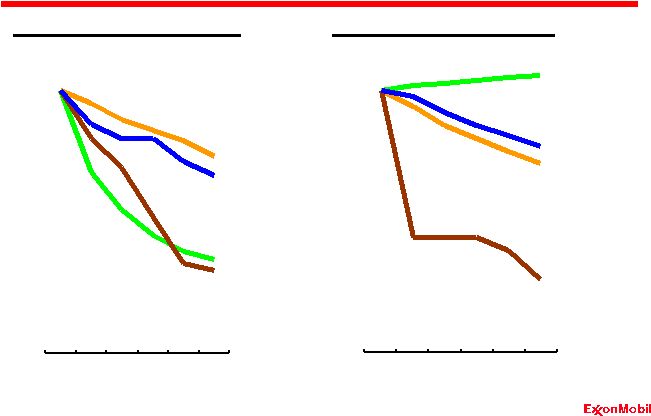
 74 Challenged Crude Runs Crude API Gravity Source: ExxonMobil Self-Help: Refining Raw Material Flexibility Downstream: Value Maximization Indexed Crude Sulfur Weight % Indexed Indexed 90 100 110 120 130 140 150 '03 '04 '05 '06 95 100 105 110 '00 '02 '04 '06 96 98 100 102 '00 '02 '04 '06 |
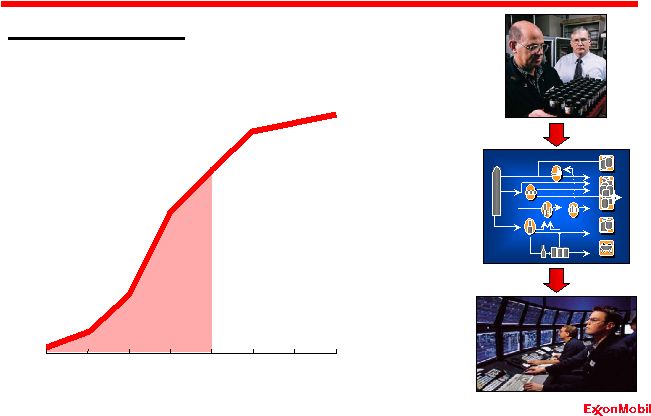 75 Self-Help: Refining Margin Enhancement Molecule Management $M/Year, before-tax Molecular Fingerprinting Process Modeling Process Control and Optimization Scheduling and Blending Downstream: Value Maximization Source: ExxonMobil 0 250 500 750 1000 '02 '03 '04 '05 '06 '07 '08 '09 |
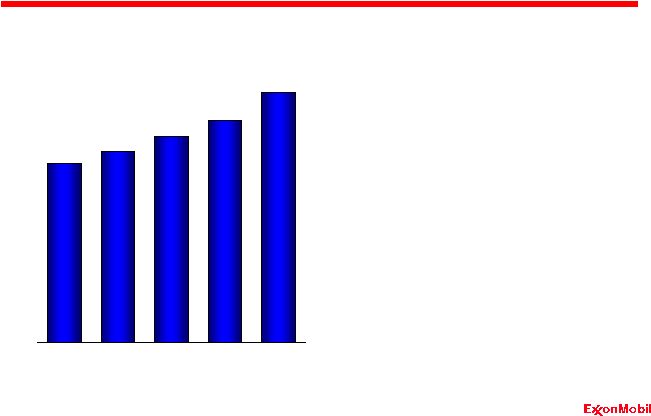
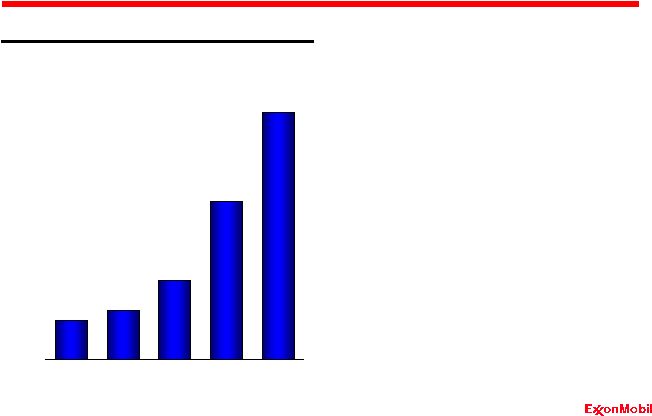
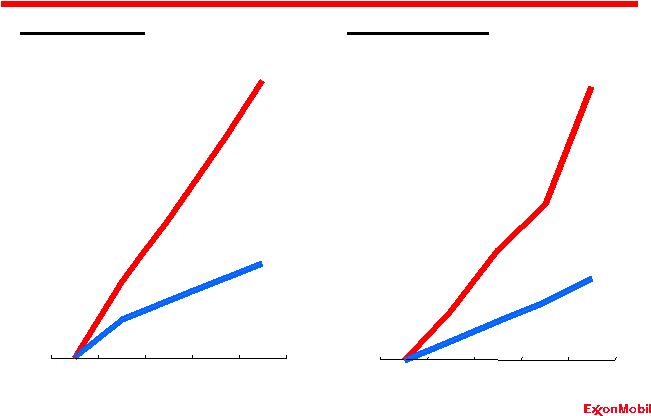
 76 Source: ExxonMobil / OG&J, 100% basis, ex divestments Conversion Capacity Growth Distillation Capacity Growth ~50 KBD per year ~35 KBD per year KBD KBD Self-Help: Economic Refining Growth Downstream: Value Maximization “Equivalent to a new refinery every 3 years” 0 100 200 300 400 '96 '01 '06 0 100 200 300 400 500 '96 '01 '06 |
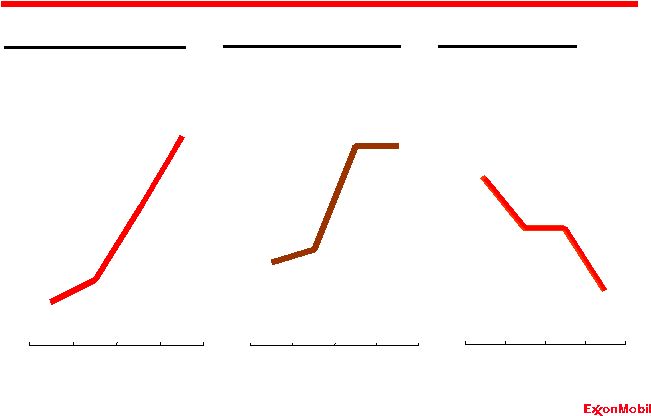
 77 Self-Help: Fuels Marketing $M*, Indexed Asset Utilization Nonfuels Income Growth Breakeven Fuels Margin Volume / $ of asset, Indexed Downstream: Value Maximization U.S. Retail Margin, cpg Indexed * Before tax Source: ExxonMobil 100 105 110 115 120 '02 '04 '06 100 105 110 115 120 '02 '04 '06 80 90 100 110 '02 '04 '06 |
 78 Finished Lube Sales Volume, Indexed Growth Markets XOM Industry* Self-Help: Lubes Marketing Flagship Products Volume, Indexed Downstream: Value Maximization XOM Industry* * ExxonMobil estimate 100 120 140 160 '02 '03 '04 '05 '06 100 120 140 160 '02 '03 '04 '05 '06 |
 79 Company Strengths Growing Competitive Advantage Discipline and Consistency Value Maximization Long-Term Perspective Global Integration Portfolio Quality |
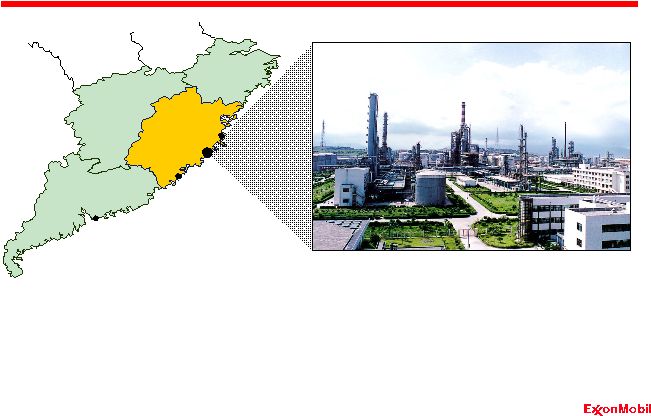   80 Fujian World Class Integrated Complex Downstream and Chemical: Long-Term Perspective • World-scale, integrated refining and chemical complex • Fuels marketing JV including approximately 750 retail sites • Participation across value chain; crude processing through marketing GUANGDONG JIANGXI FUJIAN ZHEJIANG Hong Kong Fujian Refinery Xiamen Fuzhou |
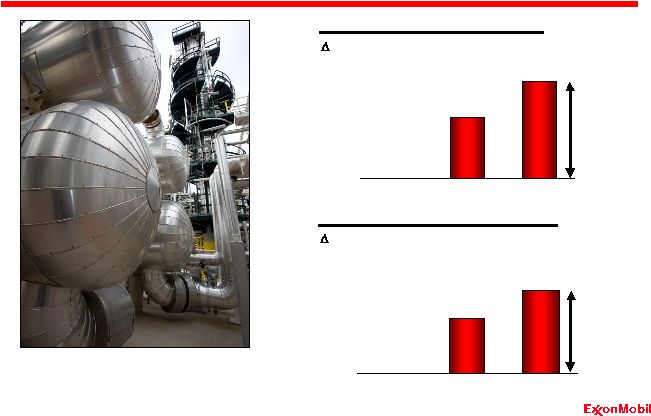
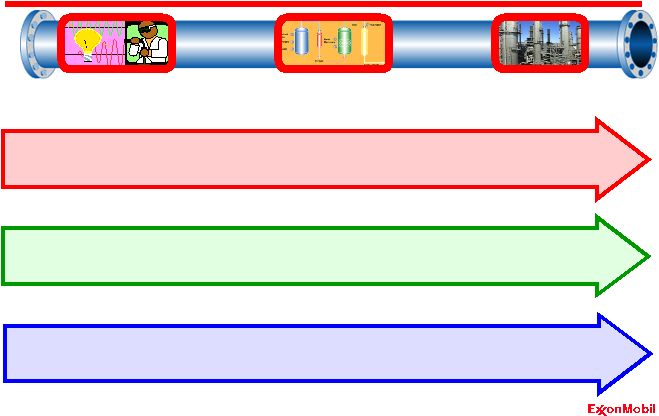
 81 Technology Leadership Downstream: Long-Term Perspective Heavy Oil Upgrading Resid Separation Lower Cost Lube Feeds Corrosion Sensing Mini Crude Assay Slurry Decoking Valve Online Composition Energy / Fouling Reduction Reliability Initiative Diesel Hydrotreating Catalyst Operator Guidance Tools SCANfining Catalyst On-Board Fuel Reforming Plant Automation Mobil 1 Advanced Oils Advanced IC Engine Synthetic Turbine Oil Molecule Management Deployment Development Discovery Advantaged Feed Lower Cost Process Premium Products |
 82 Company Strengths Growing Competitive Advantage Discipline and Consistency Value Maximization Long-Term Perspective Global Integration Portfolio Quality |
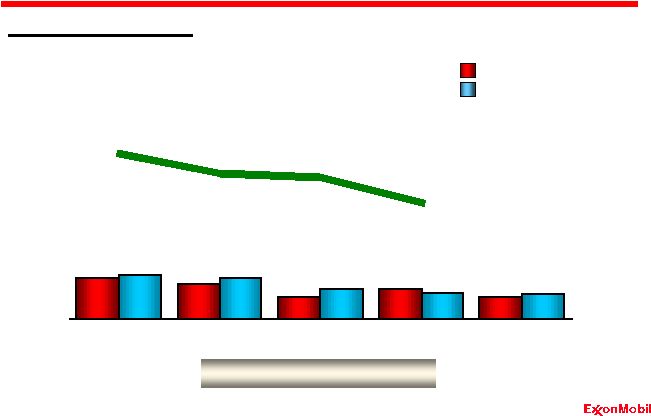
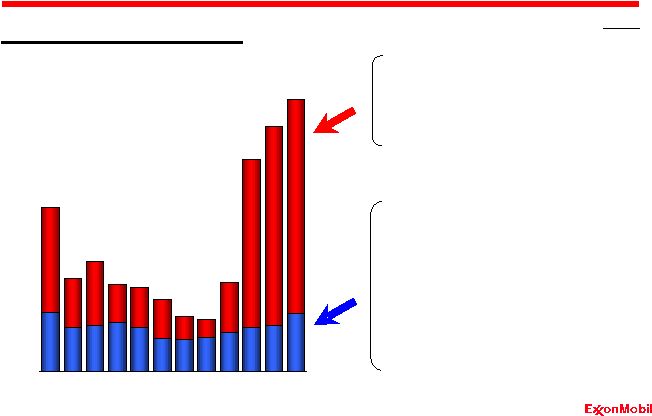
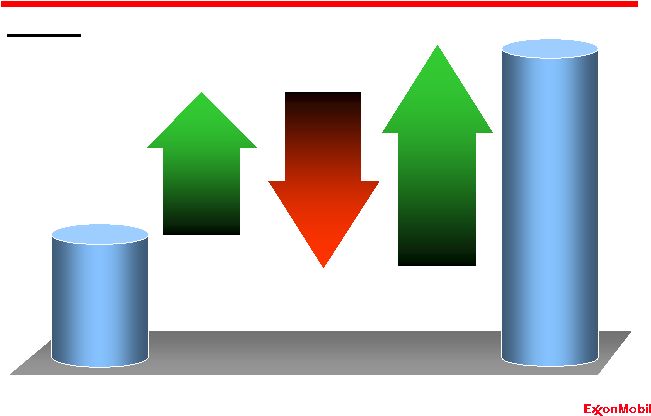 83 Self-Help Inflation, Forex, and Activity 2000 2006 $8.5B $3.4B Earnings Self-Help Drives Earnings Growth Downstream Industry Margins |
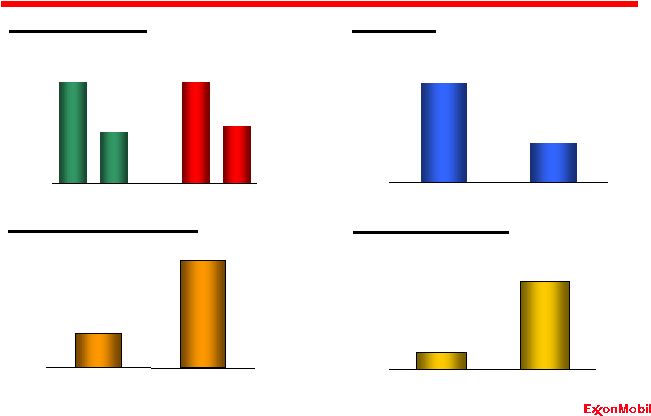
 84 Industry-Leading Returns *Competitor data estimated using a consistent basis with ExxonMobil, and based on public
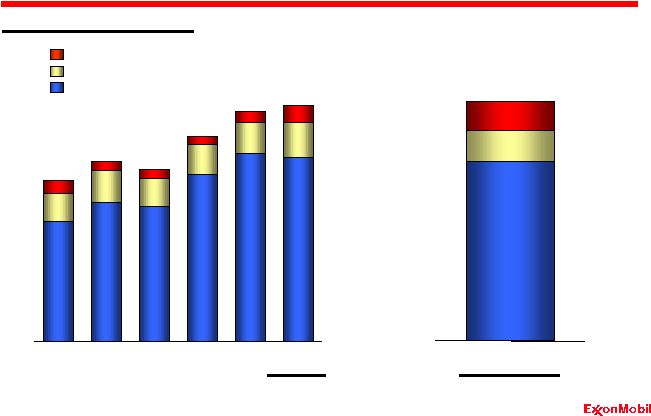
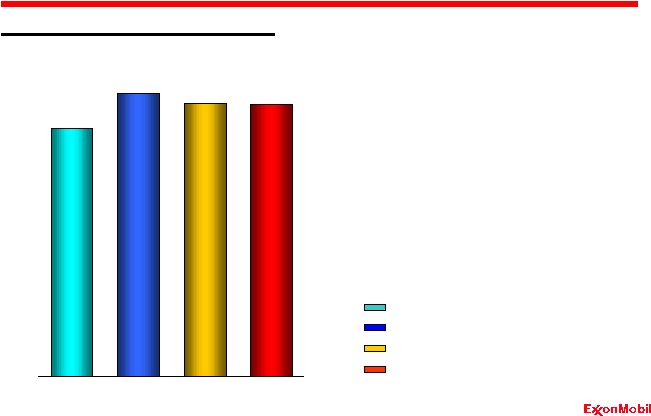
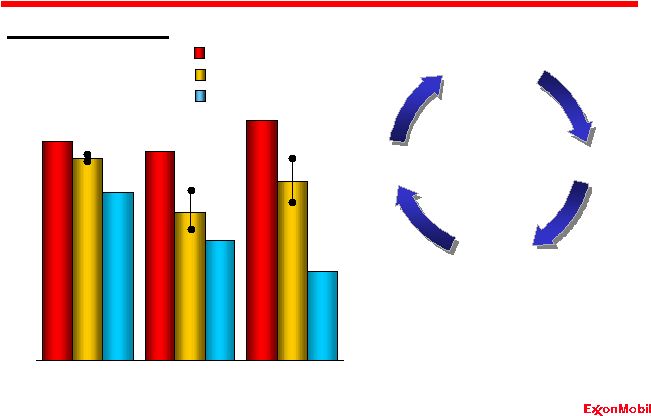
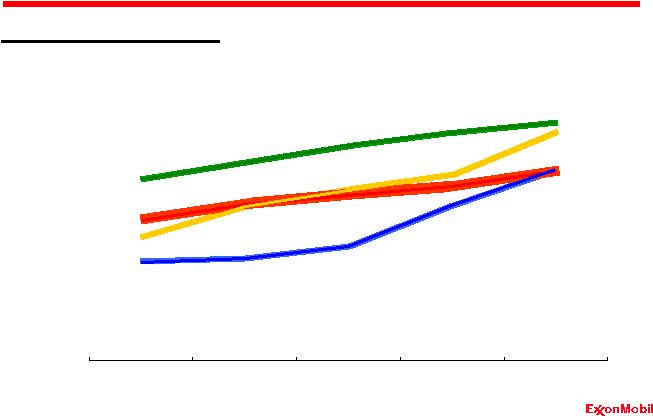
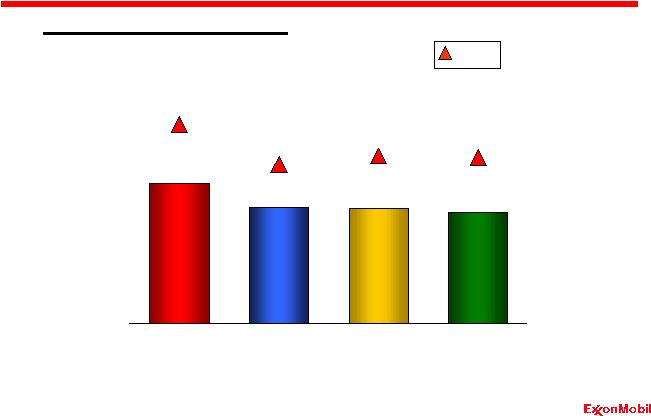
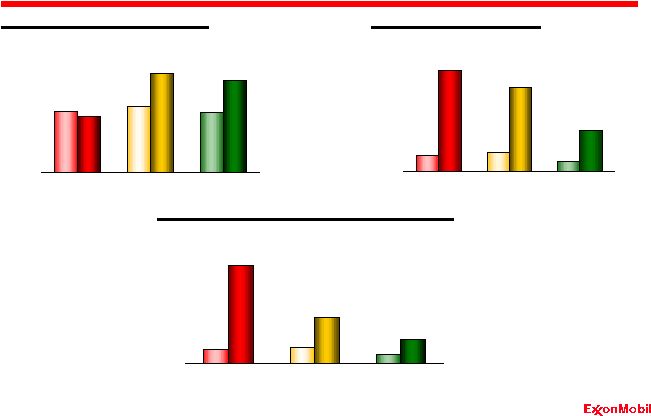
information. Downstream: Growing Competitive Advantage Average Capital Employed* $B XOM RDS BP ’02 ’06 ’02 ’06 ’02 ’06 Return on Average Capital Employed* % Reported Net Income* $B ’02 ’06 ’02 ’06 ’02 ’06 ’02 ’06 ’02 ’06 ’02 ’06 0 15 30 45 0 10 20 30 40 0 3 6 9 |
 85 Chemical Overview Analyst Meeting March 7, 2007 . . |
 86 2006 Highlights • Record financial performance - Earnings
$4.4 B - ROCE
33.2 % • Operational excellence continues - Safety and energy efficiency • Strategic initiatives delivering - Over $450M AT “self-help” each year • Positioning for future growth Chemical |
 87 Business Strategies Long-term strategy built on ExxonMobil’s core competencies • Unique portfolio of global integrated businesses • Integration across ExxonMobil operations • Relentless focus on operational excellence • Disciplined investment in advantaged projects • Technology leadership Chemical |
 88 Company Strengths Growing Competitive Advantage Discipline and Consistency Value Maximization Long-Term Perspective Global Integration Portfolio Quality |
 89 High-Performing Business Portfolio ExxonMobil Chemical Earnings Chemical: Portfolio Quality $B Aromatics 1 Olefins 2 Polyethylene 2 Polypropylene 5 Specialty Businesses Commodity Businesses Rank* *Based on worldwide market position Butyl 1 Fluids 1 Oxo 1 Synthetics 1 Films 1 Adhesion 1 Specialty Elastomers 2 Additives 2 ‘95 ‘05 0.0 1.0 2.0 3.0 4.0 |
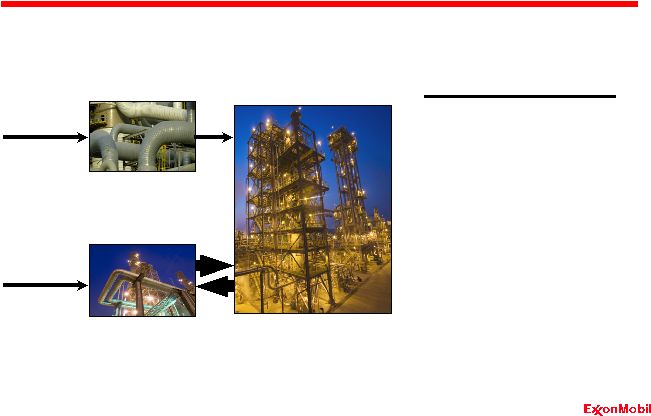 90 Long-Standing Integration Advantage Chemical: Global Integration Areas of Synergy • Advantaged feed access • Molecule optimization • Shared site services • Global processes / systems Petrochemical Plant Crude Oil and Feedstocks Gas Processing Natural Gas Refinery |
 91 Operational Excellence “Self-Help” Energy Initiatives Per unit of production, indexed MT, cumulative vs 2001 Producibility Gains Marketing Improvements Workforce #, indexed Steamcracking Other Operations M$, indexed Chemical: Discipline and Consistency 80 90 100 '02 '06 '02 '06 80 100 120 140 '02 '06 80 90 100 '02 '06 0.0 0.5 1.0 1.5 '02 '06 |
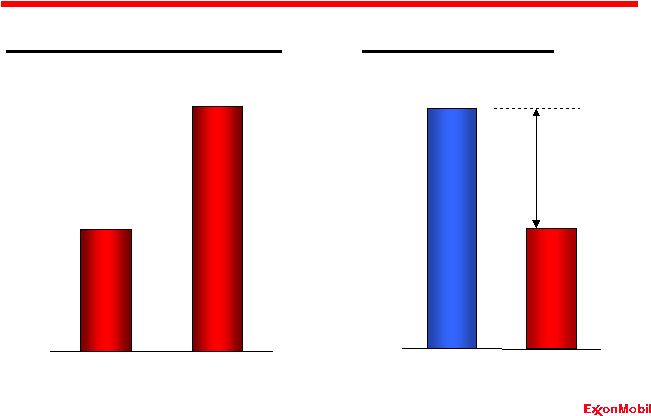 92 Advantaged Feedstocks Chemical: Value Maximization MT, indexed Advantaged Steamcracking Feeds Ethylene Net Feed Cost Advantage vs benchmark feedstock 60 80 100 Benchmark ExxonMobil 80 100 120 '02 '06 20% Advantage |
 93 Premium Product Growth Premium Products Chemical: Value Maximization MT, indexed Unique Customer Applications New Product Development 80 100 120 140 '02 '04 '06 |
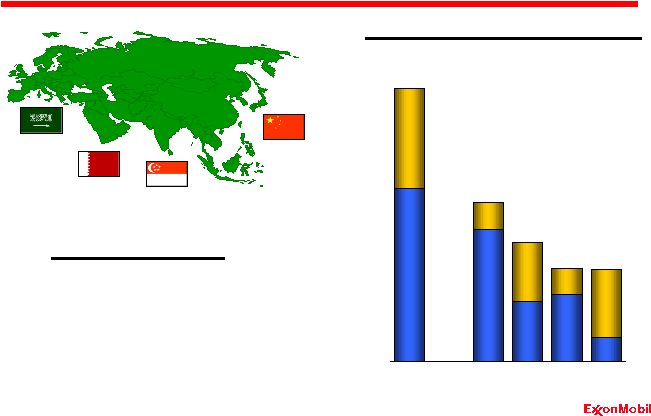 94 Major Growth Projects Chemical: Long-Term Perspective Fujian Singapore Qatar Saudi Arabia Sources of Advantage Premium products focus Advantaged feedstock Integration and scale Proprietary technology MT Existing Announced XOM
BP RDS TOT Dow Asia Pacific / Middle East Capacities 0 2 4 6 8 |
 95 Deployment Development Discovery Chemical: Long-Term Perspective Technology Leadership Advanced Tire Innerliners Vistamaxx Polymer Composites Soft Non-Woven Polymers Improved Stiffness/ Toughness Advanced Solution Polymerization Butyl Enhancements Zeolite Catalyst Extensions Advantaged Polyolefins Low Cost Oligomerization Unipol Fundamentals Next Generation Plasticizers Methanol-to-Olefins Aromatics TransPlus Intermediates Growth Synthetics Enhancements Heavy Steam Cracker Feeds Methane to Chemicals Advantaged Feed Lower Cost Process Premium Products |
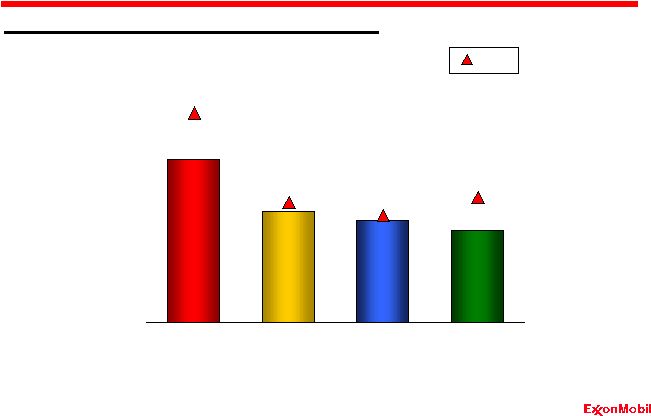
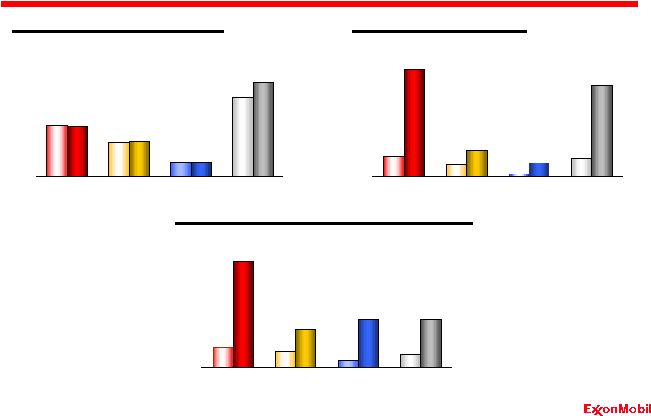 96 Delivering Superior Returns Average Capital Employed* Reported Net Income* $B $B Return on Average Capital Employed* XOM RDS CVX Dow *Competitor data estimated using a consistent basis with ExxonMobil, and based on public
information. % Chemical: Growing Competitive Advantage ’02 ’06 ’02 ’06 ’02 ’06 ’02 ’06 ’02 ’06 ’02 ’06 ’02 ’06 ’02 ’06 ’02 ’06 ’02 ’06 ’02 ’06 ’02 ’06 0 2 4 0 10 20 30 0 10 20 30 |
 97 Summary Analyst Meeting March 7, 2007 . . |
 98 Company Strengths Deliver Superior Performance • Industry-leading portfolio of businesses and assets • Unmatched integration capabilities • Global functional organization leveraging high quality people • Disciplined and consistent approach across the business • Commitment to technology leadership • Relentless focus on maximizing long-term value Growing Competitive Advantage... |
 99 14% 16% 18% 20% 22% 24% 26% 28% 11% 12% 13% 14% 15% 16% Long-Term Advantage for Shareholders S&P 500 Higher Return Lower Return Higher Volatility Lower Volatility 20 year Annualized Total Return vs. Volatility of Returns |
 100 Disciplined Investment Operational Excellence Industry Leading Returns Superior Cash Flow Growth in Shareholder Value Proven Long-Term Approach |