Analyst
Meeting
New York
March 8, 2006
Analyst Meeting
New York
March 8, 2006
Exhibit 99.2
1
| Analyst
Meeting New York March 8, 2006 Analyst Meeting New York March 8, 2006 Exhibit 99.2 1 |
 2 Cautionary Statement Forward-Looking Statements. Outlooks, projections, estimates, targets, and business plans in this presentation or the subsequent discussion period are forward-looking statements. Actual
future results, including demand growth and mix; ExxonMobil’s own production
growth and mix; the amount and mix of capital expenditures; resource additions and
recoveries; finding and development costs; project plans, timing, costs, and capacities; revenue enhancements and cost efficiencies; industry margins; margin
enhancements and integration benefits; and the impact of technology could differ
materially due to a number of factors. These include changes in long-term oil or
gas prices or other market conditions affecting the oil, gas, and petrochemical
industries; reservoir performance; timely completion of development projects; war and other political or security disturbances; changes in law or government regulation; the outcome of commercial negotiations; the actions of competitors; unexpected technological developments; the occurrence
and duration of economic recessions; unforeseen technical difficulties; and other
factors discussed here and under the heading "Factors Affecting Future
Results" in the Investor Information section of our website at www.exxonmobil.com. See also Item 1A of ExxonMobil’s 2005 Form 10-K. Forward-looking statements are
based on management’s knowledge and reasonable expectations on the date hereof,
and we assume no duty to update these statements as of any future date. Frequently Used Terms. References to resources, resource base, recoverable resources, and similar terms include quantities of oil and gas that are not yet classified as proved reserves but that we believe will likely be moved into the proved reserves category and produced in the future. The discussion of reserves in
this presentation generally excludes the effects of year-end price/cost revisions
and includes reserves attributable to equity companies and our Syncrude
operations. For definitions of, and information regarding, reserves, return on
average capital employed, normalized earnings, cash flow from operations and asset sales, and other terms used in this presentation, including information required by SEC Regulation G, see
the "Frequently Used Terms" posted on the Investor Information section of our
website. The Financial and Operating Review on our website also shows ExxonMobil's
net interest in specific projects. |
 3 • Industry-leading safety performance • Record financial performance – Net Income $36.1 B – ROCE 31 % – Cash flow from Operations and Asset Sales $54.2 B • Cash Returned to Shareholders $23.2 B • Capex $17.7 B 2005 – Record Results |
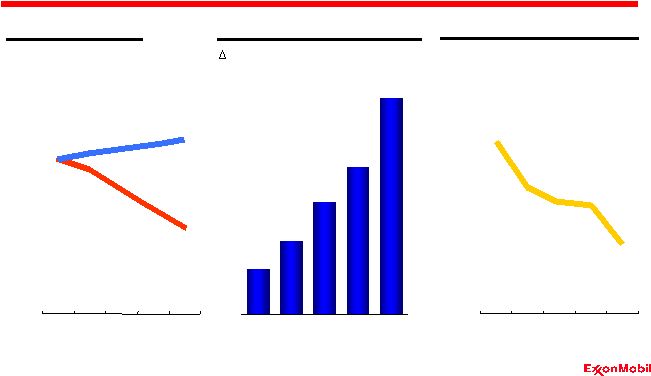
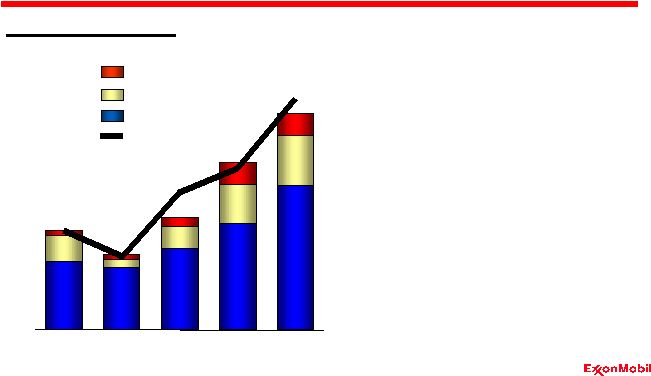 4 Normalized Earnings $B • Superior results in all business lines • Industry-leading results across the cycle • Capitalizing on competitive advantages Chemical Downstream Upstream Net Income 2005 – Record Results 0 5 10 15 20 25 30 35 40 '01 '02 '03 '04 '05 |
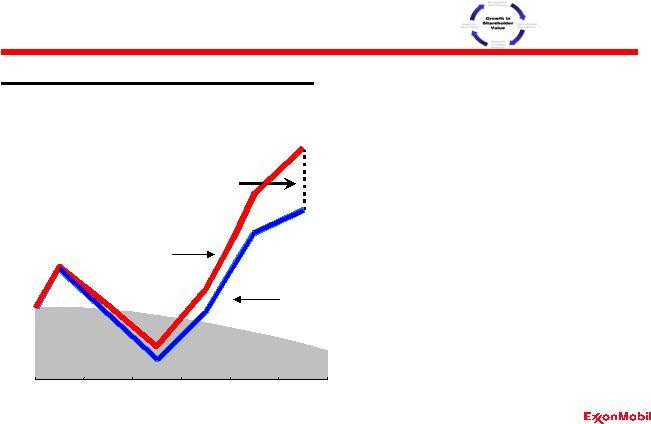
 5 Disciplined Investment Operational Excellence Industry Leading Returns Superior Cash Flow Growth in Shareholder Value Proven Long-Term Approach |
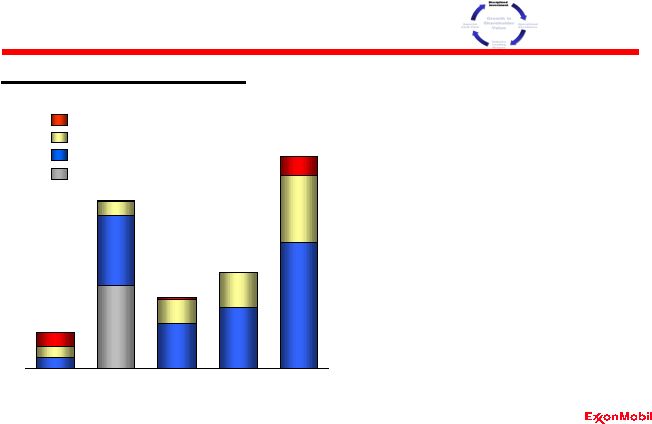
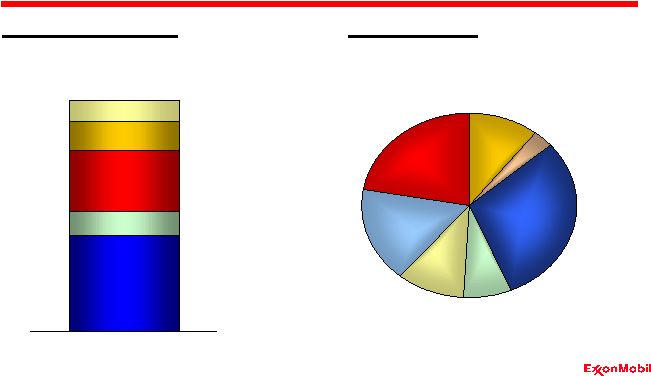
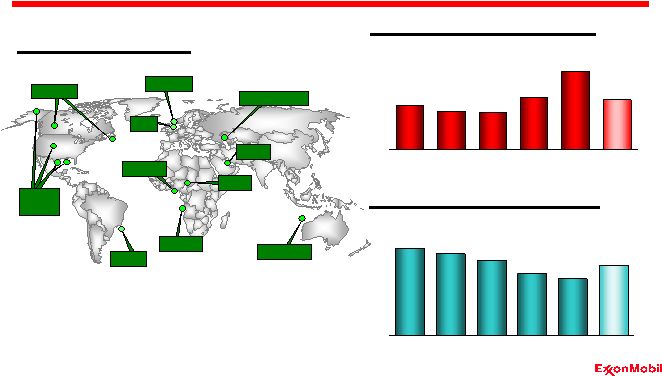
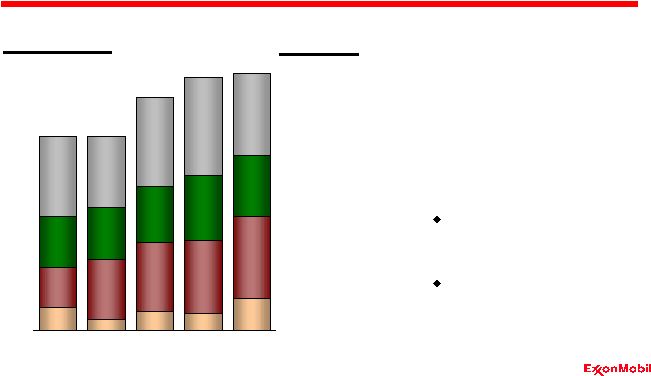
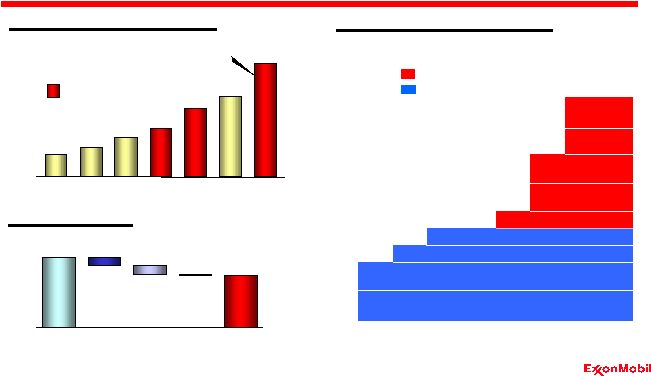
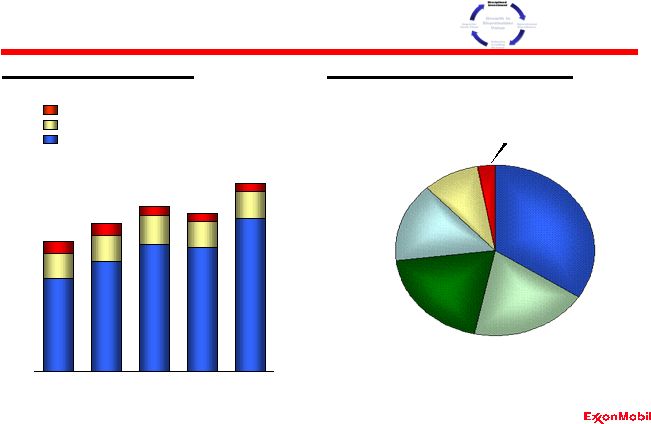 6 Investing for the Future Capex by Business Line $B Chemical / Other Downstream Upstream Disciplined Investment North America Geographic Capex Distribution $B, avg. 2001-2005 Europe Africa Asia Pacific/ Middle East Russia/Caspian Other 0 5 10 15 20 25 '01 '02 '03 '04 '05 |
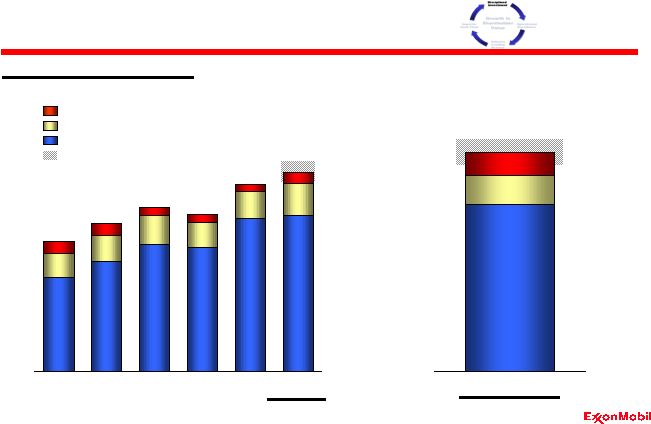 7 Investing for the Future Chemical / Other Downstream Upstream Planning Range (Total) Disciplined Investment Estimate Estimate $B Capex by Business Line $B 0 5 10 15 20 25 '01 '02 '03 '04 '05 '06 0 5 10 15 20 25 '07-'10 Average |
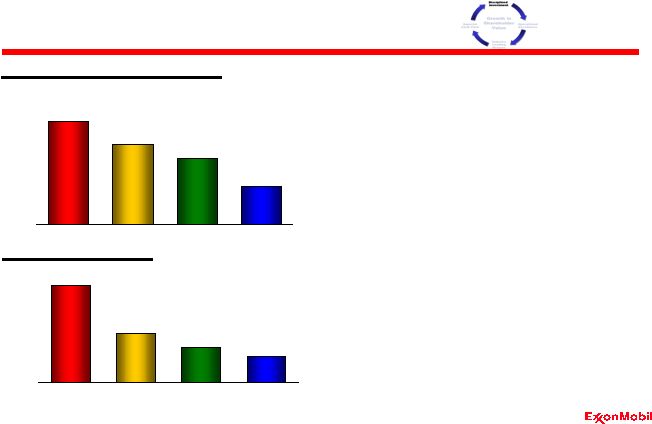 8 Technology Leadership Disciplined Investment * Based on public information • Consistent, long-term approach to technology investment • Focus on proprietary research leads to competitive advantage • Balance between breakthrough and extension of existing advantages • Technology process managed to maximize value Technology Spend* Avg. 2000-2004 $M Total Patents 2001-2005 # 0 100 200 300 400 500 600 700 XOM RDS BP CVX 0 500 1,000 1,500 2,000 2,500 XOM RDS BP CVX |
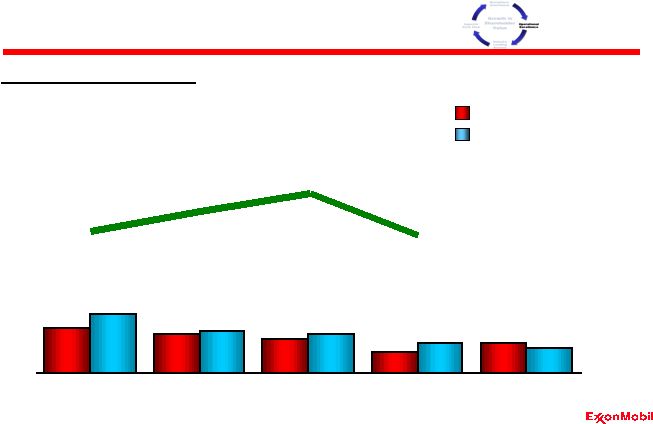
 9 • Rigorous management process • Maximize shareholder value • Cash flow total of $13.6 billion over the past five years • Cumulative earnings impact of $4.6 billion since 2001 Chemical Downstream Upstream Coal & Minerals Asset Divestments, 2001-2005 $B Effective Asset Management Disciplined Investment 0 1 2 3 4 5 6 '01 '02 '03 '04 '05 |
 10 Employee Contractor Lost Time Incident Rate Incidents per 200k hours U. S. Petroleum Industry Benchmark* Safety Leadership Operational Excellence * 2005 Industry data not available 0.0 0.1 0.2 0.3 0.4 0.5 '01 '02 '03 '04 '05 |
 11 • Common standards and culture • Integrated, global processes and systems • Flawless execution • One team, multiple resources • Continuous improvement, rapid deployment of technology and best practices Global Functional Organization Operational Excellence |
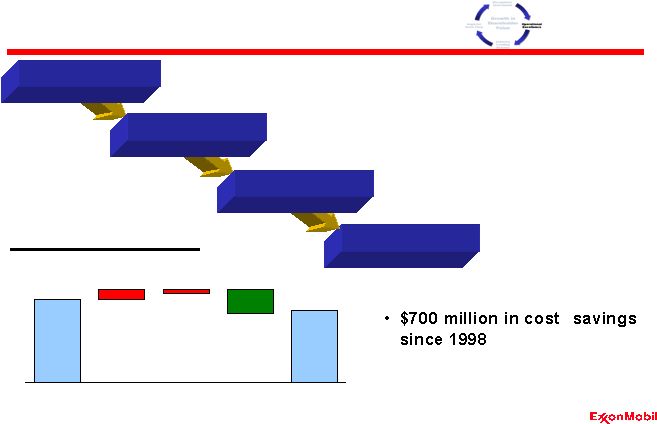 12 Support Services Example Operational Excellence 1998 2005 Inflation Efficiencies Growth/ Other Support Services Costs $B, FX adjusted 5.1 0.6 0.2 (1.5) 4.4 Consolidate into Low Cost Locations Standardized / Optimized Common Business Systems Backbone Implemented at Merger Global Organization Common / Global Processes Standard / Global IT Systems |
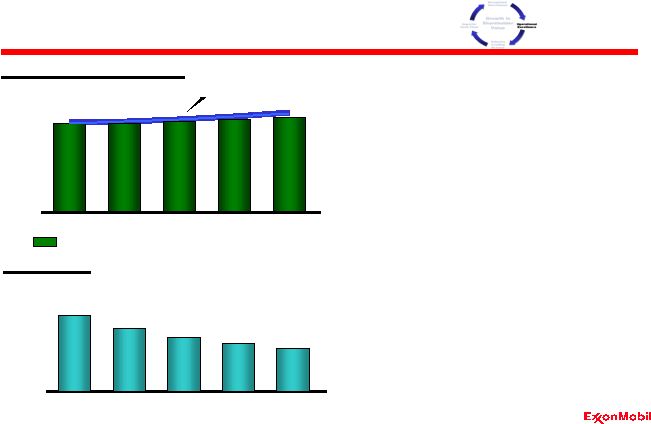 13 Cash Operating Costs $B • More than $1 billion in cost efficiencies in 2005 • Another $1 billion expected in 2006 • More than offsetting inflation • Significant productivity improvements Inflation Cost Control and Productivity Operational Excellence Workforce Cash Operating Costs at ‘05 Forex & Energy price* * Operating costs (see Frequently Used Terms) excluding depreciation and depletion Thousands 65 75 85 95 105 '01 '02 '03 '04 '05 0 10 20 30 40 50 '01 '02 '03 '04 '05 |
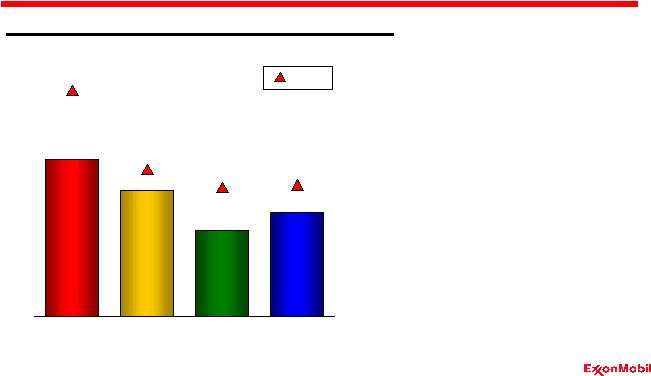
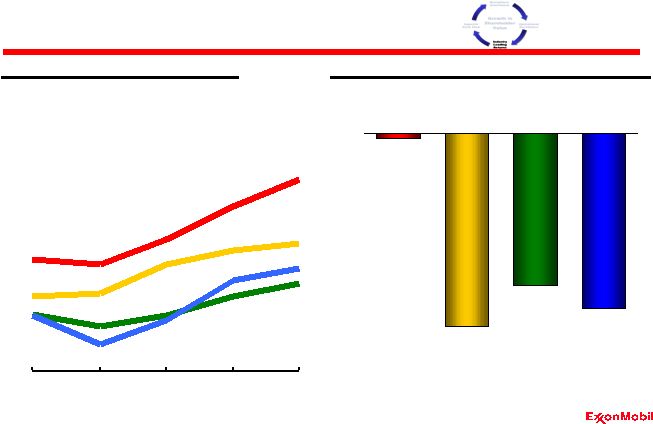 14 Delivering Superior ROCE Industry-Leading Returns ** Calculated from public information on a before-tax basis and converted to after-tax using average corporate tax rate RDS BP CVX XOM Return on Capital Employed* 5-Year Rolling Average % * Competitor data estimated using a consistent basis
with ExxonMobil, and based on
public information 6 10 14 18 22 26 '01 '02 '03 '04 '05 -8 -6 -4 -2 0 XOM RDS BP CVX 2001-2005 Cumulative Asset Write-offs** $B |
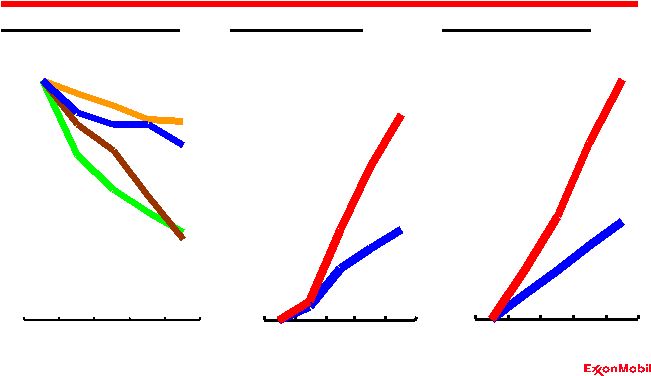
 15 Cash Flow from Operating Activities* $B Superior Cash Flow Superior Cash Flow • Record cash from operations - Over $48 billion in 2005 - Average $32 billion per year from 2001 to 2005 • Capturing the upside * Excludes asset sales ** CVX 2005 cash from operations estimated based on reported earnings and DD&A
XOM RDS BP CVX** 0 40 50 '01 '02 '03 '04 '05 10 20 30 |
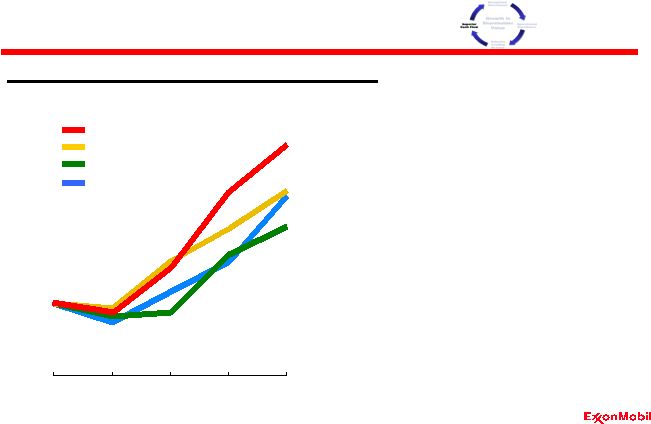 16 1 Capturing More Upside XOM RDS BP CVX** Indexed Cash Flow from Operating Activities* % of 2001 cash from operations Superior Cash Flow • Capturing more of the upside than competition • Strong performance across all business lines • Long-term approach appropriate in cyclical business * Excludes asset sales ** CVX 2005 cash from operations estimated based on reported earnings and DD&A
50 75 100 125 150 175 200 225 '01 '02 '03 '04 '05 |
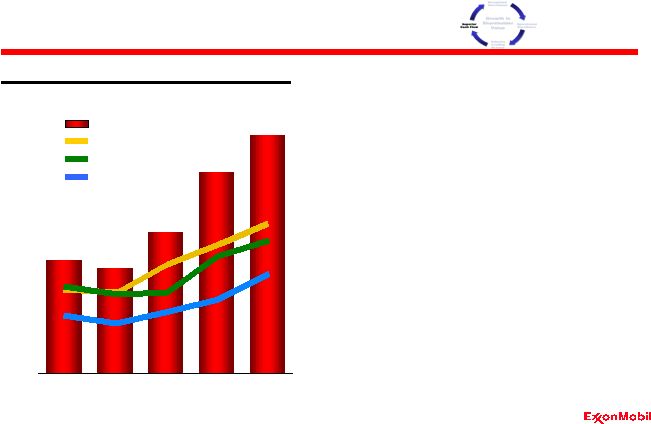
 17 0 20 40 60 80 '00 '01 '02 '03 '04 '05 Superior Distributions Dividends Dividends Share Purchases* * In excess of dilution • Distributed $79 billion since 2000 • Paid dividends for more than 100 years • Increased annual dividend payment each of the last 23 years • Annual dividend increased 9% per year over last 3 years Cash Returned to Shareholders $B Growth in Shareholder Value |
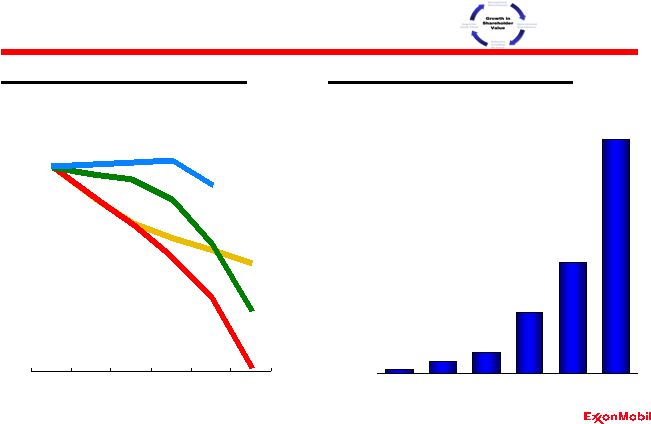 18 88 90 92 94 96 98 100 102 '00 '01 '02 '03 '04 '05 Share Buyback Program XOM RDS BP CVX** Growth in Shareholder Value Shares Reduced via Buybacks* % 2000 shares outstanding Buyback Contribution to EPS $/share * Period end shares outstanding based upon publicly available data ** CVX not shown past 2004 because of Unocal acquisition 0.00 0.10 0.20 0.30 0.40 0.50 0.60 '00 '01 '02 '03 '04 '05 |
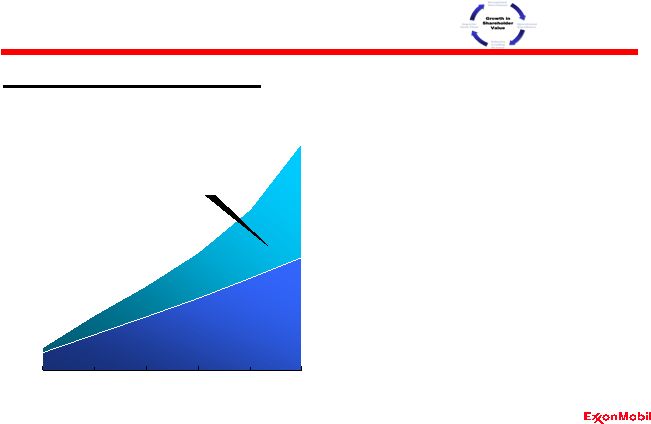
 19 • Shares outstanding reduced by 12% • Market cap increased by 26% • Share price increased by 43% Growth Since Share Buyback Inception Indexed Growth Increasing Value per Share Growth in Shareholder Value Market cap growth Value of buyback program Stock price growth Shares outstanding 80 90 100 110 120 130 140 150 '00 '01 '02 '03 '04 '05 |
 20 Corporate Summary • 2005 record year • Long-term approach delivering superior results • Building on our advantages • Delivering rapid sustainable business improvements Disciplined Investment Operational Excellence Industry Leading Returns Superior Cash Flow Growth in Shareholder Value |
 21 Upstream Overview Analyst Meeting March 8, 2006 |
 22 2005 Highlights • Record earnings $24.3 B • ROCE 46 % • Production volumes 4.1 MOEBD • Resource adds 4.4 BOEB • Proved reserves adds 1.7 BOEB • Capex $14.5 B Upstream |
 23 Upstream Strategies • Identify and pursue all attractive exploration opportunities • Invest in projects that deliver superior returns • Maximize profitability of existing oil and gas production • Capitalize on growing natural gas and power markets Upstream |
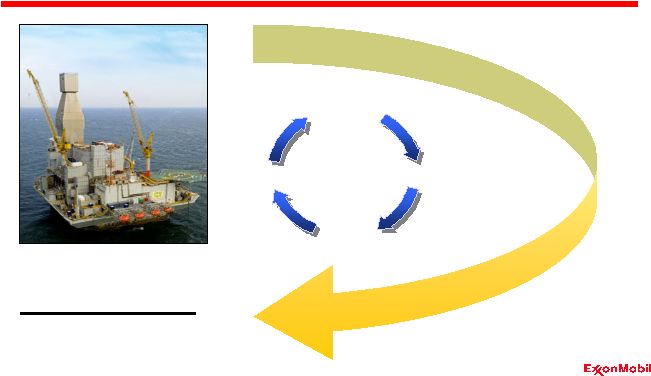 24 Business Approach Upstream Operational Excellence Disciplined Investment Industry Leading Returns Superior Cash Flow Growth in Shareholder Value Large, High-Quality Resource Base Attractive Project Portfolio Superior Project Management Maximum Value from Production Assets Proprietary Technology Development and Deployment Industry-Leading Returns Competitive Advantages Through the Asset Lifecycle |
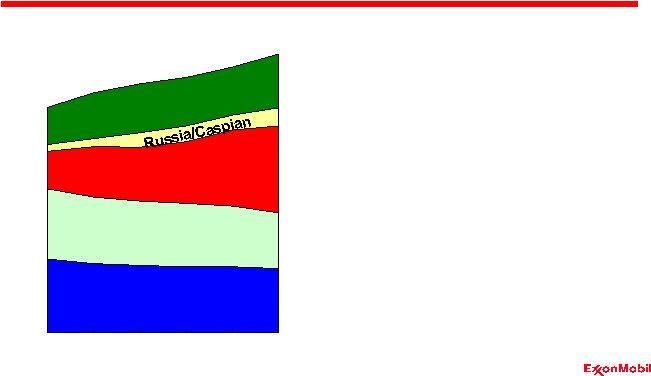
 25 Superior Size and Quality Resource Type Upstream: Large, High-Quality Resource Base LNG Tight Gas Conventional Deepwater Arctic Heavy Oil Acid/Sour Gas Total Resource Base Americas Europe Russia/Caspian Africa 73 BOEB Asia Pacific/ Middle East BOEB 0 40 80 YE '05 |
 26 0 4 8 12 Kearl Fort Hills Joslyn Horizon 0 1 2 3 4 5 Kearl Fort Hills Joslyn Horizon Quality Heavy Oil Resources – Kearl Resource Quality BOEB Total Volume: Bitumen-in-place Resource Size Horizon Fort Hills Upstream: Large, High-Quality Resource Base Joslyn XOM Competitors |
 27 0.0 0.2 0.4 0.6 0.8 '01 '02 '03 '04 '05 5 Yr 0 1 2 3 4 5 '01 '02 '03 '04 '05 5 Yr Brazil Norway Angola Nigeria Chad U.K. Kazakhstan Adding to the Resource Base Annual Resource Additions Average Annual Finding and Resource Acquisition Costs BOEB $/OEB Qatar 2005 Resource Adds Australia Upstream: Large, High-Quality Resource Base Canada Avg. Avg. United States |
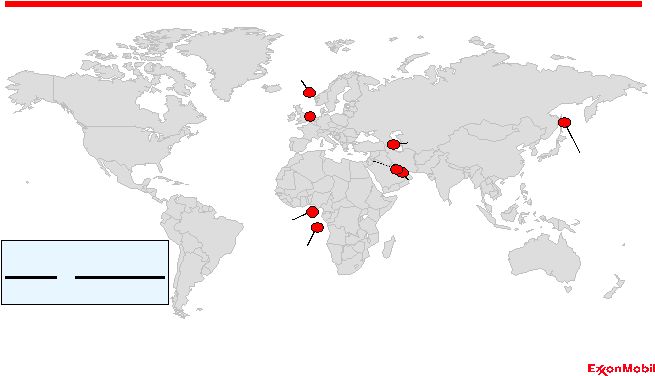
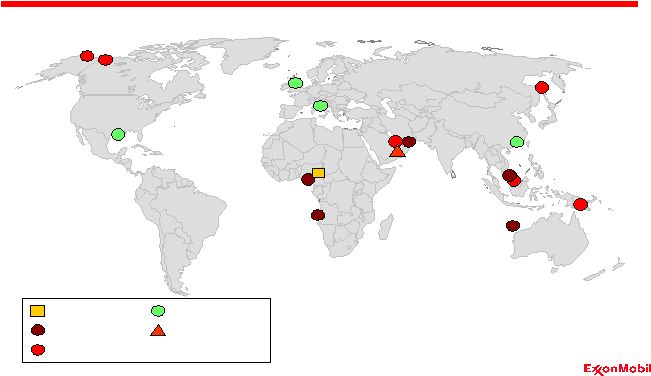
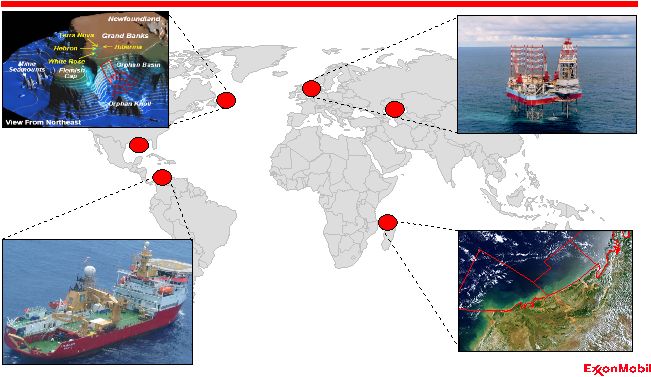 28 Adding to the Resource Base – 2006/07 Exploration Upstream: Large, High-Quality Resource Base Madagascar- Majunga Block Canada-Orphan Basin Norway-Kogge Kazakhstan- Ansagan U.S.-Blackbeard Colombia-Tayrona Block |
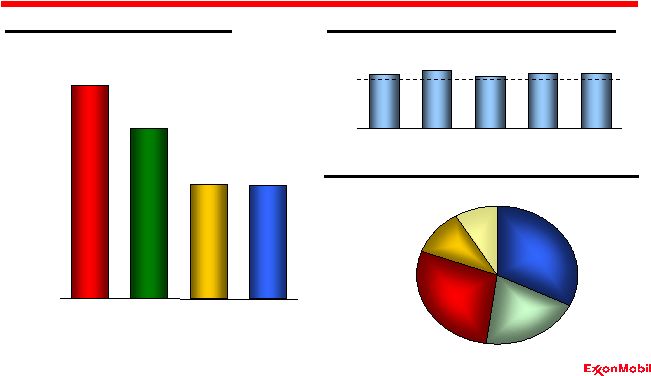 29 0 50 100 '01 '02 '03 '04 '05 Industry-Leading Reserves % XOM Proved Reserves Replacement Upstream: Large, High-Quality Resource Base XOM YE’05 Proved Reserves by Region Americas Europe Asia Pacific/ Middle East Africa Russia/Caspian (Including asset sales, excluding YE pricing) BOEB Yrs Remaining 14.5 12.3 9.5 13.6 BOEB Proved Reserves* (YE 2005) * ExxonMobil reserves includes year-end price/cost revisions and Canadian tar sands
operations Competitor data estimated using a consistent basis with ExxonMobil,
and based on public information 0 5 10 15 20 25 XOM BP RDS CVX |
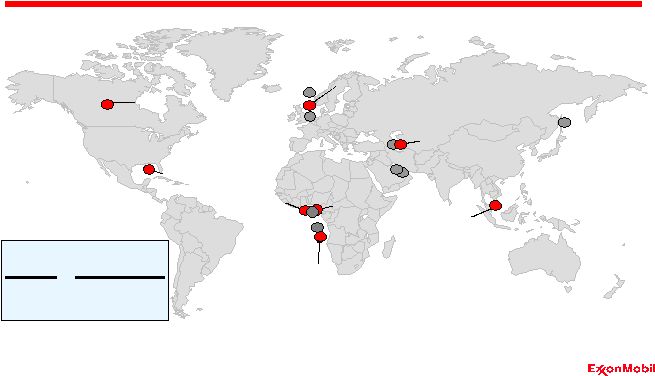
 30 2005 Major Project Start-Ups Upstream: Attractive Project Portfolio Kizomba B Azeri-Chirag-Gunashli Phase 1 Bonga Kristin RasGas Train 4 Sakhalin-1 Phase 1 Arthur Al Khaleej Gas Phase 1 2005 8 Year Cumulative Start-Ups |
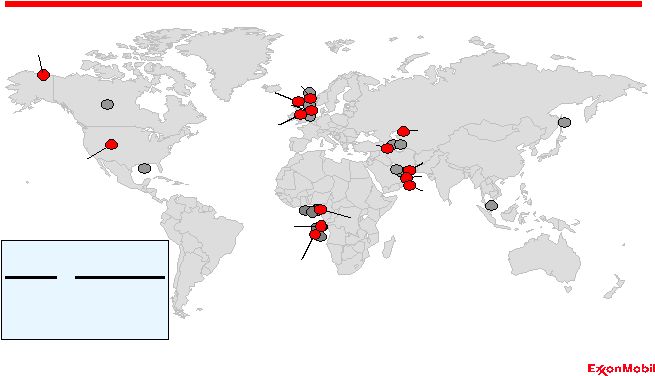
 31 2006 Major Project Start-Ups Upstream: Attractive Project Portfolio Dalia Erha & Erha North Fram East Syncrude Upgrader Expansion Guntong Hub Thunder Horse East Area Additional Oil Recovery 2005 8 2006 16 Year Cumulative Start-Ups Azeri-Chirag-Gunashli Phase 2 |
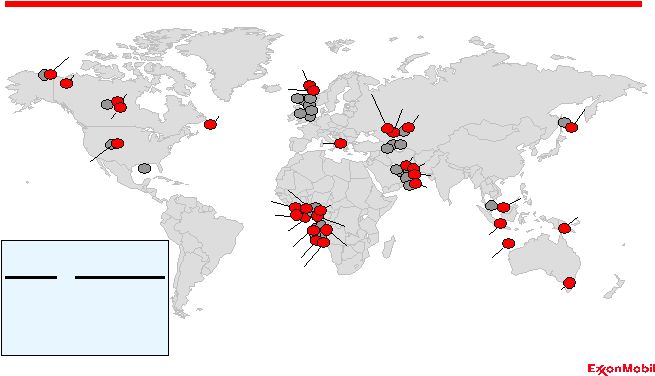
 32 2007/2008 Major Project Start-Ups Upstream: Attractive Project Portfolio 2005 8 2006 16 30 Year Cumulative Start-Ups Qatargas II Train 4 Kizomba C East Area Natural Gas Liquids PBU Western Region Dev. (Orion) RasGas Train 6 Rosa Area Tengiz Phase 1 RasGas Train 5 Volve Statfjord Late Life Ormen Lange Piceance Tight Gas Phase 1 Starling Azeri-Chirag-Gunashi Phase 3 2007/‘08 |
 33 2009+ Major Project Start-Ups Upstream: Attractive Project Portfolio Skarv/Idun Tyrihans Tempa Rossa Hebron Alaska Gas Project/ Point Thomson Mackenzie Gas Project Kearl Phase 1 Kearl (Future Phases) Piceance Tight Gas Phase 2 Kashagan Phase 1 Kashagan (Future Phases) Tengiz Expansion Al Khaleej Gas (Future Phases) RasGas Train 7 Qatargas II Train 5 Qatar GTL Sakhalin-1 Gas Export Natuna PNG Gas Project Paz Flor Lirio-Cravo Kizomba D Angola LNG Bonga Ullage Bonga SW Bosi Oil Usan Satellite Projects LNG IPP Project Greater Gorgon Banyu Urip 2005 8 2006 16 30 2009+ 62 Year Cumulative Start-Ups Kipper/Tuna 2007/‘08 |
 34 Strong Project Inventory # of Projects Planning Designing Implementing Start-up Upstream: Attractive Project Portfolio Project Phase • Inventory develops 26 BOEB (net) • Designing, implementing, and start-up projects 50% increase in number of projects since 2001 Average development cost of $3/OEB gross 0 40 80 120 '01 '02 '03 '04 '05 |
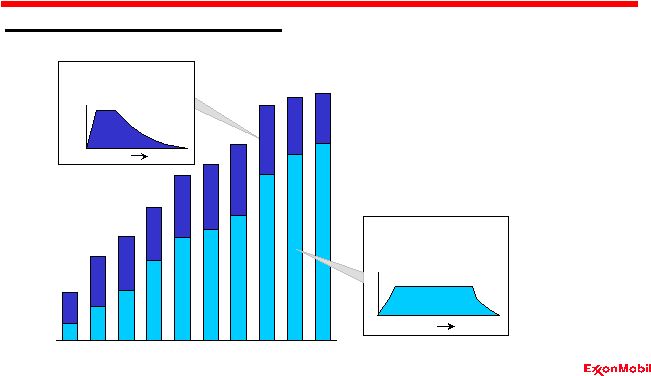 35 Adding Quality Extended-Plateau Capacity Upstream: Attractive Project Portfolio • Over 2 MOEBD capacity to be added by 2015 • 65% of new capacity from extended-plateau flowstreams 2006 2015 MOEBD-Net 2.5 2.0 1.5 1.0 0.5 0 Extended- Plateau Flowstreams T 2005-2015 Major Project Start-Ups Conventional Decline Flowstreams T 17 |
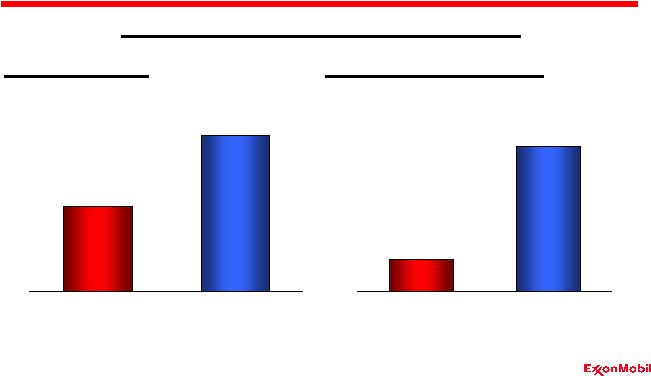 36 Leading Industry in Large Project Execution * RDS, BP, CVX Upstream: Superior Project Management Operated Projects > $1 Billion, Start-Up 2005-2008 $/OEB Cost Growth (since 1Q 2005) % Development Cost XOM Competitors* XOM Competitors* Sources: Wood Mackenzie, public information and project owner data 0 1 2 3 4 0 10 20 30 |
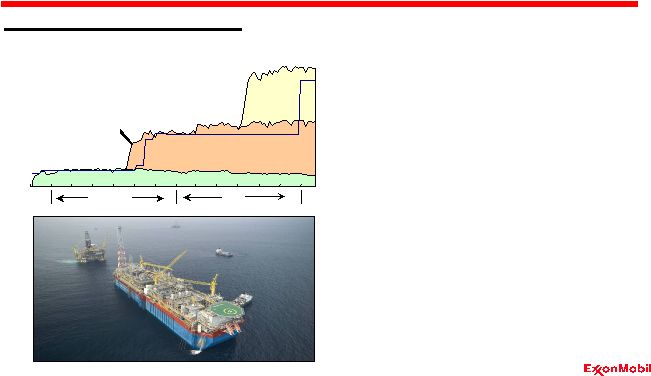 Execution Excellence - Deepwater Angola • Design One, Build Multiple • Established new worldwide benchmark for cycle time • Achieved production rates at or above expectations • Utilized tension leg platforms for cost effective well intervention • Developing Kizomba C Upstream: Superior Project Management Block 15 Production Build-Up KBD-Gross ‘03 ‘04 ‘05 ‘06 Kizomba B Kizomba A Xikomba 2003 Planning Outlook 37 0 200 400 600 |
 38 Execution Excellence - Sakhalin 1 • Phased approach • World-class extended-reach drilling performance • On-schedule start-up in October 2005 • Onshore production facility start-up YE 2006 Upstream: Superior Project Management XOM Competitors 1 3 2 6 4 7 5 8 0 100 200 300 400 500 600 700 Extended-Reach Wells Rate (feet/day) Vertical Depth (K feet) 40 0 10 20 0 10 20 30 Reach (K feet) Chayvo |
 39 0 20 40 60 '03 '04 '05 '06 '07 '08 '09 '10 Execution Excellence - Qatar LNG MTA-Gross LNG Train Capacity Growth Conventional LNG Large LNG Larger Trains Larger Ships Terminal % Upstream: Superior Project Management LNG from XOM-Interest Trains RasGas 1-2 RasGas 3 RasGas 5 RasGas 6 Qatargas 4 Qatargas 5 RasGas 7 Qatargas 1-3 RasGas 4 Cost of Service 100 50 0 MTA-Gross Qatar LNG Trains ‘69 ‘77 ‘83 ‘96 ‘04 ‘05 ‘08 Major train size increases – Start-Up year Qatargas II Train 4 RasGas Train 6 Funded Operating 0 2 4 6 8 |
 40 Pursuing Gas and Power Opportunities Qatar Gorgon/ Jansz PNG Mackenzie Alaska Sakhalin-1 Hong Kong Upstream Natuna Power LNG Pipeline-Gas LNG Terminals Gas-To-Liquids Angola Nigeria U.K. Italy U.S. Gulf Coast |
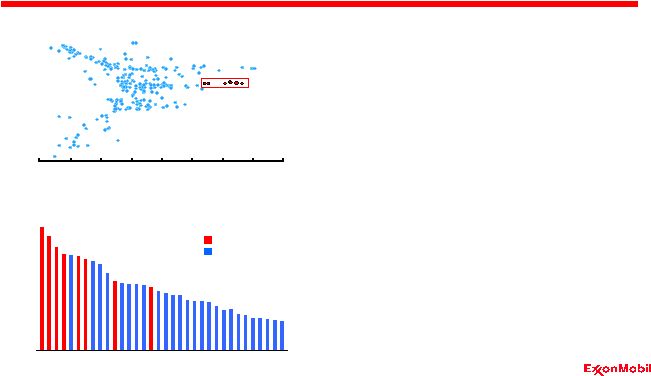
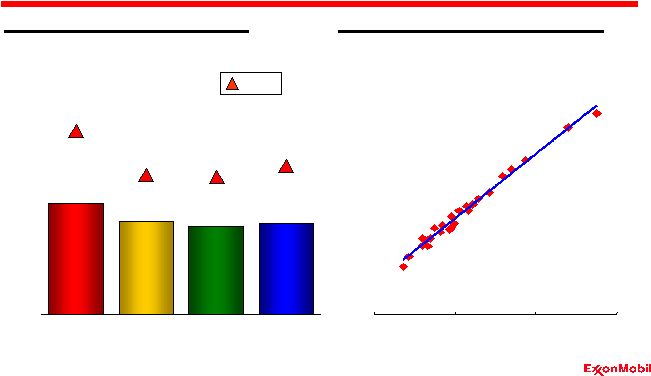 41 * Competitor data estimated using a consistent basis with ExxonMobil, and based on public information 2005 Industry-Leading Earnings per Barrel $/OEB 2001-2005 Earnings per Barrel* Upstream: Maximum Value from Production Assets Capturing Value Across the Cycle XOM Normalized Earnings per Barrel, prior 24 quarters Production-Weighted Marker Price ($) $/OEB 0 5 10 15 20 XOM RDS BP CVX R² = 0.991 0 5 10 15 20 10 30 50 70 |
 42 2001-2005 Non-Project Drilling* MOEBD-Net Improving Recovery with Quality Drilling Programs • 43 rigs operating • $2.2B investment • 160 KOEBD first-year production • Revisions/improved recovery reserve adds of 500 MOEB Upstream: Maximum Value from Production Assets * Cumulative production contribution from all non-project drill wells since January
1, 2001 2001-2005 Annual Average 0.0 0.5 1.0 '01 '02 '03 '04 '05 |
 43 Enhancing Recovery with Technology Industry EOR Projects Light Oil Heavy Oil XOM Participation XOM Participation • Systematic approach to EOR evaluation • Industry leader in EOR technology and experience • Proprietary next-generation reservoir simulator – EM Power Significant 2005 Production Under evaluation Other EOR experience Upstream: Maximum Value from Production Assets ExxonMobil EOR Experience |
 44 Capturing Value with Divestments • Approximately 2% of YE 2005 production/reserves sold • Lower profitability, limited potential assets • Capitalized on strong market - $4.6 B cash - $0.8 B earnings Total Expenses Field Life (R/P) Production Proved Reserves $/OEB Years 2001-2005 Asset Sales Average 2005 (KOEBD) Year-end 2005 (MOEB) Upstream: Maximum Value from Production Assets 0 5 10 15 20 0 5 10 15 20 Assets Divested 2001-2005 Remaining Assets |
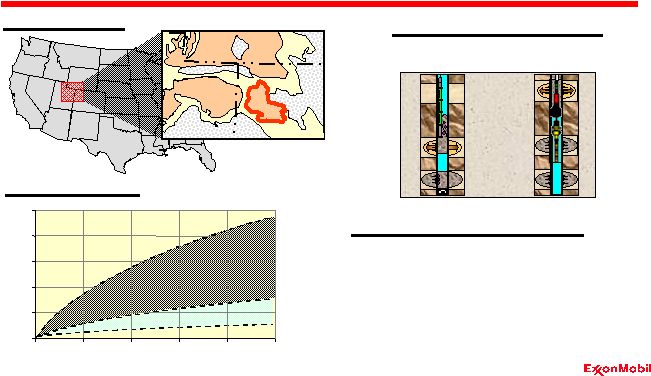 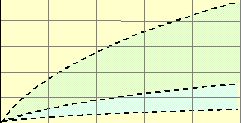    45 Unlocking Tight Gas Piceance Basin Upstream: Proprietary Technology XOM Technology Conventional Approach 1.0 0.8 0.6 0.4 0.2 0 • Over 1600 zones fractured - Currently at 45 zones/well • 55 mcfd initial field development • Technology licensed to major service providers Piceance Basin Development Just-in-Time Perforating Annular Coiled Tubing Fracturing Breakthrough Technology Colorado Uinta Basin Green River Basin Utah Wyoming Piceance Basin Well Productivity Cumulative Production (Bcf) 0 100 200 300 400 500 Producing Time (days) |
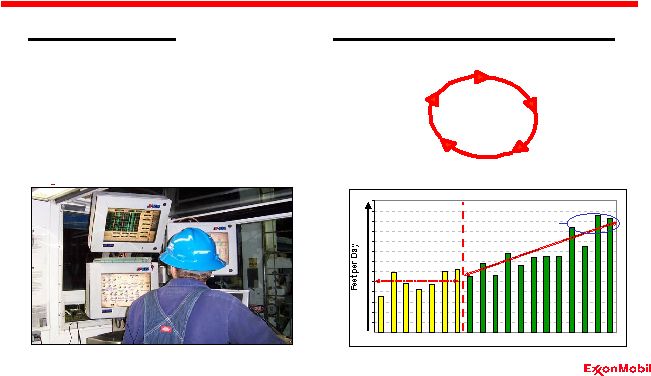   46 Drilling Wells Faster Before After 100% Performance Improvement Capture Learnings & Transfer Globally Analyze & Identify Limits Design to Overcome Limits Real-Time Energy Based Analysis Real-Time Redesign Fast Drill Workflow Analyze, Drill, Redesign, Repeat ... Analyze, Drill, Redesign, Repeat ... Upstream: Proprietary Technology • Real-time, rig-centered • Brings science closer to operations • Wells drilled up to 35% faster Fast Drill Process |
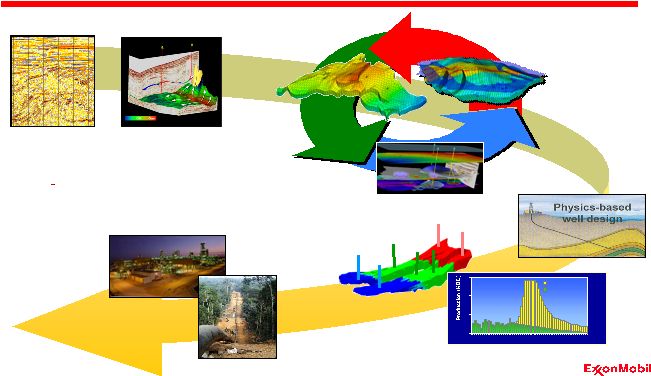 47 Integrating Best-In-Class Technologies Upstream: Proprietary Technology Basin modeling Seismic imaging & processing Commercializing the Resource Maximizing Ultimate Value Enhanced Recovery 0 50 100 150 1970 1980 1990 2000 2010 2020 2030 Developed Capacity History/Prediction Understanding the Subsurface Optimizing the Development Reservoir simulation Geologic modeling Visualization |
 48 0 1 2 3 4 5 '05 '06 '07 '08 '09 '10 Delivering Profitable Capacity Growth • Result of robust inventory and strong processes • Geographically diverse • Enabled by functional expertise, integrated and leveraged worldwide • Delivering on our strategies Upstream: Summary MOEBD Americas Europe Asia Pacific/ Middle East Africa |
 49 Industry-Leading Performance % 2001-2005 Return on Average Capital Employed* • Large, high-quality resource base • Attractive project portfolio • Superior project management • Maximum value from production assets • Proprietary technology 2005 Upstream: Summary * Competitor data estimated using a consistent basis with ExxonMobil, and based on public information 0 10 20 30 40 50 XOM RDS BP CVX |
 50 Downstream Overview Analyst Meeting March 8, 2006 |
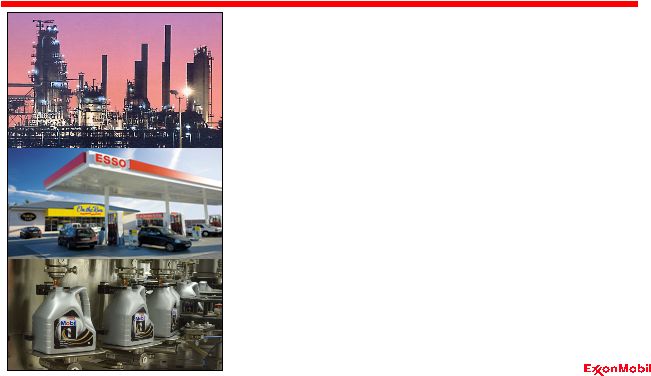 51 • Record financial performance - Earnings $8 B - ROCE 32 % - Refinery throughput 5.7 MBD - Petroleum product sales 8.3 MBD • Operational excellence continues - Safety and environmental - Reliability - Energy efficiency • Strategic initiatives delivering - More than $1B “self-help” each year 2005 Highlights Downstream Refining & Supply Lubes Marketing Fuels Marketing |
 52 Business Strategies • Maintain best-in-class operations, in all respects • Provide quality, valued products and services to customers • Lead industry in efficiency and effectiveness • Capitalize on integration with other ExxonMobil businesses • Selectively invest for resilient, advantaged returns • Maximize value from leading-edge technology Downstream |
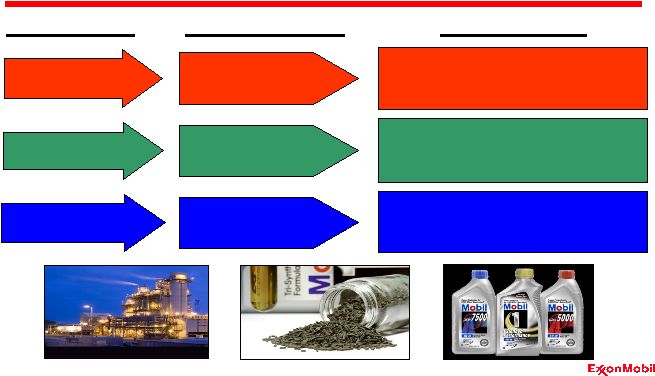
 53 Business Approach Downstream Operational Excellence Disciplined Investment Industry Leading Returns Superior Cash Flow Growth in Shareholder Value Asset Utilization Project Execution Raw Material Flexibility Structural Advantages Operating Efficiencies Global Scale & Integration Margin Enhancement Technology Leadership Industry-Leading Returns |
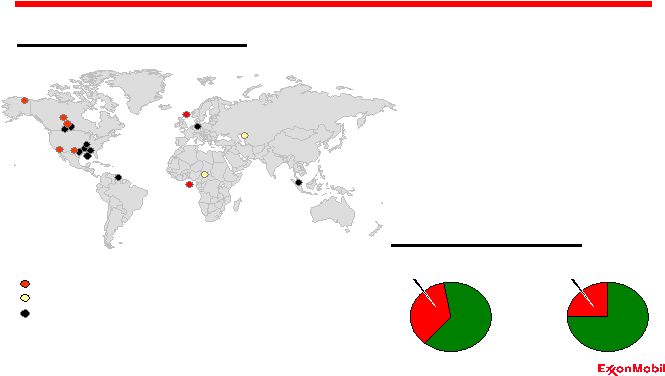
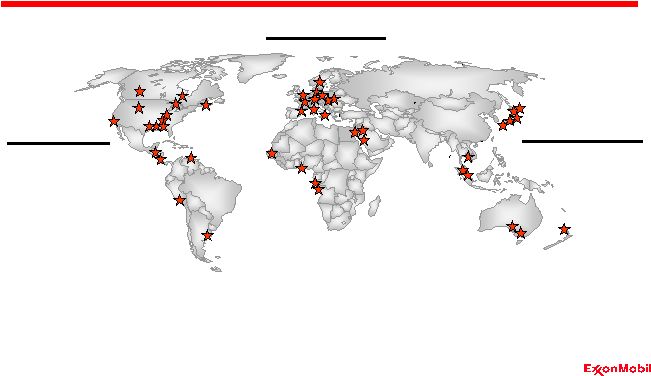 54 Americas 16 Refineries Europe/AME 18 Refineries Asia-Pacific 11 Refineries • Largest global refiner • Largest global supplier & marketer of petroleum products • Largest manufacturer & marketer of lube basestocks • Largest global producer of polyolefins, benzene & paraxylene Global Scale and Integration Downstream |
 55 0 2 4 6 Average Refinery Size % KBD Source: Equity capacity calculated on consistent basis using public information
Integration with Chemicals or Lubes Capacity and Geographic Mix MBD Refining Structural Advantages Downstream XOM BP RDS Industry XOM RDS BP Industry XOM RDS BP Americas EAME AP 100 150 200 250 50 60 70 80 |
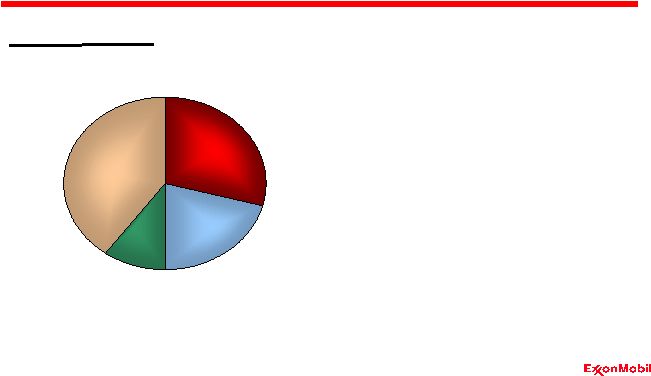 56 Fuels Marketing Structural Advantages Global Fuel Sales Downstream • Largest supplier & marketer of petroleum products • Leveraging integration with refining • Broad spectrum of customer channels • Product placement for highest value I&W Sales 20% Retail Sales 30% Aviation & Marine Sales 10% Refining & Supply Sales 40% KBD |
 57 Lubes Marketing Structural Advantages Market Share • Largest manufacturer and marketer of lube basestocks • Leveraging integration with refining • Strong OEM relationships • Technically advanced products % Downstream XOM RDS BP 0 5 10 15 20 Basestocks Finished Lubricants |
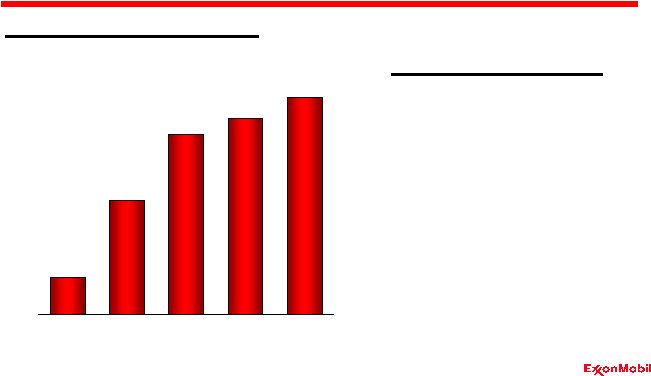
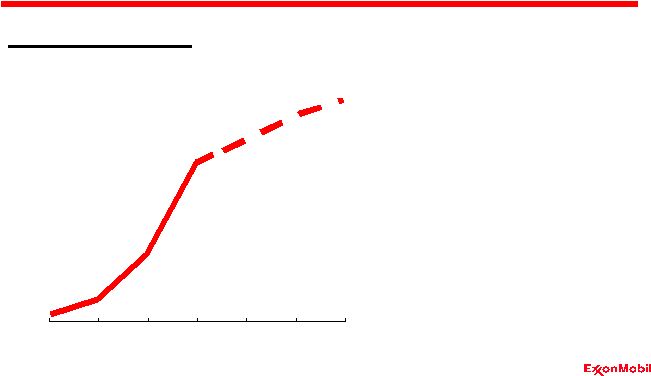
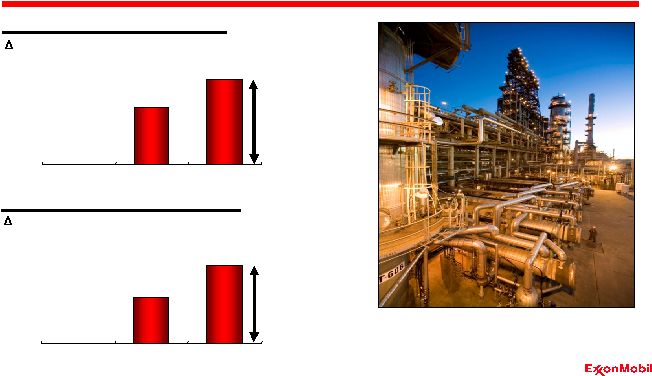 58 Conversion Capacity Growth Source: EM / O&GJ, 100% basis Distillation Capacity Growth ~50 KBD per year ~35 KBD per year “Equivalent to a new refinery every 3 years” KBD KBD Self-Help: Economic Refining Growth Downstream 0 100 200 300 400 '95 '00 '05 0 200 400 600 '95 '00 '05 |
 59 95 100 105 110 '00 '01 '02 '03 '04 '05 Raw Material Flexibility Crude Runs, Indexed Challenged Crudes Source: EM, Solomon Self-Help: Refining Margin Enhancement Downstream Crude API Gravity Higher Value Products XOM Industry Clean Product Yield, Indexed Crude Sulfur Lower Crude Costs Crude Quality, Indexed * 2005 Estimated – Solomon survey only prepared in even years 90 100 110 120 130 140 150 160 170 '00 '01 '02 '03 '04 '05 96 98 100 102 '00 '02 '04 '05* |
 60 0 250 500 750 '02 '03 '04 '05 '06 '07 '08 Self-Help: Refining Margin Enhancement Downstream Molecule Management $M/Year, Cumulative before-tax • Molecular fingerprinting • Process modeling • Process control and optimization • Scheduling & blending |
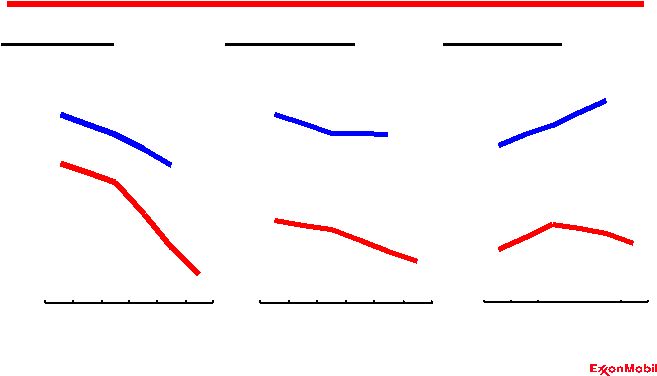 61 Energy Index Indexed Indexed Personnel Index Source: Solomon Industry Industry Self-Help: Refining Operating Efficiency Downstream Unit Cash Cost Industry Indexed * 2005 Estimated – Solomon survey only prepared in even years XOM XOM XOM * * * 92 94 96 98 100 102 104 '00 '02 '04 '05 80 90 100 110 120 130 '00 '02 '04 '05 95 100 105 110 115 '00 '02 '04 '05 |
 62 60 70 80 90 100 110 '00 '01 '02 '03 '04 '05 Capacity Utilization XOM Industry Throughput Unplanned Lost Capacity Reliability Indexed XOM Indexed Self-Help: Refining Asset Utilization Downstream Source: EM, Solomon * 2005 Estimated – Solomon survey only prepared in even years 94 96 98 100 102 '00 '02 '04 '05* |
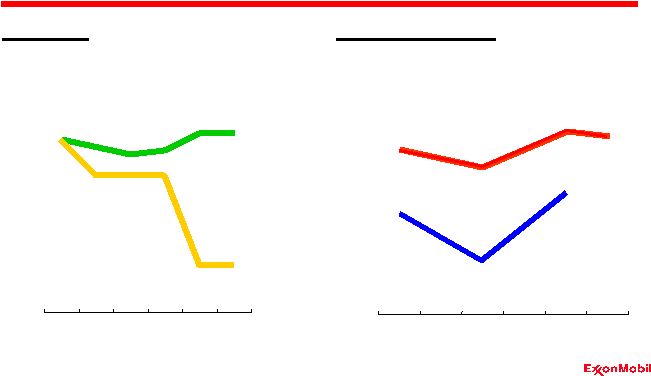
 63 70 80 90 100 110 '01 '02 '03 '04 '05 60 70 80 90 100 110 120 '01 '02 '03 '04 '05 Self-Help: Retail Marketing No. of Retail Sites Fuel Sales per Site $M*, Improvement Since 2000 Asset Utilization Nonfuels Income Growth Breakeven Fuels Margin Indexed Downstream U.S., Indexed * Before-tax 0 50 100 150 200 '01 '02 '03 '04 '05 |
 64 Self-Help: Lubes Marketing Downstream XOM Industry* Operating Efficiencies Flagship Products Indexed Indexed Growth Markets Indexed Workforce Blend Plants Order Centers Product Complexity XOM Industry* (Finished Lube Sales) * ExxonMobil estimate 0 50 100 '01 '02 '03 '04 '05 100 125 150 '01 '02 '03 '04 '05 100 125 150 '01 '02 '03 '04 '05 |
 65 Erosion Resistant Materials Advanced Catalysis Fouling Inhibition Technology Equipment Health Monitoring Flagship Lube Products – Mobil 1 Process Modeling & Optimization Tools Plant Automation Molecule Management Crude Contaminant Control Fiber Optic Corrosion Sensors Coke Morphology Slurry Decoking Throttling Valve Higher Value Products Improve Efficiency Higher Reliability Asset Utilization Higher Yields Upgrade Products Increase Margin Lower Crude Costs Capacity Utilization Molecular Optimization Raw Material Flexibility Lower Costs Focus Areas Strategic Objectives R&D Programs Technology Leadership Downstream |
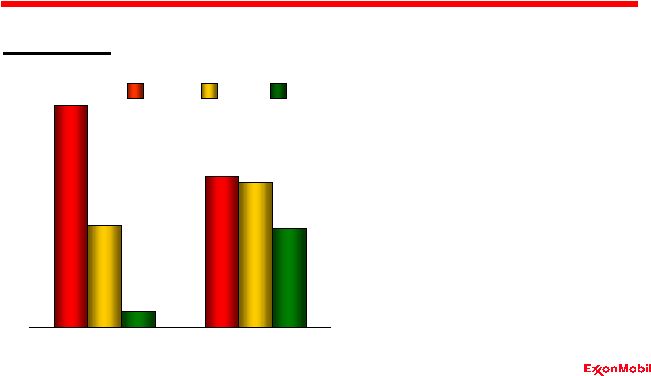
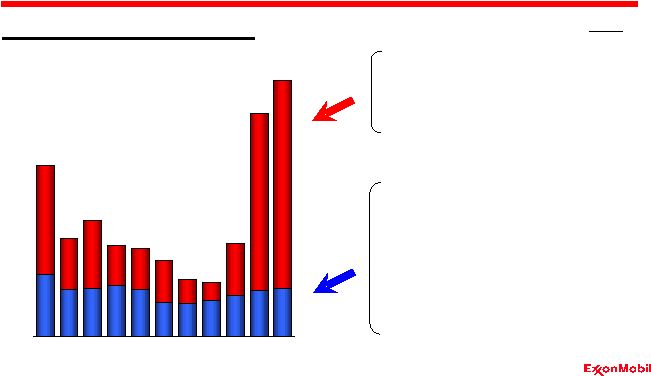
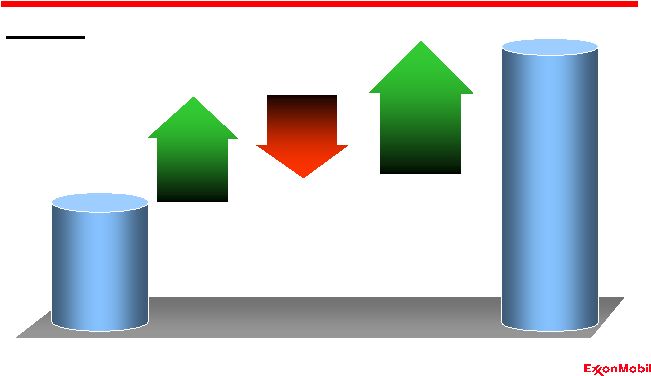 66 Self-Help 2000 2005 $8.0B $3.4B Industry Margins Earnings Inflation Forex Self-Help Drives Earnings Growth Downstream |
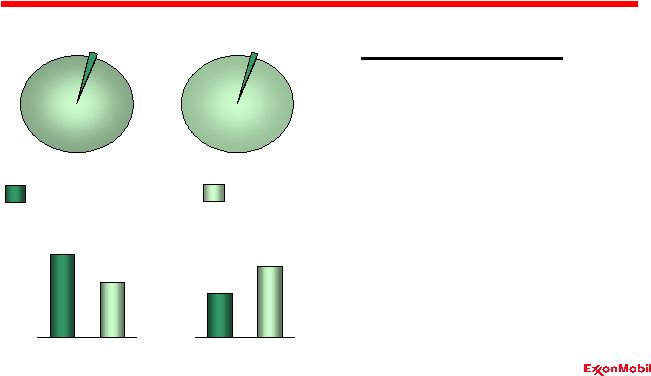
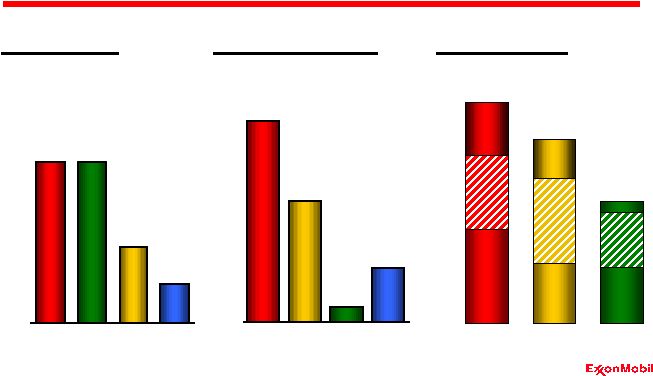
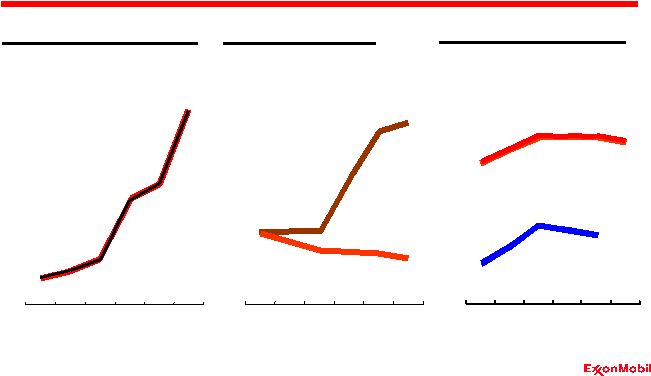
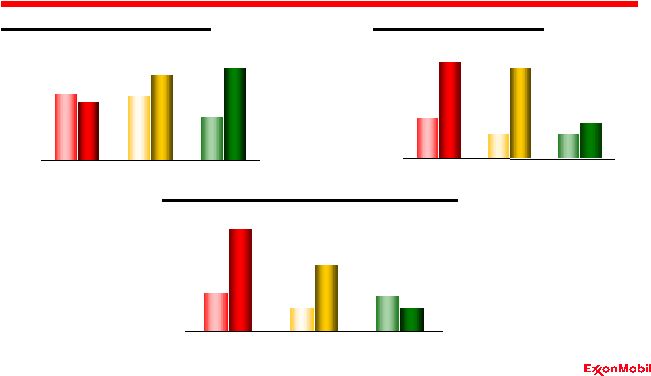 67 Industry-Leading Returns Downstream Average Capital Employed* $B XOM RDS BP ‘00 ‘05 ‘00 ‘05 ‘00 ‘05 Return on Average Capital Employed* % Reported Net Income $B ‘00 ‘05 ‘00 ‘05 ‘00‘05 *Competitor data estimated using a consistent basis with ExxonMobil, and based on public
information ‘00 ‘05 ‘00 ‘05 ‘00 ‘05 0 10 20 30 40 0 2 4 6 8 0 10 20 30 |
 68 Chemical Overview Analyst Meeting March 8, 2006 |
 69 2005 Highlights • Earnings of $3.9B, ROCE of 28% - Global scale and integration - Feedstock flexibility - Successful margin enhancement • Operational excellence continues - Safety - Reliability - Energy efficiency • Capex of $654M - High return efficiency projects - Low-cost expansions - Specialty business growth Chemical |
 70 Business Strategies Long-term strategy built on ExxonMobil’s core competencies • Unique portfolio of global integrated businesses • Integration across ExxonMobil operations • Focus on cost management, reliability and efficiencies • Disciplined investment in advantaged projects • Technology leadership |
 71 Business Approach Chemical Operational Excellence Disciplined Investment Industry Leading Returns Superior Cash Flow Growth in Shareholder Value Asset Utilization Advantaged Projects Advantaged Feedstocks Unique Business Portfolio Cost Management Global Scale & Integration Premium Products Technology Leadership Industry-Leading Returns |
 72 Unique Portfolio of Businesses Aromatics 1 Olefins 2 Polyethylene 2 Polypropylene 5
Specialty Businesses Commodity Businesses ExxonMobil Chemical Earnings Chemical $B Rank* *Based on worldwide market position Butyl 1 Fluids 1 Oxo 1 Synthetics 1 Films 1 Adhesion 1 Ethylene Elastomers 2 Additives 2 0.0 1.0 2.0 3.0 4.0 '95 '00 '05 |
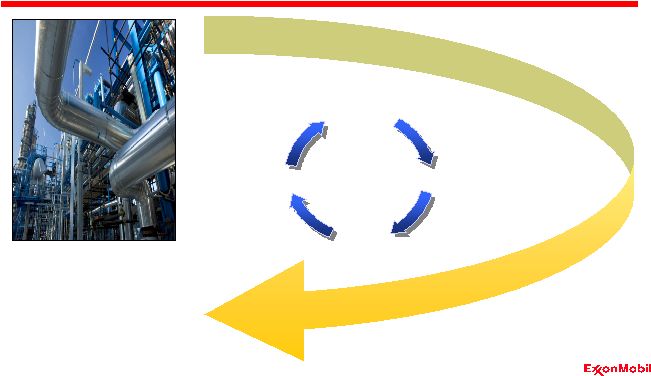
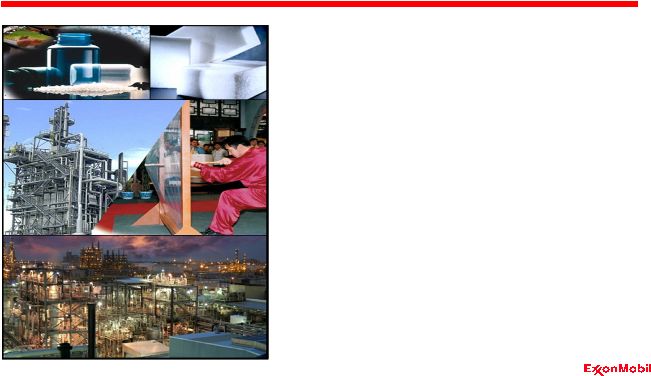
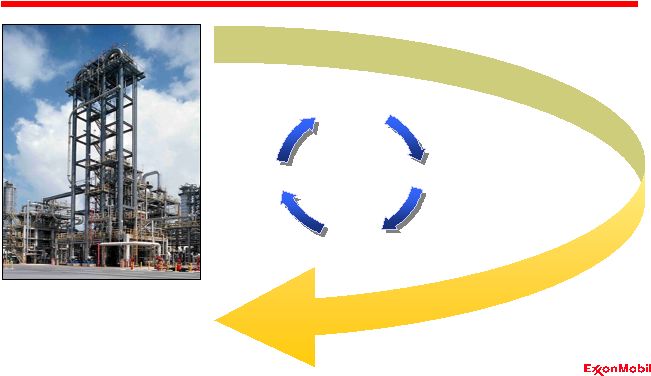
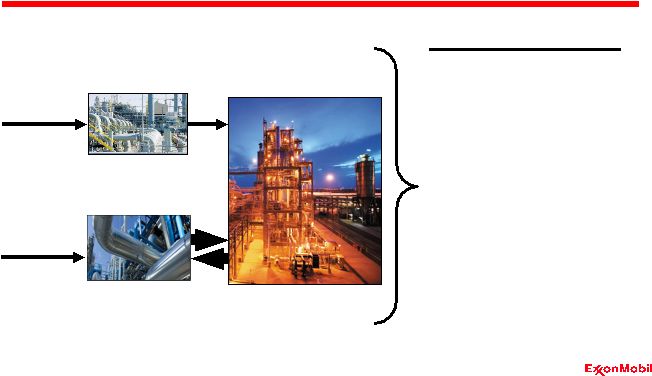 73 Long-Standing Integration Advantage Petrochemical Plant Crude Oil and Feedstocks Gas Processing Natural Gas Chemical Refinery Integration Benefits • Advantaged feed access • Molecule optimization • Energy integration • Coordinated planning • Shared site services • Common processes • Research & Technology |
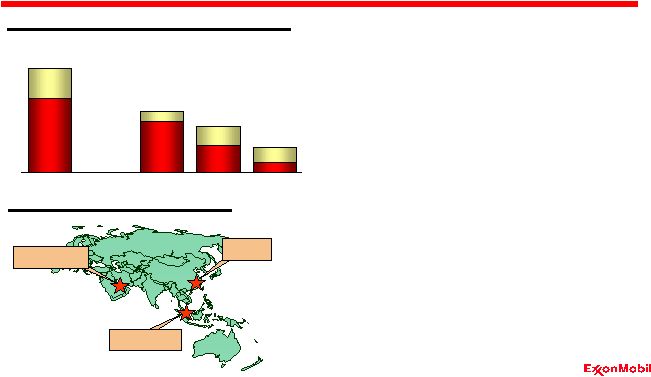 74 Positioned for Asia Pacific Growth • Existing advantaged asset base - Feedstock - Integration - Market access • Pursuing additional advantaged opportunities Chemical Major Project Opportunities Existing Announced XOM
BP RDS Dow Singapore Fujian Ras Laffan MT Asia Pacific/Middle East Capacities 0 2 4 6 8 |
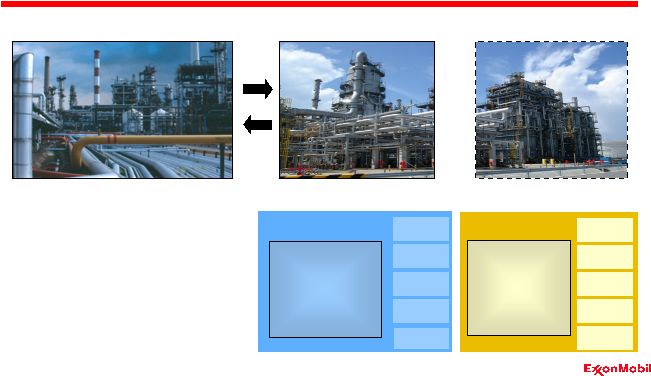 75 Singapore Expansion Project Refinery Chemical Singapore Steam Cracker PE PP Arom Oxo Fluids Singapore #2 Steam Cracker PE PP Arom Elast Chemical Plant Existing Plant Proposed Project Oxo |
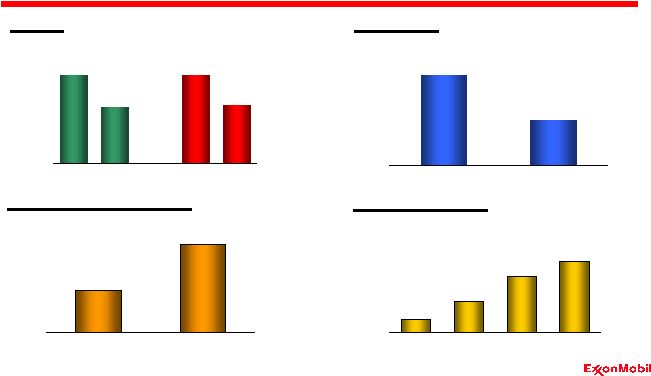 76 Improvement via Self-Help Energy Indexed Cumulative MT vs 2001 Reliability Gains Advantaged Feedstocks Workforce Chemical Indexed Steamcracking Other Operations Indexed 80 100 120 '02 '05 80 90 100 '02 '05 '02 '05 80 90 100 '02 '05 0.0 0.5 1.0 1.5 '02 '03 '04 '05 |
 77 Heavy Steam Cracker Feeds Gas-to-Olefins New Aromatics Feeds Synthetics Feed Flexibility Premium Products Zeolite Catalyst Extensions Butyl Mercury In-Reactor Compounds Unipol Fundamentals Step-Skipping Step-Out Economics Reduced Cost Specialties Growth Higher/Stable Returns Differentiation Refining Synergies Gas-to-Chemical Feed Flexibility Advantaged Feed Lower Cost Process Novel Elastomers & Adhesives Improved Stiffness / Toughness Balance Nanocomposite Materials Achieve™ Meltblown Focus Areas Strategic Objectives R&D Programs Technology Leadership Chemical |
 78 Delivering Superior Returns Average Capital Employed* Reported Net Income $B $B Return on Average Capital Employed* XOM RDS CVX Dow *Competitor data estimated using a consistent basis with ExxonMobil, and based on public
information % Chemical ‘00 ‘05 ‘00 ‘05 ‘00 ‘05 ‘00 ‘05 ‘00 ‘05 ‘00 ‘05 ‘00 ‘05 ‘00 ‘05 ‘00 ‘05 ‘00 ‘05 ‘00 ‘05 ‘00 ‘05 0 10 20 30 0 2 4 0 10 20 30 |
 79 Summary Analyst Meeting March 8, 2006 |
 80 Industry Environment • Growing demand for energy; nearly 50 percent increase by 2030 • Technology and investment critical to meeting future energy needs • Long-term capital intensive industry • Industry driven by long-term trends |
 81 Industry Challenges Play to our Strengths • Global functional organization, scale, and geographic diversity • Unmatched financial and technology strength • Industry-leading resource base and project portfolio • Integration of Downstream and Chemical • Superior business approach and execution |
 82 ExxonMobil Superior Business Approach • Staying the course • Building our advantages • Growing shareholder value Disciplined Investment Operational Excellence Industry Leading Returns Superior Cash Flow Growth in Shareholder Value |
 83 Additional Information Analyst Meeting March 8, 2006 |
 84 0 50 100 150 200 '90 '95 '00 '05 '10 70 75 80 85 90 Industry Environment The Industry Cycle* Margin Trends* * ExxonMobil Estimates Nominal $ PE PX MT % Polyethylene, Polypropylene, Paraxylene Rest of World Capacity Utilization Chemical Asia Pacific Demand 0 500 1000 '90 '95 '00 '05 |