EXHIBIT 99
Overview
CONTENTS
|
||
| 1-17 | ||
| 18-21 | ||
| 22-28 | ||
| 29 | ||
| 30-71 | ||
| 72-87 | ||
| 88-95 | ||
| 96-99 | ||
| 100 | ||
| Inside Back Cover |
| EXXON MOBIL CORPORATION • 2008 FINANCIAL & OPERATING REVIEW | 1 |


| FINANCIAL HIGHLIGHTS | 2008 | 2007 | 2006 | 2005 | 2004 | |||||||||||||||
(millions of dollars, unless noted) |
||||||||||||||||||||
Sales and other operating revenue(1)(2) |
459,579 | 390,328 | 365,467 | 358,955 | 291,252 | |||||||||||||||
Net income |
45,220 | 40,610 | 39,500 | 36,130 | 25,330 | |||||||||||||||
Cash flow from operations and asset sales(3) |
65,710 | 56,206 | 52,366 | 54,174 | 43,305 | |||||||||||||||
Capital and exploration expenditures(3) |
26,143 | 20,853 | 19,855 | 17,699 | 14,885 | |||||||||||||||
Cash dividends to ExxonMobil shareholders |
8,058 | 7,621 | 7,628 | 7,185 | 6,896 | |||||||||||||||
Common stock purchases (gross) |
35,734 | 31,822 | 29,558 | 18,221 | 9,951 | |||||||||||||||
Research and development costs |
847 | 814 | 733 | 712 | 649 | |||||||||||||||
Cash and cash equivalents at year end(4) |
31,437 | 33,981 | 28,244 | 28,671 | 18,531 | |||||||||||||||
Total assets at year end |
228,052 | 242,082 | 219,015 | 208,335 | 195,256 | |||||||||||||||
Total debt at year end |
9,425 | 9,566 | 8,347 | 7,991 | 8,293 | |||||||||||||||
Shareholders’ equity at year end |
112,965 | 121,762 | 113,844 | 111,186 | 101,756 | |||||||||||||||
Average capital employed(3) |
129,683 | 128,760 | 122,573 | 116,961 | 107,339 | |||||||||||||||
Share price at year end (dollars) |
79.83 | 93.69 | 76.63 | 56.17 | 51.26 | |||||||||||||||
Market valuation at year end |
397,239 | 504,220 | 438,990 | 344,491 | 328,128 | |||||||||||||||
Regular employees at year end (thousands) |
79.9 | 80.8 | 82.1 | 83.7 | 85.9 | |||||||||||||||
| KEY FINANCIAL RATIOS | 2008 | 2007 | 2006 | 2005 | 2004 | |||||||||||||||
Net income per common share (dollars) |
8.78 | 7.36 | 6.68 | 5.76 | 3.91 | |||||||||||||||
Net income per common share – assuming dilution (dollars) |
8.69 | 7.28 | 6.62 | 5.71 | 3.89 | |||||||||||||||
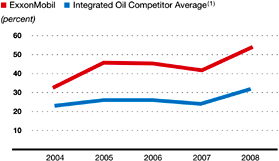
Return on average capital employed(3) (percent) |
34.2 | 31.8 | 32.2 | 31.3 | 23.8 | |||||||||||||||
Net income to average shareholders’ equity (percent) |
38.5 | 34.5 | 35.1 | 33.9 | 26.4 | |||||||||||||||
Debt to capital(5) (percent) |
7.4 | 7.1 | 6.6 | 6.5 | 7.3 | |||||||||||||||
Net debt to capital(6) (percent) |
(23.0) | (24.0) | (20.4) | (22.0) | (10.7) | |||||||||||||||
Ratio of current assets to current liabilities (times) |
1.47 | 1.47 | 1.55 | 1.58 | 1.40 | |||||||||||||||
Fixed charge coverage (times) |
52.2 | 49.9 | 46.3 | 50.2 | 36.1 | |||||||||||||||
| (1) | Sales and other operating revenue includes sales-based taxes of $34,508 million for 2008, $31,728 million for 2007, $30,381 million for 2006, $30,742 million for 2005, and $27,263 million for 2004. | |
| (2) | Sales and other operating revenue includes $30,810 million for 2005 and $25,289 million for 2004 for purchases/sales contracts with the same counterparty. Associated costs were included in Crude oil and product purchases. Effective January 1, 2006, these purchases/sales were recorded on a net basis with no resulting impact on net income. | |
| (3) | See Frequently Used Terms on pages 96 through 99. | |
| (4) | Excluding restricted cash of $4,604 million in 2006, 2005, and 2004. | |
| (5) | Debt includes short- and long-term debt. Capital includes short- and long-term debt, shareholders’ equity, and minority interests. | |
| (6) | Debt net of cash and cash equivalents, excluding restricted cash. |
| EXXON MOBIL CORPORATION • 2008 FINANCIAL & OPERATING REVIEW | 3 |
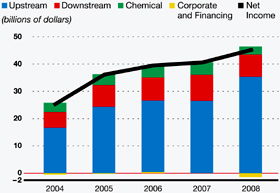
Superior 2008 Results |
|
| • | Workforce safety performance continues to lead industry. |
| • | Record earnings of $45.2 billion, with strong performance in each of our business functions. |
| • | Annual dividend per share growth of 13 percent versus 2007, the 26th
consecutive year of dividend per share increases. |
| • | Total shareholder distributions of $40.1 billion, an increase of $4.4 billion versus 2007. |
| • | Industry-leading return on average capital employed of 34 percent. |
| • | Start-up of eight major Upstream projects. |
| • | Total liquids production and natural gas production available for sale of 3.9 million oil-equivalent barrels per day. |
| • | Replaced 103 percent of production with proved oil and gas reserve additions of 1.5 billion oil-equivalent barrels, including asset sales and excluding year-end price/cost effects. |
4 |
EXXON MOBIL CORPORATION • 2008 FINANCIAL & OPERATING REVIEW |
| EXXON MOBIL CORPORATION • 2008 FINANCIAL & OPERATING REVIEW | 5 |

6 |
EXXON MOBIL CORPORATION • 2008 FINANCIAL & OPERATING REVIEW |
| 2008 | 2007 | 2006 | 2005 | 2004 | ||||||||||||||||
Net income per common share (dollars) |
8.78 | 7.36 | 6.68 | 5.76 | 3.91 | |||||||||||||||
Net income per common share – assuming dilution (dollars) |
8.69 | 7.28 | 6.62 | 5.71 | 3.89 | |||||||||||||||
Dividends per common share (dollars) |
||||||||||||||||||||
First quarter |
0.35 | 0.32 | 0.32 | 0.27 | 0.25 | |||||||||||||||
Second quarter |
0.40 | 0.35 | 0.32 | 0.29 | 0.27 | |||||||||||||||
Third quarter |
0.40 | 0.35 | 0.32 | 0.29 | 0.27 | |||||||||||||||
Fourth quarter |
0.40 | 0.35 | 0.32 | 0.29 | 0.27 | |||||||||||||||
Total |
1.55 | 1.37 | 1.28 | 1.14 | 1.06 | |||||||||||||||
Dividends per share growth (annual percent) |
13.1 | 7.0 | 12.3 | 7.5 | 8.2 | |||||||||||||||
Number of common shares outstanding (millions) |
||||||||||||||||||||
Average |
5,149 | 5,517 | 5,913 | 6,266 | 6,482 | |||||||||||||||
Average – assuming dilution |
5,203 | 5,577 | 5,970 | 6,322 | 6,519 | |||||||||||||||
Year end |
4,976 | 5,382 | 5,729 | 6,133 | 6,401 | |||||||||||||||
Cash dividends paid on common stock (millions of dollars) |
8,058 | 7,621 | 7,628 | 7,185 | 6,896 | |||||||||||||||
Cash dividends paid to net income (percent) |
18 | 19 | 19 | 20 | 27 | |||||||||||||||
Cash dividends paid to cash flow(1) (percent) |
13 | 15 | 15 | 15 | 17 | |||||||||||||||
Total return to shareholders (annual percent) |
(13.2 | ) | 24.3 | 39.2 | 11.7 | 27.9 | ||||||||||||||
Market quotations for common stock (dollars) |
||||||||||||||||||||
High |
96.12 | 95.27 | 79.00 | 65.96 | 52.05 | |||||||||||||||
Low |
56.51 | 69.02 | 56.42 | 49.25 | 39.91 | |||||||||||||||
Average daily close |
82.68 | 83.23 | 65.35 | 58.24 | 45.29 | |||||||||||||||
Year-end close |
79.83 | 93.69 | 76.63 | 56.17 | 51.26 | |||||||||||||||
| EXXON MOBIL CORPORATION • 2008 FINANCIAL & OPERATING REVIEW | 7 |
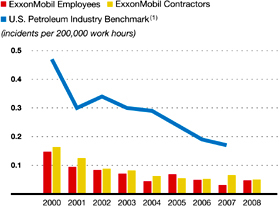
| • | Workforce safety performance continues to lead industry | |
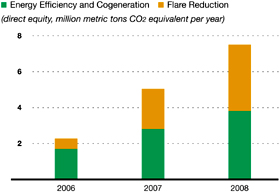
| • | Reduction in Upstream hydrocarbon flaring | |
| • | Over 60-percent reduction in total spills greater than one barrel from 2001 | |
| • | Zero spills from company-operated marine vessels | |
| • | Reduction in greenhouse gas emissions |
8 |
EXXON MOBIL CORPORATION • 2008 FINANCIAL & OPERATING REVIEW |
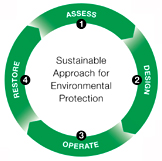
| • | Deliver superior environmental performance, which will lead to competitive advantage. | |
| • | Continually improve performance and drive incidents with environmental impact to zero. | |
| • | Achieve industry leadership in key environmental performance areas. |
| EXXON MOBIL CORPORATION • 2008 FINANCIAL & OPERATING REVIEW | 9 |
10 |
EXXON MOBIL CORPORATION • 2008 FINANCIAL & OPERATING REVIEW |
| 2008 Quarters | ||||||||||||||||||||||||||||||||||||
| (millions of dollars) | First | Second | Third | Fourth | 2008 | 2007 | 2006 | 2005 | 2004 | |||||||||||||||||||||||||||
Net Income (U.S. GAAP) |
||||||||||||||||||||||||||||||||||||
Upstream |
||||||||||||||||||||||||||||||||||||
United States |
1,631 | 2,034 | 1,879 | 699 | 6,243 | 4,870 | 5,168 | 6,200 | 4,948 | |||||||||||||||||||||||||||
Non-U.S. |
7,154 | 7,978 | 9,092 | 4,935 | 29,159 | 21,627 | 21,062 | 18,149 | 11,727 | |||||||||||||||||||||||||||
Total |
8,785 | 10,012 | 10,971 | 5,634 | 35,402 | 26,497 | 26,230 | 24,349 | 16,675 | |||||||||||||||||||||||||||
Downstream |
||||||||||||||||||||||||||||||||||||
United States |
398 | 293 | 978 | (20 | ) | 1,649 | 4,120 | 4,250 | 3,911 | 2,186 | ||||||||||||||||||||||||||
Non-U.S. |
768 | 1,265 | 2,035 | 2,434 | 6,502 | 5,453 | 4,204 | 4,081 | 3,520 | |||||||||||||||||||||||||||
Total |
1,166 | 1,558 | 3,013 | 2,414 | 8,151 | 9,573 | 8,454 | 7,992 | 5,706 | |||||||||||||||||||||||||||
Chemical |
||||||||||||||||||||||||||||||||||||
United States |
284 | 102 | 257 | 81 | 724 | 1,181 | 1,360 | 1,186 | 1,020 | |||||||||||||||||||||||||||
Non-U.S. |
744 | 585 | 830 | 74 | 2,233 | 3,382 | 3,022 | 2,757 | 2,408 | |||||||||||||||||||||||||||
Total |
1,028 | 687 | 1,087 | 155 | 2,957 | 4,563 | 4,382 | 3,943 | 3,428 | |||||||||||||||||||||||||||
Corporate and financing |
(89 | ) | (577 | ) | (241 | ) | (383 | ) | (1,290 | ) | (23 | ) | 434 | (154 | ) | (479 | ) | |||||||||||||||||||
Net income (U.S. GAAP) |
10,890 | 11,680 | 14,830 | 7,820 | 45,220 | 40,610 | 39,500 | 36,130 | 25,330 | |||||||||||||||||||||||||||
Net income per common share (dollars)(1) |
2.05 | 2.25 | 2.89 | 1.57 | 8.78 | 7.36 | 6.68 | 5.76 | 3.91 | |||||||||||||||||||||||||||
Net income per common share – assuming dilution (dollars)(1) |
2.03 | 2.22 | 2.86 | 1.55 | 8.69 | 7.28 | 6.62 | 5.71 | 3.89 | |||||||||||||||||||||||||||
Special Items |
||||||||||||||||||||||||||||||||||||
Upstream |
||||||||||||||||||||||||||||||||||||
United States |
— | — | — | — | — | — | — | — | — | |||||||||||||||||||||||||||
Non-U.S. |
— | — | 1,620 | — | 1,620 | — | — | 1,620 | — | |||||||||||||||||||||||||||
Total |
— | — | 1,620 | — | 1,620 | — | — | 1,620 | — | |||||||||||||||||||||||||||
Downstream |
||||||||||||||||||||||||||||||||||||
United States |
— | — | — | — | — | — | — | (200 | ) | (550 | ) | |||||||||||||||||||||||||
Non-U.S. |
— | — | — | — | — | — | — | 310 | — | |||||||||||||||||||||||||||
Total |
— | — | — | — | — | — | — | 110 | (550 | ) | ||||||||||||||||||||||||||
Chemical |
||||||||||||||||||||||||||||||||||||
United States |
— | — | — | — | — | — | — | — | — | |||||||||||||||||||||||||||
Non-U.S. |
— | — | — | — | — | — | — | 540 | — | |||||||||||||||||||||||||||
Total |
— | — | — | — | — | — | — | 540 | — | |||||||||||||||||||||||||||
Corporate and financing |
— | (290 | ) | (170 | ) | — | (460 | ) | — | 410 | — | — | ||||||||||||||||||||||||
Corporate total |
— | (290 | ) | 1,450 | — | 1,160 | — | 410 | 2,270 | (550 | ) | |||||||||||||||||||||||||
Earnings Excluding Special Items(2) |
||||||||||||||||||||||||||||||||||||
Upstream |
||||||||||||||||||||||||||||||||||||
United States |
1,631 | 2,034 | 1,879 | 699 | 6,243 | 4,870 | 5,168 | 6,200 | 4,948 | |||||||||||||||||||||||||||
Non-U.S. |
7,154 | 7,978 | 7,472 | 4,935 | 27,539 | 21,627 | 21,062 | 16,529 | 11,727 | |||||||||||||||||||||||||||
Total |
8,785 | 10,012 | 9,351 | 5,634 | 33,782 | 26,497 | 26,230 | 22,729 | 16,675 | |||||||||||||||||||||||||||
Downstream |
||||||||||||||||||||||||||||||||||||
United States |
398 | 293 | 978 | (20 | ) | 1,649 | 4,120 | 4,250 | 4,111 | 2,736 | ||||||||||||||||||||||||||
Non-U.S. |
768 | 1,265 | 2,035 | 2,434 | 6,502 | 5,453 | 4,204 | 3,771 | 3,520 | |||||||||||||||||||||||||||
Total |
1,166 | 1,558 | 3,013 | 2,414 | 8,151 | 9,573 | 8,454 | 7,882 | 6,256 | |||||||||||||||||||||||||||
Chemical |
||||||||||||||||||||||||||||||||||||
United States |
284 | 102 | 257 | 81 | 724 | 1,181 | 1,360 | 1,186 | 1,020 | |||||||||||||||||||||||||||
Non-U.S. |
744 | 585 | 830 | 74 | 2,233 | 3,382 | 3,022 | 2,217 | 2,408 | |||||||||||||||||||||||||||
Total |
1,028 | 687 | 1,087 | 155 | 2,957 | 4,563 | 4,382 | 3,403 | 3,428 | |||||||||||||||||||||||||||
Corporate and financing |
(89 | ) | (287 | ) | (71 | ) | (383 | ) | (830 | ) | (23 | ) | 24 | (154 | ) | (479 | ) | |||||||||||||||||||
Corporate total |
10,890 | 11,970 | 13,380 | 7,820 | 44,060 | 40,610 | 39,090 | 33,860 | 25,880 | |||||||||||||||||||||||||||
Earnings per common share (dollars)(1) |
2.05 | 2.30 | 2.62 | 1.57 | 8.56 | 7.36 | 6.61 | 5.40 | 3.99 | |||||||||||||||||||||||||||
Earnings per common share – assuming dilution (dollars)(1) |
2.03 | 2.27 | 2.59 | 1.55 | 8.47 | 7.28 | 6.55 | 5.35 | 3.97 | |||||||||||||||||||||||||||
| (1) | Computed using the average number of shares outstanding during each period. The sum of the four quarters may not add to the full year. | |
| (2) | See Frequently Used Terms on pages 96 through 99. |
| EXXON MOBIL CORPORATION • 2008 FINANCIAL & OPERATING REVIEW | 11 |
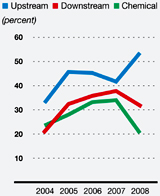
| (percent) | 2008 | 2007 | 2006 | 2005 | 2004 | |||||||||||||||
Upstream |
||||||||||||||||||||
United States |
42.6 | 34.7 | 37.1 | 46.0 | 37.0 | |||||||||||||||
Non-U.S. |
56.7 | 43.7 | 47.9 | 45.6 | 31.5 | |||||||||||||||
Total |
53.6 | 41.7 | 45.3 | 45.7 | 32.9 | |||||||||||||||
Downstream |
||||||||||||||||||||
United States |
23.7 | 65.1 | 65.8 | 58.8 | 28.6 | |||||||||||||||
Non-U.S. |
34.8 | 28.7 | 24.5 | 22.6 | 18.0 | |||||||||||||||
Total |
31.8 | 37.8 | 35.8 | 32.4 | 21.0 | |||||||||||||||
Chemical |
||||||||||||||||||||
United States |
16.0 | 24.9 | 27.7 | 23.1 | 19.4 | |||||||||||||||
Non-U.S. |
22.4 | 39.0 | 36.5 | 30.9 | 25.7 | |||||||||||||||
Total |
20.4 | 34.0 | 33.2 | 28.0 | 23.5 | |||||||||||||||
Corporate and financing |
NA | NA | NA | NA | NA | |||||||||||||||
Corporate total |
34.2 | 31.8 | 32.2 | 31.3 | 23.8 | |||||||||||||||
| (1) | Capital employed consists of shareholders’ equity and their share of consolidated debt, including ExxonMobil’s share of amounts applicable to equity companies. See Frequently Used Terms on pages 96 through 99. |
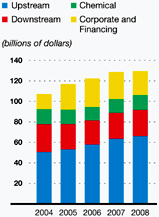
| (millions of dollars) | 2008 | 2007 | 2006 | 2005 | 2004 | |||||||||||||||
Upstream |
||||||||||||||||||||
United States |
14,651 | 14,026 | 13,940 | 13,491 | 13,355 | |||||||||||||||
Non-U.S. |
51,413 | 49,539 | 43,931 | 39,770 | 37,287 | |||||||||||||||
Total |
66,064 | 63,565 | 57,871 | 53,261 | 50,642 | |||||||||||||||
Downstream |
||||||||||||||||||||
United States |
6,963 | 6,331 | 6,456 | 6,650 | 7,632 | |||||||||||||||
Non-U.S. |
18,664 | 18,983 | 17,172 | 18,030 | 19,541 | |||||||||||||||
Total |
25,627 | 25,314 | 23,628 | 24,680 | 27,173 | |||||||||||||||
Chemical |
||||||||||||||||||||
United States |
4,535 | 4,748 | 4,911 | 5,145 | 5,246 | |||||||||||||||
Non-U.S. |
9,990 | 8,682 | 8,272 | 8,919 | 9,362 | |||||||||||||||
Total |
14,525 | 13,430 | 13,183 | 14,064 | 14,608 | |||||||||||||||
Corporate and financing |
23,467 | 26,451 | 27,891 | 24,956 | 14,916 | |||||||||||||||
Corporate total |
129,683 | 128,760 | 122,573 | 116,961 | 107,339 | |||||||||||||||
Average capital
employed applicable
to equity companies
included above |
25,651 | 24,267 | 22,106 | 20,256 | 18,049 | |||||||||||||||
| (1) | Average capital employed is the average of beginning- and end-of-year business segment capital employed, including ExxonMobil’s share of amounts applicable to equity companies. See Frequently Used Terms on pages 96 through 99. |
12 |
EXXON MOBIL CORPORATION • 2008 FINANCIAL & OPERATING REVIEW |
| (millions of dollars) | 2008 | 2007 | 2006 | 2005 | 2004 | |||||||||||||||
Upstream |
||||||||||||||||||||
Exploration |
||||||||||||||||||||
United States |
734 | 415 | 425 | 297 | 248 | |||||||||||||||
Non-U.S. |
2,137 | 1,494 | 1,619 | 1,396 | 1,035 | |||||||||||||||
Total |
2,871 | 1,909 | 2,044 | 1,693 | 1,283 | |||||||||||||||
Production(2) |
||||||||||||||||||||
United States |
2,600 | 1,792 | 2,058 | 1,841 | 1,669 | |||||||||||||||
Non-U.S. |
14,011 | 11,913 | 12,059 | 10,844 | 8,629 | |||||||||||||||
Total |
16,611 | 13,705 | 14,117 | 12,685 | 10,298 | |||||||||||||||
Power and Coal |
||||||||||||||||||||
United States |
— | 5 | 3 | 4 | 5 | |||||||||||||||
Non-U.S. |
252 | 105 | 67 | 88 | 129 | |||||||||||||||
Total |
252 | 110 | 70 | 92 | 134 | |||||||||||||||
Total Upstream |
19,734 | 15,724 | 16,231 | 14,470 | 11,715 | |||||||||||||||
Downstream |
||||||||||||||||||||
Refining |
||||||||||||||||||||
United States |
1,430 | 906 | 559 | 497 | 550 | |||||||||||||||
Non-U.S. |
1,248 | 1,267 | 1,051 | 871 | 774 | |||||||||||||||
Total |
2,678 | 2,173 | 1,610 | 1,368 | 1,324 | |||||||||||||||
Marketing |
||||||||||||||||||||
United States |
176 | 201 | 233 | 217 | 201 | |||||||||||||||
Non-U.S. |
638 | 876 | 852 | 859 | 811 | |||||||||||||||
Total |
814 | 1,077 | 1,085 | 1,076 | 1,012 | |||||||||||||||
Pipeline/Marine |
||||||||||||||||||||
United States |
30 | 21 | 32 | 39 | 24 | |||||||||||||||
Non-U.S. |
7 | 32 | 2 | 12 | 45 | |||||||||||||||
Total |
37 | 53 | 34 | 51 | 69 | |||||||||||||||
Total Downstream |
3,529 | 3,303 | 2,729 | 2,495 | 2,405 | |||||||||||||||
Chemical |
||||||||||||||||||||
United States |
441 | 360 | 280 | 243 | 262 | |||||||||||||||
Non-U.S. |
2,378 | 1,422 | 476 | 411 | 428 | |||||||||||||||
Total Chemical |
2,819 | 1,782 | 756 | 654 | 690 | |||||||||||||||
Other |
||||||||||||||||||||
United States |
61 | 44 | 130 | 80 | 66 | |||||||||||||||
Non-U.S. |
— | — | 9 | — | 9 | |||||||||||||||
Total other |
61 | 44 | 139 | 80 | 75 | |||||||||||||||
Total capital and exploration expenditures |
26,143 | 20,853 | 19,855 | 17,699 | 14,885 | |||||||||||||||
| (1) | See Frequently Used Terms on pages 96 through 99. | |
| (2) | Including related transportation. |
| EXXON MOBIL CORPORATION • 2008 FINANCIAL & OPERATING REVIEW | 13 |
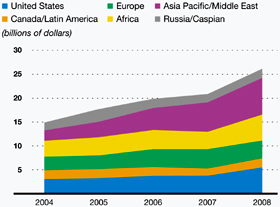
| (millions of dollars) | 2008 | 2007 | 2006 | 2005 | 2004 | |||||||||||||||
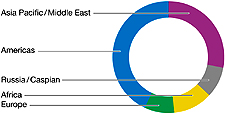
United States |
5,472 | 3,744 | 3,720 | 3,218 | 3,025 | |||||||||||||||
Canada/Latin America |
1,926 | 1,522 | 1,862 | 1,940 | 1,867 | |||||||||||||||
Europe |
3,727 | 4,042 | 3,721 | 2,829 | 2,845 | |||||||||||||||
Africa |
5,422 | 3,639 | 4,019 | 3,815 | 3,330 | |||||||||||||||
Asia Pacific/Middle East |
7,669 | 6,156 | 4,601 | 3,241 | 2,168 | |||||||||||||||
Russia/Caspian |
1,927 | 1,750 | 1,932 | 2,656 | 1,650 | |||||||||||||||
Total worldwide |
26,143 | 20,853 | 19,855 | 17,699 | 14,885 | |||||||||||||||
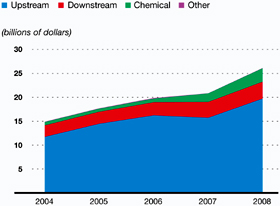
| (millions of dollars) | 2008 | 2007 | 2006 | 2005 | 2004 | |||||||||||||||
Consolidated Companies’ Expenditures |
||||||||||||||||||||
Capital expenditures |
19,841 | 15,242 | 15,361 | 13,792 | 11,901 | |||||||||||||||
Exploration costs charged to expense |
||||||||||||||||||||
United States |
189 | 280 | 243 | 157 | 192 | |||||||||||||||
Non-U.S. |
1,252 | 1,177 | 925 | 795 | 891 | |||||||||||||||
Depreciation on support equipment(1) |
10 | 12 | 13 | 12 | 15 | |||||||||||||||
Total exploration expenses |
1,451 | 1,469 | 1,181 | 964 | 1,098 | |||||||||||||||
Total consolidated companies’ capital
and exploration expenditures |
||||||||||||||||||||
(excluding Depreciation on support equipment) |
21,282 | 16,699 | 16,529 | 14,744 | 12,984 | |||||||||||||||
ExxonMobil’s Share of Non-Consolidated
Companies’ Expenditures |
||||||||||||||||||||
Capital expenditures |
4,845 | 4,122 | 3,315 | 2,938 | 1,865 | |||||||||||||||
Exploration costs charged to expense |
16 | 32 | 11 | 17 | 36 | |||||||||||||||
Total non-consolidated companies’ capital
and exploration expenditures |
4,861 | 4,154 | 3,326 | 2,955 | 1,901 | |||||||||||||||
Total capital and exploration expenditures |
26,143 | 20,853 | 19,855 | 17,699 | 14,885 | |||||||||||||||
| (1) | Not included as part of total capital and exploration expenditures, but included as part of exploration expenses, including dry holes, in the Summary Statement of Income, page 16. |
Functional
Capex Distribution
|
Geographic Capex Distribution | |
|
 |
14 |
EXXON MOBIL CORPORATION • 2008 FINANCIAL & OPERATING REVIEW |
| (millions of dollars) | 2008 | 2007 | 2006 | 2005 | 2004 | |||||||||||||||
Upstream |
||||||||||||||||||||
United States |
17,920 | 16,714 | 16,467 | 16,222 | 16,410 | |||||||||||||||
Non-U.S. |
55,493 | 56,810 | 51,943 | 46,595 | 45,603 | |||||||||||||||
Total |
73,413 | 73,524 | 68,410 | 62,817 | 62,013 | |||||||||||||||
Downstream |
||||||||||||||||||||
United States |
10,492 | 9,705 | 9,320 | 9,334 | 9,408 | |||||||||||||||
Non-U.S. |
18,762 | 20,443 | 19,598 | 18,695 | 20,402 | |||||||||||||||
Total |
29,254 | 30,148 | 28,918 | 28,029 | 29,810 | |||||||||||||||
Chemical |
||||||||||||||||||||
United States |
4,396 | 4,448 | 4,553 | 4,685 | 4,887 | |||||||||||||||
Non-U.S. |
7,034 | 5,623 | 4,766 | 4,619 | 5,162 | |||||||||||||||
Total |
11,430 | 10,071 | 9,319 | 9,304 | 10,049 | |||||||||||||||
Other |
7,249 | 7,126 | 7,040 | 6,860 | 6,767 | |||||||||||||||
Total net investment |
121,346 | 120,869 | 113,687 | 107,010 | 108,639 | |||||||||||||||
| (millions of dollars) | 2008 | 2007 | 2006 | 2005 | 2004 | |||||||||||||||
Upstream |
||||||||||||||||||||
United States |
1,391 | 1,469 | 1,263 | 1,293 | 1,453 | |||||||||||||||
Non-U.S. |
7,266 | 7,126 | 6,482 | 5,407 | 4,758 | |||||||||||||||
Total |
8,657 | 8,595 | 7,745 | 6,700 | 6,211 | |||||||||||||||
Downstream |
||||||||||||||||||||
United States |
656 | 639 | 632 | 615 | 618 | |||||||||||||||
Non-U.S. |
1,672 | 1,662 | 1,605 | 1,611 | 1,646 | |||||||||||||||
Total |
2,328 | 2,301 | 2,237 | 2,226 | 2,264 | |||||||||||||||
Chemical |
||||||||||||||||||||
United States |
410 | 405 | 427 | 416 | 408 | |||||||||||||||
Non-U.S. |
422 | 418 | 473 | 410 | 400 | |||||||||||||||
Total |
832 | 823 | 900 | 826 | 808 | |||||||||||||||
Other |
562 | 531 | 534 | 501 | 484 | |||||||||||||||
Total depreciation and depletion expenses |
12,379 | 12,250 | 11,416 | 10,253 | 9,767 | |||||||||||||||
| (millions of dollars) | 2008 | 2007 | 2006 | 2005 | 2004 | |||||||||||||||
Production and manufacturing expenses |
37,905 | 31,885 | 29,528 | 26,819 | 23,225 | |||||||||||||||
Selling, general, and administrative |
15,873 | 14,890 | 14,273 | 14,402 | 13,849 | |||||||||||||||
Depreciation and depletion |
12,379 | 12,250 | 11,416 | 10,253 | 9,767 | |||||||||||||||
Exploration |
1,451 | 1,469 | 1,181 | 964 | 1,098 | |||||||||||||||
Subtotal |
67,608 | 60,494 | 56,398 | 52,438 | 47,939 | |||||||||||||||
ExxonMobil’s share of equity company expenses |
7,204 | 5,619 | 4,947 | 4,520 | 4,209 | |||||||||||||||
Total operating costs |
74,812 | 66,113 | 61,345 | 56,958 | 52,148 | |||||||||||||||
| (1) | See Frequently Used Terms on pages 96 through 99. |
| EXXON MOBIL CORPORATION • 2008 FINANCIAL & OPERATING REVIEW | 15 |
| (millions of dollars) | 2008 | 2007 | 2006 | 2005 | 2004 | |||||||||||||||
Assets |
||||||||||||||||||||
Current assets |
||||||||||||||||||||
Cash and cash equivalents |
31,437 | 33,981 | 28,244 | 28,671 | 18,531 | |||||||||||||||
Cash and cash equivalents – restricted |
— | — | 4,604 | 4,604 | 4,604 | |||||||||||||||
Marketable securities |
570 | 519 | — | — | — | |||||||||||||||
Notes and accounts receivable,
less estimated doubtful amounts |
24,702 | 36,450 | 28,942 | 27,484 | 25,359 | |||||||||||||||
Inventories |
||||||||||||||||||||
Crude oil, products and merchandise |
9,331 | 8,863 | 8,979 | 7,852 | 8,136 | |||||||||||||||
Materials and supplies |
2,315 | 2,226 | 1,735 | 1,469 | 1,351 | |||||||||||||||
Other current assets |
3,911 | 3,924 | 3,273 | 3,262 | 2,396 | |||||||||||||||
Total current assets |
72,266 | 85,963 | 75,777 | 73,342 | 60,377 | |||||||||||||||
Investments, advances, and long-term receivables |
28,556 | 28,194 | 23,237 | 20,592 | 18,404 | |||||||||||||||
Property, plant and equipment, at cost,
less accumulated depreciation and depletion |
121,346 | 120,869 | 113,687 | 107,010 | 108,639 | |||||||||||||||
Other assets, including intangibles, net |
5,884 | 7,056 | 6,314 | 7,391 | 7,836 | |||||||||||||||
Total assets |
228,052 | 242,082 | 219,015 | 208,335 | 195,256 | |||||||||||||||
Liabilities |
||||||||||||||||||||
Current liabilities |
||||||||||||||||||||
Notes and loans payable |
2,400 | 2,383 | 1,702 | 1,771 | 3,280 | |||||||||||||||
Accounts payable and accrued liabilities |
36,643 | 45,275 | 39,082 | 36,120 | 31,763 | |||||||||||||||
Income taxes payable |
10,057 | 10,654 | 8,033 | 8,416 | 7,938 | |||||||||||||||
Total current liabilities |
49,100 | 58,312 | 48,817 | 46,307 | 42,981 | |||||||||||||||
Long-term debt |
7,025 | 7,183 | 6,645 | 6,220 | 5,013 | |||||||||||||||
Postretirement benefits reserves |
20,729 | 13,278 | 13,931 | 10,220 | 10,850 | |||||||||||||||
Deferred income tax liabilities |
19,726 | 22,899 | 20,851 | 20,878 | 21,092 | |||||||||||||||
Other long-term obligations |
13,949 | 14,366 | 11,123 | 9,997 | 9,612 | |||||||||||||||
Equity of minority interests |
4,558 | 4,282 | 3,804 | 3,527 | 3,952 | |||||||||||||||
Total liabilities |
115,087 | 120,320 | 105,171 | 97,149 | 93,500 | |||||||||||||||
Commitments and contingencies(1) |
||||||||||||||||||||
Shareholders’ Equity |
||||||||||||||||||||
Common stock without par value |
5,314 | 4,933 | 4,786 | 4,477 | 4,053 | |||||||||||||||
Earnings reinvested |
265,680 | 228,518 | 195,207 | 163,335 | 134,390 | |||||||||||||||
Accumulated other comprehensive income |
||||||||||||||||||||
Cumulative foreign exchange translation adjustment |
1,146 | 7,972 | 3,733 | 979 | 3,598 | |||||||||||||||
Postretirement benefits reserves adjustment |
(11,077 | ) | (5,983 | ) | (6,495 | ) | — | — | ||||||||||||
Minimum pension liability adjustment |
— | — | — | (2,258 | ) | (2,499 | ) | |||||||||||||
Unrealized gains/(losses) on stock investments |
— | — | — | — | 428 | |||||||||||||||
Common stock held in treasury |
(148,098 | ) | (113,678 | ) | (83,387 | ) | (55,347 | ) | (38,214 | ) | ||||||||||
Total shareholders’ equity |
112,965 | 121,762 | 113,844 | 111,186 | 101,756 | |||||||||||||||
Total liabilities and shareholders’ equity |
228,052 | 242,082 | 219,015 | 208,335 | 195,256 | |||||||||||||||
| (1) | For more information, please refer to Appendix A, Note 15 of ExxonMobil’s 2009 Proxy Statement. | |
| The information in the Summary Statement of Income (for 2006 to 2008), the Summary Balance Sheet (for 2007 and 2008), and the Summary Statement of Cash Flows (for 2006 to 2008), shown on pages 15 through 17, corresponds to the information in the Consolidated Statement of Income, Consolidated Balance Sheet, and the Consolidated Statement of Cash Flows in the financial statements of ExxonMobil’s 2009 Proxy Statement. For complete consolidated financial statements, including notes, please refer to Appendix A of ExxonMobil’s 2009 Proxy Statement. See also Management’s Discussion and Analysis of Financial Condition and Results of Operations and other information in Appendix A of the 2009 Proxy Statement. | ||
16 |
EXXON MOBIL CORPORATION • 2008 FINANCIAL & OPERATING REVIEW |
| (millions of dollars) | 2008 | 2007 | 2006 | 2005 | 2004 | |||||||||||||||
Revenues and Other Income |
||||||||||||||||||||
Sales and other operating revenue(1)(2) |
459,579 | 390,328 | 365,467 | 358,955 | 291,252 | |||||||||||||||
Income from equity affiliates |
11,081 | 8,901 | 6,985 | 7,583 | 4,961 | |||||||||||||||
Other income(3) |
6,699 | 5,323 | 5,183 | 4,142 | 1,822 | |||||||||||||||
Total revenues and other income |
477,359 | 404,552 | 377,635 | 370,680 | 298,035 | |||||||||||||||
Costs and Other Deductions |
||||||||||||||||||||
Crude oil and product purchases |
249,454 | 199,498 | 182,546 | 185,219 | 139,224 | |||||||||||||||
Production and manufacturing expenses |
37,905 | 31,885 | 29,528 | 26,819 | 23,225 | |||||||||||||||
Selling, general and administrative expenses |
15,873 | 14,890 | 14,273 | 14,402 | 13,849 | |||||||||||||||
Depreciation and depletion |
12,379 | 12,250 | 11,416 | 10,253 | 9,767 | |||||||||||||||
Exploration expenses, including dry holes |
1,451 | 1,469 | 1,181 | 964 | 1,098 | |||||||||||||||
Interest expense |
673 | 400 | 654 | 496 | 638 | |||||||||||||||
Sales-based taxes(1) |
34,508 | 31,728 | 30,381 | 30,742 | 27,263 | |||||||||||||||
Other taxes and duties |
41,719 | 40,953 | 39,203 | 41,554 | 40,954 | |||||||||||||||
Income applicable to minority interests |
1,647 | 1,005 | 1,051 | 799 | 776 | |||||||||||||||
Total costs and other deductions |
395,609 | 334,078 | 310,233 | 311,248 | 256,794 | |||||||||||||||
Income before income taxes |
81,750 | 70,474 | 67,402 | 59,432 | 41,241 | |||||||||||||||
Income taxes |
36,530 | 29,864 | 27,902 | 23,302 | 15,911 | |||||||||||||||
Net income |
45,220 | 40,610 | 39,500 | 36,130 | 25,330 | |||||||||||||||
Net Income per Common Share (dollars) |
8.78 | 7.36 | 6.68 | 5.76 | 3.91 | |||||||||||||||
Net Income per Common Share –
Assuming Dilution (dollars) |
8.69 | 7.28 | 6.62 | 5.71 | 3.89 | |||||||||||||||
| (1) | Sales and other operating revenue includes sales-based taxes of $34,508 million for 2008, $31,728 million for 2007, $30,381 million for 2006, $30,742 million for 2005, and $27,263 million for 2004. | |
| (2) | Sales and other operating revenue includes $30,810 million for 2005 and $25,289 million for 2004 for purchases/sales contracts with the same counterparty. Associated costs were included in Crude oil and product purchases. Effective January 1, 2006, these purchases/sales were recorded on a net basis with no resulting impact on net income. | |
| (3) | Other income for 2008 includes a $62 million gain from the sale of a non-U.S. investment and a related $143 million foreign exchange loss. | |
| The information in the Summary Statement of Income (for 2006 to 2008), the Summary Balance Sheet (for 2007 and 2008), and the Summary Statement of Cash Flows (for 2006 to 2008), shown on pages 15 through 17, corresponds to the information in the Consolidated Statement of Income, Consolidated Balance Sheet, and the Consolidated Statement of Cash Flows in the financial statements of ExxonMobil’s 2009 Proxy Statement. For complete consolidated financial statements, including notes, please refer to Appendix A of ExxonMobil’s 2009 Proxy Statement. See also Management’s Discussion and Analysis of Financial Condition and Results of Operations and other information in Appendix A of the 2009 Proxy Statement. | ||
| EXXON MOBIL CORPORATION • 2008 FINANCIAL & OPERATING REVIEW | 17 |
| (millions of dollars) | 2008 | 2007 | 2006 | 2005 | 2004 | |||||||||||||||
Cash Flows from Operating Activities |
||||||||||||||||||||
Net income |
||||||||||||||||||||
Accruing to ExxonMobil shareholders |
45,220 | 40,610 | 39,500 | 36,130 | 25,330 | |||||||||||||||
Accruing to minority interests |
1,647 | 1,005 | 1,051 | 799 | 776 | |||||||||||||||
Adjustments for noncash transactions |
||||||||||||||||||||
Depreciation and depletion |
12,379 | 12,250 | 11,416 | 10,253 | 9,767 | |||||||||||||||
Deferred income tax charges/(credits) |
1,399 | 124 | 1,717 | (429 | ) | (1,134 | ) | |||||||||||||
Postretirement benefits expense in excess of/
(less than) payments |
57 | (1,314 | ) | (1,787 | ) | 254 | 886 | |||||||||||||
Other long-term obligation provisions
in excess of/(less than) payments |
(63 | ) | 1,065 | (666 | ) | 398 | 806 | |||||||||||||
Dividends received greater than/(less than)
equity in current earnings of equity companies |
921 | (714 | ) | (579 | ) | (734 | ) | (1,643 | ) | |||||||||||
Changes in operational working capital, excluding cash and debt
Reduction/(increase) – Notes and accounts receivable |
8,641 | (5,441 | ) | (181 | ) | (3,700 | ) | (472 | ) | |||||||||||
– Inventories |
(1,285 | ) | 72 | (1,057 | ) | (434 | ) | (223 | ) | |||||||||||
– Other current assets |
(509 | ) | 280 | (385 | ) | (7 | ) | 11 | ||||||||||||
Increase/(reduction)
– Accounts and other payables |
(5,415 | ) | 6,228 | 1,160 | 7,806 | 6,333 | ||||||||||||||
Net (gain) on asset sales |
(3,757 | ) | (2,217 | ) | (1,531 | ) | (1,980 | ) | (268 | ) | ||||||||||
All other items – net |
490 | 54 | 628 | (218 | ) | 382 | ||||||||||||||
Net cash provided by operating activities |
59,725 | 52,002 | 49,286 | 48,138 | 40,551 | |||||||||||||||
Cash Flows from Investing Activities |
||||||||||||||||||||
Additions to property, plant and equipment |
(19,318 | ) | (15,387 | ) | (15,462 | ) | (13,839 | ) | (11,986 | ) | ||||||||||
Sales of subsidiaries, investments, and property,
plant and equipment |
5,985 | 4,204 | 3,080 | 6,036 | 2,754 | |||||||||||||||
Decrease/(increase) in restricted cash and cash equivalents |
— | 4,604 | — | — | (4,604 | ) | ||||||||||||||
Additional investments and advances |
(2,495 | ) | (3,038 | ) | (2,604 | ) | (2,810 | ) | (2,287 | ) | ||||||||||
Collection of advances |
574 | 391 | 756 | 343 | 1,213 | |||||||||||||||
Additions to marketable securities |
(2,113 | ) | (646 | ) | — | — | — | |||||||||||||
Sales of marketable securities |
1,868 | 144 | — | — | — | |||||||||||||||
Net cash used in investing activities |
(15,499 | ) | (9,728 | ) | (14,230 | ) | (10,270 | ) | (14,910 | ) | ||||||||||
Cash Flows from Financing Activities |
||||||||||||||||||||
Additions to long-term debt |
79 | 592 | 318 | 195 | 470 | |||||||||||||||
Reductions in long-term debt |
(192 | ) | (209 | ) | (33 | ) | (81 | ) | (562 | ) | ||||||||||
Additions to short-term debt |
1,067 | 1,211 | 334 | 377 | 450 | |||||||||||||||
Reductions in short-term debt |
(1,624 | ) | (809 | ) | (451 | ) | (687 | ) | (2,243 | ) | ||||||||||
Additions/(reductions) in debt with three months
or less maturity |
143 | (187 | ) | (95 | ) | (1,306 | ) | (66 | ) | |||||||||||
Cash dividends to ExxonMobil shareholders |
(8,058 | ) | (7,621 | ) | (7,628 | ) | (7,185 | ) | (6,896 | ) | ||||||||||
Cash dividends to minority interests |
(375 | ) | (289 | ) | (239 | ) | (293 | ) | (215 | ) | ||||||||||
Changes in minority interests and
sales/(purchases) of affiliate stock |
(419 | ) | (659 | ) | (493 | ) | (681 | ) | (215 | ) | ||||||||||
Tax benefits related to stock-based awards |
333 | 369 | 462 | — | — | |||||||||||||||
Common stock acquired |
(35,734 | ) | (31,822 | ) | (29,558 | ) | (18,221 | ) | (9,951 | ) | ||||||||||
Common stock sold |
753 | 1,079 | 1,173 | 941 | 960 | |||||||||||||||
Net cash used in financing activities |
(44,027 | ) | (38,345 | ) | (36,210 | ) | (26,941 | ) | (18,268 | ) | ||||||||||
Effects of exchange rate changes on cash |
(2,743 | ) | 1,808 | 727 | (787 | ) | 532 | |||||||||||||
Increase/(decrease) in cash and cash equivalents |
(2,544 | ) | 5,737 | (427 | ) | 10,140 | 7,905 | |||||||||||||
Cash and cash equivalents at beginning of year |
33,981 | 28,244 | 28,671 | 18,531 | 10,626 | |||||||||||||||
Cash and cash equivalents at end of year |
31,437 | 33,981 | 28,244 | 28,671 | 18,531 | |||||||||||||||
| The information in the Summary Statement of Income (for 2006 to 2008), the Summary Balance Sheet (for 2007 and 2008), and the Summary Statement of Cash Flows (for 2006 to 2008), shown on pages 15 through 17, corresponds to the information in the Consolidated Statement of Income, Consolidated Balance Sheet, and the Consolidated Statement of Cash Flows in the financial statements of ExxonMobil’s 2009 Proxy Statement. For complete consolidated financial statements, including notes, please refer to Appendix A of ExxonMobil’s 2009 Proxy Statement. See also Management’s Discussion and Analysis of Financial Condition and Results of Operations and other information in Appendix A of the 2009 Proxy Statement. | ||
18 |
EXXON MOBIL CORPORATION • 2008 FINANCIAL & OPERATING REVIEW |
| EXXON MOBIL CORPORATION • 2008 FINANCIAL & OPERATING REVIEW | 19 |
20 |
EXXON MOBIL CORPORATION • 2008 FINANCIAL & OPERATING REVIEW |
Liquids Supply and Demand
|
Gas Supply and Demand Balance | |
 OPEC —Organization of the
Petroleum Exporting Countries
|
 |
| EXXON MOBIL CORPORATION • 2008 FINANCIAL & OPERATING REVIEW | 21 |
Growth in Global Energy Demand
|
Energy-Related CO2 Outlook by Region | |
|
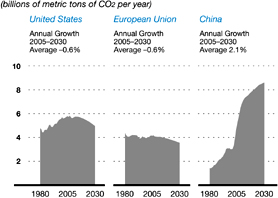 |
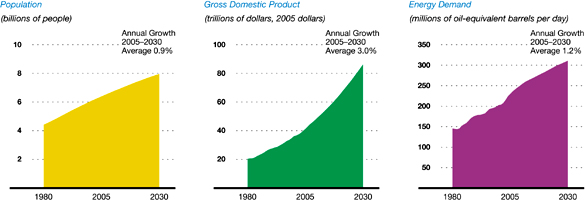
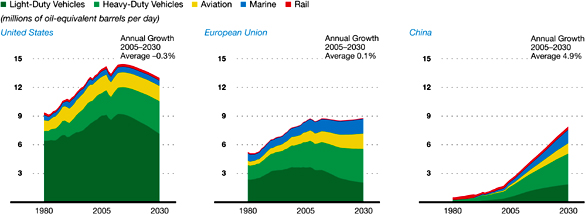
| • | Growing populations and expanding economies will drive global energy demand approximately 35 percent higher from 2005 to 2030 – even with substantial gains in energy efficiency. | |
| • | Oil, natural gas, and coal will continue to provide the majority of the world’s energy needs, meeting close to 80 percent of global demand through 2030 – due to their abundance, affordability, and availability. Nuclear energy will grow as emphasis on low-carbon fuels increases. Renewable fuels will also grow rapidly. | |
| • | Reducing global energy-related CO2 emissions growth will be difficult given the energy needs of developing countries. | |
| This Outlook makes clear that the world’s energy challenges are formidable. We believe that meeting these global energy challenges requires an integrated set of solutions that includes: | ||
| • | Moderating demand through new technologies that improve energy efficiency in our vehicles, homes, and businesses. | |
| • | Expanding access to all economically viable energy sources – oil, natural gas, coal, nuclear, and alternative and renewable sources such as wind, solar, and biofuels. | |
| • | Mitigating the risks of climate change through technologies that advance energy efficiency, enable widespread use of renewables, and capture and store CO2 emissions. | |
22 |
EXXON MOBIL CORPORATION • 2008 FINANCIAL & OPERATING REVIEW |
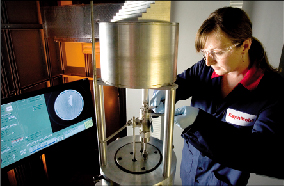
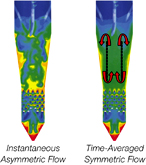
Enhanced Basin Modeling
ExxonMobil uses advanced computer modeling to help identify
the most promising exploration areas within a hydrocarbon basin.
This technology provides valuable insight into the location, quantity,
and timing of hydrocarbon formation and movement through the subsurface.
New capabilities have been added to the proprietary basin modeling
software Stellar, integrating a broader spectrum of subsurface data
to improve analytical predictions. As a result, ExxonMobil researchers are
able to evaluate various scenarios of hydrocarbon accumulation to identify
the areas with the greatest probability of hydrocarbon occurrence. This
capability has proven effective in supporting decisions that range in scope
from capturing new exploration acreage to positioning new wells.
|
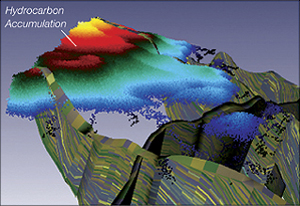
A Stellar model of the subsurface shows the likelihood of encountering hydrocarbons. |
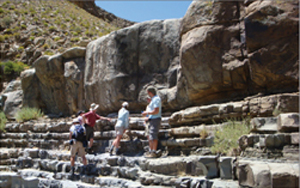
ExxonMobil geologists study outcrops
to improve the
understanding of deepwater reservoir systems. |
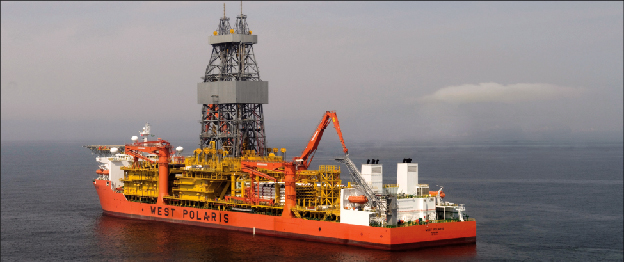
Effective Deepwater Reservoir Modeling Many of the hydrocarbon resources currently under development by ExxonMobil are in reservoirs
deposited in deepwater environments. Deepwater reservoirs typically have a complex sedimentary
structure that can make reservoir management challenging. To improve deepwater reservoir
management, ExxonMobil researchers have developed novel analytical tools and an industry-leading,
integrated evaluation process. The new approach incorporates reservoir modeling, outcrop
interpretation of reservoir analogs, experimental sediment studies, and seismic prediction of
reservoir quality. ExxonMobil has used this technology in deepwater fields in West Africa to
increase hydrocarbon recovery, and plans to apply it globally. |
Unique Depositional Modeling Seismic data typically cannot define all of
the features affecting the performance of a
subsurface reservoir. To improve reservoir
characterization, ExxonMobil has developed
unique capabilities to simulate mathematically
the sediment erosion, transport, and deposition
processes that act together to form a reservoir.
Results from this process-based simulation enable
researchers to create numerical reservoir models
with more detailed sedimentary structures and rock
properties than seismic data alone can provide.
This information provides a superior understanding
of the reservoir to improve resource recovery.
|
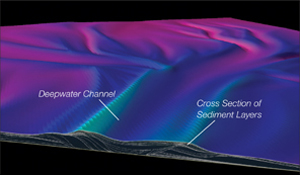
Results of a process-based simulation of a channel
deposited in deep water show the channel topography and geometries. |
| EXXON MOBIL CORPORATION • 2008 FINANCIAL & OPERATING REVIEW | 23 |
24 |
EXXON MOBIL CORPORATION • 2008 FINANCIAL & OPERATING REVIEW |
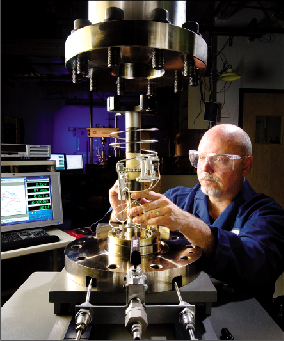
 ExxonMobil’s large-scale laboratory apparatus can recreate geologic and
reservoir conditions to test new bitumen recovery methods. |
Economical Recovery from Thin Bitumen Reservoirs ExxonMobil is actively researching new
approaches for hydrocarbon recovery from
bitumen, also referred to as heavy oil, that exists
in reservoirs too thin to be produced economically
with current technology. These innovative
recovery approaches have the potential to extract
the bitumen without the use of either steam or
heat and to recover a far higher percentage of
bitumen than is currently possible. By minimizing
the use of steam and heat, these new methods
could significantly reduce energy use and carbon
dioxide (CO2) emissions. Laboratory tests and
numerical modeling have yielded encouraging
results for the future application of these
technologies. |
|
Optimal Well Performance Improving individual well performance is an important component
in maximizing the value of hydrocarbon resources. Modern high-
production wells routinely produce fluids from multiple zones
measuring thousands of feet long, increasing the importance of
optimal well design. ExxonMobil has developed a new process
for evaluating various well-completion designs to predict which
design will be the most productive. This process extends traditional
reservoir simulation and takes into account the dynamics of fluid
flow in the completion interval and near-well region. The resulting
predictions lead to completion designs that ensure maximum
production throughout the life of the well. This technology has
been used in Middle East carbonate wells to reduce completion
times and increase production rates, and broader deployment
is planned. |
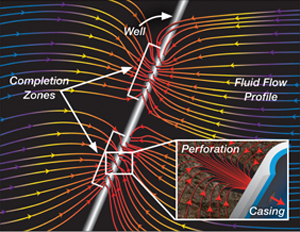 Advanced modeling capabilities allow ExxonMobil to optimize
well performance. |
|
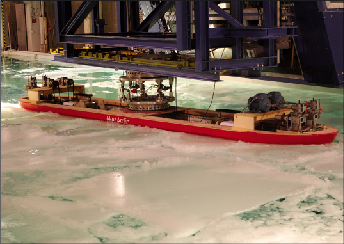
A model of an arctic drillship is being tested under varying
ice thicknesses,
ice drift speeds, and vessel directions. |
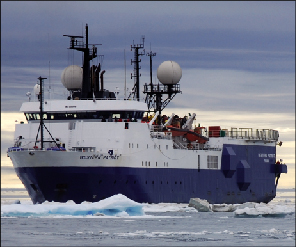
Specialized Arctic Technology The U.S. Geological Survey estimates that
more than one-fifth of the world’s undiscovered
recoverable hydrocarbon resources are in the
Arctic, and more than 80 percent of those
resources are offshore. Because current
technology limits offshore arctic operations to the
open-water season, which may last just weeks,
drilling a well typically requires multiple seasons.
To extend the drilling season, ExxonMobil
scientists and engineers are developing drillship
technology that equips ships with special
reinforced hulls and advanced propulsion systems
for arctic environments. These innovations will
allow wells to be completed in fewer seasons.
Efforts are under way to apply this technology in
the exploration of the Canadian Beaufort Sea. |
|
| EXXON MOBIL CORPORATION • 2008 FINANCIAL & OPERATING REVIEW | 25 |
Robust Pipeline Design
The commercial development of remote oil and gas
resources often requires pipeline construction in very challenging
environments. Through a suite
of advanced pipeline technologies, ExxonMobil has addressed
the technical issues of fabricating pipelines that
ensure operational integrity in these environments.
These technologies include new laboratory
methods for quantifying the effect of complex
loads, physics-based computational models
for predicting load response, and techniques
for welding and materials-joining. Using these
technologies, large pipelines can be constructed
that are able to withstand ground deformation
from earthquakes as well as pressure exerted
from arctic soil and ice movements. ExxonMobil’s
advanced pipeline technologies are being applied in
projects worldwide.
|
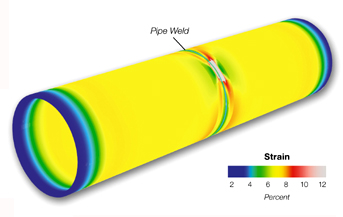
ExxonMobil’s advanced pipeline technologies are underpinned by
computational models and validated by rigorous experiments. |
|
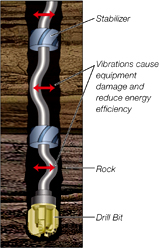
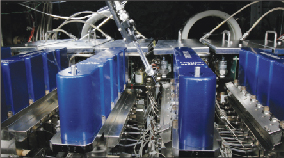
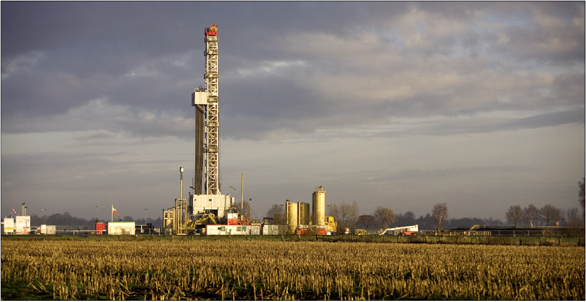
Enhanced Drilling Design
Equipment vibration during drilling, especially for extended-reach wells, leads to
significant energy loss and can damage drilling equipment. In response ExxonMobil
has developed an industry-leading design process for reducing drilling vibrations.
This process includes the unique capability to make design upgrades in real time
at the well site. Field trials of this process have demonstrated increased drilling
equipment life and significantly higher rates of penetration, thereby reducing
drilling costs. As an extension of ExxonMobil’s proven Fast Drill Process, the new
technology is yielding positive results in worldwide drilling operations, including
those in Russia, the United States, and offshore Canada.
|
|
|
ExxonMobil’s new design
process enhances drilling performance by reducing equipment vibrations. |
||
 |
||
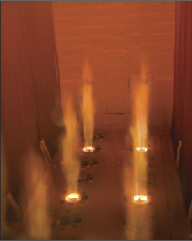
Innovative Flow Assurance One of the challenges of producing hydrocarbons in
extreme environments such as ultra-deep water and
the Arctic is the formation of hydrates, solids that can
clog production flow lines. ExxonMobil is developing
an innovative, reliable solution to avoid the formation
of hydrate blockages without the need for costly
chemicals or insulation. The method uses static mixers
that create water droplets to enhance the production
of small hydrate particles. The small particles are able
to move freely without clumping or sticking to pipe
walls, assuring unrestricted flow. Pilot laboratory
studies have proven the concept, and field tests of
the technology are planned. ExxonMobil’s pilot-scale hydrate flow loop enables development
and evaluation of new flow-assurance technologies in a
controlled environment.
|
||
26 |
EXXON MOBIL CORPORATION • 2008 FINANCIAL & OPERATING REVIEW |
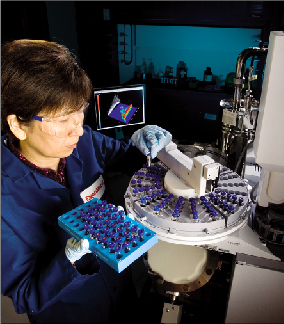
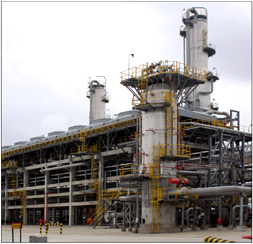
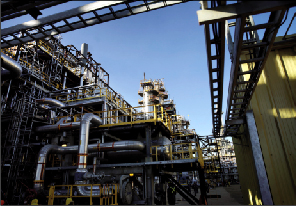
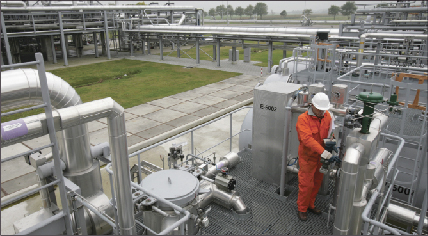
Catalysis ExxonMobil is a leader in the discovery, development,
and deployment of advantaged catalyst technology.
Catalysts accelerate the rate of desired chemical reactions
and are used in over 85 percent of ExxonMobil’s refinery
conversion units. We continue to build upon our history
of leadership in delivering novel catalyst technologies
that add value to our business. Utilizing state-of-the-art
experimentation and modeling tools, we are enhancing
our ability to rapidly discover and commercialize new
catalysts. These new catalysts allow efficient upgrading
of feeds, such as high-sulfur heavy crudes, into cleaner
finished products.
|
 ExxonMobil scientists use a state-of-the-art visualization facility to
review results from advanced modeling of hydroprocessing catalysts. |
|
 Two RCPSA units were successfully commercialized in one of our
European refineries.
|
Rapid Cycle Pressure Swing Adsorption
Hydrogen is a key component used in refineries to
manufacture cleaner fuels. Efficient management of
hydrogen molecules within a refinery is becoming
increasingly important to meet more stringent sulfur
specifications in fuel products. ExxonMobil recently
commercialized new rapid cycle pressure swing adsorption
(RCPSA) technology to recover hydrogen from fuels
process units. The simplicity and compactness of this
skid-mounted technology will enable new opportunities to
expand process unit capacity by recovering hydrogen from
product gas streams that otherwise would be burned in
the refinery fuel gas system. The new RCPSA technology,
which was jointly developed with QuestAir Technologies,
can cost up to 50 percent less than conventional PSA
technology, depending on the scale and type of application.
ExxonMobil is currently pursuing additional hydrogen
recovery opportunities in refineries and chemical plants. |
|
Unconventional Energy Resources
ExxonMobil is actively working on a variety of
unconventional fuel technologies including gasification, methanol to
gasoline, and biofuels. Gasification • ExxonMobil entered into an agreement with Pratt & Whitney Rocketdyne to develop advanced gasification technology to convert coal, coke, or biomass into synthesis gas. Synthesis gas can be converted into chemical products or transportation fuels, or used as fuel for power generation. This technology could also facilitate the use of carbon capture and storage to reduce greenhouse gas emissions from processing carbon rich feedstocks such as coal and coke. |
Methanol to Gasoline •
ExxonMobil’s Methanol
to Gasoline (MTG) technology efficiently converts
methanol into high-quality gasoline. When coupled with
commercially proven gasification and methanol synthesis
technology, MTG is an effective way to produce premium
transportation fuel from coal. We recently began licensing
this technology and have several signed licensees. Biofuels •
ExxonMobil continues to evaluate a number of
short- and longer-term biofuel options and opportunities.
As an example, we have developed a proprietary test
method to fingerprint biodiesel mixtures. This unique
methodology will allow us to improve the efficiency and
reliability of our blending operations, while continuing to
meet product quality specifications. |
|
| EXXON MOBIL CORPORATION • 2008 FINANCIAL & OPERATING REVIEW | 27 |
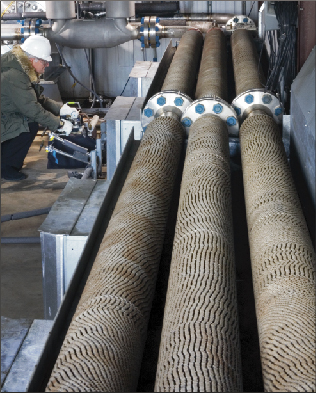
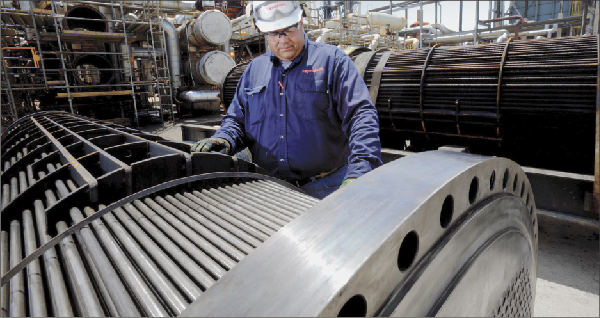
Heat Exchanger Fouling Mitigation Refinery heat exchanger networks are designed to
efficiently transfer heat from hot process streams to cold
feed streams, thereby minimizing process heat input
requirements. The performance of this equipment is an
important part of overall site energy usage. Corrosion
and fouling in heat exchangers can impair performance
by creating a thermal-insulating deposit that reduces the
heat exchange efficiency between the hot and cold fluids.
These effects are particularly detrimental in exchangers
that operate under high-temperature conditions.
|
ExxonMobil researchers have discovered that formation of
a unique surface on the metal tubes of a heat exchanger
can significantly reduce corrosion and fouling. Heat
exchangers with these characteristics are being evaluated
at two Gulf Coast refineries and additional exchangers
will be tested at two other ExxonMobil refineries in 2009.
When deployed, the technology will reduce furnace firing
and associated CO2 emissions. An engineer inspects a modified heat exchanger tube bundle prior
to installation at a U.S. Gulf Coast refinery. |
||
 |
|||
|
Advanced Modeling ExxonMobil is using advanced computational fluid
dynamics (CFD) modeling to enhance the performance
and utilization of existing refinery assets. For example,
detailed CFD analysis of our proprietary Fluid Coking
process led to a new hardware design that better
utilizes existing reactor volume. The new configuration
increases the yield of gasoline and distillate products
and improves energy efficiency.
|
 |
||
Computational Fluid Dynamics modeling enables evaluation of time-varying behavior of multiphase refinery processes. |
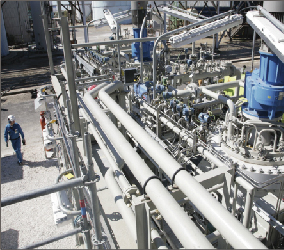
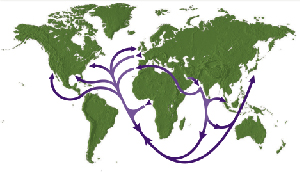
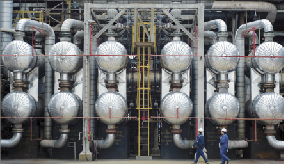
Supply Chain Optimization ExxonMobil operates one of the world’s largest and most
complex supply chains. The company’s business experts
and engineers work constantly to improve its effectiveness
and reduce costs. We are actively developing and
deploying unique supply chain optimization technologies
that place us at the forefront of industry. One example
is our METEORITE supply chain program that aids in
the scheduling, transportation, and optimization of our
feedstock shipments around the world. |
||
28 |
EXXON MOBIL CORPORATION • 2008 FINANCIAL & OPERATING REVIEW |
Lower-Cost Processes
We have a number of programs targeting more efficient,
lower-cost processes as we continually strive to lower
operating costs at our chemical manufacturing facilities
by delivering improved efficiency, greater reliability, and
increased asset utilization. Technology activities include breakthrough developments such as our new butyl rubber polymerization process, as well as incremental improvements from implementation of many smaller, focused efficiency initiatives. These developments are enabled by sophisticated computer process simulations, advanced materials engineering, proprietary equipment design, and novel product and catalyst chemistry. |
 ExxonMobil Chemical has received American Chemistry Council
energy efficiency awards for 11 consecutive years as a result of
continued implementation of technology best practices. |
 |
Advantaged Feeds Many of our technology programs are focused on developing innovative ways to
allow processing of lower-cost feeds. Through proprietary design of processing
equipment, we have increased the flexibility of our units to handle a wide
variety of hydrocarbon feed streams. In addition we have developed complex
computational tools, including integrated real-time optimization programs, which
allow us to rapidly change feeds into our chemical plants and refineries to
maximize the value of all molecules. These technology best practices are also incorporated into new equipment
design. For example the new ethylene steam cracker currently under
construction in Singapore has been designed to have the greatest feed flexibility
of any ExxonMobil steam cracker in the world. Our steam cracker technology is a competitive advantage. New furnaces are larger and more
efficient than those typically used in industry. We have also qualified more than 300 new feeds
over the past four years, increasing flexibility to use the most-advantaged feeds. |
Premium Product Development
We continue to develop premium products across our
chemical portfolio. Breakthroughs in metallocene catalyst
technology have given us the ability to create whole new
families of higher-value chemical products from commodity
chemical building blocks. For example:
Enable metallocene polyethylene produces strong and clear
films that can reduce packaging weight by up to 20 percent
versus typical films, delivering energy savings throughout
the supply chain in uses from packaging to greenhouse
coverings. |
 Use of high-throughput experimentation (HTE) catalyst screening
has allowed us to accelerate design and commercialization of next-
generation products from metallocene catalysts. |
| EXXON MOBIL CORPORATION • 2008 FINANCIAL & OPERATING REVIEW | 29 |
| • | Identify and pursue all attractive exploration opportunities | |
| • | Invest in projects that deliver superior returns | |
| • | Maximize profitability of existing oil and gas production | |
| • | Capitalize on growing natural gas and power markets |
| EXXON MOBIL CORPORATION • 2008 FINANCIAL & OPERATING REVIEW | 31 |
| (1) Royal Dutch Shell, BP, and Chevron values are estimated on a consistent basis with ExxonMobil, based on public information. | ||
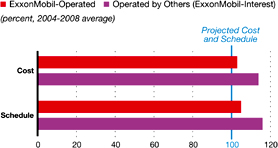
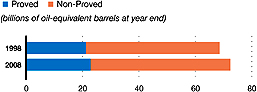
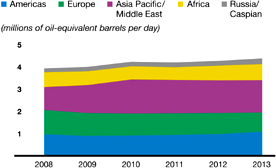
| UPSTREAM STATISTICAL RECAP | 2008 | 2007 | 2006 | 2005 | 2004 | |||||||||||||||
Earnings (millions of dollars) |
35,402 | 26,497 | 26,230 | 24,349 | 16,675 | |||||||||||||||
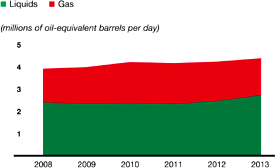
Liquids production (thousands of barrels per day) |
2,405 | 2,616 | 2,681 | 2,523 | 2,571 | |||||||||||||||
Natural gas production
available for sale (millions of cubic feet per day) |
9,095 | 9,384 | 9,334 | 9,251 | 9,864 | |||||||||||||||
Oil-equivalent production (thousands of barrels per day) |
3,921 | 4,180 | 4,237 | 4,065 | 4,215 | |||||||||||||||
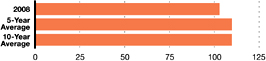
Proved reserves replacement(1)(2) (percent) |
110 | 132 | 129 | 129 | 125 | |||||||||||||||
Resource additions(2) (millions of oil-equivalent barrels) |
2,230 | 2,010 | 4,270 | 4,365 | 2,940 | |||||||||||||||
Average capital employed(2) (millions of dollars) |
66,064 | 63,565 | 57,871 | 53,261 | 50,642 | |||||||||||||||
Return on average capital employed(2) (percent) |
53.6 | 41.7 | 45.3 | 45.7 | 32.9 | |||||||||||||||
Capital and exploration expenditures(2) (millions of dollars) |
19,734 | 15,724 | 16,231 | 14,470 | 11,715 | |||||||||||||||
| (1) | Excluding asset sales, the 2007 Venezuela expropriation, and year-end price/cost effects. | |
| (2) | See Frequently Used Terms on pages 96 through 99. |
32 |
EXXON MOBIL CORPORATION • 2008 FINANCIAL & OPERATING REVIEW |
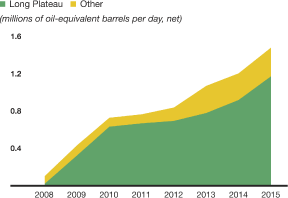
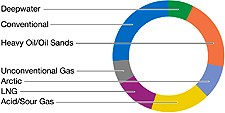
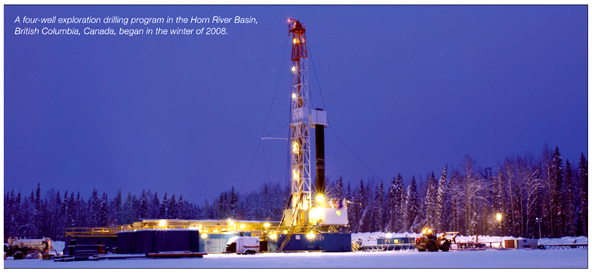
| • | New exploration plays and concepts that typically have high uncertainty but large potential to provide significant long-term resource growth. | |
| • | Unconventional resources such as tight gas, shale gas, heavy oil, and oil sands that can provide profitable, long-plateau production. | |
| • | Further exploration of established hydrocarbon provinces and mature plays that provide near-term resource additions and production. | |
| • | Discovered fields that are undeveloped or partially developed. |
| EXXON MOBIL CORPORATION • 2008 FINANCIAL & OPERATING REVIEW | 33 |
34 |
EXXON MOBIL CORPORATION • 2008 FINANCIAL & OPERATING REVIEW |

| EXXON MOBIL CORPORATION • 2008 FINANCIAL & OPERATING REVIEW | 35 |
| (1) Royal Dutch Shell, BP, and Chevron values calculated on a consistent basis with ExxonMobil, based on public information. | ||
36 |
EXXON MOBIL CORPORATION • 2008 FINANCIAL & OPERATING REVIEW |
| EXXON MOBIL CORPORATION • 2008 FINANCIAL & OPERATING REVIEW | 37 |
|
38 |
EXXON MOBIL CORPORATION • 2008 FINANCIAL & OPERATING REVIEW |

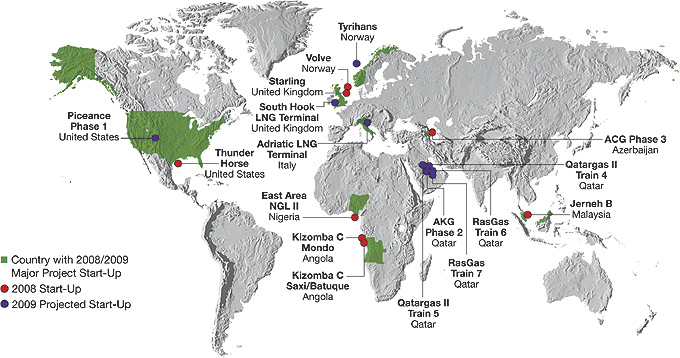
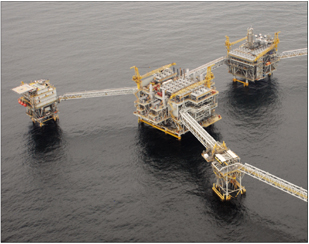
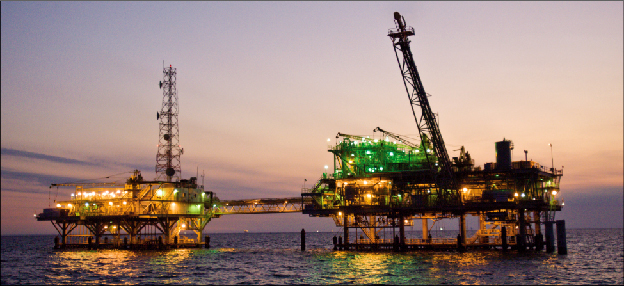
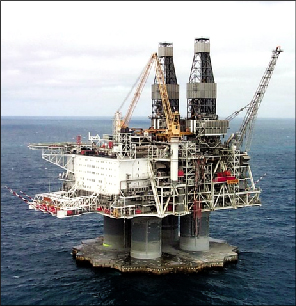
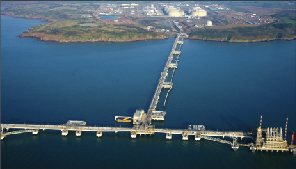
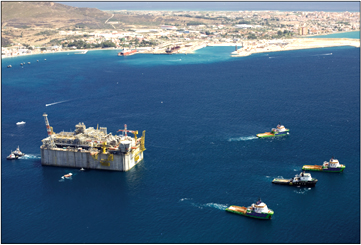
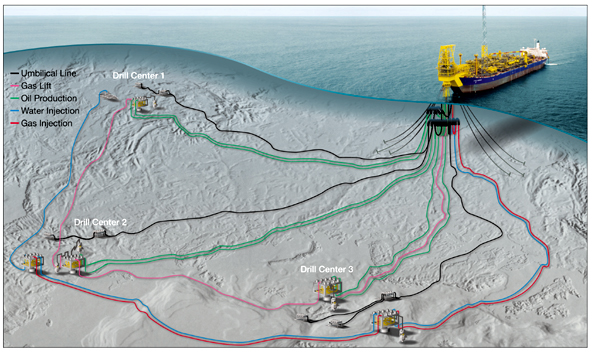
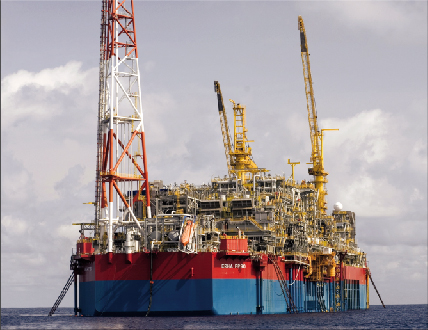
| • | Local fabrication of the high-strength steel turret components for the Kizomba C project – the first of their kind in Angola. | |
| • | Approximately $220 million of the East Area Natural Gas Liquids (NGL) II project was financed by Nigerian banks – the first for oil and gas ventures in Nigeria. | |
| • | Conducted subsea systems integration test in Nigeria for the deepwater Erha project – the first ever in West Africa. |
| EXXON MOBIL CORPORATION • 2008 FINANCIAL & OPERATING REVIEW | 39 |
|
40 |
EXXON MOBIL CORPORATION • 2008 FINANCIAL & OPERATING REVIEW |
|
 |
| EXXON MOBIL CORPORATION • 2008 FINANCIAL & OPERATING REVIEW | 41 |
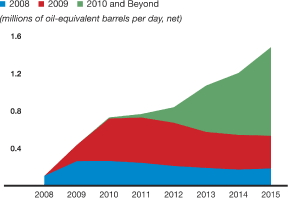
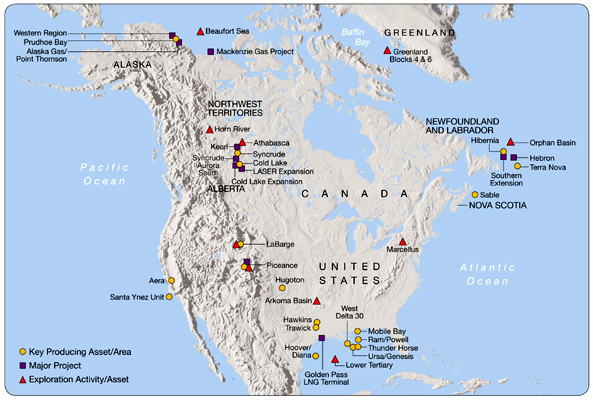
| Target Peak | ||||||||||||
| Production (Gross) | ExxonMobil | |||||||||||
| Liquids | Gas | Working | ||||||||||
| (KBD) | (MCFD) | Interest (%) | ||||||||||
2008
(Actual) |
||||||||||||
Angola |
Kizomba C Mondo | 100 | — | 40 | < | |||||||
| Kizomba C Saxi/Batuque | 100 | — | 40 | < | ||||||||
Azerbaijan |
ACG Phase 3 | 300 | — | 8 | = | |||||||
Malaysia |
Jerneh B | — | 150 | 100 | < | |||||||
Nigeria |
East Area NGL II | 50 | — | 51 | < | |||||||
Norway |
Volve | 50 | 30 | 30 | = | |||||||
U.K. |
Starling | 15 | 160 | 72 | = | |||||||
U.S. |
Thunder Horse | 250 | 200 | 25 | = | |||||||
2009
(Projected) |
||||||||||||
Italy |
Adriatic LNG Terminal | — | — | 45 | 5 | |||||||
Norway |
Tyrihans | 80 | 335 | 12 | = | |||||||
Qatar |
Al Khaleej Gas Phase 2 | 70 | 1250 | 80* | < | |||||||
| Qatargas II Train 4** | 80 | 1250 | 30 | 5 | ||||||||
| Qatargas II Train 5 | 80 | 1250 | 18 | 5 | ||||||||
| RasGas Train 6 | 75 | 1250 | 30 | 5 | ||||||||
| RasGas Train 7 | 75 | 1250 | 30 | 5 | ||||||||
U.K. |
South Hook LNG Terminal | — | — | 24 | 5 | |||||||
U.S. |
Piceance Phase 1 | 2 | 200 | 100 | < | |||||||
2010-2011
(Projected) |
||||||||||||
Angola |
Kizomba Satellites | 125 | — | 40 | < | |||||||
| Pazflor | 200 | — | 20 | = | ||||||||
Australia |
Kipper/Tuna | 15 | 175 | 40 | < | |||||||
| Turrum | 20 | 200 | 50 | < | ||||||||
Canada |
Hibernia Southern Extension | 65 | — | 28 | < | |||||||
Nigeria |
Etim/Asasa Pressure | 50 | — | 40 | < | |||||||
| Maintenance | ||||||||||||
Russia |
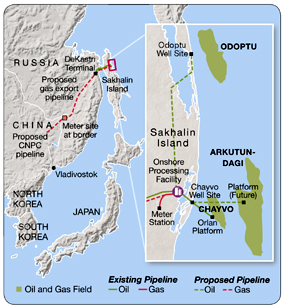
Sakhalin-1 Odoptu | 35 | — | 30 | < | |||||||
U.S. |
Golden Pass LNG Terminal | — | — | 18 | 5 | |||||||
| Prudhoe Bay Western Region | 50 | — | 36 | = | ||||||||
2012+
(Projected) |
||||||||||||
Angola |
Cravo-Lirio-Orquidea-Violeta | 160 | — | 20 | = | |||||||
| AB32 Southeast Hub | 210 | — | 15 | = | ||||||||
| Palas-Astrea-Juno | 150 | — | 25 | = | ||||||||
| Plutao-Saturno-Venus-Marte | 150 | — | 25 | = | ||||||||
| Target Peak | ||||||||||||||||
| Production (Gross) | ExxonMobil | |||||||||||||||
| Liquids | Gas | Working | ||||||||||||||
| (KBD) | (MCFD) | Interest (%) | ||||||||||||||
| 2012+ (continued) | ||||||||||||||||
Australia |
Gorgon Jansz | 15 | 2250 | 25 | = | |||||||||||
| Scarborough | — | 1190 | 50 | < | ||||||||||||
Canada |
Cold Lake Expansion | 35 | — | 100 | < | |||||||||||
| Cold Lake LASER Expansion | 20 | — | 100 | < | ||||||||||||
| Hebron | 140 | — | 36 | < | ||||||||||||
| Kearl Phase 1 | 110 | — | 100 | < | ||||||||||||
| Kearl Future Phases | 200 | — | 100 | < | ||||||||||||
| Mackenzie Gas Project | 10 | 830 | 56 | < | ||||||||||||
| Syncrude Aurora South | 180 | — | 25 | 5 | ||||||||||||
| Phase 1 & 2 | ||||||||||||||||
Indonesia |
Banyu Urip | 165 | — | 45 | < | |||||||||||
| Natuna | — | 1100 | 76 | < | ||||||||||||
Italy |
Tempa Rossa | 50 | 5 | 25 | = | |||||||||||
Kazakhstan |
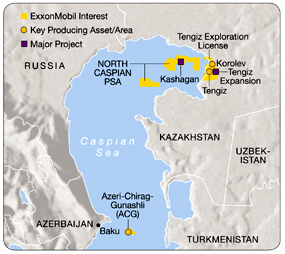
Kashagan Phase 1 | 360 | — | 17 | = | |||||||||||
| Kashagan Future Phases | 1190 | — | 17 | = | ||||||||||||
| Tengiz Expansion | 370 | — | 25 | = | ||||||||||||
Nigeria |
Bonga North | 100 | 60 | 20 | = | |||||||||||
| Bonga Southwest | 140 | 105 | 16 | = | ||||||||||||
| Bosi | 135 | — | 56 | < | ||||||||||||
| Erha North Phase 2 | 45 | — | 56 | < | ||||||||||||
| LNG IPP Upstream | — | 700 | 40 | < | ||||||||||||
| Satellite Field Development | 125 | — | 40 | < | ||||||||||||
| Usan | 180 | — | 30 | = | ||||||||||||
| Usari Pressure Maintenance | 50 | — | 40 | < | ||||||||||||
Norway |
Trestakk | 55 | 50 | 33 | = | |||||||||||
Papua New |
PNG LNG | 40 | 940 | 33 | < | |||||||||||
Guinea |
||||||||||||||||
Qatar |
Barzan | 100 | 1500 | 10* | 5 | |||||||||||
Russia |
Sakhalin-1 Arkutun-Dagi | 90 | — | 30 | < | |||||||||||
| Sakhalin-1 Future Phases | — | 800 | 30 | < | ||||||||||||
U.K. |
Fram | 5 | 105 | 72 | = | |||||||||||
U.S. |
Alaska Gas/Point Thomson | 70 | 4500 | 36 | * | |||||||||||
| Piceance Future Phases | 10 | 780 | 100 | < | ||||||||||||
| < = ExxonMobil Operated | 5 = Joint Operation = = Co-Venturer Operated | |||||||||
| * Pending Final Agreements | ** Offshore production started up in 2008. | – Not Applicable | ||||||||
42 |
EXXON MOBIL CORPORATION • 2008 FINANCIAL & OPERATING REVIEW |
| 5-Year | ||||||||
| (billions of oil-equivalent barrels) | 2008 | Average | ||||||
Resource additions/acquisitions |
2.2 | 3.2 | ||||||
Revisions to existing fields |
— | (0.5 | ) | |||||
Production |
(1.5 | ) | (1.6 | ) | ||||
Sales |
(0.4 | ) | (1.0 | )(1) | ||||
Net change |
0.3 | 0.1 | ||||||
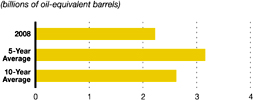
| (1) | Includes impact of the Venezuela expropriation in 2007. | |
| (2) | See Frequently Used Terms on pages 96 through 99. |
| EXXON MOBIL CORPORATION • 2008 FINANCIAL & OPERATING REVIEW | 43 |
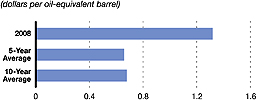
| (1) Excludes year-end price/cost effects. Proved reserves reflecting December 31 prices can be found on pages 67-68. | ||
| (2) Includes asset sales and the 2007 Venezuela expropriation. | ||
44 |
EXXON MOBIL CORPORATION • 2008 FINANCIAL & OPERATING REVIEW |
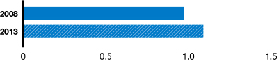
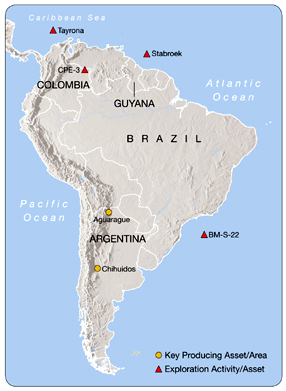
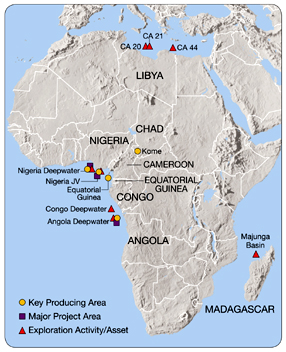
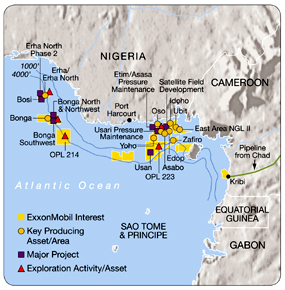
ExxonMobil has interests in exploration and production acreage in 38 countries and production operations in 23 countries.
| 2008 | 2007 | 2006 | ||||||||||
Earnings (billions of dollars) |
9.8 | 7.6 | 8.9 | |||||||||
Proved Reserves(1) (BOEB) |
7.2 | 6.2 | 6.2 | |||||||||
Acreage (gross acres, million) |
56.4 | 56.3 | 56.4 | |||||||||
Net Liquids Production (MBD) |
0.7 | 0.7 | 0.8 | |||||||||
Net Gas Available for Sale (BCFD) |
1.9 | 2.3 | 2.5 | |||||||||
| (1) | See Frequently Used Terms on pages 96 through 99. |
| EXXON MOBIL CORPORATION • 2008 FINANCIAL & OPERATING REVIEW | 45 |
46 |
EXXON MOBIL CORPORATION • 2008 FINANCIAL & OPERATING REVIEW |
| EXXON MOBIL CORPORATION • 2008 FINANCIAL & OPERATING REVIEW | 47 |
48 |
EXXON MOBIL CORPORATION • 2008 FINANCIAL & OPERATING REVIEW |
| EXXON MOBIL CORPORATION • 2008 FINANCIAL & OPERATING REVIEW | 49 |
50 |
EXXON MOBIL CORPORATION • 2008 FINANCIAL & OPERATING REVIEW |
| 2008 | 2007 | 2006 | |||||||||||
Earnings (billions of dollars) |
9.9 | 6.1 | 6.5 | ||||||||||
Proved Reserves(1) (BOEB) |
3.4 | 3.8 | 3.9 | ||||||||||
Acreage (gross acres, million) |
27.0 | 24.3 | 18.8 | ||||||||||
Net Liquids Production (MBD) |
0.4 | 0.5 | 0.5 | ||||||||||
Net Gas Available for Sale (BCFD) |
4.0 | 3.8 | 4.1 | ||||||||||
| (1) | See Frequently Used Terms on pages 96 through 99. | |
| EXXON MOBIL CORPORATION • 2008 FINANCIAL & OPERATING REVIEW | 51 |
52 |
EXXON MOBIL CORPORATION • 2008 FINANCIAL & OPERATING REVIEW |
| EXXON MOBIL CORPORATION • 2008 FINANCIAL & OPERATING REVIEW |
53 |
|
54 |
EXXON MOBIL CORPORATION • 2008 FINANCIAL & OPERATING REVIEW |
| 2008 | 2007 | 2006 | |||||||||||
Earnings (billions of dollars) |
6.4 | 5.5 | 5.5 | ||||||||||
Proved Reserves(1) (BOEB) |
2.1 | 2.4 | 2.4 | ||||||||||
Acreage (gross acres, million) |
42.4 | 41.8 | 41.1 | ||||||||||
Net Liquids Production (MBD) |
0.6 | 0.7 | 0.8 | ||||||||||
Net Gas Available for Sale (BCFD) |
— | — | — | ||||||||||
| (1) | See Frequently Used Terms on pages 96 through 99. | |
| EXXON MOBIL CORPORATION • 2008 FINANCIAL & OPERATING REVIEW | 55 |
56 |
EXXON MOBIL CORPORATION • 2008 FINANCIAL & OPERATING REVIEW |
| EXXON MOBIL CORPORATION • 2008 FINANCIAL & OPERATING REVIEW | 57 |
58 |
EXXON MOBIL CORPORATION • 2008 FINANCIAL & OPERATING REVIEW |
| 2008 | 2007 | 2006 | |||||||||||
Earnings (billions of dollars) |
6.2 | 4.9 | 4.1 | ||||||||||
Proved Reserves(1) (BOEB) |
8.2 | 8.3 | 8.1 | ||||||||||
Acreage (gross acres, million) |
26.9 | 29.0 | 21.7 | ||||||||||
Net Liquids Production (MBD) |
0.5 | 0.5 | 0.5 | ||||||||||
Net Gas Available for Sale (BCFD) |
3.1 | 3.2 | 2.6 | ||||||||||
| (1) | See Frequently Used Terms on pages 96 through 99. | |
| EXXON MOBIL CORPORATION • 2008 FINANCIAL & OPERATING REVIEW | 59 |
60 |
EXXON MOBIL CORPORATION • 2008 FINANCIAL & OPERATING REVIEW |
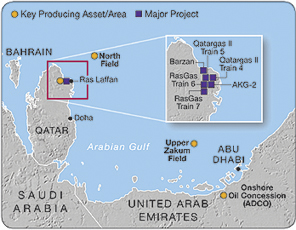
| Joint | Capacity | Working | Scheduled | |||||||||||
| Venture | Train | (MTA)(1) | Interest (%) | Completion | ||||||||||
Qatargas |
1,2,3 | 9.7 | 10 | Complete | ||||||||||
Qatargas II |
4 | 7.8 | 30 | 2009 | ||||||||||
| 5 | 7.8 | 18 | 2009 | |||||||||||
RasGas |
1,2 | 6.6 | 25 | Complete | ||||||||||
| 3 | 4.7 | 30 | Complete | |||||||||||
| 4 | 4.7 | 34 | Complete | |||||||||||
| 5 | 4.7 | 30 | Complete | |||||||||||
| 6 | 7.8 | 30 | 2009 | |||||||||||
| 7 | 7.8 | 30 | 2009 | |||||||||||
Total |
61.6 | |||||||||||||
| (1) | Million tons per year. |
| EXXON MOBIL CORPORATION • 2008 FINANCIAL & OPERATING REVIEW | 61 |
62 |
EXXON MOBIL CORPORATION • 2008 FINANCIAL & OPERATING REVIEW |
| 2008 | 2007 | 2006 | ||||||||||
Earnings (billions of dollars) |
3.1 | 2.4 | 1.2 | |||||||||
Proved Reserves(1) (BOEB) |
1.9 | 2.0 | 2.1 | |||||||||
Acreage (gross acres, million) |
2.5 | 2.5 | 2.7 | |||||||||
Net Liquids Production (MBD) |
0.2 | 0.2 | 0.1 | |||||||||
Net Gas Available for Sale (BCFD) |
0.1 | 0.1 | 0.1 | |||||||||
| (1) | See Frequently Used Terms on pages 96 through 99. |
| EXXON MOBIL CORPORATION • 2008 FINANCIAL & OPERATING REVIEW | 63 |
64 |
EXXON MOBIL CORPORATION • 2008 FINANCIAL & OPERATING REVIEW |
|
NET LIQUIDS PRODUCTION(1) – Including Oil Sands and Non-Consolidated Operations
|
||||||||||||||||||||
| (thousands of barrels per day) | 2008 | 2007 | 2006 | 2005 | 2004 | |||||||||||||||
United States |
||||||||||||||||||||
Alaska |
130 | 132 | 127 | 159 | 174 | |||||||||||||||
Lower 48 |
237 | 260 | 287 | 317 | 383 | |||||||||||||||
Total United States |
367 | 392 | 414 | 477 | 557 | |||||||||||||||
Canada/South America |
292 | 324 | 354 | 395 | 408 | |||||||||||||||
Total Americas |
659 | 716 | 768 | 872 | 965 | |||||||||||||||
Europe |
||||||||||||||||||||
United Kingdom |
123 | 150 | 186 | 202 | 235 | |||||||||||||||
Norway |
295 | 319 | 320 | 327 | 328 | |||||||||||||||
Other |
10 | 11 | 14 | 17 | 20 | |||||||||||||||
Total Europe |
428 | 480 | 520 | 546 | 583 | |||||||||||||||
Africa |
||||||||||||||||||||
Nigeria |
364 | 415 | 427 | 299 | 276 | |||||||||||||||
Angola |
181 | 173 | 193 | 181 | 95 | |||||||||||||||
Equatorial Guinea |
60 | 76 | 103 | 122 | 136 | |||||||||||||||
Other |
47 | 53 | 58 | 64 | 65 | |||||||||||||||
Total Africa |
652 | 717 | 781 | 666 | 572 | |||||||||||||||
Asia Pacific/Middle East |
||||||||||||||||||||
Australia |
59 | 66 | 69 | 73 | 91 | |||||||||||||||
Malaysia |
56 | 67 | 64 | 82 | 94 | |||||||||||||||
Middle East |
381 | 374 | 340 | 163 | 158 | |||||||||||||||
Other |
10 | 11 | 12 | 14 | 17 | |||||||||||||||
Total Asia Pacific/Middle East |
506 | 518 | 485 | 332 | 360 | |||||||||||||||
Russia/Caspian |
160 | 185 | 127 | 107 | 91 | |||||||||||||||
Total worldwide |
2,405 | 2,616 | 2,681 | 2,523 | 2,571 | |||||||||||||||
Gas Plant Liquids Included Above |
||||||||||||||||||||
United States |
49 | 57 | 61 | 68 | 86 | |||||||||||||||
Non-U.S. |
164 | 166 | 175 | 172 | 168 | |||||||||||||||
Total worldwide |
213 | 223 | 236 | 240 | 254 | |||||||||||||||
Oil Sands and Non-Consolidated Volumes Included Above |
||||||||||||||||||||
United States |
78 | 82 | 87 | 93 | 101 | |||||||||||||||
Canada/South America |
62 | 65 | 58 | 53 | 59 | |||||||||||||||
Europe |
5 | 6 | 6 | 7 | 9 | |||||||||||||||
Asia Pacific/Middle East |
193 | 190 | 172 | 146 | 140 | |||||||||||||||
Russia/Caspian |
87 | 75 | 71 | 72 | 74 | |||||||||||||||
Total worldwide |
425 | 418 | 394 | 371 | 383 | |||||||||||||||
| (1) | Net liquids production quantities are the volumes of crude oil and natural gas liquids withdrawn from ExxonMobil’s oil and gas reserves, excluding royalties and quantities due to others when produced, and are based on the volumes delivered from the lease or at the point measured for royalty and/or severance tax purposes. Volumes include 100 percent of the production of majority-owned affiliates, including liquids production from oil sands operations in Canada, and ExxonMobil’s ownership of the production by companies owned 50 percent or less. |
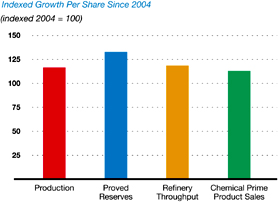
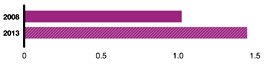
Proved Reserves per Share Growth
|
Production per Share Growth | Upstream Earnings per Share Growth | ||
|

|
 |
| (1) | Royal Dutch Shell, BP, and Chevron values are calculated on a consistent basis with ExxonMobil, based on public information. | |
| (2) | 2008 competitor data not available. |
| EXXON MOBIL CORPORATION • 2008 FINANCIAL & OPERATING REVIEW | 65 |
| (millions of cubic feet per day) | 2008 | 2007 | 2006 | 2005 | 2004 | |||||||||||||||
United States |
1,246 | 1,468 | 1,625 | 1,739 | 1,947 | |||||||||||||||
Canada/South America |
640 | 808 | 935 | 1,006 | 1,069 | |||||||||||||||
Total Americas |
1,886 | 2,276 | 2,560 | 2,745 | 3,016 | |||||||||||||||
Europe |
||||||||||||||||||||
The Netherlands |
1,748 | 1,551 | 1,536 | 1,595 | 1,725 | |||||||||||||||
United Kingdom |
750 | 779 | 990 | 1,126 | 1,196 | |||||||||||||||
Norway |
764 | 705 | 686 | 709 | 645 | |||||||||||||||
Germany |
687 | 775 | 874 | 885 | 1,048 | |||||||||||||||
Total Europe |
3,949 | 3,810 | 4,086 | 4,315 | 4,614 | |||||||||||||||
Africa |
32 | 26 | — | — | — | |||||||||||||||
Asia Pacific/Middle East |
||||||||||||||||||||
Australia |
358 | 389 | 330 | 338 | 397 | |||||||||||||||
Malaysia |
582 | 583 | 519 | 488 | 511 | |||||||||||||||
Middle East |
1,911 | 1,875 | 1,353 | 846 | 642 | |||||||||||||||
Indonesia |
239 | 286 | 365 | 410 | 578 | |||||||||||||||
Other |
24 | 29 | 29 | 32 | 33 | |||||||||||||||
Total Asia Pacific/Middle East |
3,114 | 3,162 | 2,596 | 2,114 | 2,161 | |||||||||||||||
Russia/Caspian |
114 | 110 | 92 | 77 | 73 | |||||||||||||||
Total worldwide |
9,095 | 9,384 | 9,334 | 9,251 | 9,864 | |||||||||||||||
Non-Consolidated Natural Gas Volumes Included Above |
||||||||||||||||||||
United States |
1 | 1 | 1 | 2 | 2 | |||||||||||||||
Europe |
1,696 | 1,503 | 1,500 | 1,548 | 1,667 | |||||||||||||||
Asia Pacific/Middle East |
1,356 | 1,272 | 1,000 | 807 | 642 | |||||||||||||||
Russia/Caspian |
77 | 79 | 75 | 73 | 74 | |||||||||||||||
Total worldwide |
3,130 | 2,855 | 2,576 | 2,430 | 2,385 | |||||||||||||||
| (1) | Net natural gas available for sale quantities are the volumes withdrawn from ExxonMobil’s natural gas reserves, excluding royalties and volumes due to others when produced, and excluding gas purchased from others, gas consumed in producing operations, field processing plant losses, volumes used for gas lift, gas injection and cycling operations, quantities flared, and volume shrinkage due to the removal of condensate or natural gas liquids fractions. |
| (millions of cubic feet per day) | 2008 | 2007 | 2006 | 2005 | 2004 | |||||||||||||||
United States |
1,292 | 1,560 | 1,686 | 1,833 | 2,277 | |||||||||||||||
Canada/South America |
845 | 968 | 1,120 | 1,186 | 1,353 | |||||||||||||||
Europe |
5,665 | 5,396 | 5,728 | 6,015 | 6,262 | |||||||||||||||
Africa |
32 | 26 | — | — | — | |||||||||||||||
Asia Pacific/Middle East |
2,841 | 2,900 | 2,379 | 1,901 | 1,973 | |||||||||||||||
Russia/Caspian |
137 | 129 | 112 | 86 | 77 | |||||||||||||||
Total worldwide |
10,812 | 10,979 | 11,025 | 11,021 | 11,942 | |||||||||||||||
| (1) | Natural gas sales include 100 percent of the sales of ExxonMobil- and majority-owned affiliates and ExxonMobil’s ownership of sales by companies owned 50 percent or less. Numbers include sales of gas purchased from third parties. |
66 |
EXXON MOBIL CORPORATION • 2008 FINANCIAL & OPERATING REVIEW |
|
NUMBER OF NET WELLS DRILLED ANNUALLY(1)
|
||||||||||||||||||||||||||||||||||||||||||||||||||||||||||||
| Productive | Dry | Total | ||||||||||||||||||||||||||||||||||||||||||||||||||||||||||
| (net wells drilled) | 2008 | 2007 | 2006 | 2005 | 2004 | 2008 | 2007 | 2006 | 2005 | 2004 | 2008 | 2007 | 2006 | 2005 | 2004 | |||||||||||||||||||||||||||||||||||||||||||||
Exploratory(2) |
19 | 19 | 21 | 24 | 21 | 9 | 16 | 12 | 13 | 15 | 28 | 35 | 33 | 37 | 36 | |||||||||||||||||||||||||||||||||||||||||||||
Development |
731 | 917 | 1,041 | 946 | 1,164 | 4 | 19 | 11 | 14 | 18 | 735 | 936 | 1,052 | 960 | 1,182 | |||||||||||||||||||||||||||||||||||||||||||||
Total |
750 | 936 | 1,062 | 970 | 1,185 | 13 | 35 | 23 | 27 | 33 | 763 | 971 | 1,085 | 997 | 1,218 | |||||||||||||||||||||||||||||||||||||||||||||
NET ACREAGE AT YEAR END(3)
|
||||||||||||||||||||||||||||||||||||||||
| Undeveloped | Developed | |||||||||||||||||||||||||||||||||||||||
| (thousands of net acres) | 2008 | 2007 | 2006 | 2005 | 2004 | 2008 | 2007 | 2006 | 2005 | 2004 | ||||||||||||||||||||||||||||||
United States |
5,691 | 5,539 | 6,062 | 6,413 | 7,055 | 5,148 | 5,174 | 5,178 | 5,260 | 5,480 | ||||||||||||||||||||||||||||||
Canada/South America(4) |
19,953 | 22,563 | 22,224 | 24,484 | 25,832 | 2,488 | 2,366 | 2,360 | 2,498 | 2,915 | ||||||||||||||||||||||||||||||
Europe |
7,913 | 6,002 | 2,727 | 2,778 | 2,245 | 4,026 | 4,194 | 4,418 | 4,687 | 4,715 | ||||||||||||||||||||||||||||||
Africa |
26,439 | 24,835 | 24,075 | 29,048 | 21,797 | 756 | 729 | 717 | 545 | 475 | ||||||||||||||||||||||||||||||
Asia Pacific/Middle East |
12,190 | 13,167 | 7,462 | 3,797 | 4,180 | 1,651 | 1,649 | 1,655 | 1,570 | 2,436 | ||||||||||||||||||||||||||||||
Russia/Caspian |
372 | 392 | 449 | 569 | 561 | 116 | 116 | 116 | 116 | 103 | ||||||||||||||||||||||||||||||
Total worldwide |
72,558 | 72,498 | 62,999 | 67,089 | 61,670 | 14,185 | 14,228 | 14,444 | 14,676 | 16,124 | ||||||||||||||||||||||||||||||
NET CAPITALIZED COSTS AT YEAR END(3) |
||||||||||||||||||||||||||||||||||||||||
(millions of dollars) |
2008 | 2007 | 2006 | 2005 | 2004 | |||||||||||||||||||||||||||||||||||
United States |
18,542 | 16,948 | 16,530 | 16,097 | 16,217 | |||||||||||||||||||||||||||||||||||
Canada/South America(4) |
9,967 | 11,338 | 10,076 | 10,306 | 10,144 | |||||||||||||||||||||||||||||||||||
Europe |
11,477 | 15,426 | 15,182 | 13,556 | 16,169 | |||||||||||||||||||||||||||||||||||
Africa |
17,797 | 15,149 | 14,280 | 12,744 | 10,706 | |||||||||||||||||||||||||||||||||||
Asia Pacific/Middle East |
11,379 | 10,674 | 8,813 | 6,718 | 6,675 | |||||||||||||||||||||||||||||||||||
Russia/Caspian |
10,219 | 9,142 | 8,246 | 7,158 | 5,336 | |||||||||||||||||||||||||||||||||||
Total worldwide |
79,381 | 78,677 | 73,127 | 66,579 | 65,247 | |||||||||||||||||||||||||||||||||||
COSTS INCURRED IN PROPERTY ACQUISITION, EXPLORATION, AND DEVELOPMENT ACTIVITIES(3)
|
||||||||||||||||||||||||||||
| Canada/ | Asia Pacific/ | Russia/ | ||||||||||||||||||||||||||
| (millions of dollars) | United States | South America(4) | Europe | Africa | Middle East | Caspian | Worldwide | |||||||||||||||||||||
During 2008 |
||||||||||||||||||||||||||||
Property acquisition costs |
281 | 126 | 25 | 82 | 86 | 63 | 663 | |||||||||||||||||||||
Exploration costs |
453 | 325 | 401 | 686 | 346 | 61 | 2,272 | |||||||||||||||||||||
Development costs |
2,739 | 1,421 | 1,863 | 4,783 | 2,063 | 1,764 | 14,633 | |||||||||||||||||||||
Total |
3,473 | 1,872 | 2,289 | 5,551 | 2,495 | 1,888 | 17,568 | |||||||||||||||||||||
During 2007 |
||||||||||||||||||||||||||||
Property acquisition costs |
63 | 93 | — | 13 | 15 | 10 | 194 | |||||||||||||||||||||
Exploration costs |
377 | 231 | 229 | 584 | 261 | 80 | 1,762 | |||||||||||||||||||||
Development costs |
1,859 | 902 | 2,016 | 2,847 | 2,405 | 1,541 | 11,570 | |||||||||||||||||||||
Total |
2,299 | 1,226 | 2,245 | 3,444 | 2,681 | 1,631 | 13,526 | |||||||||||||||||||||
During 2006 |
||||||||||||||||||||||||||||
Property acquisition costs |
54 | 100 | 11 | 16 | 405 | 11 | 597 | |||||||||||||||||||||
Exploration costs |
382 | 225 | 202 | 518 | 219 | 139 | 1,685 | |||||||||||||||||||||
Development costs |
1,838 | 1,002 | 2,660 | 3,433 | 1,718 | 1,452 | 12,103 | |||||||||||||||||||||
Total |
2,274 | 1,327 | 2,873 | 3,967 | 2,342 | 1,602 | 14,385 | |||||||||||||||||||||
During 2005 |
||||||||||||||||||||||||||||
Property acquisition costs |
11 | 18 | — | 53 | 41 | 330 | 453 | |||||||||||||||||||||
Exploration costs |
286 | 134 | 152 | 507 | 181 | 160 | 1,420 | |||||||||||||||||||||
Development costs |
1,695 | 1,177 | 1,493 | 3,189 | 850 | 2,157 | 10,561 | |||||||||||||||||||||
Total |
1,992 | 1,329 | 1,645 | 3,749 | 1,072 | 2,647 | 12,434 | |||||||||||||||||||||
| (1) | A regional breakout of this data is included on page 15 of ExxonMobil’s 2008 Form 10-K. | |
| (2) | These include near-field and appraisal wells classified as exploratory for SEC reporting. | |
| (3) | Includes non-consolidated interests and Canadian oil sands mining operations and is not directly comparable to data in Appendix A of ExxonMobil’s 2009 Proxy Statement, or pages 8 and 9 of ExxonMobil’s 2008 Form 10-K, which due to financial reporting requirements treat Canadian oil sands as a mining operation. | |
| (4) | Canadian oil sands data included above: net acreage of 29,000 developed acres and 212,000
undeveloped acres at year-end 2008, net capitalized cost of about $3.3 billion at year-end 2008,
exploration costs of $19 million, and development costs of $514 million incurred during 2008. |
| EXXON MOBIL CORPORATION • 2008 FINANCIAL & OPERATING REVIEW | 67 |
| 2008 | 2007 | 2006 | 2005 | 2004 | ||||||||||||||||
| Liquids, Including Oil Sands and Non-Consolidated Reserves (millions of barrels at year end) | ||||||||||||||||||||
Net proved developed and undeveloped reserves |
||||||||||||||||||||
United States |
2,076 | 2,212 | 2,177 | 2,424 | 2,894 | |||||||||||||||
Canada/South America(2) |
2,717 | 1,564 | 1,985 | 2,152 | 2,326 | |||||||||||||||
Europe |
566 | 696 | 750 | 886 | 1,029 | |||||||||||||||
Africa |
2,004 | 2,180 | 2,266 | 2,527 | 2,654 | |||||||||||||||
Asia Pacific/Middle East |
2,967 | 2,976 | 2,765 | 1,908 | 1,688 | |||||||||||||||
Russia/Caspian |
1,502 | 1,632 | 1,766 | 1,798 | 1,922 | |||||||||||||||
Total worldwide excluding year-end price/cost effects |
11,832 | 11,260 | 11,709 | 11,695 | 12,513 | |||||||||||||||
Year-end price/cost effects |
174 | (186 | ) | (141 | ) | (466 | ) | (862 | ) | |||||||||||
Total worldwide |
12,006 | 11,074 | 11,568 | 11,229 | 11,651 | |||||||||||||||
Proportional interest in oil sands and non-consolidated
reserves included above, excluding year-end price/cost effects |
||||||||||||||||||||
United States |
368 | 374 | 369 | 391 | 402 | |||||||||||||||
Canada (oil sands)(2) |
1,871 | 694 | 718 | 738 | 757 | |||||||||||||||
Europe |
27 | 25 | 12 | 11 | 17 | |||||||||||||||
Asia Pacific/Middle East |
1,350 | 1,420 | 1,399 | 1,353 | 1,161 | |||||||||||||||
Russia/Caspian |
806 | 850 | 909 | 923 | 981 | |||||||||||||||
Net proved developed reserves included above |
||||||||||||||||||||
United States |
1,521 | 1,626 | 1,777 | 2,006 | 2,551 | |||||||||||||||
Canada/South America |
1,315 | 1,376 | 1,620 | 1,344 | 1,218 | |||||||||||||||
Europe |
419 | 526 | 568 | 665 | 778 | |||||||||||||||
Africa |
1,284 | 1,202 | 1,279 | 1,218 | 1,117 | |||||||||||||||
Asia Pacific/Middle East |
1,964 | 1,797 | 1,720 | 1,189 | 1,045 | |||||||||||||||
Russia/Caspian |
715 | 602 | 652 | 629 | 634 | |||||||||||||||
Total worldwide |
7,218 | 7,129 | 7,616 | 7,051 | 7,343 | |||||||||||||||
| Natural Gas, Including Non-Consolidated Reserves (billions of cubic feet at year end) | ||||||||||||||||||||
Net proved developed and undeveloped reserves |
||||||||||||||||||||
United States |
12,847 | 13,255 | 10,231 | 11,362 | 10,578 | |||||||||||||||
Canada/South America |
1,376 | 1,547 | 1,952 | 2,354 | 2,748 | |||||||||||||||
Europe |
17,097 | 18,539 | 18,847 | 20,575 | 21,916 | |||||||||||||||
Africa |
918 | 1,006 | 986 | 841 | 771 | |||||||||||||||
Asia Pacific/Middle East |
31,149 | 32,143 | 31,878 | 26,662 | 19,938 | |||||||||||||||
Russia/Caspian |
2,233 | 2,282 | 2,103 | 2,173 | 1,989 | |||||||||||||||
Total worldwide excluding year-end price/cost effects |
65,620 | 68,772 | 65,997 | 63,967 | 57,940 | |||||||||||||||
Year-end price/cost effects |
259 | (510 | ) | 1,563 | 2,940 | 2,422 | ||||||||||||||
Total worldwide |
65,879 | 68,262 | 67,560 | 66,907 | 60,362 | |||||||||||||||
Proportional interest in non-consolidated reserves included
above, excluding year-end price/cost effects |
||||||||||||||||||||
United States |
118 | 125 | 131 | 136 | 140 | |||||||||||||||
Europe |
11,644 | 12,189 | 11,867 | 12,340 | 12,873 | |||||||||||||||
Asia Pacific/Middle East |
21,199 | 21,596 | 20,800 | 18,697 | 13,339 | |||||||||||||||
Russia/Caspian |
1,446 | 1,504 | 1,290 | 1,326 | 1,473 | |||||||||||||||
Net proved developed reserves included above |
||||||||||||||||||||
United States |
7,931 | 8,477 | 9,389 | 10,499 | 9,254 | |||||||||||||||
Canada/South America |
1,148 | 1,303 | 1,628 | 1,840 | 1,926 | |||||||||||||||
Europe |
13,710 | 14,743 | 15,331 | 16,558 | 16,881 | |||||||||||||||
Africa |
738 | 773 | 823 | 376 | 279 | |||||||||||||||
Asia Pacific/Middle East |
17,996 | 14,272 | 13,788 | 13,343 | 9,018 | |||||||||||||||
Russia/Caspian |
1,226 | 1,152 | 1,258 | 1,062 | 841 | |||||||||||||||
Total worldwide |
42,749 | 40,720 | 42,217 | 43,678 | 38,199 | |||||||||||||||
| (1) | See Frequently Used Terms on pages 96 through 99. | |
| (2) | Includes proven reserves from Canadian oil sands operations in Canada and, therefore, is not
directly comparable to data shown in Appendix A of ExxonMobil’s 2009 Proxy Statement, which due to
financial reporting requirements treat Canadian oil sands as a mining operation. |
68 |
EXXON MOBIL CORPORATION • 2008 FINANCIAL & OPERATING REVIEW |
| Average | ||||||||||||||||||||||||
| 2008 | 2007 | 2006 | 2005 | 2004 | 2004-2008 | |||||||||||||||||||
Liquids (millions of barrels) |
||||||||||||||||||||||||
Revisions |
232 | 708 | 57 | (333 | ) | 97 | 152 | |||||||||||||||||
Improved recovery |
8 | 35 | 27 | 30 | 22 | 24 | ||||||||||||||||||
Extensions/discoveries |
1,297 | 197 | 246 | 516 | 595 | 570 | ||||||||||||||||||
Purchases |
— | — | 746 | 113 | 10 | 174 | ||||||||||||||||||
Sales |
(86 | ) | (436 | ) | (86 | ) | (227 | ) | (132 | ) | (193 | ) | ||||||||||||
Total additions before year-end price/cost effects |
1,451 | 504 | 990 | 99 | 592 | 727 | ||||||||||||||||||
Remove prior year-end price/cost effects |
186 | 141 | 466 | 862 | — | 331 | ||||||||||||||||||
Current year-end price/cost effects |
174 | (186 | ) | (141 | ) | (466 | ) | (862 | ) | (296 | ) | |||||||||||||
Total additions |
1,811 | 459 | 1,315 | 495 | (270 | ) | 762 | |||||||||||||||||
Production |
879 | 953 | 976 | 917 | 935 | 932 | ||||||||||||||||||
Reserves replacement ratio, excluding sales (percent) |
175 | 99 | 110 | 36 | 77 | 99 | ||||||||||||||||||
Reserves replacement ratio, including sales (percent) |
165 | 53 | 101 | 11 | 63 | 78 | ||||||||||||||||||
Reserves replacement ratio, including sales
and year-end price/cost effects (percent) |
206 | 48 | 135 | 54 | — | 82 | ||||||||||||||||||
Natural Gas (billions of cubic feet) |
||||||||||||||||||||||||
Revisions |
(127 | ) | 6,509 | 1,993 | 4,261 | 256 | 2,578 | |||||||||||||||||
Improved recovery |
1 | 4 | 12 | 9 | 37 | 13 | ||||||||||||||||||
Extensions/discoveries |
693 | 323 | 3,808 | 5,667 | 7,282 | 3,555 | ||||||||||||||||||
Purchases |
— | 9 | 57 | 53 | 9 | 25 | ||||||||||||||||||
Sales |
(82 | ) | (320 | ) | (104 | ) | (229 | ) | (477 | ) | (242 | ) | ||||||||||||
Total additions before year-end price/cost effects |
485 | 6,525 | 5,766 | 9,761 | 7,107 | 5,929 | ||||||||||||||||||
Remove prior year-end price/cost effects |
510 | (1,563 | ) | (2,940 | ) | (2,422 | ) | — | (1,283 | ) | ||||||||||||||
Current year-end price/cost effects |
259 | (510 | ) | 1,563 | 2,940 | 2,422 | 1,335 | |||||||||||||||||
Total additions |
1,254 | 4,452 | 4,389 | 10,279 | 9,529 | 5,981 | ||||||||||||||||||
Production |
3,637 | 3,750 | 3,736 | 3,734 | 3,936 | 3,759 | ||||||||||||||||||
Reserves replacement ratio, excluding sales (percent) |
16 | 183 | 157 | 268 | 193 | 164 | ||||||||||||||||||
Reserves replacement ratio, including sales (percent) |
13 | 174 | 154 | 261 | 181 | 158 | ||||||||||||||||||
Reserves replacement ratio, including sales
and year-end price/cost effects (percent) |
34 | 119 | 117 | 275 | 242 | 159 | ||||||||||||||||||
Oil-Equivalent (millions of barrels) |
||||||||||||||||||||||||
Revisions |
211 | 1,793 | 390 | 377 | 140 | 582 | ||||||||||||||||||
Improved recovery |
8 | 35 | 29 | 31 | 28 | 26 | ||||||||||||||||||
Extensions/discoveries |
1,413 | 251 | 881 | 1,461 | 1,809 | 1,163 | ||||||||||||||||||
Purchases |
— | 2 | 755 | 122 | 11 | 178 | ||||||||||||||||||
Sales |
(100 | ) | (490 | ) | (104 | ) | (265 | ) | (211 | ) | (234 | ) | ||||||||||||
Total additions before year-end price/cost effects |
1,532 | 1,591 | 1,951 | 1,726 | 1,777 | 1,715 | ||||||||||||||||||
Remove prior year-end price/cost effects |
271 | (119 | ) | (24 | ) | 458 | — | 118 | ||||||||||||||||
Current year-end price/cost effects |
217 | (271 | ) | 119 | 24 | (459 | ) | (74 | ) | |||||||||||||||
Total additions |
2,020 | 1,201 | 2,046 | 2,208 | 1,318 | 1,759 | ||||||||||||||||||
Production |
1,485 | 1,578 | 1,598 | 1,539 | 1,591 | 1,558 | ||||||||||||||||||
Reserves replacement ratio, excluding sales (percent) |
110 | 132 | 129 | 129 | 125 | 125 | ||||||||||||||||||
Reserves replacement ratio, including sales (percent) |
103 | 101 | 122 | 112 | 112 | 110 | ||||||||||||||||||
Reserves replacement ratio, including sales
and year-end price/cost effects (percent) |
136 | 76 | 128 | 143 | 83 | 113 | ||||||||||||||||||
| Crude Oil and Natural Gas Liquids (millions of barrels) | Natural Gas (billions of cubic feet) | |||||||||||||||||||||||||||||||||||||||||||||||||||||||
| Asia | Asia | |||||||||||||||||||||||||||||||||||||||||||||||||||||||
| Canada/ | Pacific/ | Canada/ | Pacific/ | |||||||||||||||||||||||||||||||||||||||||||||||||||||
| United | South | Middle | Russia/ | United | South | Middle | Russia/ | |||||||||||||||||||||||||||||||||||||||||||||||||
| States | America | Europe | Africa | East | Caspian | Total | States | America | Europe | Africa | East | Caspian | Total | |||||||||||||||||||||||||||||||||||||||||||
Revisions |
(13 | ) | 94 | 51 | (1 | ) | 121 | (20 | ) | 232 | (63 | ) | 93 | 71 | (55 | ) | (204 | ) | 31 | (127 | ) | |||||||||||||||||||||||||||||||||||
Improved recovery |
8 | — | — | — | — | — | 8 | 1 | — | — | — | — | — | 1 | ||||||||||||||||||||||||||||||||||||||||||
Extensions/discoveries |
5 | 1,168 | 4 | 64 | 56 | — | 1,297 | 229 | 17 | 16 | 12 | 419 | — | 693 | ||||||||||||||||||||||||||||||||||||||||||
Purchases |
— | — | — | — | — | — | — | — | — | — | — | — | — | - | ||||||||||||||||||||||||||||||||||||||||||
Sales |
(4 | ) | (2 | ) | (28 | ) | — | — | (52 | ) | (86 | ) | (12 | ) | (17 | ) | (29 | ) | — | — | (24 | ) | (82 | ) | ||||||||||||||||||||||||||||||||
Total additions before year-end
price/cost effects |
(4 | ) | 1,260 | 27 | 63 | 177 | (72 | ) | 1,451 | 155 | 93 | 58 | (43 | ) | 215 | 7 | 485 | |||||||||||||||||||||||||||||||||||||||
Remove 2007 year-end price/cost effects |
(13 | ) | (69 | ) | (3 | ) | 122 | 38 | 111 | 186 | (43 | ) | (13 | ) | (313 | ) | — | 776 | 103 | 510 | ||||||||||||||||||||||||||||||||||||
2008 year-end price/cost effects |
(105 | ) | (34 | ) | (6 | ) | 133 | 105 | 81 | 174 | (957 | ) | 7 | 187 | — | 993 | 29 | 259 | ||||||||||||||||||||||||||||||||||||||
Total additions |
(122 | ) | 1,157 | 18 | 318 | 320 | 120 | 1,811 | (845 | ) | 87 | (68 | ) | (43 | ) | 1,984 | 139 | 1,254 | ||||||||||||||||||||||||||||||||||||||
Production |
132 | 107 | 157 | 239 | 186 | 58 | 879 | 562 | 263 | 1,501 | 45 | 1,209 | 57 | 3,637 | ||||||||||||||||||||||||||||||||||||||||||
Net change |
(254 | ) | 1,050 | (139 | ) | 79 | 134 | 62 | 932 | (1,407 | ) | (176 | ) | (1,569 | ) | (88 | ) | 775 | 82 | (2,383 | ) | |||||||||||||||||||||||||||||||||||
Reserves replacement ratio,
excluding sales (percent) |
— | 1,179 | 35 | 26 | 95 | — | 175 | 30 | 42 | 6 | — | 18 | 54 | 16 | ||||||||||||||||||||||||||||||||||||||||||
Reserves replacement ratio,
including sales (percent) |
— | 1,178 | 17 | 26 | 95 | — | 165 | 28 | 35 | 4 | — | 18 | 12 | 13 | ||||||||||||||||||||||||||||||||||||||||||
Reserves replacement ratio, including
sales and year-end price/cost
effects (percent) |
— | 1,081 | 11 | 133 | 172 | 207 | 206 | — | 33 | — | — | 164 | 244 | 34 | ||||||||||||||||||||||||||||||||||||||||||
| See footnotes on page 69. |
||
| EXXON MOBIL CORPORATION • 2008 FINANCIAL & OPERATING REVIEW | 69 |
| Average | ||||||||||||||||||||||||
| 2008 | 2007 | 2006 | 2005 | 2004 | 2004-2008 | |||||||||||||||||||
Non-U.S. |
||||||||||||||||||||||||
E&P costs (millions of dollars) |
14,095 | 11,227 | 12,111 | 10,442 | 8,683 | 11,312 | ||||||||||||||||||
Oil reserves additions |
1,933 | 368 | 1,417 | 794 | (246 | ) | 853 | |||||||||||||||||
Oil production |
747 | 812 | 827 | 747 | 737 | 774 | ||||||||||||||||||
Gas reserves additions |
2,099 | 2,685 | 5,319 | 8,145 | 7,626 | 5,175 | ||||||||||||||||||
Gas production |
3,075 | 3,101 | 3,018 | 2,959 | 3,077 | 3,046 | ||||||||||||||||||
Oil-equivalent reserves additions, excluding sales |
1,604 | 1,281 | 2,172 | 1,918 | 1,974 | 1,790 | ||||||||||||||||||
Oil-equivalent reserves additions, including sales |
1,510 | 803 | 2,118 | 1,766 | 1,900 | 1,619 | ||||||||||||||||||
Oil-equivalent reserves additions,
including sales and price/cost effects |
2,283 | 815 | 2,303 | 2,151 | 1,025 | 1,716 | ||||||||||||||||||
Oil-equivalent production |
1,259 | 1,329 | 1,330 | 1,240 | 1,250 | 1,282 | ||||||||||||||||||
Reserves replacement ratio, excluding sales (percent) |
127 | 96 | 163 | 155 | 158 | 140 | ||||||||||||||||||
Reserves replacement ratio, including sales (percent) |
120 | 60 | 159 | 142 | 152 | 126 | ||||||||||||||||||
Reserves replacement ratio, including sales
and year-end price/cost effects (percent) |
181 | 61 | 173 | 173 | 82 | 134 | ||||||||||||||||||
Reserves replacement costs(4) (dollars per barrel) |
8.79 | 8.76 | 5.58 | 5.44 | 4.40 | 6.32 | ||||||||||||||||||
United States |
||||||||||||||||||||||||
E&P costs (millions of dollars) |
3,473 | 2,299 | 2,274 | 1,992 | 1,828 | 2,373 | ||||||||||||||||||
Oil reserves additions |
(122 | ) | 91 | (102 | ) | (299 | ) | (24 | ) | (91 | ) | |||||||||||||
Oil production |
132 | 141 | 149 | 170 | 198 | 158 | ||||||||||||||||||
Gas reserves additions |
(845 | ) | 1,767 | (930 | ) | 2,134 | 1,903 | 806 | ||||||||||||||||
Gas production |
562 | 649 | 718 | 775 | 859 | 713 | ||||||||||||||||||
Oil-equivalent reserves additions, excluding sales |
28 | 800 | (117 | ) | 73 | 14 | 159 | |||||||||||||||||
Oil-equivalent reserves additions, including sales |
22 | 788 | (167 | ) | (40 | ) | (123 | ) | 96 | |||||||||||||||
Oil-equivalent reserves additions, including sales
and year-end price/cost effects |
(263 | ) | 386 | (257 | ) | 57 | 293 | 43 | ||||||||||||||||
Oil-equivalent production |
226 | 249 | 268 | 299 | 341 | 276 | ||||||||||||||||||
Reserves replacement ratio, excluding sales (percent) |
12 | 321 | — | 24 | 4 | 58 | ||||||||||||||||||
Reserves replacement ratio, including sales (percent) |
10 | 316 | — | — | — | 35 | ||||||||||||||||||
Reserves replacement ratio, including sales
and year-end price/cost effects (percent) |
— | 155 | — | 19 | 86 | 16 | ||||||||||||||||||
Reserves replacement costs(4) (dollars per barrel) |
124.04 | 2.87 | — | 27.29 | 130.57 | 14.92 | ||||||||||||||||||
Worldwide |
||||||||||||||||||||||||
E&P costs (millions of dollars) |
17,568 | 13,526 | 14,385 | 12,434 | 10,511 | 13,685 | ||||||||||||||||||
Oil reserves additions |
1,811 | 459 | 1,315 | 495 | (270 | ) | 762 | |||||||||||||||||
Oil production |
879 | 953 | 976 | 917 | 935 | 932 | ||||||||||||||||||
Gas reserves additions |
1,254 | 4,452 | 4,389 | 10,279 | 9,529 | 5,981 | ||||||||||||||||||
Gas production |
3,637 | 3,750 | 3,736 | 3,734 | 3,936 | 3,759 | ||||||||||||||||||
Oil-equivalent reserves additions, excluding sales |
1,632 | 2,081 | 2,055 | 1,991 | 1,988 | 1,949 | ||||||||||||||||||
Oil-equivalent reserves additions, including sales |
1,532 | 1,591 | 1,951 | 1,726 | 1,777 | 1,715 | ||||||||||||||||||
Oil-equivalent reserves additions,
including sales and price/cost effects |
2,020 | 1,201 | 2,046 | 2,208 | 1,318 | 1,759 | ||||||||||||||||||
Oil-equivalent production |
1,485 | 1,578 | 1,598 | 1,539 | 1,591 | 1,558 | ||||||||||||||||||
Reserves replacement ratio, excluding sales (percent) |
110 | 132 | 129 | 129 | 125 | 125 | ||||||||||||||||||
Reserves replacement ratio, including sales (percent) |
103 | 101 | 122 | 112 | 112 | 110 | ||||||||||||||||||
Reserves replacement ratio, including sales
and year-end price/cost effects (percent) |
136 | 76 | 128 | 143 | 83 | 113 | ||||||||||||||||||
Reserves replacement costs(4) (dollars per barrel) |
10.76 | 6.50 | 7.00 | 6.25 | 5.29 | 7.02 | ||||||||||||||||||
| (1) | The data shown above and on the preceding page include reserves, production, and costs from non-consolidated interests and Canadian oil sands operations. This is a more complete summary of ExxonMobil’s exploration and production operations than the data in Appendix A of ExxonMobil’s 2009 Proxy Statement, which due to financial reporting requirements, treat Canadian oil sands as a mining operation. | |
| (2) | See Frequently Used Terms on pages 96 through 99. | |
| (3) | The term “sales” includes the impact of expropriation of proved reserves in Venezuela (462 million oil-equivalent barrels) in 2007. | |
| (4) | Calculation based on exploration and production costs divided by oil-equivalent reserves additions. All values exclude the impact of asset sales; i.e., reserves sold and proceeds received; and price/cost related effects associated with using December 31 prices and costs. |
70 |
EXXON MOBIL CORPORATION • 2008 FINANCIAL & OPERATING REVIEW |
| Total Revenues and Costs, Including Non-Consolidated Interests and Oil Sands | Revenues and Costs per Unit of Sales or Production(1) | |||||||||||||||||||||||||||||||||||||||||||
| Asia | ||||||||||||||||||||||||||||||||||||||||||||
| Canada/ | Pacific/ | Canada/ | ||||||||||||||||||||||||||||||||||||||||||
| United | South | Middle | Russia/ | United | South | Outside | ||||||||||||||||||||||||||||||||||||||
| States | America | Europe | Africa | East | Caspian | Total | States | America | Americas | Worldwide | ||||||||||||||||||||||||||||||||||
| 2008 | (millions of dollars) |
(dollars per unit of sales) |
||||||||||||||||||||||||||||||||||||||||||
Revenue |
||||||||||||||||||||||||||||||||||||||||||||
Crude oil and NGL |
11,788 | 8,540 | 13,910 | 20,606 | 17,095 | 5,304 | 77,243 | 87.95 | 81.43 | 91.66 | 89.84 | |||||||||||||||||||||||||||||||||
Natural gas |
3,296 | 1,834 | 15,230 | 39 | 7,327 | 67 | 27,793 | 7.23 | 7.82 | 8.59 | 8.35 | |||||||||||||||||||||||||||||||||
| (dollars
per barrel of net oil-equivalent production) |
||||||||||||||||||||||||||||||||||||||||||||
Total revenue |
15,084 | 10,374 | 29,140 | 20,645 | 24,422 | 5,371 | 105,036 | 71.73 | 71.23 | 73.74 | 73.19 | |||||||||||||||||||||||||||||||||
Less costs: |
||||||||||||||||||||||||||||||||||||||||||||
Production costs
excluding taxes |
2,675 | 2,625 | 3,051 | 1,603 | 1,267 | 457 | 11,678 | 12.72 | 18.03 | 5.91 | 8.14 | |||||||||||||||||||||||||||||||||
Depreciation and depletion |
1,427 | 1,043 | 2,662 | 2,471 | 906 | 504 | 9,013 | 6.79 | 7.16 | 6.06 | 6.28 | |||||||||||||||||||||||||||||||||
Exploration expenses |
189 | 251 | 183 | 439 | 341 | 60 | 1,463 | 0.90 | 1.72 | 0.95 | 1.02 | |||||||||||||||||||||||||||||||||
Taxes other than income |
2,021 | 81 | 4,248 | 1,815 | 6,017 | 105 | 14,287 | 9.61 | 0.55 | 11.29 | 9.95 | |||||||||||||||||||||||||||||||||
Related income tax |
3,191 | 1,813 | 11,979 | 8,119 | 9,926 | 1,164 | 36,192 | 15.17 | 12.45 | 28.90 | 25.22 | |||||||||||||||||||||||||||||||||
Results of producing activities |
5,581 | 4,561 | 7,017 | 6,198 | 5,965 | 3,081 | 32,403 | 26.54 | 31.32 | 20.63 | 22.58 | |||||||||||||||||||||||||||||||||
Other earnings(2) |
687 | (997 | ) | 2,860 | 212 | (4 | ) | (12 | ) | 2,746 | 3.27 | (6.85 | ) | 2.83 | 1.91 | |||||||||||||||||||||||||||||
Total earnings, excluding
power and coal |
6,268 | 3,564 | 9,877 | 6,410 | 5,961 | 3,069 | 35,149 | 29.81 | 24.47 | 23.46 | 24.49 | |||||||||||||||||||||||||||||||||
Power and coal |
(25 | ) | — | — | — | 278 | — | 253 | ||||||||||||||||||||||||||||||||||||
Total earnings |
6,243 | 3,564 | 9,877 | 6,410 | 6,239 | 3,069 | 35,402 | |||||||||||||||||||||||||||||||||||||
| 2007 | (millions of dollars) |
(dollars per unit of sales) |
||||||||||||||||||||||||||||||||||||||||||
Revenue |
||||||||||||||||||||||||||||||||||||||||||||
Crude oil and NGL |
8,997 | 6,569 | 11,986 | 17,834 | 13,153 | 4,477 | 63,016 | 62.86 | 55.27 | 69.32 | 66.58 | |||||||||||||||||||||||||||||||||
Natural gas |
3,176 | 1,704 | 9,911 | 21 | 5,117 | 46 | 19,975 | 5.93 | 5.77 | 5.82 | 5.83 | |||||||||||||||||||||||||||||||||
| (dollars per barrel of net oil-equivalent production) |
||||||||||||||||||||||||||||||||||||||||||||
Total revenue |
12,173 | 8,273 | 21,897 | 17,855 | 18,270 | 4,523 | 82,991 | 52.42 | 49.40 | 55.55 | 54.40 | |||||||||||||||||||||||||||||||||
Less costs: |
||||||||||||||||||||||||||||||||||||||||||||
Production costs
excluding taxes |
2,275 | 2,206 | 3,243 | 1,180 | 1,046 | 383 | 10,333 | 9.80 | 13.17 | 5.20 | 6.77 | |||||||||||||||||||||||||||||||||
Depreciation and depletion |
1,493 | 1,256 | 2,657 | 2,101 | 861 | 540 | 8,908 | 6.43 | 7.50 | 5.47 | 5.85 | |||||||||||||||||||||||||||||||||
Exploration expenses |
282 | 273 | 170 | 470 | 226 | 81 | 1,502 | 1.21 | 1.63 | 0.84 | 0.98 | |||||||||||||||||||||||||||||||||
Taxes other than income |
1,347 | 126 | 2,528 | 1,599 | 4,045 | 86 | 9,731 | 5.80 | 0.75 | 7.33 | 6.38 | |||||||||||||||||||||||||||||||||
Related income tax |
2,429 | 1,190 | 8,190 | 7,263 | 7,437 | 1,034 | 27,543 | 10.46 | 7.11 | 21.25 | 18.05 | |||||||||||||||||||||||||||||||||
Results of producing activities |
4,347 | 3,222 | 5,109 | 5,242 | 4,655 | 2,399 | 24,974 | 18.72 | 19.24 | 15.46 | 16.37 | |||||||||||||||||||||||||||||||||
Other earnings(2) |
609 | (504 | ) | 944 | 277 | (48 | ) | 34 | 1,312 | 2.62 | (3.01 | ) | 1.07 | 0.86 | ||||||||||||||||||||||||||||||
Total earnings, excluding
power and coal |
4,956 | 2,718 | 6,053 | 5,519 | 4,607 | 2,433 | 26,286 | 21.34 | 16.23 | 16.53 | 17.23 | |||||||||||||||||||||||||||||||||
Power and coal |
(86 | ) | — | — | — | 297 | — | 211 | ||||||||||||||||||||||||||||||||||||
Total earnings |
4,870 | 2,718 | 6,053 | 5,519 | 4,904 | 2,433 | 26,497 | |||||||||||||||||||||||||||||||||||||
| (1) | The per unit data is divided into two sections: (a) revenue per unit of sales from ExxonMobil’s
own production; and, (b) operating costs and earnings per unit of net oil-equivalent production.
Units for crude oil and natural gas liquids (NGL) are barrels, while units for natural gas are
thousands of cubic feet. The volumes of crude oil and natural gas liquids production and net
natural gas production available for sale used in this calculation are shown on pages 64 and 65.
The volumes of natural gas were converted to oil-equivalent barrels based on a conversion factor of
6 thousand cubic feet per barrel. |
|
| (2) | Includes earnings related to transportation operations, LNG liquefaction and transportation operations, sale of third-party purchases, technical services agreements, other nonoperating activities, and adjustments for minority interests. |
| EXXON MOBIL CORPORATION • 2008 FINANCIAL & OPERATING REVIEW | 71 |
| Total Revenues and Costs, Including Non-Consolidated Interests and Oil Sands | Revenues and Costs per Unit of Sales or Production(1) | |||||||||||||||||||||||||||||||||||||||||||
| Asia | ||||||||||||||||||||||||||||||||||||||||||||
| Canada/ | Pacific/ | Canada/ | ||||||||||||||||||||||||||||||||||||||||||
| United | South | Middle | Russia/ | United | South | Outside | ||||||||||||||||||||||||||||||||||||||
| States | America | Europe | Africa | East | Caspian | Total | States | America | Americas | Worldwide | ||||||||||||||||||||||||||||||||||
| 2006 | (millions of dollars) | (dollars per unit of sales) |
||||||||||||||||||||||||||||||||||||||||||
Revenue Crude oil and NGL |
8,417 | 6,405 | 11,069 | 17,253 | 11,027 | 2,569 | 56,740 | 55.63 | 50.42 | 60.90 | 58.70 | |||||||||||||||||||||||||||||||||
Natural gas |
3,689 | 1,984 | 11,333 | — | 4,225 | 38 | 21,269 | 6.22 | 5.81 | 6.31 | 6.24 | |||||||||||||||||||||||||||||||||
| (dollars per barrel of net oil-equivalent production) |
||||||||||||||||||||||||||||||||||||||||||||
Total revenue |
12,106 | 8,389 | 22,402 | 17,253 | 15,252 | 2,607 | 78,009 | 48.41 | 45.07 | 51.80 | 50.44 | |||||||||||||||||||||||||||||||||
Less costs: |
||||||||||||||||||||||||||||||||||||||||||||
Production costs
excluding taxes |
2,367 | 2,075 | 2,669 | 965 | 892 | 233 | 9,201 | 9.46 | 11.15 | 4.29 | 5.95 | |||||||||||||||||||||||||||||||||
Depreciation and depletion |
1,264 | 1,123 | 2,354 | 2,096 | 747 | 373 | 7,957 | 5.06 | 6.03 | 5.02 | 5.14 | |||||||||||||||||||||||||||||||||
Exploration expenses |
247 | 172 | 169 | 330 | 157 | 116 | 1,191 | 0.99 | 0.92 | 0.70 | 0.77 | |||||||||||||||||||||||||||||||||
Taxes other than income |
833 | 146 | 2,885 | 1,612 | 5,048 | 66 | 10,590 | 3.33 | 0.79 | 8.66 | 6.85 | |||||||||||||||||||||||||||||||||
Related income tax |
2,711 | 1,258 | 8,667 | 6,878 | 4,687 | 596 | 24,797 | 10.84 | 6.76 | 18.76 | 16.03 | |||||||||||||||||||||||||||||||||
Results of producing activities |
4,684 | 3,615 | 5,658 | 5,372 | 3,721 | 1,223 | 24,273 | 18.73 | 19.42 | 14.39 | 15.70 | |||||||||||||||||||||||||||||||||
Other earnings(2) |
503 | 112 | 891 | 122 | 39 | 3 | 1,670 | 2.01 | 0.60 | 0.95 | 1.08 | |||||||||||||||||||||||||||||||||
Total earnings, excluding
power and coal |
5,187 | 3,727 | 6,549 | 5,494 | 3,760 | 1,226 | 25,943 | 20.74 | 20.02 | 15.34 | 16.78 | |||||||||||||||||||||||||||||||||
Power and coal |
(19 | ) | — | — | — | 306 | — | 287 | ||||||||||||||||||||||||||||||||||||
Total earnings |
5,168 | 3,727 | 6,549 | 5,494 | 4,066 | 1,226 | 26,230 | |||||||||||||||||||||||||||||||||||||
| 2005 | (millions of dollars) |
(dollars per unit of sales) |
||||||||||||||||||||||||||||||||||||||||||
Revenue |
||||||||||||||||||||||||||||||||||||||||||||
Crude oil and NGL |
8,081 | 5,907 | 9,841 | 12,333 | 6,396 | 1,819 | 44,377 | 46.29 | 41.34 | 51.00 | 48.59 | |||||||||||||||||||||||||||||||||
Natural gas |
4,633 | 2,530 | 9,095 | — | 3,165 | 21 | 19,444 | 7.30 | 6.90 | 5.17 | 5.76 | |||||||||||||||||||||||||||||||||
| (dollars per barrel of net oil-equivalent production) |
||||||||||||||||||||||||||||||||||||||||||||
Total revenue |
12,714 | 8,437 | 18,936 | 12,333 | 9,561 | 1,840 | 63,821 | 45.41 | 41.08 | 42.74 | 43.02 | |||||||||||||||||||||||||||||||||
Less costs: |
||||||||||||||||||||||||||||||||||||||||||||
Production costs
excluding taxes |
1,786 | 1,887 | 2,461 | 840 | 624 | 209 | 7,807 | 6.38 | 9.19 | 4.14 | 5.26 | |||||||||||||||||||||||||||||||||
Depreciation and depletion |
1,291 | 1,095 | 2,362 | 1,319 | 716 | 199 | 6,982 | 4.61 | 5.33 | 4.60 | 4.71 | |||||||||||||||||||||||||||||||||
Exploration expenses |
158 | 150 | 77 | 310 | 122 | 164 | 981 | 0.56 | 0.73 | 0.67 | 0.66 | |||||||||||||||||||||||||||||||||
Taxes other than income |
761 | 64 | 2,113 | 1,158 | 2,501 | 57 | 6,654 | 2.72 | 0.31 | 5.84 | 4.49 | |||||||||||||||||||||||||||||||||
Related income tax |
3,138 | 1,815 | 7,130 | 5,143 | 2,596 | 411 | 20,233 | 11.21 | 8.84 | 15.31 | 13.64 | |||||||||||||||||||||||||||||||||
Results of producing activities |
5,580 | 3,426 | 4,793 | 3,563 | 3,002 | 800 | 21,164 | 19.93 | 16.68 | 12.18 | 14.26 | |||||||||||||||||||||||||||||||||
Other earnings(2) |
633 | (131 | ) | 2,101 | 166 | 6 | 109 | 2,884 | 2.26 | (0.64 | ) | 2.39 | 1.95 | |||||||||||||||||||||||||||||||
Total earnings, excluding
power and coal |
6,213 | 3,295 | 6,894 | 3,729 | 3,008 | 909 | 24,048 | 22.19 | 16.04 | 14.57 | 16.21 | |||||||||||||||||||||||||||||||||
Power and coal |
(13 | ) | — | — | — | 314 | — | 301 | ||||||||||||||||||||||||||||||||||||
Total earnings |
6,200 | 3,295 | 6,894 | 3,729 | 3,322 | 909 | 24,349 | |||||||||||||||||||||||||||||||||||||
| 2004 | (millions of dollars) | (dollars per unit of sales) |
||||||||||||||||||||||||||||||||||||||||||
Revenue |
||||||||||||||||||||||||||||||||||||||||||||
Crude oil and NGL |
7,119 | 4,610 | 7,647 | 7,301 | 5,071 | 1,061 | 32,809 | 34.92 | 31.33 | 35.76 | 34.88 | |||||||||||||||||||||||||||||||||
Natural gas |
3,943 | 1,900 | 7,642 | — | 2,629 | 18 | 16,132 | 5.53 | 4.86 | 4.10 | 4.47 | |||||||||||||||||||||||||||||||||
| (dollars per barrel of net oil-equivalent production) |
||||||||||||||||||||||||||||||||||||||||||||
Total revenue |
11,062 | 6,510 | 15,289 | 7,301 | 7,700 | 1,079 | 48,941 | 34.28 | 30.33 | 31.20 | 31.72 | |||||||||||||||||||||||||||||||||
Less costs: |
||||||||||||||||||||||||||||||||||||||||||||
Production costs
excluding taxes |
1,787 | 1,526 | 2,209 | 719 | 695 | 180 | 7,116 | 5.54 | 7.11 | 3.78 | 4.61 | |||||||||||||||||||||||||||||||||
Depreciation and depletion |
1,454 | 1,080 | 2,296 | 839 | 740 | 98 | 6,507 | 4.50 | 5.03 | 3.95 | 4.22 | |||||||||||||||||||||||||||||||||
Exploration expenses |
202 | 180 | 137 | 321 | 104 | 189 | 1,133 | 0.63 | 0.84 | 0.75 | 0.73 | |||||||||||||||||||||||||||||||||
Taxes other than income |
571 | 55 | 1,747 | 722 | 1,702 | 42 | 4,839 | 1.77 | 0.25 | 4.19 | 3.14 | |||||||||||||||||||||||||||||||||
Related income tax |
2,546 | 1,244 | 4,971 | 2,789 | 1,949 | 201 | 13,700 | 7.89 | 5.80 | 9.86 | 8.88 | |||||||||||||||||||||||||||||||||
Results of producing activities |
4,502 | 2,425 | 3,929 | 1,911 | 2,510 | 369 | 15,646 | 13.95 | 11.30 | 8.67 | 10.14 | |||||||||||||||||||||||||||||||||
Other earnings(2) |
458 | (320 | ) | 459 | 201 | (85 | ) | 13 | 726 | 1.42 | (1.49 | ) | 0.58 | 0.47 | ||||||||||||||||||||||||||||||
Total earnings, excluding
power and coal |
4,960 | 2,105 | 4,388 | 2,112 | 2,425 | 382 | 16,372 | 15.37 | 9.81 | 9.26 | 10.61 | |||||||||||||||||||||||||||||||||
Power and coal |
(12 | ) | — | — | — | 315 | — | 303 | ||||||||||||||||||||||||||||||||||||
Total earnings |
4,948 | 2,105 | 4,388 | 2,112 | 2,740 | 382 | 16,675 | |||||||||||||||||||||||||||||||||||||
| See footnotes on page 70. |
||
|
72 |
| • | Maintain best-in-class operations, in all respects |
| • | Provide quality, valued products and services to our customers |
| • | Lead industry in efficiency and effectiveness |
| • | Capitalize on integration with other ExxonMobil businesses |
| • | Selectively invest for resilient, advantaged returns |
| • | Maximize value from leading-edge technologies |
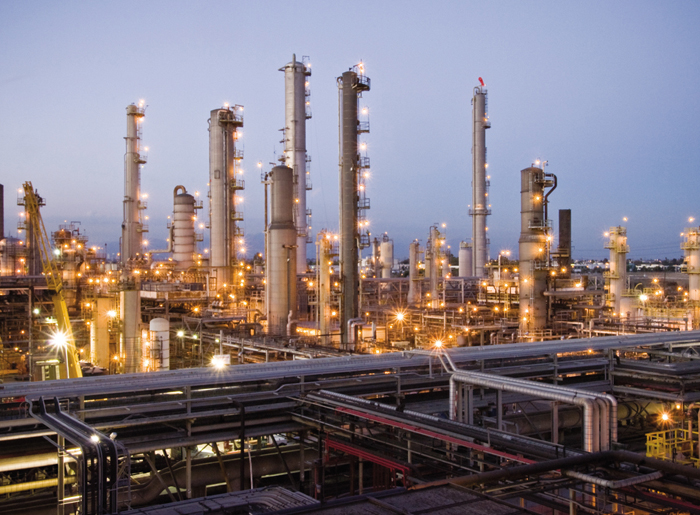
| EXXON MOBIL CORPORATION • 2008 FINANCIAL & OPERATING REVIEW | 73 |
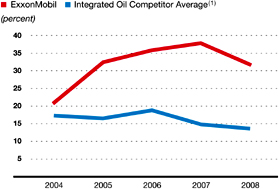
| DOWNSTREAM STATISTICAL RECAP | 2008 | 2007 | 2006 | 2005 | 2004 | |||||||||||||||
Earnings (millions of dollars) |
8,151 | 9,573 | 8,454 | 7,992 | 5,706 | |||||||||||||||
Refinery throughput (thousands of barrels per day) |
5,416 | 5,571 | 5,603 | 5,723 | 5,713 | |||||||||||||||
Petroleum product sales(1) (thousands of barrels per day) |
6,761 | 7,099 | 7,247 | 7,519 | 7,511 | |||||||||||||||
Average capital employed(2) (millions of dollars) |
25,627 | 25,314 | 23,628 | 24,680 | 27,173 | |||||||||||||||
Return on average capital employed(2) (percent) |
31.8 | 37.8 | 35.8 | 32.4 | 21.0 | |||||||||||||||
Capital expenditures (millions of dollars) |
3,529 | 3,303 | 2,729 | 2,495 | 2,405 | |||||||||||||||
| (1) | Petroleum product sales data are reported net of purchases/sales contracts with the same counterparty. | |
| (2) | See Frequently Used Terms on pages 96 through 99. |
74 |
EXXON MOBIL CORPORATION • 2008 FINANCIAL & OPERATING REVIEW |
Refinery Interests |
37 | |||
Distillation Capacity (barrels per day) |
6.2 million | |||
Lube Basestock Capacity (barrels per day) |
140 thousand | |||
Crude Oil and Product Tanker Interests (>1kDWT) |
11 | |||
Major Petroleum Products Terminals |
194 | |||

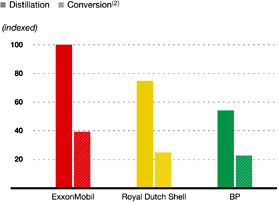
| (1) Royal Dutch Shell and BP values calculated on a consistent basis with ExxonMobil, based on public information. | ||
| (2) Conversion capacity includes catalytic cracking, hydrocracking, and coking. | ||
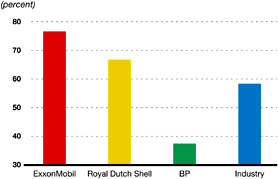
| (1) Royal Dutch Shell, BP, and Industry values calculated on a consistent basis with ExxonMobil, based on public information. | ||
| EXXON MOBIL CORPORATION • 2008 FINANCIAL & OPERATING REVIEW | 75 |
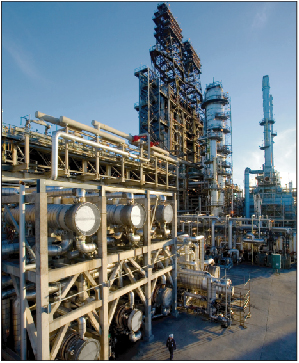
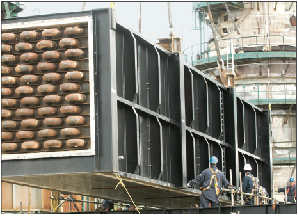
76 |
EXXON MOBIL CORPORATION • 2008 FINANCIAL & OPERATING REVIEW |
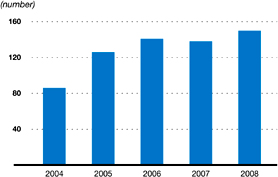
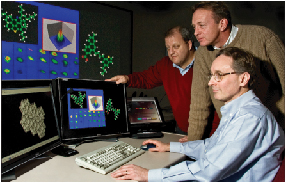
| EXXON MOBIL CORPORATION • 2008 FINANCIAL & OPERATING REVIEW | 77 |
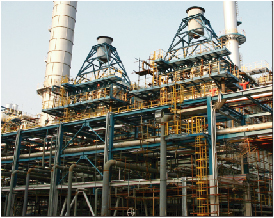
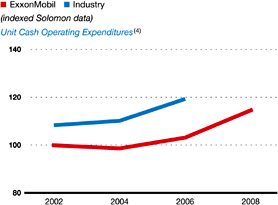
| (1) | Solomon Associates data available for even years only. | |
| (2) | Only even-year data plotted. | |
| (3) | 2008 data estimated by ExxonMobil. | |
| (4) | Constant foreign exchange rates and energy price. |
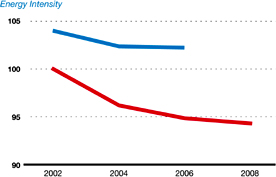
78 |
EXXON MOBIL CORPORATION • 2008 FINANCIAL & OPERATING REVIEW |
Service Stations |
29 thousand | |||
Commercial Customers |
1 million |
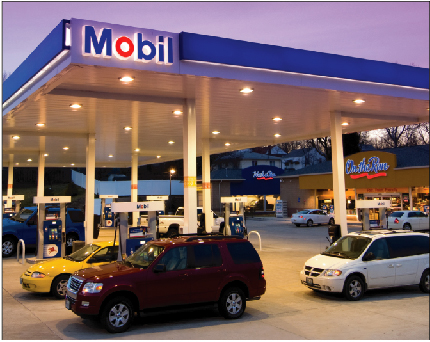
| EXXON MOBIL CORPORATION • 2008 FINANCIAL & OPERATING REVIEW | 79 |
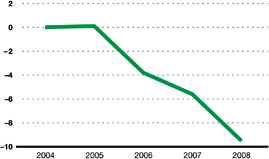
| (1) | Operating expenses shown at constant foreign exchange rates and energy price. |
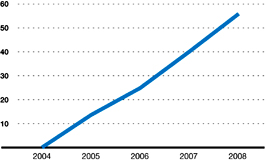
| (1) Sales volume per dollar of average capital employed shown at constant foreign exchange rates. | ||
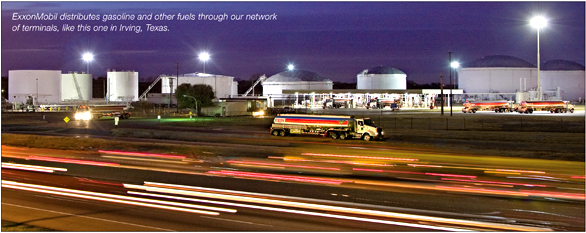
80 |
EXXON MOBIL CORPORATION • 2008 FINANCIAL & OPERATING REVIEW |
Lube Basestock Refineries |
12 | |||
Average Capacity per Lube Refinery |
2 times industry | |||
Blend Plants |
31 | |||
Lube Basestock Market Share(1) |
17 percent | |||
Finished Lubricant Market Share(1) |
11 percent |
| (1) | ExxonMobil estimates based on available industry data and public information. |
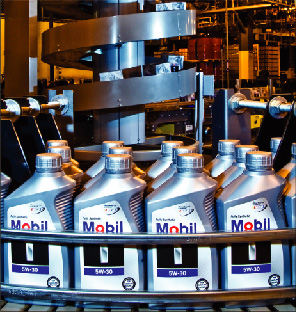
| EXXON MOBIL CORPORATION • 2008 FINANCIAL & OPERATING REVIEW | 81 |
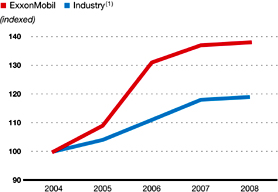
| (1) | ExxonMobil estimates based on available industry data and public information. |
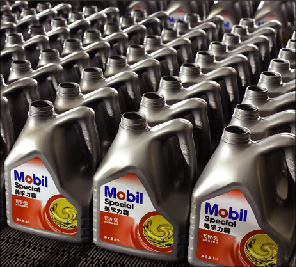

82 |
EXXON MOBIL CORPORATION • 2008 FINANCIAL & OPERATING REVIEW |
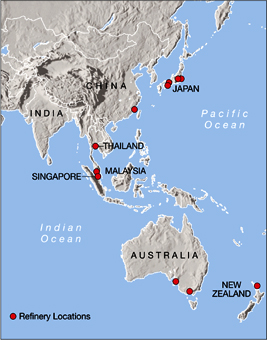
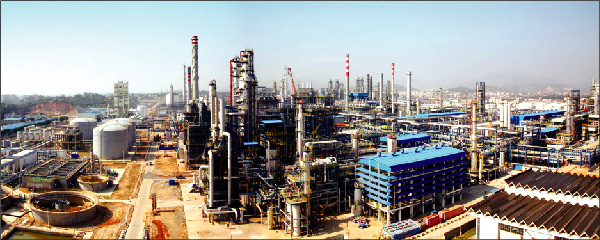
| EXXON MOBIL CORPORATION • 2008 FINANCIAL & OPERATING REVIEW | 83 |
| 2008 | 2007 | 2006 | 2005 | 2004 | ||||||||||||||||
Refinery Throughput(2) (thousands of barrels per day) |
||||||||||||||||||||
United States |
1,702 | 1,746 | 1,760 | 1,794 | 1,850 | |||||||||||||||
Canada |
446 | 442 | 442 | 466 | 468 | |||||||||||||||
Europe |
1,601 | 1,642 | 1,672 | 1,672 | 1,663 | |||||||||||||||
Japan |
563 | 618 | 649 | 691 | 685 | |||||||||||||||
Asia Pacific excluding Japan |
789 | 798 | 785 | 799 | 738 | |||||||||||||||
Latin America/Other |
315 | 325 | 295 | 301 | 309 | |||||||||||||||
Total worldwide |
5,416 | 5,571 | 5,603 | 5,723 | 5,713 | |||||||||||||||
Average Refinery Capacity(3) (thousands of barrels per day) |
||||||||||||||||||||
United States |
1,967 | 1,963 | 1,957 | 1,949 | 1,940 | |||||||||||||||
Canada |
502 | 502 | 502 | 502 | 502 | |||||||||||||||
Europe |
1,740 | 1,759 | 1,817 | 1,803 | 1,786 | |||||||||||||||
Japan |
702 | 769 | 769 | 769 | 772 | |||||||||||||||
Asia Pacific excluding Japan |
992 | 983 | 971 | 997 | 1,014 | |||||||||||||||
Latin America/Other |
330 | 330 | 329 | 323 | 317 | |||||||||||||||
Total worldwide |
6,233 | 6,306 | 6,345 | 6,343 | 6,331 | |||||||||||||||
Utilization of Refining Capacity (percent) |
||||||||||||||||||||
United States |
87 | 89 | 90 | 92 | 95 | |||||||||||||||
Canada |
89 | 88 | 88 | 93 | 93 | |||||||||||||||
Europe |
92 | 93 | 92 | 93 | 93 | |||||||||||||||
Japan |
80 | 80 | 84 | 90 | 89 | |||||||||||||||
Asia Pacific excluding Japan |
80 | 81 | 81 | 80 | 73 | |||||||||||||||
Latin America/Other |
95 | 98 | 90 | 93 | 97 | |||||||||||||||
Total worldwide |
87 | 88 | 88 | 90 | 90 | |||||||||||||||
| (1) | Excludes ExxonMobil’s minor interests in certain small refineries. | |
| (2) | Refinery throughput includes 100 percent of crude oil and feedstocks sent directly to atmospheric distillation units in operations of ExxonMobil and majority-owned subsidiaries. For companies owned 50 percent or less, throughput includes the greater of either crude and feedstocks processed for ExxonMobil or ExxonMobil’s equity interest in raw material inputs. | |
| (3) | Refinery capacity is the stream-day capability to process inputs to atmospheric distillation units under normal operating conditions, less the impact of shutdowns for regular repair and maintenance activities, averaged over an extended period of time. These annual averages include partial-year impacts for capacity additions or deletions during the year. Any idle capacity that cannot be made operable in a month or less has been excluded. Capacity volumes include 100 percent of the capacity of refinery facilities managed by ExxonMobil or majority-owned subsidiaries. At facilities of companies owned 50 percent or less, the greater of either that portion of capacity normally available to ExxonMobil or ExxonMobil’s equity interest is included. |
2008 |
Location | ||
Distillate Hydrotreater Upgrade |
Nanticoke, Canada | ||
Distillate Hydrotreater Upgrade |
Fos-sur-Mer, France | ||
Distillate Hydrotreater Upgrade |
Port-Jerome-Gravenchon, France | ||
Distillate Hydrotreater Upgrade |
Chalmette, Louisiana | ||
| 2009 and 2010 (Anticipated) | Location | ||
| Import Facilities | Campana, Argentina | ||
| Distillate Hydrotreater | Antwerp, Belgium | ||
| Distillate Hydrotreater Upgrade | Strathcona, Canada | ||
| Gasoil Hydrotreater and Hydrocracker | Fujian, China | ||
| Distillate Hydrotreater | Baton Rouge, Louisiana | ||
| Distillate Hydrotreater | Baytown, Texas |
84 |
EXXON MOBIL CORPORATION • 2008 FINANCIAL & OPERATING REVIEW |
| ExxonMobil | Capacity at 100% | ExxonMobil | ||||||||||||||||||||||||||||||||||
| Share | Atmospheric | Catalytic | Residuum | Interest | ||||||||||||||||||||||||||||||||
| (thousands of barrels per day) | KBD(2) | Distillation | Cracking | Hydrocracking | Conversion(3) | Lubricants(4) | % | |||||||||||||||||||||||||||||
United States |
||||||||||||||||||||||||||||||||||||
Torrance |
California | l | 150 | 150 | 96 | 21 | 52 | 0 | 100 | |||||||||||||||||||||||||||
Joliet |
Illinois | l | ▲ | 240 | 240 | 93 | 0 | 56 | 0 | 100 | ||||||||||||||||||||||||||
Baton Rouge |
Louisiana | n | l | 503 | 503 | 230 | 27 | 115 | 16 | 100 | ||||||||||||||||||||||||||
Chalmette |
Louisiana | l | ▲ | 97 | 193 | 68 | 19 | 38 | 0 | 50 | ||||||||||||||||||||||||||
Billings |
Montana | l | 60 | 60 | 21 | 6 | 10 | 0 | 100 | |||||||||||||||||||||||||||
Baytown |
Texas | n | l | 573 | 573 | 205 | 26 | 88 | 22 | 100 | ||||||||||||||||||||||||||
Beaumont |
Texas | n | l | 345 | 345 | 113 | 60 | 46 | 10 | 100 | ||||||||||||||||||||||||||
Total United States |
1,968 | 2,064 | 826 | 159 | 405 | 48 | ||||||||||||||||||||||||||||||
Canada |
||||||||||||||||||||||||||||||||||||
Strathcona |
Alberta | 187 | 187 | 63 | 0 | 0 | 2 | 69.6 | ||||||||||||||||||||||||||||
Dartmouth |
Nova Scotia | ▲ | 82 | 82 | 31 | 0 | 0 | 0 | 69.6 | |||||||||||||||||||||||||||
Nanticoke |
Ontario | ▲ | 112 | 112 | 48 | 0 | 0 | 0 | 69.6 | |||||||||||||||||||||||||||
Sarnia |
Ontario | n | l | 121 | 121 | 30 | 18 | 25 | 6 | 69.6 | ||||||||||||||||||||||||||
Total Canada |
502 | 502 | 172 | 18 | 25 | 8 | ||||||||||||||||||||||||||||||
Europe |
||||||||||||||||||||||||||||||||||||
Antwerp |
Belgium | n | l | 305 | 305 | 35 | 0 | 0 | 0 | 100 | ||||||||||||||||||||||||||
Dunkirk |
France | 0 | 0 | 0 | 0 | 0 | 6 | 50 | ||||||||||||||||||||||||||||
Fos-sur-Mer |
France | l | ▲ | 119 | 119 | 31 | 0 | 0 | 0 | 82.9 | ||||||||||||||||||||||||||
Port-Jerome-Gravenchon |
France | n | l | 233 | 233 | 38 | 0 | 0 | 13 | 82.9 | ||||||||||||||||||||||||||
Karlsruhe |
Germany | l | ▲ | 78 | 310 | 86 | 0 | 26 | 0 | 25 | ||||||||||||||||||||||||||
Augusta |
Italy | l | ▲ | 198 | 198 | 47 | 0 | 0 | 14 | 100 | ||||||||||||||||||||||||||
Trecate |
Italy | l | ▲ | 174 | 174 | 34 | 0 | 0 | 0 | 75.4 | ||||||||||||||||||||||||||
Rotterdam |
The Netherlands | n | l | 191 | 191 | 0 | 52 | 41 | 0 | 100 | ||||||||||||||||||||||||||
Slagen |
Norway | 116 | 116 | 0 | 0 | 32 | 0 | 100 | ||||||||||||||||||||||||||||
Fawley |
United Kingdom | n | l | 326 | 326 | 89 | 0 | 37 | 9 | 100 | ||||||||||||||||||||||||||
Total Europe |
1,740 | 1,972 | 360 | 52 | 136 | 42 | ||||||||||||||||||||||||||||||
Japan |
||||||||||||||||||||||||||||||||||||
Chiba |
Japan | l | 88 | 175 | 34 | 40 | 0 | 0 | 50 | |||||||||||||||||||||||||||
Kawasaki(5) |
Japan | n | l | 296 | 296 | 88 | 23 | 0 | 0 | 50 | ||||||||||||||||||||||||||
Sakai(5) |
Japan | l | ▲ | 139 | 139 | 40 | 0 | 0 | 0 | 50 | ||||||||||||||||||||||||||
Wakayama(5) |
Japan | l | ▲ | 155 | 155 | 37 | 0 | 0 | 7 | 50 | ||||||||||||||||||||||||||
Total Japan |
678 | 765 | 199 | 63 | 0 | 7 | ||||||||||||||||||||||||||||||
| n | Integrated refinery and chemical complex | |
| l | Cogeneration capacity | |
| ▲ | Refineries with some chemical production | |
| (1) | Capacity data is based on 100 percent of rated refinery process unit stream-day capacities under normal operating conditions, less the impact of shutdowns for regular repair and maintenance activities, averaged over an extended period of time. | |
| (2) | ExxonMobil share reflects 100 percent of atmospheric distillation capacity in operations of ExxonMobil and majority-owned subsidiaries. For companies owned 50 percent or less, ExxonMobil share is the greater of ExxonMobil’s equity interest or that portion of distillation capacity normally available to ExxonMobil. | |
| (3) | Includes thermal cracking, visbreaking, coking, and hydrorefining processes. | |
| (4) | Lubes capacity based on dewaxed oil production. | |
| (5) | Operated by majority-owned subsidiaries. | |
| (6) | Facility mothballed. |
| EXXON MOBIL CORPORATION • 2008 FINANCIAL & OPERATING REVIEW | 85 |
| ExxonMobil | Capacity at 100% | ExxonMobil | ||||||||||||||||||||||||||||||||||||||||
| Share | Atmospheric | Catalytic | Residuum | Interest | ||||||||||||||||||||||||||||||||||||||
| (thousands of barrels per day) | KBD(2) | Distillation | Cracking | Hydrocracking | Conversion(3) | Lubricants(4) | % | |||||||||||||||||||||||||||||||||||
| Asia Pacific excluding Japan | ||||||||||||||||||||||||||||||||||||||||||
Adelaide(6) |
Australia | 0 | 0 | 0 | 0 | 0 | 0 | 100 | ||||||||||||||||||||||||||||||||||
Altona |
Australia | 78 | 78 | 29 | 0 | 0 | 0 | 100 | ||||||||||||||||||||||||||||||||||
Fujian |
China | ▲ | 20 | 80 | 28 | 0 | 10 | 0 | 25 | |||||||||||||||||||||||||||||||||
Port Dickson |
Malaysia | 86 | 86 | 0 | 0 | 0 | 0 | 65 | ||||||||||||||||||||||||||||||||||
Whangerei |
New Zealand | 29 | 107 | 0 | 30 | 0 | 0 | 19.2 | ||||||||||||||||||||||||||||||||||
Jurong/PAC |
Singapore | n | l | 605 | 605 | 0 | 34 | 106 | 38 | 100 | ||||||||||||||||||||||||||||||||
Sriracha |
Thailand | n | l | 174 | 174 | 42 | 0 | 0 | 0 | 66 | ||||||||||||||||||||||||||||||||
Total Asia Pacific excluding Japan |
992 | 1,130 | 99 | 64 | 116 | 38 | ||||||||||||||||||||||||||||||||||||
| Latin America/Other | ||||||||||||||||||||||||||||||||||||||||||
Campana |
Argentina | l | ▲ | 86 | 86 | 27 | 0 | 24 | 0 | 100 | ||||||||||||||||||||||||||||||||
Acajutla |
El Salvador | 22 | 22 | 0 | 0 | 0 | 0 | 65 | ||||||||||||||||||||||||||||||||||
Martinique |
Martinique | 2 | 17 | 0 | 0 | 0 | 0 | 14.5 | ||||||||||||||||||||||||||||||||||
Managua |
Nicaragua | ▲ | 20 | 20 | 0 | 0 | 0 | 0 | 100 | |||||||||||||||||||||||||||||||||
Yanbu |
Saudi Arabia | 200 | 400 | 91 | 0 | 46 | 0 | 50 | ||||||||||||||||||||||||||||||||||
Total Latin America/Other |
330 | 545 | 118 | 0 | 70 | 0 | ||||||||||||||||||||||||||||||||||||
| Total worldwide | 6,210 | 6,978 | 1,774 | 356 | 752 | 143 | ||||||||||||||||||||||||||||||||||||
| n | Integrated refinery and chemical complex | |
| l | Cogeneration capacity | |
| ▲ | Refineries with some chemical production | |
| (1) | Capacity data is based on 100 percent of rated refinery process unit stream-day capacities under normal operating conditions, less the impact of shutdowns for regular repair and maintenance activities, averaged over an extended period of time. | |
| (2) | ExxonMobil share reflects 100 percent of atmospheric distillation capacity in operations of ExxonMobil and majority-owned subsidiaries. For companies owned 50 percent or less, ExxonMobil share is the greater of ExxonMobil’s equity interest or that portion of distillation capacity normally available to ExxonMobil. | |
| (3) | Includes thermal cracking, visbreaking, coking, and hydrorefining processes. | |
| (4) | Lubes capacity based on dewaxed oil production. | |
| (5) | Operated by majority-owned subsidiaries. | |
| (6) | Facility mothballed. | |
Distillation Capacity(1)
|
Conversion Capacity(1) | |
(millions of barrels per day)
|
(millions of barrels per day) | |
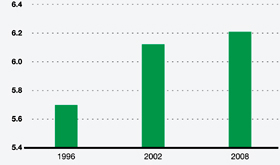
|
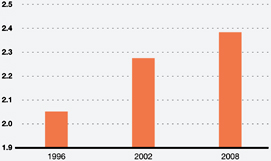 |
|
(1) ExxonMobil capacity share, excluding divestments and acquisitions.
|
(1) ExxonMobil capacity share, excluding divestments and acquisitions. Conversion includes catalytic cracking, hydrocracking, and coking. | |
86 |
EXXON MOBIL CORPORATION • 2008 FINANCIAL & OPERATING REVIEW |
| (thousands of barrels per day) | 2008 | 2007 | 2006 | 2005 | 2004(2) | |||||||||||||||
United States |
||||||||||||||||||||
Motor gasoline, naphthas |
1,449 | 1,601 | 1,598 | 1,646 | 1,695 | |||||||||||||||
Heating oils, kerosene, diesel oils |
501 | 470 | 520 | 494 | 484 | |||||||||||||||
Aviation fuels |
224 | 235 | 236 | 259 | 250 | |||||||||||||||
Heavy fuels |
108 | 121 | 81 | 90 | 98 | |||||||||||||||
Lubricants, specialty, and other petroleum products |
258 | 290 | 294 | 333 | 345 | |||||||||||||||
Total United States |
2,540 | 2,717 | 2,729 | 2,822 | 2,872 | |||||||||||||||
Canada |
||||||||||||||||||||
Motor gasoline, naphthas |
203 | 207 | 204 | 209 | 250 | |||||||||||||||
Heating oils, kerosene, diesel oils |
131 | 139 | 143 | 145 | 186 | |||||||||||||||
Aviation fuels |
25 | 25 | 24 | 25 | 33 | |||||||||||||||
Heavy fuels |
30 | 33 | 32 | 37 | 37 | |||||||||||||||
Lubricants, specialty, and other petroleum products |
55 | 57 | 70 | 82 | 109 | |||||||||||||||
Total Canada |
444 | 461 | 473 | 498 | 615 | |||||||||||||||
Europe |
||||||||||||||||||||
Motor gasoline, naphthas |
409 | 414 | 427 | 424 | 557 | |||||||||||||||
Heating oils, kerosene, diesel oils |
730 | 723 | 738 | 734 | 895 | |||||||||||||||
Aviation fuels |
149 | 177 | 188 | 182 | 203 | |||||||||||||||
Heavy fuels |
183 | 220 | 202 | 204 | 214 | |||||||||||||||
Lubricants, specialty, and other petroleum products |
241 | 239 | 258 | 280 | 270 | |||||||||||||||
Total Europe |
1,712 | 1,773 | 1,813 | 1,824 | 2,139 | |||||||||||||||
Asia Pacific |
||||||||||||||||||||
Motor gasoline, naphthas |
378 | 403 | 409 | 421 | 513 | |||||||||||||||
Heating oils, kerosene, diesel oils |
467 | 477 | 493 | 535 | 594 | |||||||||||||||
Aviation fuels |
123 | 111 | 106 | 112 | 113 | |||||||||||||||
Heavy fuels |
238 | 276 | 288 | 285 | 222 | |||||||||||||||
Lubricants, specialty, and other petroleum products |
153 | 152 | 165 | 208 | 247 | |||||||||||||||
Total Asia Pacific |
1,359 | 1,419 | 1,461 | 1,561 | 1,689 | |||||||||||||||
Latin America |
||||||||||||||||||||
Motor gasoline, naphthas |
139 | 151 | 160 | 166 | 181 | |||||||||||||||
Heating oils, kerosene, diesel oils |
161 | 173 | 180 | 188 | 209 | |||||||||||||||
Aviation fuels |
45 | 48 | 48 | 47 | 46 | |||||||||||||||
Heavy fuels |
47 | 48 | 55 | 48 | 44 | |||||||||||||||
Lubricants, specialty, and other petroleum products |
27 | 27 | 26 | 24 | 24 | |||||||||||||||
Total Latin America |
419 | 447 | 469 | 473 | 504 | |||||||||||||||
Middle East/Africa |
||||||||||||||||||||
Motor gasoline, naphthas |
76 | 74 | 68 | 91 | 105 | |||||||||||||||
Heating oils, kerosene, diesel oils |
106 | 112 | 117 | 134 | 149 | |||||||||||||||
Aviation fuels |
41 | 45 | 49 | 51 | 53 | |||||||||||||||
Heavy fuels |
30 | 17 | 24 | 25 | 44 | |||||||||||||||
Lubricants, specialty, and other petroleum products |
34 | 34 | 44 | 40 | 40 | |||||||||||||||
Total Middle East/Africa |
287 | 282 | 302 | 341 | 391 | |||||||||||||||
Worldwide |
||||||||||||||||||||
Motor gasoline, naphthas |
2,654 | 2,850 | 2,866 | 2,957 | 3,301 | |||||||||||||||
Heating oils, kerosene, diesel oils |
2,096 | 2,094 | 2,191 | 2,230 | 2,517 | |||||||||||||||
Aviation fuels |
607 | 641 | 651 | 676 | 698 | |||||||||||||||
Heavy fuels |
636 | 715 | 682 | 689 | 659 | |||||||||||||||
Lubricants, specialty, and other petroleum products |
768 | 799 | 857 | 967 | 1,035 | |||||||||||||||
Total worldwide(3) |
6,761 | 7,099 | 7,247 | 7,519 | 8,210 | |||||||||||||||
Purchases/sales with the same counterparty included above |
— | — | — | — | (699 | ) | ||||||||||||||
Total, net of purchases/sales with the same counterparty |
6,761 | 7,099 | 7,247 | 7,519 | 7,511 | |||||||||||||||
| (1) | Petroleum product sales include 100 percent of the sales of ExxonMobil and majority-owned subsidiaries, and the ExxonMobil equity interest in sales by companies owned 50 percent or less. | |
| (2) | Including purchases/sales with the same counterparty. | |
| (3) | 2008, 2007, 2006, and 2005 petroleum product sales data reported net of purchases/sales contracts with the same counterparty. |
| EXXON MOBIL CORPORATION • 2008 FINANCIAL & OPERATING REVIEW | 87 |
| (thousands of barrels per day) | 2008 | 2007 | 2006 | 2005 | 2004 | (2) | ||||||||||||||
Market and Supply Sales(1) |
||||||||||||||||||||
Market sales |
||||||||||||||||||||
Motor gasoline, naphthas |
1,926 | 2,077 | 2,133 | 2,186 | 2,248 | |||||||||||||||
Heating oils, kerosene, diesel oils |
1,372 | 1,448 | 1,544 | 1,618 | 1,625 | |||||||||||||||
Aviation fuels |
365 | 408 | 440 | 475 | 503 | |||||||||||||||
Heavy fuels |
329 | 383 | 396 | 387 | 382 | |||||||||||||||
Lubricants, specialty, and other petroleum products |
283 | 297 | 323 | 316 | 495 | |||||||||||||||
Total market sales |
4,275 | 4,613 | 4,836 | 4,982 | 5,253 | |||||||||||||||
Total supply sales |
2,486 | 2,486 | 2,411 | 2,537 | 2,957 | |||||||||||||||
Total market and supply sales(3) |
6,761 | 7,099 | 7,247 | 7,519 | 8,210 | |||||||||||||||
Purchases/sales with the same counterparty included above |
— | — | — | — | (699 | ) | ||||||||||||||
Total
market and supply sales, net of purchases/sales with the same counterparty |
6,761 | 7,099 | 7,247 | 7,519 | 7,511 | |||||||||||||||
| (1) | Market sales are to retail site dealers, consumers (including government and military), jobbers, and small resellers. Supply sales are to large oil marketers, large unbranded resellers, and other oil companies. | |
| (2) | Including purchases/sales with the same counterparty. | |
| (3) | 2008, 2007, 2006, and 2005 petroleum product sales data reported net of purchases/sales contracts with the same counterparty. |
| (number of sites at year end) | 2008 | 2007 | 2006 | 2005 | 2004 | |||||||||||||||
United States |
||||||||||||||||||||
Owned/leased |
2,155 | 2,225 | 2,375 | 2,544 | 2,698 | |||||||||||||||
Distributors/resellers |
8,296 | 8,679 | 8,742 | 8,992 | 9,421 | |||||||||||||||
Total United States |
10,451 | 10,904 | 11,117 | 11,536 | 12,119 | |||||||||||||||
Canada |
||||||||||||||||||||
Owned/leased |
557 | 583 | 613 | 690 | 720 | |||||||||||||||
Distributors/resellers |
1,314 | 1,327 | 1,327 | 1,288 | 1,258 | |||||||||||||||
Total Canada |
1,871 | 1,910 | 1,940 | 1,978 | 1,978 | |||||||||||||||
Europe |
||||||||||||||||||||
Owned/leased |
4,131 | 4,249 | 4,508 | 4,569 | 4,727 | |||||||||||||||
Distributors/resellers |
2,796 | 2,843 | 2,886 | 3,022 | 3,154 | |||||||||||||||
Total Europe |
6,927 | 7,092 | 7,394 | 7,591 | 7,881 | |||||||||||||||
Asia Pacific |
||||||||||||||||||||
Owned/leased |
2,416 | 2,568 | 2,696 | 2,795 | 2,912 | |||||||||||||||
Distributors/resellers |
4,253 | 4,844 | 5,368 | 5,662 | 5,888 | |||||||||||||||
Total Asia Pacific |
6,669 | 7,412 | 8,064 | 8,457 | 8,800 | |||||||||||||||
Latin America |
||||||||||||||||||||
Owned/leased |
776 | 1,196 | 1,246 | 1,325 | 1,388 | |||||||||||||||
Distributors/resellers |
1,372 | 2,885 | 3,008 | 3,155 | 3,437 | |||||||||||||||
Total Latin America |
2,148 | 4,081 | 4,254 | 4,480 | 4,825 | |||||||||||||||
Middle East/Africa |
||||||||||||||||||||
Owned/leased |
481 | 625 | 713 | 933 | 1,214 | |||||||||||||||
Distributors/resellers |
127 | 362 | 366 | 457 | 557 | |||||||||||||||
Total Middle East/Africa |
608 | 987 | 1,079 | 1,390 | 1,771 | |||||||||||||||
Worldwide |
||||||||||||||||||||
Owned/leased |
10,516 | 11,446 | 12,151 | 12,856 | 13,659 | |||||||||||||||
Distributors/resellers |
18,158 | 20,940 | 21,697 | 22,576 | 23,715 | |||||||||||||||
Total worldwide |
28,674 | 32,386 | 33,848 | 35,432 | 37,374 | |||||||||||||||
| 88 |
| • | Focus on businesses that capitalize on core competencies | |
| • | Consistently deliver best-in-class performance | |
| • | Build proprietary technology positions | |
| • | Capture full benefits of integration across ExxonMobil operations | |
| • | Selectively invest in advantaged projects |
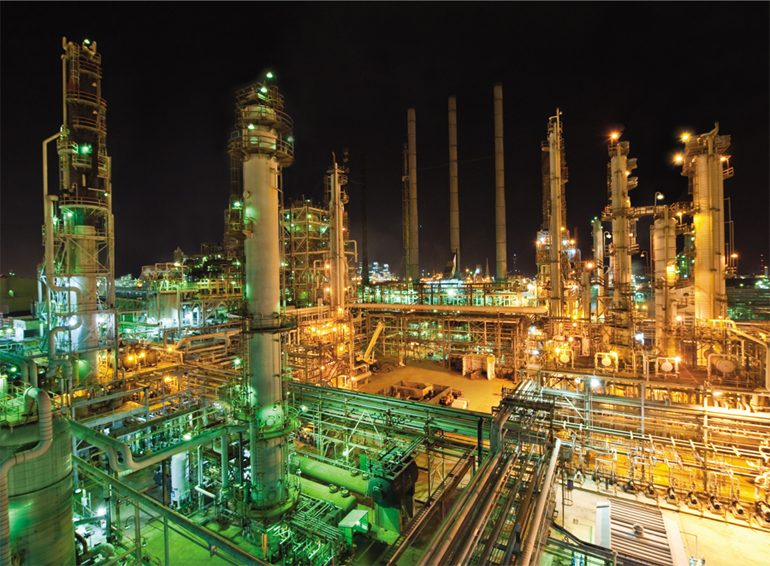
| EXXON MOBIL CORPORATION • 2008 FINANCIAL & OPERATING REVIEW | 89 |
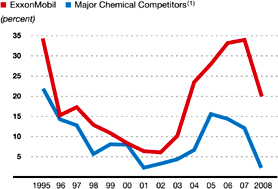
| CHEMICAL STATISTICAL RECAP | 2008 | 2007 | 2006 | 2005 | 2004 | |||||||||||||||
Earnings (millions of dollars) |
2,957 | 4,563 | 4,382 | 3,943 | 3,428 | |||||||||||||||
Prime product sales(1) (thousands of metric tons) |
24,982 | 27,480 | 27,350 | 26,777 | 27,788 | |||||||||||||||
Average capital employed(2) (millions of dollars) |
14,525 | 13,430 | 13,183 | 14,064 | 14,608 | |||||||||||||||
Return on average capital employed(2) (percent) |
20.4 | 34.0 | 33.2 | 28.0 | 23.5 | |||||||||||||||
Capital expenditures (millions of dollars) |
2,819 | 1,782 | 756 | 654 | 690 | |||||||||||||||
| (1) | Prime product sales include ExxonMobil’s share of equity-company volumes and finished-product transfers to the Downstream. Carbon-black oil volumes are excluded. | |
| (2) | See Frequently Used Terms on pages 96 through 99. |
90 |
EXXON MOBIL CORPORATION • 2008 FINANCIAL & OPERATING REVIEW |
| • | One of the largest worldwide producers of olefins, including ethylene and propylene, the basic petrochemical building blocks for a wide variety of everyday products. | |
| • | One of the largest worldwide producers of polyolefins, including polyethylene and polypropylene. These high-volume plastics are extremely versatile and are used in a broad range of applications ranging from food packaging to automobile parts to surgical gowns. | |
| • | The largest global manufacturer of aromatics, including paraxylene and benzene. Paraxylene is the primary |
Premier Petrochemical Company |
||||
Return on Capital Employed (10-year average) |
18 percent | |||
Businesses Ranked 1 or 2 by Market Position |
>90 percent | |||
Capital Employed (at year end) |
$15 billion | |||
Prime Product Sales (metric tons) |
25.0 million | |||
Percent Integrated Capacity |
>90 percent | |||
Businesses |
Worldwide Rank Based on Market Position |
|||
nCommodities |
||||
Paraxylene |
#1 | |||
Olefins |
#2 | |||
Polyethylene |
#2 | |||
Polypropylene |
#5 | |||
nSpecialties |
||||
Butyl Polymers |
#1 | |||
Fluids |
#1 | |||
Plasticizers/Oxo Alcohols |
#1 | |||
Synthetics |
#1 | |||
Oriented Polypropylene Films |
#1 | |||
Adhesive Polymers |
#1 | |||
Specialty Elastomers |
#2 | |||
Petroleum Additives |
#2 | |||
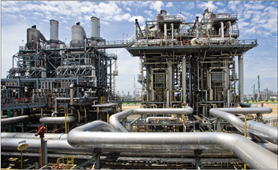
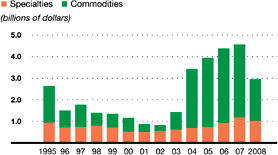
| EXXON MOBIL CORPORATION • 2008 FINANCIAL & OPERATING REVIEW | 91 |
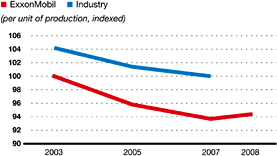
| (1) | Solomon Associates data available for odd years only. | |
| (2) | Only odd-year data plotted for 2003-2007. | |
| (3) | 2008 data estimated. |
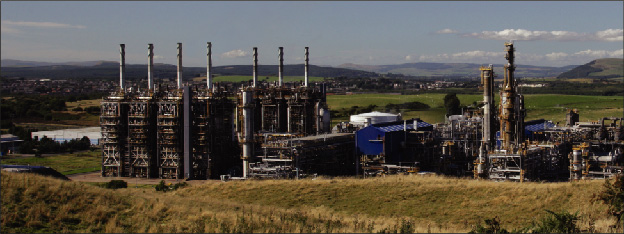
92 |
EXXON MOBIL CORPORATION • 2008 FINANCIAL & OPERATING REVIEW |
| • | Construction continued on the integrated refining and petrochemical facility located in Quanzhou, Fujian Province, China. This project includes an 800-thousand-tons-per-year ethylene steam cracker and integrated polyethylene, polypropylene, and paraxylene units. Start-up is scheduled for 2009. | |
| • | Construction activity ramped up on a new world-scale petrochemical complex at our existing integrated refining and chemical facility in Singapore. This project includes a 1-million-tons-per-year ethylene steam cracker; polyethylene, polypropylene, specialty elastomer, and benzene units; and expansions to the existing oxo alcohol and paraxylene units. Project start-up is expected in 2011. |
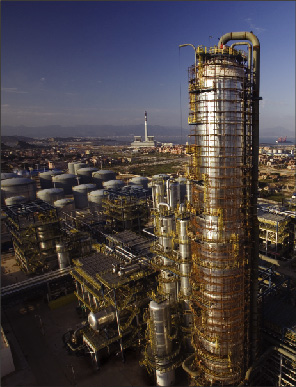
| • | Saudi Basic Industries Corporation (SABIC) and ExxonMobil signed a Heads of Agreement and are progressing detailed studies at our petrochemical joint ventures in Saudi Arabia, Kemya and Yanpet, to supply synthetic rubber, thermoplastic specialty polymers, and carbon black. | |
| • | We continue to progress studies in cooperation with Qatar Petroleum for a world-scale petrochemical complex in Ras Laffan Industrial City, Qatar. The ethylene steam cracker would utilize feedstock from gas development projects in Qatar’s North Field, and the project would employ ExxonMobil’s proprietary technology. |
| • | Tonen Chemical, our affiliate in Japan, has begun construction on a new battery separator film manufacturing facility in Gumi, South Korea, to meet rapidly growing demand in the lithium-ion battery market. | |
| • | A new facility to produce Exxcore dynamically vulcanized alloy (DVA) for tire inner liners has started up in Pensacola, Florida. The revolutionary new tire material allows for improved tire durability and better air retention. | |
| • | A major halobutyl rubber expansion has started up in Baytown, Texas. The project increased production capacity of bromobutyl rubber at the site by 60 percent, allowing us to meet growing global demand for higher performance tires. |
| Capacity(1) | ||||||||
| (metric tons | ||||||||
| Commodities | Product | per year) | ||||||
2009 |
Fujian, China | Ethylene | 200,000 | |||||
| Paraxylene | 175,000 | |||||||
| Polyethylene | 200,000 | |||||||
| Polypropylene | 100,000 | |||||||
| Rotterdam, the Netherlands | Benzene Paraxylene |
20% increase 25% increase |
||||||
2011 |
Singapore | Ethylene | 1,000,000 | |||||
| Polyethylene | 1,300,000 | |||||||
| Polypropylene | 500,000 | |||||||
| Benzene | 340,000 | |||||||
| Paraxylene | 80,000 | |||||||
Specialties |
||||||||
2008 |
Baytown, Texas | Bromobutyl Rubber | 60% increase | |||||
| Notre-Dame-de- Gravenchon, |
Adhesive Polymers | 18,000 | ||||||
| France | ||||||||
| Pensacola, Florida | Compounded Polymers |
1 line | ||||||
| Singapore | Hydrocarbon Fluids | 130,000 | ||||||
2009 |
Gumi, South Korea | Specialty Films | 2 lines | |||||
2011 |
Singapore | Oxo Alcohols | 125,000 | |||||
| Specialty Elastomers | 300,000 | |||||||
| (1) | ExxonMobil equity share of capacity addition. |
| EXXON MOBIL CORPORATION • 2008 FINANCIAL & OPERATING REVIEW | 93 |
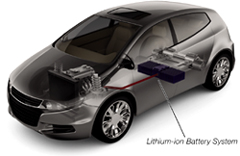
Butyl Polymers |
||||
Automotive • hoses, tubing, |
||||
engine
mounts |
||||
Tires • inner liners, sidewalls, |
||||
inner
tubes |
||||
Oriented Polypropylene Film |
||||
Consumer • flexible packaging, |
||||
labels |
||||
Industrial • tapes, protective |
||||
laminates |
||||
Adhesive Polymers |
||||
Consumer • tapes, labels, |
||||
diaper assembly |
||||
Industrial • glues, packaging, |
||||
road marking, tires |
||||
Petroleum Additives |
||||
Transportation • motor and gear |
||||
lubricants, transportation fuels |
||||
Synthetic Base Fluids |
||||
Automotive • synthetic engine, |
||||
gear, and transmission oils |
||||
Industrial • synthetic lubricants, |
||||
fiber-optic cable gel |
||||
Oxygenated Fluids |
||||
Consumer • paints, cleaning |
||||
fluids, de-icing fluids, rubbing alcohol |
||||
Industrial • paints, adhesives, |
||||
magnetic tapes |
||||
Hydrocarbon Fluids |
||||
Consumer • aerosol products, |
||||
paints, lighter fluids |
||||
Industrial • degreasers, agricultural |
||||
chemicals, adhesives, inks |
||||
Oxo Alcohols and Acids |
||||
Consumer • tapes, shampoo |
||||
Industrial • cleaners, coatings |
||||
Plasticizers |
||||
Automotive • dashboards, side moldings |
||||
Construction • flooring, wall covering, |
||||
carpet backing |
||||
Consumer • garden hoses, |
||||
sports equipment, shoes |
||||
Aromatics |
||||
Automotive • polyurethane foams, |
||||
headlights |
||||
Consumer • PET bottles and |
||||
packaging, polyester and |
||||
nylon fabrics, CDs/DVDs |
||||
Industrial • paints, coatings |


94 |
EXXON MOBIL CORPORATION • 2008 FINANCIAL & OPERATING REVIEW |
| (millions of metric tons per year) | Ethylene | Polyethylene | Polypropylene | Paraxylene | Additional Products | |||||||||||||||||||
North America |
||||||||||||||||||||||||
Baton Rouge, Louisiana |
1.0 | 1.3 | 0.4 | — | P | B | E | A | F | O | ||||||||||||||
Baytown, Texas |
2.2 | — | 0.8 | 0.6 | P | B | F | |||||||||||||||||
Beaumont, Texas |
0.9 | 1.0 | — | 0.3 | P | S | ||||||||||||||||||
Mont Belvieu, Texas |
— | 1.0 | — | — | ||||||||||||||||||||
Sarnia, Ontario |
0.3 | 0.5 | — | — | P | F | O | |||||||||||||||||
Europe |
||||||||||||||||||||||||
Antwerp, Belgium |
0.5 | 0.4 | — | — | P | F | O | |||||||||||||||||
Fawley, United Kingdom |
0.1 | — | — | — | P | B | F | O | ||||||||||||||||
Fife, United Kingdom |
0.4 | — | — | — | ||||||||||||||||||||
Meerhout, Belgium |
— | 0.5 | — | — | ||||||||||||||||||||
Notre-Dame-de-Gravenchon, France |
0.4 | 0.4 | 0.4 | — | P | B | E | A | O | S | ||||||||||||||
Rotterdam, the Netherlands |
— | — | — | 0.6 | O | |||||||||||||||||||
Middle East |
||||||||||||||||||||||||
Al Jubail, Saudi Arabia |
0.6 | 0.6 | — | — | ||||||||||||||||||||
Yanbu, Saudi Arabia |
1.0 | 0.7 | 0.2 | — | P | |||||||||||||||||||
Asia Pacific |
||||||||||||||||||||||||
Kawasaki, Japan |
0.5 | 0.1 | — | — | P | B | A | F | ||||||||||||||||
Singapore |
0.9 | 0.6 | 0.4 | 0.9 | P | F | O | |||||||||||||||||
Sriracha, Thailand |
— | — | — | 0.5 | F | |||||||||||||||||||
All other |
— | — | — | 0.6 | ||||||||||||||||||||
Total worldwide |
8.8 | 7.1 | 2.2 | 3.5 | ||||||||||||||||||||
| (1) | Based on size or breadth of product slate. | |
| (2) | Capacity reflects 100 percent for operations of ExxonMobil and majority-owned subsidiaries. For companies owned 50 percent or less, capacity is ExxonMobil’s interest. |
| Location | Product | |||||||||||||||
North America |
||||||||||||||||
Bayway, New Jersey |
▲ | |||||||||||||||
Belleville, Ontario |
u | |||||||||||||||
Chalmette, Louisiana |
n | |||||||||||||||
Dartmouth, Nova Scotia |
l | |||||||||||||||
Edison, New Jersey |
l | |||||||||||||||
Joliet, Illinois |
n | |||||||||||||||
LaGrange, Georgia |
u | |||||||||||||||
Pensacola, Florida |
▲ | |||||||||||||||
Plaquemine, Louisiana |
▲ | |||||||||||||||
Shawnee, Oklahoma |
u | |||||||||||||||
Latin America |
||||||||||||||||
Campana, Argentina |
n | l | ||||||||||||||
Managua, Nicaragua |
l | |||||||||||||||
Paulinia, Brazil |
l | |||||||||||||||
| Location | Product | |||||||||||||||
Europe |
||||||||||||||||
Amsterdam, the Netherlands |
l | |||||||||||||||
Augusta, Italy |
n | |||||||||||||||
Brindisi, Italy |
u | |||||||||||||||
Cologne, Germany |
▲ | |||||||||||||||
Fos-sur-Mer, France |
n | |||||||||||||||
Geleen, the Netherlands |
▲ | |||||||||||||||
Karlsruhe, Germany |
n | |||||||||||||||
Kerkrade, the Netherlands |
u | |||||||||||||||
Newport, United Kingdom |
▲ | |||||||||||||||
Trecate, Italy |
l | |||||||||||||||
Virton, Belgium |
u | |||||||||||||||
| Location | Product | |||||||||||||||
Asia Pacific |
||||||||||||||||
Adelaide, Australia(2) |
l | |||||||||||||||
Fujian, China |
▲ | |||||||||||||||
Jinshan, China |
▲ | |||||||||||||||
Kashima, Japan |
▲ | |||||||||||||||
Nasu, Japan |
u | |||||||||||||||
Panyu, China |
l | |||||||||||||||
Sakai, Japan |
n | l | ||||||||||||||
Wakayama, Japan |
n | |||||||||||||||
| (1) | Includes joint-venture plants, with the exception of the Infineum additives joint ventures. | |
| (2) | Facility mothballed. |
| EXXON MOBIL CORPORATION • 2008 FINANCIAL & OPERATING REVIEW | 95 |
| Includes ExxonMobil’s share of equity companies | 2008 | 2007 | 2006 | 2005 | 2004 | |||||||||||||||
Worldwide Production Volumes (thousands of metric tons) |
||||||||||||||||||||
Ethylene |
7,540 | 8,155 | 7,878 | 7,930 | 8,271 | |||||||||||||||
Polyethylene |
6,088 | 6,693 | 6,275 | 6,213 | 6,248 | |||||||||||||||
Polypropylene |
1,897 | 1,897 | 1,815 | 1,680 | 1,885 | |||||||||||||||
Paraxylene |
2,472 | 2,995 | 3,038 | 2,785 | 2,826 | |||||||||||||||
Prime Product Sales Volumes(1)
by Region (thousands of metric tons) |
||||||||||||||||||||
Americas(2) |
10,628 | 12,034 | 11,907 | 11,523 | 12,842 | |||||||||||||||
Europe/Middle East/Africa |
6,635 | 7,463 | 7,497 | 7,310 | 7,334 | |||||||||||||||
Asia Pacific |
7,719 | 7,983 | 7,946 | 7,944 | 7,612 | |||||||||||||||
Total worldwide |
24,982 | 27,480 | 27,350 | 26,777 | 27,788 | |||||||||||||||
Prime Product Sales Volumes(1)
by Business (thousands of metric tons) |
||||||||||||||||||||
Less-cyclical specialty businesses |
5,618 | 6,237 | 6,228 | 6,083 | 6,324 | |||||||||||||||
Olefins/polyolefins/aromatics/other |
19,364 | 21,243 | 21,122 | 20,694 | 21,464 | |||||||||||||||
Total |
24,982 | 27,480 | 27,350 | 26,777 | 27,788 | |||||||||||||||
| (1) | Prime product sales include ExxonMobil’s share of equity-company volumes and finished product transfers to the Downstream. Carbon-black oil volumes are excluded. | |
| (2) | Includes North America and Latin America. |
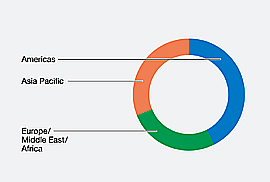
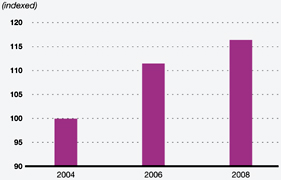
96 |
EXXON MOBIL CORPORATION • 2008 FINANCIAL & OPERATING REVIEW |
| (millions of dollars) | 2008 | 2007 | 2006 | 2005 | 2004 | |||||||||||||||
Reconciliation of Operating Costs |
||||||||||||||||||||
From ExxonMobil’s Consolidated Statement of Income |
||||||||||||||||||||
Total costs and other deductions |
395,609 | 334,078 | 310,233 | 311,248 | 256,794 | |||||||||||||||
Less: |
||||||||||||||||||||
Crude oil and product purchases |
249,454 | 199,498 | 182,546 | 185,219 | 139,224 | |||||||||||||||
Interest expense |
673 | 400 | 654 | 496 | 638 | |||||||||||||||
Sales-based taxes |
34,508 | 31,728 | 30,381 | 30,742 | 27,263 | |||||||||||||||
Other taxes and duties |
41,719 | 40,953 | 39,203 | 41,554 | 40,954 | |||||||||||||||
Income applicable to minority interests |
1,647 | 1,005 | 1,051 | 799 | 776 | |||||||||||||||
Subtotal |
67,608 | 60,494 | 56,398 | 52,438 | 47,939 | |||||||||||||||
ExxonMobil’s share of equity-company expenses |
7,204 | 5,619 | 4,947 | 4,520 | 4,209 | |||||||||||||||
Total operating costs |
74,812 | 66,113 | 61,345 | 56,958 | 52,148 | |||||||||||||||
| (millions of dollars) | 2008 | 2007 | 2006 | 2005 | 2004 | |||||||||||||||
Components of Operating Costs |
||||||||||||||||||||
From ExxonMobil’s Consolidated Statement of Income |
||||||||||||||||||||
Production and manufacturing expenses |
37,905 | 31,885 | 29,528 | 26,819 | 23,225 | |||||||||||||||
Selling, general, and administrative expenses |
15,873 | 14,890 | 14,273 | 14,402 | 13,849 | |||||||||||||||
Depreciation and depletion |
12,379 | 12,250 | 11,416 | 10,253 | 9,767 | |||||||||||||||
Exploration expenses, including dry holes |
1,451 | 1,469 | 1,181 | 964 | 1,098 | |||||||||||||||
Subtotal |
67,608 | 60,494 | 56,398 | 52,438 | 47,939 | |||||||||||||||
ExxonMobil’s share of equity-company expenses |
7,204 | 5,619 | 4,947 | 4,520 | 4,209 | |||||||||||||||
Total operating costs |
74,812 | 66,113 | 61,345 | 56,958 | 52,148 | |||||||||||||||
| EXXON MOBIL CORPORATION • 2008 FINANCIAL & OPERATING REVIEW | 97 |
| (millions of dollars) | 2008 | 2007 | 2006 | 2005 | 2004 | |||||||||||||||
Business Uses: Asset and Liability Perspective |
||||||||||||||||||||
Total assets |
228,052 | 242,082 | 219,015 | 208,335 | 195,256 | |||||||||||||||
Less liabilities and minority share of assets and liabilities |
||||||||||||||||||||
Total current liabilities excluding notes and loans payable |
(46,700 | ) | (55,929 | ) | (47,115 | ) | (44,536 | ) | (39,701 | ) | ||||||||||
Total long-term liabilities excluding long-term debt and |
||||||||||||||||||||
equity of minority interests |
(54,404 | ) | (50,543 | ) | (45,905 | ) | (41,095 | ) | (41,554 | ) | ||||||||||
Minority share of assets and liabilities |
(6,044 | ) | (5,332 | ) | (4,948 | ) | (4,863 | ) | (5,285 | ) | ||||||||||
Add ExxonMobil share of debt-financed equity-company net assets |
4,798 | 3,386 | 2,808 | 3,450 | 3,914 | |||||||||||||||
Total capital employed |
125,702 | 133,664 | 123,855 | 121,291 | 112,630 | |||||||||||||||
Total Corporate Sources: Debt and Equity Perspective |
||||||||||||||||||||
Notes and loans payable |
2,400 | 2,383 | 1,702 | 1,771 | 3,280 | |||||||||||||||
Long-term debt |
7,025 | 7,183 | 6,645 | 6,220 | 5,013 | |||||||||||||||
Shareholders’ equity |
112,965 | 121,762 | 113,844 | 111,186 | 101,756 | |||||||||||||||
Less minority share of total debt |
(1,486 | ) | (1,050 | ) | (1,144 | ) | (1,336 | ) | (1,333 | ) | ||||||||||
Add ExxonMobil share of equity-company debt |
4,798 | 3,386 | 2,808 | 3,450 | 3,914 | |||||||||||||||
Total capital employed |
125,702 | 133,664 | 123,855 | 121,291 | 112,630 | |||||||||||||||
| (millions of dollars) | 2008 | 2007 | 2006 | 2005 | 2004 | |||||||||||||||
Return on Average Capital Employed |
||||||||||||||||||||
Net income |
45,220 | 40,610 | 39,500 | 36,130 | 25,330 | |||||||||||||||
Financing costs (after tax) |
||||||||||||||||||||
Gross third-party debt |
(343 | ) | (339 | ) | (264 | ) | (261 | ) | (461 | ) | ||||||||||
ExxonMobil share of equity companies |
(325 | ) | (204 | ) | (156 | ) | (144 | ) | (185 | ) | ||||||||||
All other financing costs – net |
1,485 | 268 | 499 | (35 | ) | 378 | ||||||||||||||
Total financing costs |
817 | (275 | ) | 79 | (440 | ) | (268 | ) | ||||||||||||
Earnings excluding financing costs |
44,403 | 40,885 | 39,421 | 36,570 | 25,598 | |||||||||||||||
Average capital employed |
129,683 | 128,760 | 122,573 | 116,961 | 107,339 | |||||||||||||||
Return on average capital employed – corporate total |
34.2% | 31.8% | 32.2% | 31.3% | 23.8% | |||||||||||||||
98 |
EXXON MOBIL CORPORATION • 2008 FINANCIAL & OPERATING REVIEW |
| 2008 | 2007 | 2006 | 2005 | 2004 | ||||||||||||||||
Exploration portion of Upstream capital and
exploration expenditures (millions of dollars) |
2,871 | 1,909 | 2,044 | 1,693 | 1,283 | |||||||||||||||
Proved property acquisition costs (millions of dollars) |
61 | 37 | 234 | 174 | 93 | |||||||||||||||
Total exploration and proved property |
||||||||||||||||||||
acquisition costs (millions of dollars) |
2,932 | 1,946 | 2,278 | 1,867 | 1,376 | |||||||||||||||
Resource additions (millions of oil-equivalent barrels) |
2,230 | 2,010 | 4,270 | 4,365 | 2,940 | |||||||||||||||
Finding and resource-acquisition costs per
oil-equivalent barrel (dollars) |
1.32 | 0.97 | 0.53 | 0.43 | 0.47 | |||||||||||||||
| EXXON MOBIL CORPORATION • 2008 FINANCIAL & OPERATING REVIEW | 99 |
| (millions of dollars) | 2008 | 2007 | 2006 | 2005 | 2004 | |||||||||||||||
Costs incurred |
||||||||||||||||||||
Property acquisition costs |
663 | 194 | 597 | 453 | 134 | |||||||||||||||
Exploration costs |
2,272 | 1,762 | 1,685 | 1,420 | 1,255 | |||||||||||||||
Development costs |
14,633 | 11,570 | 12,103 | 10,561 | 9,122 | |||||||||||||||
Total costs incurred |
17,568 | 13,526 | 14,385 | 12,434 | 10,511 | |||||||||||||||
| (millions of barrels) | 2008 | 2007 | 2006 | 2005 | 2004 | |||||||||||||||
Proved oil-equivalent reserves additions |
||||||||||||||||||||
Revisions |
211 | 1,793 | 390 | 377 | 140 | |||||||||||||||
Improved recovery |
8 | 35 | 29 | 31 | 28 | |||||||||||||||
Extensions/discoveries |
1,413 | 251 | 881 | 1,461 | 1,809 | |||||||||||||||
Purchases |
— | 2 | 755 | 122 | 11 | |||||||||||||||
Total oil-equivalent reserves additions |
1,632 | 2,081 | 2,055 | 1,991 | 1,988 | |||||||||||||||
Proved reserves replacement costs (dollars per barrel) |
10.76 | 6.50 | 7.00 | 6.25 | 5.29 | |||||||||||||||
| (millions of dollars) | 2008 | 2007 | 2006 | 2005 | 2004 | |||||||||||||||
Net cash provided by operating activities |
59,725 | 52,002 | 49,286 | 48,138 | 40,551 | |||||||||||||||
Sales of subsidiaries, investments and property, plant,
and equipment |
5,985 | 4,204 | 3,080 | 6,036 | 2,754 | |||||||||||||||
Cash flow from operations and asset sales |
65,710 | 56,206 | 52,366 | 54,174 | 43,305 | |||||||||||||||
| (millions of dollars) | 2008 | 2007 | 2006 | 2005 | 2004 | |||||||||||||||
Dividends paid to ExxonMobil shareholders |
8,058 | 7,621 | 7,628 | 7,185 | 6,896 | |||||||||||||||
Cost of shares purchased to reduce shares outstanding |
32,000 | 28,000 | 25,000 | 16,000 | 8,000 | |||||||||||||||
Distributions to ExxonMobil shareholders |
40,058 | 35,621 | 32,628 | 23,185 | 14,896 | |||||||||||||||
Memo: Gross cost of shares purchased to offset shares
issued under benefit plans and programs |
3,734 | 3,822 | 4,558 | 2,221 | 1,951 | |||||||||||||||
100 |
EXXON MOBIL CORPORATION • 2008 FINANCIAL & OPERATING REVIEW |
Acreage |
32, 33, 44, 50, 54, 58, 62, 66 | |||
Africa |
33, 37, 38, 39, 40, 41, 42, 43, 54-57 | |||
Americas gas market |
36-37 | |||
Asia Pacific |
18, 19, 20, 33, 42, 43, 58-59, 75, 76, 81, 82, 92 | |||
Asian gas market |
36, 37 | |||
Balance sheet |
15 | |||
Business strategies |
3, 4-5, 30, 72, 88 | |||
Canada |
9, 33, 36, 44, 47-48, 75 | |||
Capital and exploration expenditures |
2, 5, 12-13, 31, 73, 75, 89, 98 | |||
Capital employed |
2, 11, 31, 73, 79, 89, 90, 97 | |||
Cash flow |
2, 3, 5, 17, 99 | |||
Cash flow statement |
17, 99 | |||
Chemical capacity |
94 | |||
Chemical products |
93 | |||
Chemical projects |
82, 92 | |||
Chemical results |
88-89 | |||
Chemical volumes |
5, 95 | |||
Depreciation and depletion |
16, 17, 70-71 | |||
Dividend and shareholder distributions |
6 | |||
Downstream results |
72-73 | |||
Earnings |
2, 3, 5, 6, 10, 31, 44, 50, | |||
| 54, 58, 62, 70-71, 73, 89, 90, 96, 97 | ||||
Earnings, oil and gas |
70-71 | |||
Earnings per barrel |
31, 35 | |||
Energy management |
8, 9, 36, 77, 91 | |||
Energy outlook |
18-21 | |||
Entitlement volume effects |
42, 43, 98 | |||
Europe |
33, 39, 40, 42, 43, 50-53, 75, 91 | |||
European gas market |
36-37 | |||
Exploration captures |
33 | |||
Financial highlights |
2 | |||
Finding and resource-acquisition costs |
31, 42, 98 | |||
Frequently used terms |
96-99 | |||
Fuels marketing |
78-79, 82 | |||
Fujian Venture |
29, 82, 92 | |||
Heavy oil |
9, 32, 34, 35, 42, 47, 48, 49, 99 | |||
Income statement |
16 | |||
Integration |
5, 29, 31, 32, 73, 74, 75, 79, 89, 91 | |||
Key financial ratios |
2 | |||
LNG |
20, 34, 36-37, 45, 51, 53, 54, 58, 59, 60-61 | |||
Lubricants & Specialties |
80-81 | |||
Middle East |
23, 24, 36, 37, 38, 42, 43, 58, 60-61, 92 | |||
Molecule management |
29, 73, 76 | |||
National Content |
38 | |||
Operating costs |
14, 70-71, 77, 79, 96 | |||
Petroleum product sales |
5, 72, 73, 86-87 | |||
Price and spend impacts |
98 | |||
Production Sharing Contract |
59, 63, 96 | |||
Production volumes |
5, 30, 31, 41, 43, 64-65 | |||
Property, plant and equipment |
14 | |||
Refinery utilization |
73, 83 | |||
Refining & Supply |
74-77, 82 | |||
Refining capacity |
74, 76, 83-85 | |||
Reserves and resources |
31, 32, 34, 42-43, | |||
| 44, 50, 54, 58, 62, 67-69, 98, 99 | ||||
Reserves replacement costs |
69, 99 | |||
Reserves replacement ratio |
31, 43, 68-69, 98 |
Retail sites |
78, 87 | |||
Return on average capital employed |
2, 3, 4, 11, 31, 73, 89, 97 | |||
Russia/Caspian |
36, 38, 40, 42, 43, 62-63, 81 | |||
Safety, security, health and environment |
7-9 | |||
Share purchases |
6, 99 | |||
South America |
49 | |||
Technology |
22-28 | |||
Tight gas |
23, 32, 36 | |||
Total shareholder return |
3, 6, 98 | |||
Unconventional gas |
32, 34, 36, 42, 44, 52 | |||
United States |
33, 44-46 | |||
Upstream development project summary |
39-40 | |||
Upstream production profile |
41, 43 | |||
Upstream results |
30-31 | |||
Wells, net drilled |
66 | |||
Data Tables |
||||
Corporate Financial Tables |
||||
Capital and Exploration Expenditures |
12-13 | |||
Capital Employed/ROCE |
11 | |||
Financial Statements |
14-17 | |||
Functional Earnings |
10 | |||
Business Tables |
||||
Upstream |
64-71 | |||
Downstream |
83-87 | |||
Chemical |
94-95 |

| • | Publications | |
| • | Stock Quote | |
| • | Dividend Information | |
| • | Contact Information | |
| • | Speeches | |
| • | News Releases | |
| • | Investor Presentations | |
| • | Corporate Governance |