| 2 0 0 4 F I N A N C I
A L & O P E R A T I N G R E V I E W ExxonMobil Taking on the world's toughest energy challengesTM. |

| 2 0 0 4 F I N A N C I
A L & O P E R A T I N G R E V I E W ExxonMobil Taking on the world's toughest energy challengesTM. |
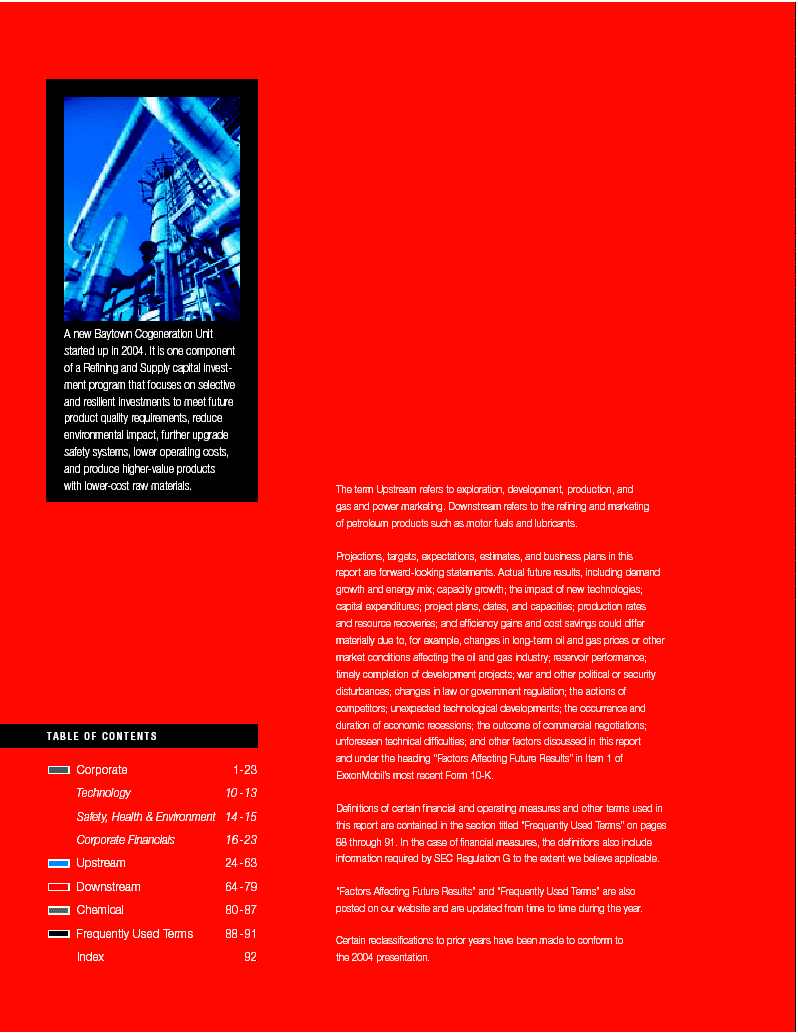
| A new Baytown Cogeneration Unit started up in 2004. It is one component of a Refining and Supply capital investment program that focuses on selective and resilient investments to meet future product quality requirements, reduce environmental impact, further upgrade safety systems, lower operating costs, and produce higher-value products with lower-cost raw materials. The term Upstream refers to exploration, development, production, and gas and power marketing. Downstream refers to the refining and marketing of petroleum products such as motor fuels and lubricants. Projections, targets, expectations, estimates, and business plans in this report are forward-looking statements. Actual future results, including demand growth and energy mix; capacity growth; the impact of new technologies; capital expenditures; project plans, dates, and capacities; production rates and resource recoveries; and efficiency gains and cost savings could differ materially due to, for example, changes in long-term oil and gas prices or other market conditions affecting the oil and gas industry; reservoir performance; timely completion of development projects; war and other political or security disturbances; changes in law or government regulation; the actions of competitors; unexpected technological developments; the occurrence and duration of economic recessions; the outcome of commercial negotiations; TA B L E O F C O N T E N T S unforeseen technical difficulties; and other factors discussed in this report and under the heading "Factors Affecting Future Results" in Item 1 of Corporate 1-23 ExxonMobil's most recent Form 10-K. Technology 10 -13 Definitions of certain financial and operating measures and other terms used in Safety, Health & Environment 14 -15 this report are contained in the section titled "Frequently Used Terms" on pages Corporate Financials 16-23 88 through 91. In the case of financial measures, the definitions also include information required by SEC Regulation G to the extent we believe applicable. Upstream 24 -63 Downstream 64-79 "Factors Affecting Future Results" and "Frequently Used Terms" are also Chemical 80 -87 posted on our website and are updated from time to time during the year. Frequently Used Terms 88 -91 Certain reclassifications to prior years have been made to conform to Index 92 the 2004 presentation. |
To grow and prosper, the world will need 50 percent more energy by 2030 — an enormous challenge. Taking on this challenge demands more than deploying the right assets in the right places at the right time. It requires a relentless focus on execution by a highly effective work force. Not just quarter to quarter but decade to decade. To this challenge we bring continued dedication to the values we live by — discipline, integrity, reliability, consistency, and a commitment to technology. These principles are fundamental to our success today, and will remain so as we take on the world’s toughest energy challenges.

2
FINANCIAL HIGHLIGHTS
| (millions of dollars, unless noted) | 2004 | 2003 | 2002 | 2001 | 2000 | |||||||||||||||
Sales and other operating revenue |
291,252 | 237,054 | 200,949 | 208,715 | 227,596 | |||||||||||||||
Net income |
25,330 | 21,510 | 11,460 | 15,320 | 17,720 | |||||||||||||||
Cash flow from operations and asset sales(1) |
43,305 | 30,788 | 24,061 | 23,967 | 28,707 | |||||||||||||||
Capital and exploration expenditures (1) |
14,885 | 15,525 | 13,955 | 12,311 | 11,168 | |||||||||||||||
Cash dividends to ExxonMobil shareholders |
6,896 | 6,515 | 6,217 | 6,254 | 6,123 | |||||||||||||||
Common stock purchases (gross) |
9,951 | 5,881 | 4,798 | 5,721 | 2,352 | |||||||||||||||
Research and development costs |
649 | 618 | 631 | 603 | 564 | |||||||||||||||
Cash and cash equivalents at year end(2) |
18,531 | 10,626 | 7,229 | 6,547 | 7,080 | |||||||||||||||
Total assets at year end |
195,256 | 174,278 | 152,644 | 143,174 | 149,000 | |||||||||||||||
Total debt at year end |
8,293 | 9,545 | 10,748 | 10,802 | 13,441 | |||||||||||||||
Shareholders’ equity at year end |
101,756 | 89,915 | 74,597 | 73,161 | 70,757 | |||||||||||||||
Average capital employed(1) |
107,339 | 95,373 | 88,342 | 88,000 | 87,463 | |||||||||||||||
Market valuation at year end |
328,128 | 269,294 | 234,101 | 267,577 | 301,239 | |||||||||||||||
Regular employees at year end (thousands) |
85.9 | 88.3 | 92.5 | 97.9 | 99.6 | |||||||||||||||
KEY FINANCIAL RATIOS
| 2004 | 2003 | 2002 | 2001 | 2000 | ||||||||||||||||
Net income per common share (dollars) |
3.91 | 3.24 | 1.69 | 2.23 | 2.55 | |||||||||||||||
Net income per common share — assuming dilution (dollars) |
3.89 | 3.23 | 1.68 | 2.21 | 2.52 | |||||||||||||||
Return on average capital employed(1) (percent) |
23.8 | 20.9 | 13.5 | 17.8 | 20.6 | |||||||||||||||
Net income to average shareholders’ equity (percent) |
26.4 | 26.2 | 15.5 | 21.3 | 26.4 | |||||||||||||||
Debt to capital(3)(percent) |
7.3 | 9.3 | 12.2 | 12.4 | 15.4 | |||||||||||||||
Net debt to capital(4)(percent) |
(10.7 | ) | (1.2 | ) | 4.4 | 5.3 | 7.9 | |||||||||||||
Current assets to current liabilities(4) |
1.40 | 1.20 | 1.15 | 1.18 | 1.06 | |||||||||||||||
Fixed charge coverage (times) |
36.1 | 30.8 | 13.8 | 17.7 | 15.6 | |||||||||||||||
| (1) | See Frequently Used Terms on pages 88 through
91. |
|
| (2) | Excluding restricted cash of $4,604 million. | |
| (3) | Debt includes short and long-term debt. Capital includes short and long-term debt, shareholders’ equity, and minority interests. | |
| (4) | Debt net of cash, excluding restricted cash. The ratio of net debt to capital including restricted cash is (16.3) percent for 2004. |
EXXON MOBIL CORPORATION • 2004 FINANCIAL & OPERATING REVIEW
3
ExxonMobil holds a legacy of leadership in our industry. We’ve created sustainable competitive advantage through our proven business model, enabling us to excel while taking on the world’s toughest energy challenges.
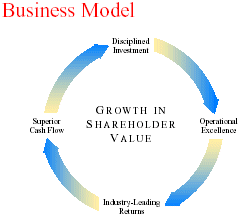
Our fundamental business model is disciplined, straightforward, and focused on generating value while managing risk. Through it we continue to demonstrate superior financial and operating results that have enhanced long-term returns for our shareholders. The core values that form the backbone of our model are firmly established in our globally aligned functional organization. The disciplined execution of our business strategies sets us apart.
OUR APPROACH
| § | Uphold high ethical standards and business integrity | |||
| § | Ensure safe, environmentally sound operations | |||
| § | Capture quality investment opportunities while maintaining a selective and disciplined approach | |||
| § | Pursue operational excellence | |||
| § | Leverage efficiency gains through our global functional organization | |||
| § | Develop and employ leading-edge proprietary technology | |||
| § | Optimize performance through geographic and functional diversity and integration | |||
| § | Attract and retain exceptionally qualified and highly motivated people | |||
| § | Maintain a strong and flexible financial position in all commodity environments | |||
INDUSTRY-LEADING RESULTS
| § | Record low safety incidents | |||
| § | Record earnings – highest in the history of the Corporation and in each business line | |||
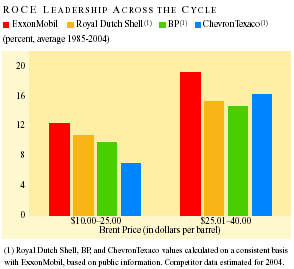
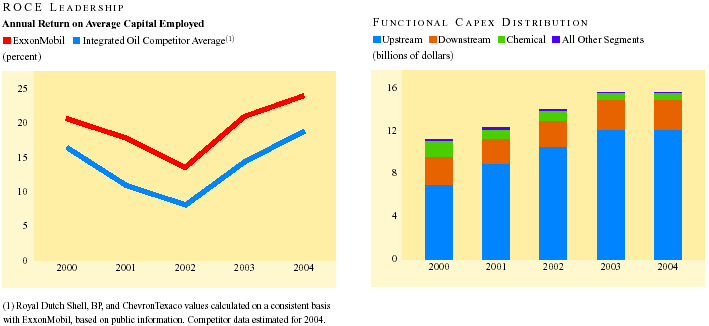
| § | Return on average capital employed (ROCE) increased to 24 percent; five-year average ROCE leads the industry at 19 percent | |||
| § | Proved reserves additions replaced 125 percent of production, excluding asset sales and year-end price/cost revisions | |||
| § | Oil-equivalent production increased 0.3 percent; excluding sales and entitlement effects, production increased 3 percent | |||
| § | Key resource additions from Qatar, the United States, Canada, Nigeria, Angola, and Kazakhstan | |||
| § | Downstream operating cost efficiencies and revenue enhancements in excess of $1.7 billion | |||
| § | Record chemical prime product sales | |||
| § | Annual dividend payments grew 8 percent and increased for the 22nd consecutive year | |||
| § | $15 billion returned to shareholders | |||
Our disciplined approach yielded strong performance in each of our business lines and enabled us to fully capture the benefits of a robust environment. Our results demonstrate our ability to generate more income from a highly efficient capital base – something we have consistently done for years across all phases of the business cycle.
2004 FINANCIAL & OPERATING REVIEW • EXXON MOBIL CORPORATION
4
Unparalleled Execution of Business Strategies Builds Competitive Advantage
Our industry faces an enormous challenge to meet the energy needs of a growing world. Increasingly, significant new oil and gas resources are in more remote areas and difficult environments. Projects are more capital intensive and require substantial financial strength and flexibility. The complexity of the operating environment places greater emphasis on execution excellence. These challenges present ExxonMobil with opportunities to further differentiate each of our businesses.
UPHOLD HIGH STANDARDS
ExxonMobil has long recognized the importance of
sound corporate governance, strong business
controls, and the value of high ethical standards
and integrity. We believe that the methods we
employ to attain results are as important as the
results themselves. We are committed to
transparency and honesty in all our reporting.
These principles form the basis of our Standards
of Business Conduct, and are regularly reinforced
with all employees. Our straightforward business
model, ethical standards, and culture of
integrity, legal compliance, and accountability
are key to achieving industry-leading results.
MAINTAIN SAFETY AS OUR TOP PRIORITY
In 2004, ExxonMobil set another record in safety
performance, once again leading the industry. We
believe that when a company is disciplined about
its commitment to safety, health, and the
environment, a sound foundation is created for
superior results in all aspects of its business.
We comply with all applicable environmental laws
and regulations, and apply responsible standards
where laws and regulations do not exist.
INVEST WITH DISCIPLINE
In our industry, investment decisions can impact
results for decades. They must be based on an
in-depth understanding of supply and demand for
each business. Our highly disciplined approach to
pursuing and selecting the most attractive investment opportunities has served us well in all phases of the economic cycle. Potential investment opportunities are tested over a wide range of economic scenarios to assure the resiliency of each opportunity. Our disciplined approach continues from design through start-up and ongoing operations. Post-investment, we complete a rigorous appraisal process on all major projects and incorporate improvements into future project planning and design. This critical process ensures that we obtain the maximum value from our investments; we believe it distinguishes us from competition.
PURSUE OPERATIONAL EXCELLENCE
ExxonMobil applies the same rigor to our
operations that we apply to investments. We
operate with the highest industry standards in
all respects. We meet our commitments and we set
industry benchmarks in the process. We call this
“operational excellence.”
To accomplish this, ExxonMobil has developed a wide range of proven management systems. These systems cover all aspects of our operations, from business ethics, finance, project execution and appraisal, to business controls, security, safety, health, and environmental performance. They also encompass profit improvement initiatives, including efforts to increase reliability, lower costs, and enhance revenue. The application of rigorous management and operating systems, deployed in our functional organization, has delivered consistently superior results.
OPTIMIZE RESULTS THROUGH GEOGRAPHIC AND
FUNCTIONAL DIVERSITY AND INTEGRATION
ExxonMobil’s size, geographic diversity, and
functional mix provide a natural hedge that
reduces the Company’s sensitivity to changes in
commodity prices, business cycles, and regional
market conditions. Our global presence provides
us with an efficient platform for investing in
any opportunity that meets our rigorous criteria.
EXXON MOBIL CORPORATION • 2004 FINANCIAL & OPERATING REVIEW
Corporate 5
In addition, by capitalizing on synergies among our various businesses, including physical integration of facilities, ExxonMobil is able to optimize the Corporation’s performance. For example, the integration of our refining and chemical facilities enhances margins through improved feedstock/product interchange and lowers site operating costs.
LEVERAGE EFFICIENCY GAINS THROUGH OUR
GLOBAL FUNCTIONAL ORGANIZATION
ExxonMobil operates our functional businesses
and service organizations on a global basis. Our
functional organization continually raises the
bar on execution performance. It facilitates
rapid deployment of our most valued resource,
our people, to the best opportunities. It also
enables prompt identification, prioritization,
and sharing of ideas, technology, and best
practices around the globe. However, success
with this organizational approach requires a
foundation of global management and support
systems.
Advantages do not last forever. Our ability to quickly implement the best solutions to problems across our global scale through our functional organization enables us to capture more value from our assets. ExxonMobil’s functional approach continues to deliver savings from cost efficiencies and revenue enhancements. In 2004, ExxonMobil delivered more than $1 billion in before-tax cost efficiencies.
DIFFERENTIATE THROUGH PROPRIETARY TECHNOLOGY
Technological innovation continues to
differentiate ExxonMobil from the competition.
ExxonMobil invests over $600 million per year on
proprietary research. We balance our investments
between extensions of existing technology and
breakthrough research. The development of
extensions is prioritized by business need and
is focused on the development of new
technologies and their application in day-to-day
operations. A significant portion of our
research effort is also aimed at discovering
next-generation and breakthrough technologies
that have the potential to provide a step-change
to the Corporation’s competitive position and
financial performance.
ATTRACT AND RETAIN EXCEPTIONAL PEOPLE
ExxonMobil’s success is the result of a highly
capable, diverse work force focused on the
right business priorities. The key to an
effective work force is to have a system that
aligns people who have the right capabilities
in the right direction at the right time.
Developing such a work force
requires leadership, succession planning,
accountability, stewardship, and constancy of
purpose.
Our process begins by recruiting outstanding candidates and accelerating the development of those with top management potential. It includes both formal training and skill development through exposure to a variety of experiences over a career. Our performance-based development system is integrated throughout the Corporation. ExxonMobil is a meritocracy where people are given valuable and rewarding experiences that help them learn, grow, and contribute at the same time.
MAINTAIN FINANCIAL STRENGTH AND FLEXIBILITY
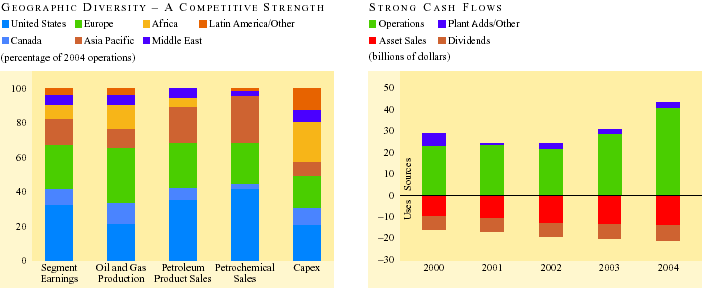
ExxonMobil has a long track record of generating
strong cash flow from our proven approach. This
performance has accelerated since the merger
between Exxon and Mobil in 1999. In 2004, we
generated a record $43.3 billion in cash flow
from operations and asset sales. This affords us
the financial strength and flexibility to pursue
all profitable investment opportunities that meet
our rigorous criteria. Last year, we invested
$14.9 billion to profitably grow the business.
Strong business results and a disciplined approach to financial management ensure that we maintain financial strength and flexibility regardless of the prevailing commodity price. This strength has enabled us to raise the dividend in each of the last 22 years – an unmatched record among international oil companies. We also distribute value to shareholders through the largest share purchase program in the industry. In 2004, we paid $6.9 billion in dividends and increased the amount distributed to shareholders through share purchases to $8 billion (excluding spending to offset share issuance under benefit plans).
2004 FINANCIAL & OPERATING REVIEW • EXXON MOBIL CORPORATION
6
ExxonMobil’s Core Objective – Delivering Long-Term Growth in Shareholder Value
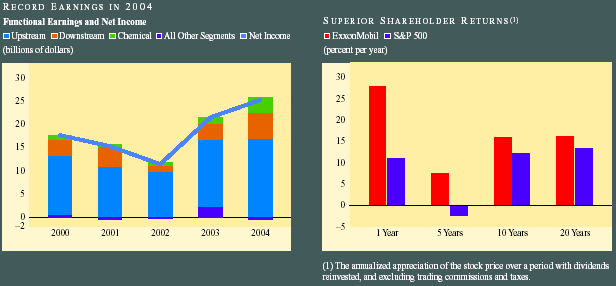
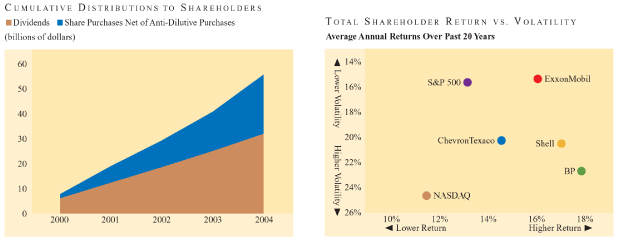
Our business strategies underpin ExxonMobil’s commitment to deliver superior shareholder value through dividend growth and long-term share price appreciation. Since Exxon and Mobil merged, we have distributed over $57 billion to shareholders in dividend payments and share purchases. Over that time, we have reduced the shares outstanding by over 8 percent while the stock price has appreciated 27 percent. Our compound annual dividend growth rate over the last 20 years of 4.8 percent has exceeded the U.S. Consumer Price Index by 1.7 percent. In 2004, the annual dividend grew by over 8 percent, to $1.06 per share.
Total shareholder returns on ExxonMobil stock have consistently outpaced the S&P 500 index. ExxonMobil shareholders have earned annualized returns of 16.0 percent and 16.1 percent during the last 10 and 20 years, compared with S&P 500 index returns of 12.1 percent and 13.2 percent, respectively. Risk and reward are a factor in any investment decision. Volatility – the fluctuation of monthly returns around its mean – is one measure of risk. By this measure, ExxonMobil stock risk was approximately equal to S&P 500 index risk during the past 20 years. However, ExxonMobil shareholders earned a 2.9 percent higher annual total return. The volatility of ExxonMobil returns has been well below that of our industry competitors during the same period.
DIVIDEND AND SHAREHOLDER RETURN INFORMATION
| 2004 | 2003 | 2002 | 2001 | 2000 | ||||||||||||||||
Net income per common share (dollars) |
3.91 | 3.24 | 1.69 | 2.23 | 2.55 | |||||||||||||||
Net
income per common share – assuming dilution (dollars) |
3.89 | 3.23 | 1.68 | 2.21 | 2.52 | |||||||||||||||
Dividends per common share (dollars) |
||||||||||||||||||||
First quarter |
0.25 | 0.23 | 0.23 | 0.22 | 0.22 | |||||||||||||||
Second quarter |
0.27 | 0.25 | 0.23 | 0.23 | 0.22 | |||||||||||||||
Third quarter |
0.27 | 0.25 | 0.23 | 0.23 | 0.22 | |||||||||||||||
Fourth quarter |
0.27 | 0.25 | 0.23 | 0.23 | 0.22 | |||||||||||||||
Total |
1.06 | 0.98 | 0.92 | 0.91 | 0.88 | |||||||||||||||
Dividends per share growth (annual percent) |
8.2 | 6.5 | 1.1 | 3.4 | 4.3 | |||||||||||||||
Number of common shares outstanding (millions) |
||||||||||||||||||||
Average |
6,482 | 6,634 | 6,753 | 6,868 | 6,953 | |||||||||||||||
Average – assuming dilution |
6,519 | 6,662 | 6,803 | 6,941 | 7,033 | |||||||||||||||
Year end |
6,401 | 6,568 | 6,700 | 6,809 | 6,930 | |||||||||||||||
Cash dividends paid on common stock (millions of dollars) |
6,896 | 6,515 | 6,217 | 6,254 | 6,123 | |||||||||||||||
Cash dividends paid to net income (percent) |
27 | 30 | 54 | 41 | 35 | |||||||||||||||
Cash dividends paid to cash flow(1)(percent) |
17 | 23 | 29 | 27 | 27 | |||||||||||||||
Total return to shareholders(2)(annual percent) |
27.9 | 20.5 | (8.9 | ) | (7.6 | ) | 10.2 | |||||||||||||
Market quotations for common stock (dollars) |
||||||||||||||||||||
High |
52.05 | 41.13 | 44.58 | 45.84 | 47.72 | |||||||||||||||
Low |
39.91 | 31.58 | 29.75 | 35.01 | 34.94 | |||||||||||||||
Average daily close |
45.29 | 36.14 | 37.70 | 41.29 | 41.42 | |||||||||||||||
Year-end close |
51.26 | 41.00 | 34.94 | 39.30 | 43.47 | |||||||||||||||
| (1) | Cash flow from operating activities. | |
| (2) | See Frequently Used Terms on pages 88 through 91. |
EXXON MOBIL CORPORATION • 2004 FINANCIAL & OPERATING REVIEW
Corporate 7
Energy Outlook – 2030
For ExxonMobil and for the entire energy sector, supplying energy is a challenge that must be met reliably, affordably, safely, and in an environmentally responsible manner. To do so requires an understanding of the opportunities ahead.
We continuously assess the trends and issues that are likely to affect energy in the future. This year we extended our outlook to 2030. The result is a comprehensive view of the fundamentals that underpin our business, which serves as a strategic framework to evaluate and select the business opportunities that hold the most promise. The key conclusions include:
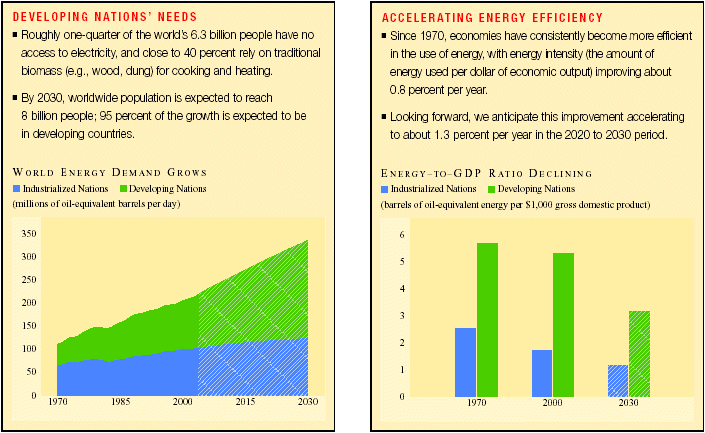
§ Growing economies and rising personal incomes are expected to drive world energy demand higher by 50 percent
§ Energy efficiency will become increasingly important to help economically balance supply and demand
§ Plentiful, reliable, and affordable energy supplies are essential – we expect oil and gas to remain predominant
§ Transportation remains the primary driver of oil demand – emerging new vehicle technology will dampen demand growth
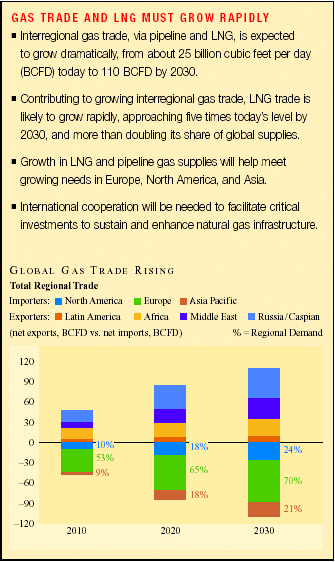
§ Power generation needs drive growing natural gas demand – diverse pipeline and liquefied natural gas (LNG) supplies are key
§ Growing the available oil and gas resource base is critical – persistent and significant technology investment is needed
Energy will continue to play an essential role in supporting economic prosperity and better living standards. As economies advance, the need for energy supplies will also grow. Meeting this need remains a crucial challenge.
Worldwide economic growth will likely average just under 3 percent per year through 2030, a pace similar to the last 20 years. We expect this growth and increasing personal income, notably in developing nations, to drive global energy demand increases averaging 1.7 percent per year. By 2030, energy consumption will likely reach 335 million barrels per day of oil-equivalent, or 50 percent more than today.
Close to 80 percent of this demand increase is expected to occur in developing nations. Meeting the growing need for modern energy supplies in these areas is essential to help raise living standards through better health, education, and productivity. With faster economic growth, average annual per capita income should approach $4,000 in developing nations by 2030, contributing to substantial increases in personal vehicle use.
As energy demand continues to grow, we anticipate increasingly more efficient use of resources. Critical to this result will be the development and use of more advanced technologies to meet growing transportation and power generation needs, as well as tightening environmental standards.
2004 FINANCIAL & OPERATING REVIEW • EXXON MOBIL CORPORATION
8
OIL & GAS WILL REMAIN PREDOMINANT IN
GLOBAL ENERGY MIX; GAS WILL SURPASS COAL
We anticipate energy demand will continue to be
met through a broad portfolio of energy options.
Oil and natural gas are essential to improving
prosperity throughout the world. We expect them
to remain the predominant fuels through the
middle of the century, with gas surpassing coal
as the next highest fuel share behind oil.
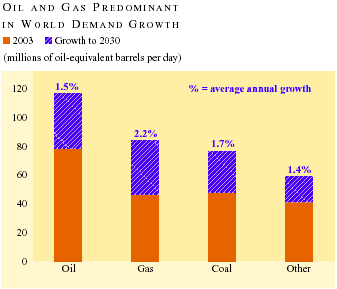
| § | We expect the share of oil and gas in the world’s energy supply — close to 60 percent today — will stay relatively stable through 2030. | |||
| § | Coal will maintain its share of the energy mix, driven by strong demand in China and India, and continued growth in the United States. | |||
| § | Hydropower and nuclear power will also grow, though public opposition and the lack of suitable hydro sites will likely limit global capacity increases. | |||
| § | Although wind and solar energy are likely to average double-digit growth due to public subsidies/mandates, we expect their share will be only about 1 percent of the world’s energy supply in 2030. | |||
In the very long term, the energy mix will likely become more diversified. We expect higher growth for nuclear and the development of biofuel energies. However, over the outlook period, fossil fuels are the only energy forms with the scale and versatility to meet the challenge of growing world energy demand.
TRANSPORTATION DRIVES OIL DEMAND
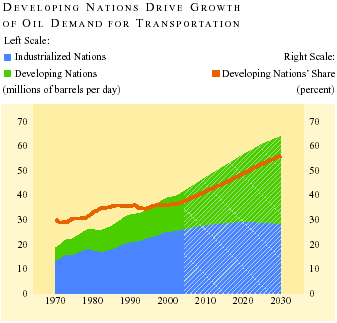
Transportation uses are expected to account for
about 60 percent of the worldwide increase in
oil demand through 2030. With rising vehicle
use, the developing nations’ share of global
transport fuel is anticipated to rise from 35
percent to 55 percent.
Nevertheless, we expect several factors will significantly dampen long-term oil demand growth during the outlook period, especially in the industrialized nations. These factors include:
| § | A gradual shift in the new car mix favoring more cars and fewer light trucks and sport utility vehicles; | |||
| § | A rising share of diesels, hybrids, and advanced internal combustion engines to between 40 to 60 percent of new vehicle sales in the United States, Europe, and Japan; and, | |||
| § | Continued incremental improvements to
conventional internal combustion engines. |
|||
FUEL EFFICIENCY A KEY CHALLENGE
By 2030, we expect the vast majority of
automobiles will continue to use an internal
combustion engine, including hybrids.
ExxonMobil is engaged in research that targets
significant improvements in fuel efficiency and
emission levels. We expect that the
next-generation vehicle will be a composite of
the best emerging internal combustion engine
technologies combined with an electric motor in
an optimized hybrid configuration.
Promising internal combustion engine technologies include:
| § | Hybrid-engine technology using a gasoline engine for steady speeds and an electric motor for extra power during the more energy demanding phases of start-up and acceleration; and, | |||
| § | New combustion technologies, such as homogenous charge compression ignition (HCCI), that have the potential to deliver the higher efficiency of a diesel engine with the low emissions of a gasoline engine. | |||
Research is also under way on automotive fuel cell systems powered by hydrogen, an alternative longer-term approach. Hydrogen is abundant but does not exist freely in nature, and so requires significant energy to produce. The technical and economic issues related to the cost, safe distribution, and widespread use of hydrogen are significant, and it may well take decades to overcome them.
EXXON MOBIL CORPORATION • 2004 FINANCIAL & OPERATING REVIEW
Corporate 9
POWER GENERATION DRIVES NATURAL GAS DEMAND
Over the period to 2030, we expect natural gas will be the fastest
growing primary energy source, capturing about 30 percent of the
growth in total energy demand, and reaching one quarter of global
energy supply. About half of the growth in gas demand will likely
be needed to meet power generation requirements to supply
worldwide electricity demand, which is expected to double by 2030.
TECHNOLOGY INVESTMENT NEEDED TO EXTEND CRITICAL OIL AND GAS
RESOURCES
By 2030, global oil and gas demand is likely to be close to 200
million barrels per day of oil-equivalent compared to about 130
million barrels per day in 2004. Meeting this demand will be an
enormous challenge. The ongoing task is to economically find,
produce, and deliver this energy. By 2030, the industry will likely
need to add roughly 170 million oil-equivalent barrels per day of
new oil and gas production – an amount close to one-third more than
current production levels. Development of these supplies will not
only require access to resources, but increasingly the cooperation
and commitment of governments to advance international development
and trade relationships that promote security of supply.
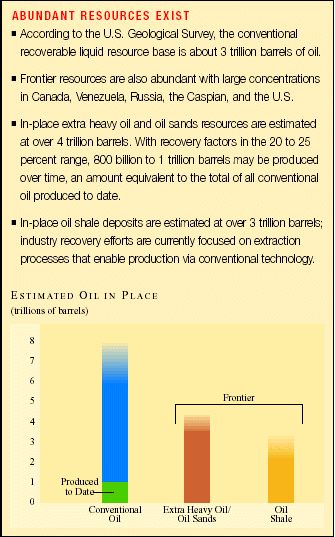
Technology advances remain critical to increasing future oil and gas supplies, enabling more effective resource recovery while minimizing costs and environmental effects. New technologies, such as 4D seismic and direct hydrocarbon detection, promise to further advance our capability to extend recoverable resources worldwide. New technology will also enable economic development of “frontier” resources – extra heavy oil, oil sands, and oil shale – to help ensure adequate supplies of fossil fuels at affordable prices.
The cost to develop these resources is very large. According to the International Energy Agency, the investment required to meet total energy needs worldwide through 2030 will be $16 trillion, with about $200 billion per year required for oil and gas. Financing will be a critical global challenge, with funding dependent on whether investment conditions provide potential investors sufficient incentives versus other options.
ExxonMobil, with our leading resource base, financial strength, disciplined investment approach, and technology portfolio, is well-positioned to participate in the global investment needed to develop new energy supplies. These strengths enable us to remain at the forefront of competition in meeting the energy challenges and capitalizing on the opportunities ahead.
2004 FINANCIAL & OPERATING REVIEW • EXXON MOBIL CORPORATION
10
Technology
Our unwavering commitment to research underscores a fundamental belief that technology is absolutely vital to our effort to provide reliable and affordable energy supplies. Increasingly, proprietary technology solutions are a key differentiating factor for ExxonMobil.
ExxonMobil’s unparalleled commitment to the development and application of industry-leading technologies provides the business with opportunities to discover, produce, manufacture, and market oil and gas resources and petrochemicals that may not be available to competitors. Our research efforts are matched to our business needs through a rigorous prioritization process based on both sound economic and technical evaluation.
New energy supplies have a number of prerequisites for commercialization. Access to resources and the finances to develop them are basic requirements. However, continuing advances in technology are vital to economically unlocking the potential in many of the world’s hydrocarbon basins. Technology is equally important in the development of the many high-quality petroleum and petrochemical products used every day.
ExxonMobil maintains one of the industry’s largest research and development efforts, spending more that $600 million annually. We emphasize proprietary solutions that solve critical business challenges. We balance our investment between technology extensions, which can be rapidly deployed to our existing operations, and breakthrough research that can have a significant and lasting impact on the Corporation and industry.
Upstream Technology
ExxonMobil’s broad research effort addresses a spectrum of Upstream business needs from the generation of new opportunities to maximizing hydrocarbon production from discovered resources. The highly skilled staff of the Upstream Research Company, including geologists, engineers, mathematicians, and other scientists, is dedicated to maintaining and growing a portfolio of technology that translates into a competitive advantage for ExxonMobil. Research initiatives range in scale from the physics of the wellbore to the movement of the earth’s crust, but they are all guided by strong links to the business and a relentless focus on developing a fundamental understanding of the underlying science.
GENERATING NEW OPPORTUNITIES
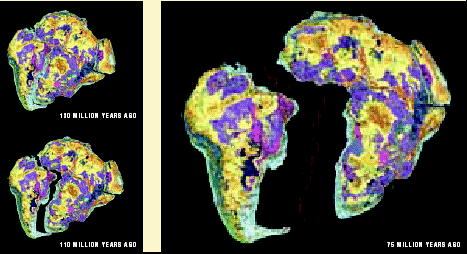
A new research effort is aimed at developing novel geologic concepts and technologies to help find new hydrocarbon resources. This effort includes work ranging from predicting how the microscopic pore spaces that hold hydrocarbons change through time, to understanding the movement of large pieces of the earth’s crust. In the example shown, a proprietary model calculates how South America and Africa have moved apart on a geologic time scale. This type of movement has a significant influence on where oil and gas reservoirs have formed. This proprietary technology has already helped our geoscientists generate ideas about where new exploration opportunities might exist.
EXXON MO B I L C O R P O R A T I O N • 2 0 0 4 F I N A N C I A L & O P E R A T I N G R E V I E W
Corporate 11

IMPROVED SEISMIC IMAGING
ExxonMobil dedicates a significant research effort to improving our ability to image the subsurface using seismic technologies. Our current focus is on developing proprietary methods that produce higher-quality images than standard industry processing, allowing better predictions of the properties of discovered reservoirs. Advances in this area are key to cost-effectively finding and developing hydrocarbon resources in increasingly challenging environments.


MAXIMIZING HYDROCARBON RECOVERY
Maximizing recovery from discovered resources is critical to the success of our investment program. ExxonMobil has developed a number of patented technologies that produce exceptionally detailed reservoir images. In the examples shown, the computer-processed image of a deeply buried carbonate reservoir (left) looks remarkably like modern analogs, such as the Great Barrier Reef of Australia (right). The blue areas indicate low-quality rock, which with these better images can be avoided during drilling.
Also critical to maximizing recovery is ExxonMobil’s application of the industry’s only next-generation reservoir simulator, EMpower. Today over 275 ExxonMobil engineers regularly use EMpower to build detailed reservoir simulation models. These computer models take advantage of a long list of proprietary capabilities, such as the ability to rigorously analyze multiple reservoirs linked together through a common facility. Even as ExxonMobil extracts unprecedented value from EMpower, we continue to invest in further enhancements, such as advanced capabilities for modeling the recovery of heavy oil.
THE ENGINEERED WELLBORE
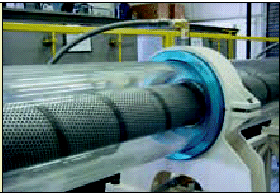
ExxonMobil routinely applies its Engineered Wellbore approach to drill, complete, and produce wells at the physics-based technical limit, resulting in lower costs and higher production rates. This technology includes practices and procedures that maximize production rates while sustaining wellbore longevity. These practices and procedures are derived from physics-based models, and are validated in our unique experimental laboratories, such as the Wellbore Simulator (shown right). The Engineered Wellbore approach has led to 27 consecutive successful well installations offshore Africa, where other operators have encountered significant difficulties.
2004 F I N A N C I A L & O P E R A T I N G R E V I E W • E X X O N M O B I L C O R P O R A T I O N
12
Manufacturing and Product Technology
Manufacturing and product technologies encompass and are driven by both the Downstream and Chemical businesses, aiming to meet the needs of the marketplace and create competitive advantage. Whether it’s a new plastic, a new lubricant, or a cutting-edge technology to improve the efficiency of manufacturing operations, the scientists and engineers at ExxonMobil Research & Engineering Company and ExxonMobil Chemical work in collaborative teams with their business partners. The ideas they generate lead to experiments in the laboratory at the molecular level. Using state-of-the-art research techniques, new and innovative processes and product technologies are scaled to commercial size. Once proven, they are deployed across our global businesses to capture maximum value.
COMMERCIALIZING GAS-TO-LIQUIDS TECHNOLOGY
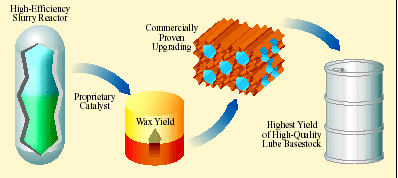
An important element of downstream technology is to develop state-of-the-art options for resource commercialization. Our 154-thousand-barrel-per-day gas-to-liquids (GTL) project in Qatar, the world’s largest announced to date, will benefit from significant upstream and manufacturing economies of scale. ExxonMobil’s AGC-21 GTL technology combines several proprietary technologies that create competitive advantage. Our slurry reactor system, based on a proprietary cobalt catalyst and expertise in managing fluidized catalytic systems, enables lower-cost synthesis and better control of reaction conditions. This process produces high-quality diesel blendstock and a high yield of very high-quality lube basestocks.
PREMIUM LUBRICANTS
ExxonMobil’s proprietary MSDW-2 catalyst is the industry-leading technology to make high-quality lube basestocks. Our technology has much lower capital costs than conventional solvent dewaxing. High catalyst activity, long life, and tolerance to feed impurities contribute to performance and cost advantages over competing technologies. MSDW-2 technology has been very successfully applied in our own refineries, has captured the major share of recent industry lube upgrading licenses, and is also a critical element of the upgrading step in our GTL technology.
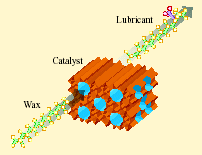
A UNIQUE CATALYSIS CAPABILITY LEVERAGES ASSETS
ExxonMobil has a long history of developing refining and chemical manufacturing technologies that improve efficiency and provide new solutions to meet market needs. The critical priorities are to enhance the performance of existing manufacturing facilities and the quality and performance of the products produced. Catalysis – the science of engineering substances that facilitate chemical reactions – is one of the most effective tools to address these priorities.
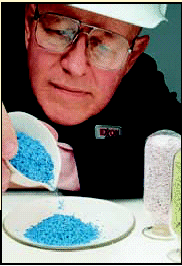
Our SCANfining catalyst is used in over 1 million barrels per day of low-sulfur motor gasoline production in North America.
ExxonMobil’s unique proprietary capability in this area is the driver behind improvements in our ability to increase yields from existing processing hardware. Likewise, technology that employs new catalysts, such as our SCANfining technology for low-sulfur gasoline, shown at left, and Nebula-20 for ultralow-sulfur diesel, enable us to meet new, more stringent product specifications while minimizing investment. Our competitive position in catalysis is supported by more than 150 catalyst family patents and over 40 commercialized catalysts. The value of our catalyst assets is enhanced and regularly validated through our licensing business.
EXXON M O B I L C O R P O R A T I O N • 2 0 0 4 F I N A N C I A L & O P E R A T I N G R E V I E W
Corporate 13
HIGHER-VALUE CHEMICAL PRODUCTS
ExxonMobil is a leader in metallocene catalyst development, which we were the first to commercialize in 1992. Metallocenes are a class of chemical compounds that function as polymerization catalysts. They significantly enhance the mechanical and optical properties of polyethylene and polypropylene.
Our proprietary polymer science allows us to select the right metallocene catalyst and process conditions to tailor the exact end-use properties to meet market needs. Since their introduction, sales of high-margin polymers using our metallocene catalysts have grown by an average of 30 percent per year – four to five times industry growth over the same period.
This growth is supported by the continuous introduction of new and enhanced products such as our Vistamaxx specialty elastomers. These new polymers can enhance the elasticity, softness, adhesion, strength, and durability of our customers’ products.
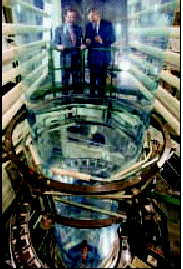
Film made with metallocene polyethylene provides a unique combination of stiffness and clarity as demonstrated on this commercial production line.
INCREASING MARGIN CAPTURE
We have used our advanced process technology to identify and deliver initiatives that improve our manufacturing processes and equipment utilization. As a result, we lead the industry in refinery operating reliability. In 2004, technology helped reduce unplanned capacity loss below 2 percent.
In refining, one area of promise is our breakthrough research in low-energy separation technology. Advances in materials science have created opportunities for alternative separation techniques to conventional energy-intensive distillation. Membranes, adsorbents, and reactive separations, if successful, could have a wide range of potential applications, from substantially reducing the energy intensity of crude oil fractionation to improvements in upgrading difficult-to-process raw materials, such as heavy crudes.
Technology also helps us reduce raw material costs. Optimizing the selection and use of raw materials through our refineries and chemical plants is one of the best opportunities to improve margins in the downstream and chemical business. ExxonMobil has developed unique capabilities to analyze, model, and optimize the chemistry at the molecular level in our units – what we call “molecule management.” The application of our proprietary molecular management technologies has expanded from individual units to regional manufacturing centers, and should ultimately encompass our entire supply system. When fully implemented, the impact of these technologies is likely to be about $500 million per year.
NEW R&D CAPABILITIES SPEED UP RESEARCH
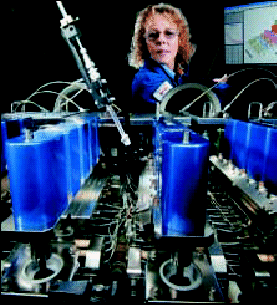
High throughput experimentation (HTE) is a combination of technologies in experimental design, materials synthesis, and testing, combined with advanced data analysis and visualization tools that have delivered exciting results. Using this technique, we use computer-driven robotics to quickly generate many forms of catalysts. We then evaluate those candidate catalysts in high-speed screening tests for commercial application.
Using HTE, we can conduct nearly 100 experiments simultaneously, providing results in days that before took weeks to months. So far we have conducted over 30,000 tests. Beyond catalyst synthesis and testing, we have plans to apply HTE to product formulation and advanced separation techniques. We expect to significantly shorten the time it takes to discover new technologies. ExxonMobil has capabilities in this field that are unique in the oil industry.
Technicians like Kathryn Hammack can conduct multiple experiments simultaneously using HTE at the Baytown Technology and Engineering Complex.
2004 FIN A N C I A L & O P E R A T I N G R E V I E W • E X X O N M O B I L C O R P O R A T I O N
14
Safety, Health & Environment
We maintain our commitment to high standards of safety, security, health, and environmental care.
2004 HIGHLIGHTS
| § | Safest year ever | |||
| § | Record energy efficiency performance in our Refining and Chemical businesses | |||
GUIDING PRINCIPLE
ExxonMobil is committed to maintaining high standards of safety, security, health, and environmental care. We comply with all applicable environmental laws and regulations, and apply responsible standards where laws and regulations do not exist.
The products we produce are essential to society. ExxonMobil has shown that we can produce them while protecting the health and safety of people, and safeguarding the environment. Our goal is to drive injuries, illnesses, and operational incidents with environmental impact to zero.
RISK MANAGEMENT AND SECURITY
Risks are inherent in the energy and petrochemical businesses, including risks associated with safety, health, and the environment. ExxonMobil recognizes these risks and takes a systematic managed approach to mitigate their impact. The same rigor and discipline that underpin our investment program are also used in our approach to the management of our performance in safety, security, health, and the environment. ExxonMobil’s commitment is supported by our investment in related science and technology, which will help improve performance in these areas.
Our Operations Integrity Management System (OIMS) is a risk management tool for assessing and improving our safety, security, health, and environmental performance. OIMS enables us to measure progress, plan future improvements, and ensure management accountability for results in these areas. OIMS conforms with the international standard for environmental management systems (ISO 14001).
ExxonMobil has a long-standing commitment to the protection of its people, facilities, information, and other assets. Security measures take into account perceived risk, cost and practicality, compliance with applicable laws, and recognition of social norms.
EXXONMOBIL LNG SAFETY & ENVIRONMENTAL INSTITUTE
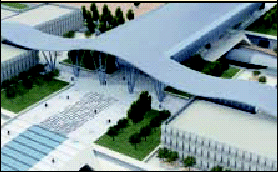
ExxonMobil is establishing a Liquefied Natural Gas Safety and Environmental Institute as an anchor tenant in the recently announced Science and Technology Park in Education City, Doha, Qatar. Anticipated opening is 2006. The Institute will focus on developing leading-edge technologies to help ensure the highest standards of safety and environmental performance in the world’s largest gas processing and liquefaction facilities. This is one of the many efforts supporting ExxonMobil’s commitment to safe, reliable, and environmentally responsible activities.
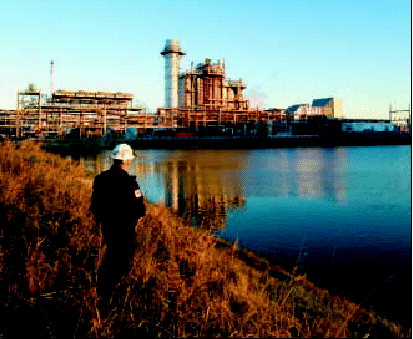
“We further believe ExxonMobil to be among the industry leaders in the extent to which environmental management considerations have been integrated into its business processes for ongoing operations and for the planning and development of new projects.” – Lloyd’s Register Quality Assurance. September 2, 2004. Above. Dale Williams surveys the new cogeneration project at the Baytown Olefins Plant.
SAFETY AND HEALTH
ExxonMobil has long been an industry leader in safety performance. We believe that providing a safe work environment for our employees, contractors, and communities contributes to and is indicative of superior performance in other aspects of our operations. In 2004, we achieved our safest year ever, with the fewest safety incidents in ExxonMobil history. Over the last decade, we have reduced lost-time incidents by a factor of ten.
While our systematic approach to managing risk minimizes the likelihood of a major incident, such risks cannot be entirely eliminated. We therefore place great emphasis on preparations to respond effectively to potential incidents, including product spills,
EXXON MOBIL CORPORATION • 2004 FINANCIAL & OPERATING REVIEW
Corporate 15
fires, explosions, natural disasters, and security incidents. As part of this preparation in 2004, we conducted nine major drills in locations around the world.
The world’s health pandemics are taking a staggering toll in many of the communities where we operate, particularly West Africa. ExxonMobil is helping to address this plight head-on. Our “Africa Health Initiative” grants include programs to tackle malaria at the community level, to promote research and development of new drugs, and to advocate for international support. In 2004, we also developed a comprehensive African program known as Stop AIDS to help address HIV/AIDS where we live and work.
ENVIRONMENT
ExxonMobil is committed to leadership in environmental performance. We will operate responsibly wherever we do business by implementing scientifically sound, practical solutions. Our business units around the world develop detailed environmental business plans to identify and manage environmental risks and address issues at the local level.
We are taking a number of significant actions to improve our efficiency and reduce greenhouse gas emissions (GHG) from our operations:
| § | We are capturing significant energy efficiency improvements with our Global Energy Management System (GEMS). We achieved record energy efficiency in our refining and chemical businesses in 2004. | |||
| § | ExxonMobil is an industry leader in the use of cogeneration, a much more efficient way to make power and steam than by traditional methods. We currently have interests in over 85 cogeneration facilities with the capacity to produce approximately 3,300 megawatts of electricity. In 2004, 400 megawatts of new cogeneration capacity were added at our facilities in the United States and Canada, and we expect to add another 400 megawatts in 2005 at a total expected investment for both years of nearly $1 billion. | |||

| § | ExxonMobil is taking steps to significantly reduce flaring in the near future, although flaring increased in 2004 due to higher oil production. In Nigeria, where ExxonMobil flares a lower percentage of gas than the industry average, projects are being implemented to simultaneously increase production and end nonessential flaring ahead of the government mandated deadline. These projects, the first of which is scheduled for start-up in 2006, will reduce GHG emissions by approximately 7 million metric tons per year. |
We are prepared to meet the new European GHG regulatory requirements that come into effect in 2005, using a system-wide approach that addresses all affected facilities in a cost-effective manner.
In the longer term, we are progressing technologies that will significantly reduce emissions. The majority of GHG emissions associated with the production and the use of oil arise from consumer use of fuels (87 percent), with the remainder from industry operations (13 percent). We are working with automobile manufacturers, universities, and government agencies to develop advanced fuels and new energy technologies that are economic and have broad application. We are committed to further development of breakthrough technology to reduce GHG emissions through research projects, including initiating the largest privately-funded academic energy technology initiative in history – the Global Climate and Energy Project (GCEP) led by Stanford University. For more information, refer to the website gcep.stanford.edu.
MORE INFORMATION
For more information regarding our commitment to safety, health, and the environment, refer to the following documents available on our website at www.exxonmobil.com.
| § | Corporate Citizenship Report (CCR) | |||
| § | Report on Energy Trends, Greenhouse Gas Emissions, and Alternative Energy | |||
2004 F I N A N C I A L & O P E R A T I N G R E V I E W • E X X O N M O B I L C O R P O R A T I O N
16
Financial Summary
FUNCTIONAL EARNINGS
| 2004 Quarters | ||||||||||||||||||||||||||||||||||||
| (millions of dollars) | First | Second | Third | Fourth | 2004 | 2003 | 2002 | 2001 | 2000 | |||||||||||||||||||||||||||
Net Income (U.S. GAAP) |
||||||||||||||||||||||||||||||||||||
Upstream |
||||||||||||||||||||||||||||||||||||
United States |
1,154 | 1,237 | 1,173 | 1,384 | 4,948 | 3,905 | 2,524 | 3,933 | 4,542 | |||||||||||||||||||||||||||
Non-U.S. |
2,859 | 2,609 | 2,756 | 3,503 | 11,727 | 10,597 | 7,074 | 6,803 | 8,143 | |||||||||||||||||||||||||||
Total |
4,013 | 3,846 | 3,929 | 4,887 | 16,675 | 14,502 | 9,598 | 10,736 | 12,685 | |||||||||||||||||||||||||||
Downstream |
||||||||||||||||||||||||||||||||||||
United States |
392 | 907 | 11 | 876 | 2,186 | 1,348 | 693 | 1,924 | 1,561 | |||||||||||||||||||||||||||
Non-U.S. |
612 | 600 | 840 | 1,468 | 3,520 | 2,168 | 607 | 2,303 | 1,857 | |||||||||||||||||||||||||||
Total |
1,004 | 1,507 | 851 | 2,344 | 5,706 | 3,516 | 1,300 | 4,227 | 3,418 | |||||||||||||||||||||||||||
Chemical |
||||||||||||||||||||||||||||||||||||
United States |
118 | 148 | 329 | 425 | 1,020 | 381 | 384 | 298 | 644 | |||||||||||||||||||||||||||
Non-U.S. |
446 | 459 | 680 | 823 | 2,408 | 1,051 | 446 | 409 | 517 | |||||||||||||||||||||||||||
Total |
564 | 607 | 1,009 | 1,248 | 3,428 | 1,432 | 830 | 707 | 1,161 | |||||||||||||||||||||||||||
Corporate and financing |
(141 | ) | (170 | ) | (109 | ) | (59 | ) | (479 | ) | 1,510 | (442 | ) | (142 | ) | (538 | ) | |||||||||||||||||||
Merger expenses |
— | — | — | — | — | — | (275 | ) | (525 | ) | (920 | ) | ||||||||||||||||||||||||
Discontinued operations |
— | — | — | — | — | — | 449 | 102 | 184 | |||||||||||||||||||||||||||
Extraordinary gain |
— | — | — | — | — | — | — | 215 | 1,730 | |||||||||||||||||||||||||||
Accounting change |
— | — | — | — | — | 550 | — | — | — | |||||||||||||||||||||||||||
Net income (U.S.GAAP) |
5,440 | 5,790 | 5,680 | 8,420 | 25,330 | 21,510 | 11,460 | 15,320 | 17,720 | |||||||||||||||||||||||||||
Net income per common share (dollars) |
0.83 | 0.89 | 0.88 | 1.31 | 3.91 | 3.24 | 1.69 | 2.23 | 2.55 | |||||||||||||||||||||||||||
Net income per common share –
assuming dilution (dollars) |
0.83 | 0.88 | 0.88 | 1.30 | 3.89 | 3.23 | 1.68 | 2.21 | 2.52 | |||||||||||||||||||||||||||
| Merger Effects, Discontinued Operations, Accounting Change, and Other Special Items | ||||||||||||||||||||||||||||||||||||
Upstream |
||||||||||||||||||||||||||||||||||||
United States |
— | — | — | — | — | — | — | — | — | |||||||||||||||||||||||||||
Non-U.S. |
— | — | — | — | — | 1,700 | (215 | ) | — | — | ||||||||||||||||||||||||||
Total |
— | — | — | — | — | 1,700 | (215 | ) | — | — | ||||||||||||||||||||||||||
Downstream |
||||||||||||||||||||||||||||||||||||
United States |
— | — | (550 | ) | — | (550 | ) | — | — | — | — | |||||||||||||||||||||||||
Non-U.S. |
— | — | — | — | — | — | — | — | — | |||||||||||||||||||||||||||
Total |
— | — | (550 | ) | — | (550 | ) | — | — | — | — | |||||||||||||||||||||||||
Chemical |
||||||||||||||||||||||||||||||||||||
United States |
— | — | — | — | — | — | — | — | — | |||||||||||||||||||||||||||
Non-U.S. |
— | — | — | — | — | — | — | — | — | |||||||||||||||||||||||||||
Total |
— | — | — | — | — | — | — | — | — | |||||||||||||||||||||||||||
Corporate and financing |
— | — | — | — | — | 2,230 | — | — | — | |||||||||||||||||||||||||||
Merger expenses |
— | — | — | — | — | — | (275 | ) | (525 | ) | (920 | ) | ||||||||||||||||||||||||
Discontinued operations |
— | — | — | — | — | — | 449 | 102 | 184 | |||||||||||||||||||||||||||
Extraordinary gain |
— | — | — | — | — | — | — | 215 | 1,730 | |||||||||||||||||||||||||||
Accounting change |
— | — | — | — | — | 550 | — | — | — | |||||||||||||||||||||||||||
Corporate total |
— | — | (550 | ) | — | (550 | ) | 4,480 | (41 | ) | (208 | ) | 994 | |||||||||||||||||||||||
| Earnings Excluding Merger Effects, Discontinued Operations, Accounting Change, and Other Special Items | ||||||||||||||||||||||||||||||||||||
Upstream |
||||||||||||||||||||||||||||||||||||
United States |
1,154 | 1,237 | 1,173 | 1,384 | 4,948 | 3,905 | 2,524 | 3,933 | 4,542 | |||||||||||||||||||||||||||
Non-U.S. |
2,859 | 2,609 | 2,756 | 3,503 | 11,727 | 8,897 | 7,289 | 6,803 | 8,143 | |||||||||||||||||||||||||||
Total |
4,013 | 3,846 | 3,929 | 4,887 | 16,675 | 12,802 | 9,813 | 10,736 | 12,685 | |||||||||||||||||||||||||||
Downstream |
||||||||||||||||||||||||||||||||||||
United States |
392 | 907 | 561 | 876 | 2,736 | 1,348 | 693 | 1,924 | 1,561 | |||||||||||||||||||||||||||
Non-U.S. |
612 | 600 | 840 | 1,468 | 3,520 | 2,168 | 607 | 2,303 | 1,857 | |||||||||||||||||||||||||||
Total |
1,004 | 1,507 | 1,401 | 2,344 | 6,256 | 3,516 | 1,300 | 4,227 | 3,418 | |||||||||||||||||||||||||||
Chemical |
||||||||||||||||||||||||||||||||||||
United States |
118 | 148 | 329 | 425 | 1,020 | 381 | 384 | 298 | 644 | |||||||||||||||||||||||||||
Non-U.S. |
446 | 459 | 680 | 823 | 2,408 | 1,051 | 446 | 409 | 517 | |||||||||||||||||||||||||||
Total |
564 | 607 | 1,009 | 1,248 | 3,428 | 1,432 | 830 | 707 | 1,161 | |||||||||||||||||||||||||||
Corporate and financing |
(141 | ) | (170 | ) | (109 | ) | (59 | ) | (479 | ) | (720 | ) | (442 | ) | (142 | ) | (538 | ) | ||||||||||||||||||
Corporate total |
5,440 | 5,790 | 6,230 | 8,420 | 25,880 | 17,030 | 11,501 | 15,528 | 16,726 | |||||||||||||||||||||||||||
Earnings per common share (dollars) |
0.83 | 0.89 | 0.96 | 1.31 | 3.99 | 2.57 | 1.70 | 2.27 | 2.40 | |||||||||||||||||||||||||||
Earnings
per common share –
assuming dilution (dollars) |
0.83 | 0.88 | 0.96 | 1.30 | 3.97 | 2.56 | 1.69 | 2.25 | 2.37 | |||||||||||||||||||||||||||
EXXON MOBIL CORPORATION • 2004 FINANCIAL & OPERATING REVIEW
C o r p o r a t e 17
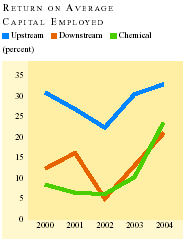
RETURN ON AVERAGE CAPITAL EMPLOYED ( 1 ) BY BUSINESS
| (percent) | 2004 | 2003 | 2002 | 2001 | 2000 | |||||||||||||||
Upstream |
||||||||||||||||||||
United States |
37.0 | 28.9 | 19.0 | 30.4 | 35.3 | |||||||||||||||
Non-U.S. |
31.5 | 31.0 | 23.7 | 25.1 | 28.7 | |||||||||||||||
Total |
32.9 | 30.4 | 22.3 | 26.8 | 30.8 | |||||||||||||||
Downstream |
||||||||||||||||||||
United States |
28.6 | 16.7 | 8.6 | 25.0 | 19.6 | |||||||||||||||
Non-U.S. |
18.0 | 11.5 | 3.4 | 12.4 | 9.4 | |||||||||||||||
Total |
21.0 | 13.0 | 5.0 | 16.1 | 12.3 | |||||||||||||||
Chemical |
||||||||||||||||||||
United States |
19.4 | 7.3 | 7.3 | 7.2 | 11.4 | |||||||||||||||
Non-U.S. |
25.7 | 11.8 | 5.3 | 5.8 | 6.3 | |||||||||||||||
Total |
23.5 | 10.2 | 6.1 | 6.4 | 8.4 | |||||||||||||||
Corporate and financing |
— | — | — | — | — | |||||||||||||||
Discontinued operations |
— | — | 63.2 | 7.2 | 12.3 | |||||||||||||||
Corporate total |
23.8 | 20.9 | 13.5 | 17.8 | 20.6 | |||||||||||||||
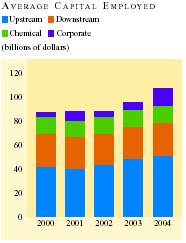
AVERAGE CAPITAL EMPLOYED ( 1 ) BY BUSINESS
| (millions of dollars) | 2004 | 2003 | 2002 | 2001 | 2000 | |||||||||||||||
Upstream |
||||||||||||||||||||
United States |
13,355 | 13,508 | 13,264 | 12,952 | 12,864 | |||||||||||||||
Non-U.S. |
37,287 | 34,164 | 29,800 | 27,077 | 28,354 | |||||||||||||||
Total |
50,642 | 47,672 | 43,064 | 40,029 | 41,218 | |||||||||||||||
Downstream |
||||||||||||||||||||
United States |
7,632 | 8,090 | 8,060 | 7,711 | 7,976 | |||||||||||||||
Non-U.S. |
19,541 | 18,875 | 17,985 | 18,610 | 19,756 | |||||||||||||||
Total |
27,173 | 26,965 | 26,045 | 26,321 | 27,732 | |||||||||||||||
Chemical |
||||||||||||||||||||
United States |
5,246 | 5,194 | 5,235 | 5,506 | 5,644 | |||||||||||||||
Non-U.S. |
9,362 | 8,905 | 8,410 | 8,333 | 8,170 | |||||||||||||||
Total |
14,608 | 14,099 | 13,645 | 13,839 | 13,814 | |||||||||||||||
Corporate and financing |
14,916 | 6,637 | 4,878 | 6,399 | 3,198 | |||||||||||||||
Discontinued operations |
— | — | 710 | 1,412 | 1,501 | |||||||||||||||
Corporate total |
107,339 | 95,373 | 88,342 | 88,000 | 87,463 | |||||||||||||||
Average capital
employed applicable
to equity companies
included above |
18,049 | 15,587 | 14,001 | 13,902 | 15,330 | |||||||||||||||
2004 FINANCIAL & OPERATING REVIEW • EXXON MOBIL CORPORATION
18
CAPITAL AND EXPLORATION EXPENDITURES ( 1 )
| (millions of dollars) | 2004 | 2003 | 2002 | 2001 | 2000 | |||||||||||||||
Upstream |
||||||||||||||||||||
Exploration |
||||||||||||||||||||
United States |
248 | 275 | 295 | 471 | 285 | |||||||||||||||
Non-U.S. |
1,035 | 940 | 1,015 | 1,188 | 1,222 | |||||||||||||||
Total |
1,283 | 1,215 | 1,310 | 1,659 | 1,507 | |||||||||||||||
Production(2) |
||||||||||||||||||||
United States |
1,669 | 1,842 | 2,057 | 1,947 | 1,574 | |||||||||||||||
Non-U.S. |
8,629 | 8,758 | 6,949 | 5,157 | 3,818 | |||||||||||||||
Total |
10,298 | 10,600 | 9,006 | 7,104 | 5,392 | |||||||||||||||
Power and Coal |
||||||||||||||||||||
United States |
5 | 8 | 5 | 5 | 6 | |||||||||||||||
Non-U.S. |
129 | 165 | 73 | 48 | 28 | |||||||||||||||
Total |
134 | 173 | 78 | 53 | 34 | |||||||||||||||
Total Upstream (Exploration, |
||||||||||||||||||||
Production, Power, and Coal) |
11,715 | 11,988 | 10,394 | 8,816 | 6,933 | |||||||||||||||
Downstream |
||||||||||||||||||||
Refining |
||||||||||||||||||||
United States |
550 | 998 | 670 | 524 | 632 | |||||||||||||||
Non-U.S. |
774 | 768 | 685 | 514 | 703 | |||||||||||||||
Total |
1,324 | 1,766 | 1,355 | 1,038 | 1,335 | |||||||||||||||
Marketing |
||||||||||||||||||||
United States |
201 | 216 | 255 | 370 | 372 | |||||||||||||||
Non-U.S. |
811 | 739 | 761 | 836 | 808 | |||||||||||||||
Total |
1,012 | 955 | 1,016 | 1,206 | 1,180 | |||||||||||||||
Pipeline/Marine |
||||||||||||||||||||
United States |
24 | 30 | 55 | 67 | 73 | |||||||||||||||
Non-U.S. |
45 | 30 | 24 | 11 | 30 | |||||||||||||||
Total |
69 | 60 | 79 | 78 | 103 | |||||||||||||||
Total Downstream (Refining, |
||||||||||||||||||||
Marketing, and Pipeline/Marine) |
2,405 | 2,781 | 2,450 | 2,322 | 2,618 | |||||||||||||||
Chemical |
||||||||||||||||||||
United States |
262 | 333 | 575 | 432 | 351 | |||||||||||||||
Non-U.S. |
428 | 359 | 379 | 440 | 1,117 | |||||||||||||||
Total Chemical |
690 | 692 | 954 | 872 | 1,468 | |||||||||||||||
Other Operations and Administrative
|
||||||||||||||||||||
United States |
66 | 64 | 45 | 126 | 45 | |||||||||||||||
Non-U.S. |
9 | — | 32 | 32 | 7 | |||||||||||||||
Total other operations and administrative |
75 | 64 | 77 | 158 | 52 | |||||||||||||||
Discontinued Operations
|
||||||||||||||||||||
Non-U.S. |
— | — | 80 | 143 | 97 | |||||||||||||||
Total capital and exploration expenditures |
14,885 | 15,525 | 13,955 | 12,311 | 11,168 | |||||||||||||||
| (1) | See Frequently Used Terms on pages 88 through 91. | |
| (2) | Including related transportation. |
EXXON MOBIL CORPORATION • 2004 FINANCIAL & OPERATING REVIEW
C o r p o r a t e 19
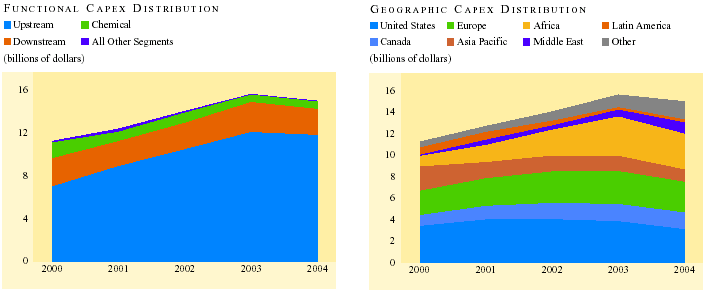
TOTAL CAPITAL AND EXPLORATION EXPENDITURES BY GEOGRAPHY
| (millions of dollars) | 2004 | 2003 | 2002 | 2001 | 2000 | |||||||||||||||
United States |
3,025 | 3,766 | 3,957 | 3,942 | 3,338 | |||||||||||||||
Canada |
1,546 | 1,601 | 1,513 | 1,262 | 1,004 | |||||||||||||||
Latin America |
289 | 217 | 441 | 717 | 677 | |||||||||||||||
Europe |
2,845 | 3,046 | 2,919 | 2,564 | 2,255 | |||||||||||||||
Asia Pacific |
1,137 | 1,410 | 1,470 | 1,496 | 2,250 | |||||||||||||||
Middle East |
1,044 | 636 | 393 | 185 | 112 | |||||||||||||||
Africa |
3,316 | 3,657 | 2,405 | 1,585 | 981 | |||||||||||||||
Other Eastern Hemisphere |
1,683 | 1,192 | 857 | 560 | 551 | |||||||||||||||
Total worldwide |
14,885 | 15,525 | 13,955 | 12,311 | 11,168 | |||||||||||||||
DISTRIBUTION OF CAPITAL AND EXPLORATION EXPENDITURES
| (millions of dollars) | 2004 | 2003 | 2002 | 2001 | 2000 | |||||||||||||||
Consolidated Companies’ Expenditures |
||||||||||||||||||||
Capital expenditures |
11,901 | 12,857 | 11,499 | 9,943 | 9,017 | |||||||||||||||
Exploration costs charged to expense |
||||||||||||||||||||
United States |
192 | 256 | 220 | 213 | 133 | |||||||||||||||
Non-U.S. |
891 | 735 | 679 | 941 | 780 | |||||||||||||||
Depreciation on support equipment(1) |
15 | 19 | 21 | 21 | 23 | |||||||||||||||
Total exploration expenses |
1,098 | 1,010 | 920 | 1,175 | 936 | |||||||||||||||
Total consolidated companies’ capital and exploration expenditures |
||||||||||||||||||||
(excluding depreciation on support equipment) |
12,984 | 13,848 | 12,398 | 11,097 | 9,930 | |||||||||||||||
ExxonMobil’s Share of Non-Consolidated Companies’ Expenditures |
||||||||||||||||||||
Capital expenditures |
1,865 | 1,651 | 1,518 | 1,203 | 1,216 | |||||||||||||||
Exploration costs charged to expense |
36 | 26 | 39 | 11 | 22 | |||||||||||||||
Total non-consolidated companies’ capital
and exploration expenditures |
1,901 | 1,677 | 1,557 | 1,214 | 1,238 | |||||||||||||||
Total capital and exploration expenditures |
14,885 | 15,525 | 13,955 | 12,311 | 11,168 | |||||||||||||||
| (1) | Not included as part of total Capital and Exploration Expenditures, but included as part of Exploration Expenses in the Summary Statement of Income, page 22. |
2004 FINANCIAL & OPERATING REVIEW • EXXON MOBIL CORPORATION
20
NET INVESTMENT IN PROPERTY, PLANT, AND EQUIPMENT AT YEAR END
| (millions of dollars) | 2004 | 2003 | 2002 | 2001 | 2000 | |||||||||||||||
Upstream |
||||||||||||||||||||
United States |
16,410 | 16,992 | 16,924 | 16,697 | 16,216 | |||||||||||||||
Non-U.S. |
45,603 | 41,735 | 34,772 | 29,980 | 29,600 | |||||||||||||||
Total |
62,013 | 58,727 | 51,696 | 46,677 | 45,816 | |||||||||||||||
Downstream |
||||||||||||||||||||
United States |
9,408 | 9,714 | 9,238 | 9,012 | 9,048 | |||||||||||||||
Non-U.S. |
20,402 | 19,852 | 17,682 | 16,548 | 17,682 | |||||||||||||||
Total |
29,810 | 29,566 | 26,920 | 25,560 | 26,730 | |||||||||||||||
Chemical |
||||||||||||||||||||
United States |
4,887 | 5,068 | 5,155 | 5,079 | 5,045 | |||||||||||||||
Non-U.S. |
5,162 | 5,047 | 4,754 | 4,611 | 4,890 | |||||||||||||||
Total |
10,049 | 10,115 | 9,909 | 9,690 | 9,935 | |||||||||||||||
Other/discontinued operations |
6,767 | 6,557 | 6,415 | 7,675 | 7,348 | |||||||||||||||
Total net investment |
108,639 | 104,965 | 94,940 | 89,602 | 89,829 | |||||||||||||||
DEPRECIATION AND DEPLETION EXPENSES
| (millions of dollars) | 2004 | 2003 | 2002 | 2001 | 2000 | |||||||||||||||
Upstream |
||||||||||||||||||||
United States |
1,453 | 1,571 | 1,597 | 1,447 | 1,426 | |||||||||||||||
Non-U.S. |
4,758 | 4,072 | 3,551 | 3,221 | 3,469 | |||||||||||||||
Total |
6,211 | 5,643 | 5,148 | 4,668 | 4,895 | |||||||||||||||
Downstream |
||||||||||||||||||||
United States |
618 | 601 | 583 | 598 | 594 | |||||||||||||||
Non-U.S. |
1,646 | 1,548 | 1,399 | 1,476 | 1,489 | |||||||||||||||
Total |
2,264 | 2,149 | 1,982 | 2,074 | 2,083 | |||||||||||||||
Chemical |
||||||||||||||||||||
United States |
408 | 410 | 414 | 408 | 397 | |||||||||||||||
Non-U.S. |
400 | 368 | 348 | 289 | 281 | |||||||||||||||
Total |
808 | 778 | 762 | 697 | 678 | |||||||||||||||
Other |
484 | 477 | 418 | 409 | 345 | |||||||||||||||
Total depreciation and depletion expenses |
9,767 | 9,047 | 8,310 | 7,848 | 8,001 | |||||||||||||||
OPERATING COSTS EXCLUDING MERGER EXPENSES AND DISCONTINUED OPERATIONS ( 1 )
| (millions of dollars) | 2004 | 2003 | 2002 | 2001 | 2000 | |||||||||||||||
Production and manufacturing expenses |
23,225 | 21,260 | 17,831 | 17,743 | 17,600 | |||||||||||||||
Selling, general, and administrative |
13,849 | 13,396 | 12,356 | 12,898 | 12,044 | |||||||||||||||
Depreciation and depletion |
9,767 | 9,047 | 8,310 | 7,848 | 8,001 | |||||||||||||||
Exploration |
1,098 | 1,010 | 920 | 1,175 | 936 | |||||||||||||||
Subtotal |
47,939 | 44,713 | 39,417 | 39,664 | 38,581 | |||||||||||||||
ExxonMobil’s share of equity-company expenses |
4,209 | 3,937 | 3,800 | 3,832 | 4,355 | |||||||||||||||
Total operating costs |
52,148 | 48,650 | 43,217 | 43,496 | 42,936 | |||||||||||||||
| (1) | See Frequently Used Terms on pages 88 through 91. |
EXXON MOBIL CORPORATION • 2004 FINANCIAL & OPERATING REVIEW
C o r p o r a t e 21
SUMMARY BALANCE SHEET AT YEAR END
| (millions of dollars) | 2004 | 2003 | 2002 | 2001 | 2000 | ||||||||||||||||
Assets |
|||||||||||||||||||||
Current assets |
|||||||||||||||||||||
Cash and cash equivalents |
18,531 | 10,626 | 7,229 | 6,547 | 7,080 | ||||||||||||||||
Cash and cash equivalents – restricted |
4,604 | — | — | — | — | ||||||||||||||||
Notes and accounts receivable,
less estimated doubtful amounts |
25,359 | 24,309 | 21,163 | 19,549 | 22,996 | ||||||||||||||||
Inventories |
|||||||||||||||||||||
Crude oil, products, and merchandise |
8,136 | 7,665 | 6,827 | 6,743 | 7,244 | ||||||||||||||||
Materials and supplies |
1,351 | 1,292 | 1,241 | 1,161 | 1,060 | ||||||||||||||||
Prepaid taxes and expenses |
2,396 | 2,068 | 1,831 | 1,681 | 2,019 | ||||||||||||||||
Total current assets |
60,377 | 45,960 | 38,291 | 35,681 | 40,399 | ||||||||||||||||
Investments and advances |
18,404 | 15,535 | 12,111 | 10,768 | 12,618 | ||||||||||||||||
Property, plant, and equipment, at cost,
less accumulated depreciation and depletion |
108,639 | 104,965 | 94,940 | 89,602 | 89,829 | ||||||||||||||||
Other assets, including intangibles – net |
7,836 | 7,818 | 7,302 | 7,123 | 6,154 | ||||||||||||||||
Total assets |
195,256 | 174,278 | 152,644 | 143,174 | 149,000 | ||||||||||||||||
Liabilities |
|||||||||||||||||||||
Current liabilities |
|||||||||||||||||||||
Notes and loans payable |
3,280 | 4,789 | 4,093 | 3,703 | 6,161 | ||||||||||||||||
Accounts payable and accrued liabilities |
31,763 | 28,445 | 25,186 | 22,862 | 26,755 | ||||||||||||||||
Income taxes payable |
7,938 | 5,152 | 3,896 | 3,549 | 5,275 | ||||||||||||||||
Total current liabilities |
42,981 | 38,386 | 33,175 | 30,114 | 38,191 | ||||||||||||||||
Long-term debt |
5,013 | 4,756 | 6,655 | 7,099 | 7,280 | ||||||||||||||||
Annuity reserves |
10,850 | 9,609 | 11,202 | 7,331 | 6,835 | ||||||||||||||||
Accrued liabilities |
6,279 | 5,283 | 5,252 | 5,144 | 5,099 | ||||||||||||||||
Deferred income tax liabilities |
21,092 | 20,118 | 16,484 | 16,359 | 16,442 | ||||||||||||||||
Deferred credits and other long-term obligations |
3,333 | 2,829 | 2,511 | 1,141 | 1,166 | ||||||||||||||||
Equity of minority and preferred
shareholders in affiliated companies |
3,952 | 3,382 | 2,768 | 2,825 | 3,230 | ||||||||||||||||
Total liabilities |
93,500 | 84,363 | 78,047 | 70,013 | 78,243 | ||||||||||||||||
Commitments and Contingencies |
|||||||||||||||||||||
Shareholders’ Equity |
|||||||||||||||||||||
Benefit-plan-related balances |
(1,014 | ) | (634 | ) | (450 | ) | (159 | ) | (235 | ) | |||||||||||
Common stock without par value
(9,000 million shares authorized) |
5,067 | 4,468 | 4,217 | 3,789 | 3,661 | ||||||||||||||||
Earnings reinvested |
134,390 | 115,956 | 100,961 | 95,718 | 86,652 | ||||||||||||||||
Accumulated other non-owner changes in equity
|
|||||||||||||||||||||
Cumulative foreign exchange translation adjustment |
3,598 | 1,421 | (3,015 | ) | (5,947 | ) | (4,862 | ) | |||||||||||||
Minimum pension liability adjustment |
(2,499 | ) | (2,446 | ) | (2,960 | ) | (535 | ) | (310 | ) | |||||||||||
Unrealized gains/(losses) on stock investments |
428 | 511 | (79 | ) | (108 | ) | (17 | ) | |||||||||||||
Common stock held in treasury (1,618 million shares
in 2004 and 1,451 million shares in 2003) |
(38,214 | ) | (29,361 | ) | (24,077 | ) | (19,597 | ) | (14,132 | ) | |||||||||||
Total shareholders’ equity |
101,756 | 89,915 | 74,597 | 73,161 | 70,757 | ||||||||||||||||
Total liabilities and shareholders’ equity |
195,256 | 174,278 | 152,644 | 143,174 | 149,000 | ||||||||||||||||
The information in the Summary Statement of Income (for 2002 to 2004), the Summary Balance Sheet (for 2003 and 2004), and the Summary Statement of Cash Flows (for 2002 to 2004), shown on pages 21 through 23 is a replication of the information in the Consolidated Statement of Income, Consolidated Balance Sheet, and the Consolidated Statement of Cash Flows in ExxonMobil’s 2005 Proxy Statement. For complete consolidated financial statements, including notes, please refer to pages A26 through A53 of ExxonMobil’s 2005 Proxy Statement. See also management’s discussion and analysis of financial condition and results of operations and other information on pages A6 through A23 of the 2005 Proxy Statement.
2004 FINANCIAL & OPERATING REVIEW • EXXON MOBIL CORPORATION
22
SUMMARY STATEMENT OF INCOME
(millions of dollars) |
2004 | 2003 | 2002 | 2001 | 2000 | |||||||||||||||
Revenues and Other Income |
||||||||||||||||||||
Sales and other operating revenue(1) |
291,252 | 237,054 | 200,949 | 208,715 | 227,596 | |||||||||||||||
Income from equity affiliates |
4,961 | 4,373 | 2,066 | 2,174 | 2,434 | |||||||||||||||
Other income |
1,822 | 5,311 | 1,491 | 1,896 | 1,816 | |||||||||||||||
Total revenues and other income |
298,035 | 246,738 | 204,506 | 212,785 | 231,846 | |||||||||||||||
Costs and Other Deductions |
||||||||||||||||||||
Crude oil and product purchases |
139,224 | 107,658 | 90,950 | 92,257 | 108,913 | |||||||||||||||
Production and manufacturing expenses |
23,225 | 21,260 | 17,831 | 17,743 | 17,600 | |||||||||||||||
Selling, general, and administrative expenses |
13,849 | 13,396 | 12,356 | 12,898 | 12,044 | |||||||||||||||
Depreciation and depletion |
9,767 | 9,047 | 8,310 | 7,848 | 8,001 | |||||||||||||||
Exploration expenses, including dry holes |
1,098 | 1,010 | 920 | 1,175 | 936 | |||||||||||||||
Merger-related expenses |
— | — | 410 | 748 | 1,406 | |||||||||||||||
Interest expense |
638 | 207 | 398 | 293 | 589 | |||||||||||||||
Excise taxes(1) |
27,263 | 23,855 | 22,040 | 21,907 | 22,356 | |||||||||||||||
Other taxes and duties |
40,954 | 37,645 | 33,572 | 33,377 | 32,708 | |||||||||||||||
Income applicable to minority and preferred interests |
776 | 694 | 209 | 569 | 412 | |||||||||||||||
Total costs and other deductions |
256,794 | 214,772 | 186,996 | 188,815 | 204,965 | |||||||||||||||
Income before income taxes |
41,241 | 31,966 | 17,510 | 23,970 | 26,881 | |||||||||||||||
Income taxes |
15,911 | 11,006 | 6,499 | 8,967 | 11,075 | |||||||||||||||
Income from continuing operations |
25,330 | 20,960 | 11,011 | 15,003 | 15,806 | |||||||||||||||
Discontinued operations, net of income tax |
— | — | 449 | 102 | 184 | |||||||||||||||
Cumulative effect of accounting change, net of income tax |
— | 550 | — | — | — | |||||||||||||||
Extraordinary gain, net of income tax |
— | — | — | 215 | 1,730 | |||||||||||||||
Net Income |
25,330 | 21,510 | 11,460 | 15,320 | 17,720 | |||||||||||||||
Net Income per Common Share (dollars) |
||||||||||||||||||||
Income from continuing operations |
3.91 | 3.16 | 1.62 | 2.19 | 2.27 | |||||||||||||||
Discontinued operations, net of income tax |
— | — | 0.07 | 0.01 | 0.03 | |||||||||||||||
Cumulative effect of accounting change, net of income tax |
— | 0.08 | — | — | — | |||||||||||||||
Extraordinary gain, net of income tax |
— | — | — | 0.03 | 0.25 | |||||||||||||||
Net income |
3.91 | 3.24 | 1.69 | 2.23 | 2.55 | |||||||||||||||
Net Income per Common Share – Assuming Dilution (dollars) |
||||||||||||||||||||
Income from continuing operations |
3.89 | 3.15 | 1.61 | 2.17 | 2.24 | |||||||||||||||
Discontinued operations, net of income tax |
— | — | 0.07 | 0.01 | 0.03 | |||||||||||||||
Cumulative effect of accounting change, net of income tax |
— | 0.08 | — | — | — | |||||||||||||||
Extraordinary gain, net of income tax |
— | — | — | 0.03 | 0.25 | |||||||||||||||
Net income |
3.89 | 3.23 | 1.68 | 2.21 | 2.52 | |||||||||||||||
| 27,263 | 23,855 | 22,040 | 21,907 | 22,356 | ||||||||||||||||
| (1) | Excise taxes included in sales and other operating revenue |
The information in the Summary Statement of Income (for 2002 to 2004), the Summary Balance Sheet (for 2003 and 2004), and the Summary Statement of Cash Flows (for 2002 to 2004), shown on pages 21 through 23 is a replication of the information in the Consolidated Statement of Income, Consolidated Balance Sheet, and the Consolidated Statement of Cash Flows in ExxonMobil’s 2005 Proxy Statement. For complete consolidated financial statements, including notes, please refer to pages A26 through A53 of ExxonMobil’s 2005 Proxy Statement. See also management’s discussion and analysis of financial condition and results of operations and other information on pages A6 through A23 of the 2005 Proxy Statement.
EXXON MOBIL CORPORATION • 2004 FINANCIAL & OPERATING REVIEW
C o r p o r a t e 23
SUMMARY STATEMENT OF CASH FLOWS
(millions of dollars) |
2004 | 2003 | 2002 | 2001 | 2000 | |||||||||||||||
Cash Flows from Operating Activities |
||||||||||||||||||||
Net income |
||||||||||||||||||||
Accruing to ExxonMobil shareholders |
25,330 | 21,510 | 11,460 | 15,320 | 17,720 | |||||||||||||||
Accruing to minority and preferred interests |
776 | 694 | 209 | 569 | 412 | |||||||||||||||
Cumulative effect of accounting change, net of income tax |
— | (550 | ) | — | — | — | ||||||||||||||
Adjustments for noncash transactions |
||||||||||||||||||||
Depreciation and depletion |
9,767 | 9,047 | 8,310 | 7,848 | 8,001 | |||||||||||||||
Deferred income tax charges/(credits) |
(1,134 | ) | 1,827 | 297 | 650 | 10 | ||||||||||||||
Annuity provisions |
886 | (1,489 | ) | (500 | ) | 349 | (425 | ) | ||||||||||||
Accrued liability provisions |
806 | 264 | (90 | ) | 149 | (237 | ) | |||||||||||||
Dividends received greater than/(less than)
equity in current earnings of equity companies |
(1,643 | ) | (402 | ) | (170 | ) | 78 | (387 | ) | |||||||||||
Extraordinary gain, before income tax |
— | — | — | (194 | ) | (2,038 | ) | |||||||||||||
Changes in operational working
capital, excluding cash and debt |
||||||||||||||||||||
Reduction/(increase) – Notes and accounts receivable |
(472 | ) | (1,286 | ) | (305 | ) | 3,062 | (4,832 | ) | |||||||||||
– Inventories |
(223 | ) | (100 | ) | 353 | 154 | (297 | ) | ||||||||||||
– Prepaid taxes and expenses |
11 | 42 | 32 | 118 | (204 | ) | ||||||||||||||
Increase/(reduction) – Accounts and other payables |
6,333 | 1,130 | 365 | (5,103 | ) | 5,411 | ||||||||||||||
Ruhrgas transaction |
— | (2,240 | ) | 1,466 | — | — | ||||||||||||||
All other items – net |
114 | 51 | (159 | ) | (111 | ) | (197 | ) | ||||||||||||
Net cash provided by operating activities |
40,551 | 28,498 | 21,268 | 22,889 | 22,937 | |||||||||||||||
Cash Flows from Investing Activities |
||||||||||||||||||||
Additions to property, plant, and equipment |
(11,986 | ) | (12,859 | ) | (11,437 | ) | (9,989 | ) | (8,446 | ) | ||||||||||
Sales of subsidiaries, investments, and property,
plant, and equipment |
2,754 | 2,290 | 2,793 | 1,078 | 5,770 | |||||||||||||||
Increase in restricted cash and cash equivalents |
(4,604 | ) | — | — | — | — | ||||||||||||||
Additional investments and advances |
(2,287 | ) | (809 | ) | (2,012 | ) | (1,035 | ) | (1,648 | ) | ||||||||||
Collection of advances |
1,213 | 536 | 898 | 1,735 | 985 | |||||||||||||||
Additions to other marketable securities |
— | — | — | — | (41 | ) | ||||||||||||||
Sales of other marketable securities |
— | — | — | — | 82 | |||||||||||||||
Net cash used in investing activities |
(14,910 | ) | (10,842 | ) | (9,758 | ) | (8,211 | ) | (3,298 | ) | ||||||||||
Cash Flows from Financing Activities |
||||||||||||||||||||
Additions to long-term debt |
470 | 127 | 396 | 547 | 238 | |||||||||||||||
Reductions in long-term debt |
(562 | ) | (914 | ) | (246 | ) | (506 | ) | (901 | ) | ||||||||||
Additions to short-term debt |
450 | 715 | 751 | 705 | 500 | |||||||||||||||
Reductions in short-term debt |
(2,243 | ) | (1,730 | ) | (927 | ) | (1,212 | ) | (2,413 | ) | ||||||||||
Additions/(reductions) in debt with less than 90-day maturity |
(66 | ) | (322 | ) | (281 | ) | (2,306 | ) | (3,129 | ) | ||||||||||
Cash dividends to ExxonMobil shareholders |
(6,896 | ) | (6,515 | ) | (6,217 | ) | (6,254 | ) | (6,123 | ) | ||||||||||
Cash dividends to minority interests |
(215 | ) | (430 | ) | (169 | ) | (194 | ) | (251 | ) | ||||||||||
Changes in minority interests and
sales/(purchases) of affiliate stock |
(215 | ) | (247 | ) | (161 | ) | (401 | ) | (227 | ) | ||||||||||
Common stock acquired |
(9,951 | ) | (5,881 | ) | (4,798 | ) | (5,721 | ) | (2,352 | ) | ||||||||||
Common stock sold |
960 | 434 | 299 | 301 | 493 | |||||||||||||||
Net cash used in financing activities |
(18,268 | ) | (14,763 | ) | (11,353 | ) | (15,041 | ) | (14,165 | ) | ||||||||||
Effects of exchange rate changes on cash |
532 | 504 | 525 | (170 | ) | (82 | ) | |||||||||||||
Increase/(decrease) in cash and cash equivalents |
7,905 | 3,397 | 682 | (533 | ) | 5,392 | ||||||||||||||
Cash and cash equivalents at beginning of year |
10,626 | 7,229 | 6,547 | 7,080 | 1,688 | |||||||||||||||
Cash and cash equivalents at end of year |
18,531 | 10,626 | 7,229 | 6,547 | 7,080 | |||||||||||||||
The information in the Summary Statement of Income (for 2002 to 2004), the Summary Balance Sheet (for 2003 and 2004), and the Summary Statement of Cash Flows (for 2002 to 2004), shown on pages 21 through 23 is a replication of the information in the Consolidated Statement of Income, Consolidated Balance Sheet, and the Consolidated Statement of Cash Flows in ExxonMobil’s 2005 Proxy Statement. For complete consolidated financial statements, including notes, please refer to pages A26 through A53 of ExxonMobil’s 2005 Proxy Statement. See also management’s discussion and analysis of financial condition and results of operations and other information on pages A6 through A23 of the 2005 Proxy Statement.
2004 FINANCIAL & OPERATING REVIEW • EXXON MOBIL CORPORATION
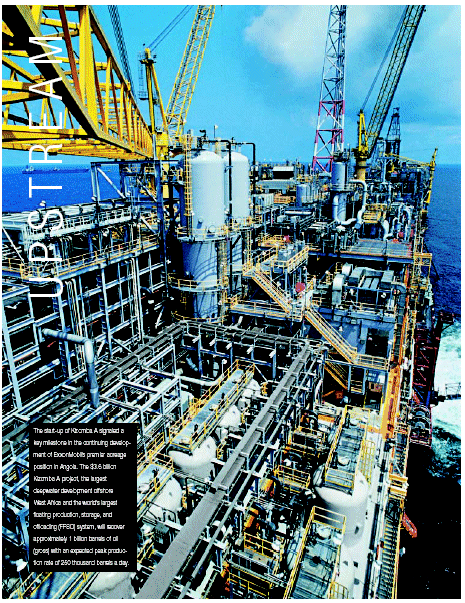
| MA E RT S P U The start-up of Kizomba A signaled a key milestone in the continuing development of ExxonMobil's premier acreage position in Angola. The $3.6 billion Kizomba A project, the largest deepwater development offshore West Africa and the world's largest floating production, storage, and offloading (FPSO) system, will recover approximately 1 billion barrels of oil (gross) with an expected peak production rate of 250 thousand barrels a day. |
Consistency is key to leading results, ExxonMobil’s
Upstream sets benchmarks as an industry leader in project
execution and operating performance.
Exploration, Development, Production, and Gas & Power Marketing
UPSTREAM STRATEGIES
Although business conditions and opportunities change from year to year, ExxonMobil employs a set of long-term fundamental strategies in its worldwide exploration, development, production, and gas and power marketing businesses. These strategies are supported by an unparalleled commitment to technology. Superior execution of these strategies through our global functional organization, across what we believe is the best Upstream asset portfolio in the industry, distinguishes ExxonMobil from competition. These key strategies are:
§ Maximize profitability of existing oil and gas production;
§ Identify and pursue all attractive exploration opportunities;
§ Invest in projects that deliver superior returns; and,
§ Capitalize on growing natural gas and power markets.
U p s t r e a m N e t I n c o m e p e r B a r r e l
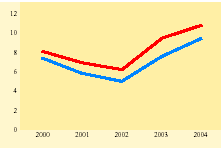
| (1) | Royal Dutch Shell, BP, and Chevron Texaco values calculated on a consistent basis with ExxonMobil, based on Public information, Competitor data estimated for 2004. |
2004 RESULTS AND HIGHLIGHTS
Earnings were $16.7 billion, up 15 percent and a record, primarily due to strong oil and natural gas prices.
Upstream return on average capital employed was 33 percent in 2004 and averaged 29 percent over the past five years.
Net income per oil-equivalent barrel was $10.81.
Total liquids and gas production available for sale was 4.2 million oil-equivalent barrels per day, exceeding all competitors. Strong liquids production growth of 2.2 percent was offset by lower gas production, which declined 2.5 percent.
Proved oil and gas reserve additions totaled 1.8 billion oil-equivalent barrels, excluding asset sales and year-end price/cost revisions. The Corporation replaced 112 percent of production including asset sales, and 125 percent excluding asset sales. This is the 11th year in a row that ExxonMobil has more than replaced reserves produced.
At 22 billion oil-equivalent barrels, ExxonMobil’s proved reserves remain the highest among nongovernmental producers. New field resource additions totaled 2.9 billion oil-equivalent barrels in 2004. ExxonMobil’s resource base now stands at 73 billion oil-equivalent barrels.
Finding costs were $0.44 per oil-equivalent barrel. Five-year average reserve replacement cost was $4.91 per oil-equivalent barrel.
Upstream capital and exploration spending remained robust at $11.7 billion, driven by a strong portfolio of development projects.
| STATISTICAL RECAP | 2004 | 2003 | 2002 | 2001 | 2000 | |||||||||||||||
Earnings (millions of dollars) |
16,675 | 14,502 | 9,598 | 10,736 | 12,685 | |||||||||||||||
Liquids production (thousands of barrels per day) |
2,571 | 2,516 | 2,496 | 2,542 | 2,553 | |||||||||||||||
Natural gas production available for sale (millions of cubic feet per day) |
9,864 | 10,119 | 10,452 | 10,279 | 10,343 | |||||||||||||||
Oil-equivalent production (thousands of barrels per day) |
4,215 | 4,203 | 4,238 | 4,255 | 4,277 | |||||||||||||||
Proved reserves replacement(1) (percent) |
125 | 107 | 118 | 111 | 112 | |||||||||||||||
New field resource additions (millions of oil-equivalent barrels) |
2,940 | 2,110 | 2,150 | 2,490 | 2,120 | |||||||||||||||
Average capital employed (millions of dollars) |
50,642 | 47,672 | 43,064 | 40,029 | 41,218 | |||||||||||||||
Return on average capital employed (percent) |
32.9 | 30.4 | 22.3 | 26.8 | 30.8 | |||||||||||||||
Capital and exploration expenditures (millions of dollars) |
11,715 | 11,988 | 10,394 | 8,816 | 6,933 | |||||||||||||||
| (1) | Excluding asset sales and year-end price/cost revisions. |
2004 FINANCIAL & OPERATING REVIEW • EXXON MOBIL CORPORATION
26
Upstream Competitive Advantages
ExxonMobil’s industry-leading, geographically diverse Upstream business includes the largest reserve base among nongovernmental oil companies, a development portfolio of over 100 projects involving over $80 billion in net investment, the leading production base, and global gas and power marketing activities.
2004 Global Upstream Summary
Countries with operations |
37 | |||
Resource base (oil-equivalent barrels) |
73 billion | |||
Reserves (oil-equivalent barrels) |
22 billion | |||
Exploration acreage (gross acres) |
109 million | |||
Production (oil-equivalent barrels per day) |
4.2 million | |||
Producing wells (gross) |
59 thousand |
Our Upstream competitive advantages include:
§ Strong, diverse production base
§ Wide range of profitable growth opportunities
§ Leading proprietary technology tool kit
§ Unique global functional organization
§ Financial strength and disciplined approach
STRONG, DIVERSE PRODUCTION BASE
Large, highly profitable, and established oil and gas operations in North America, Europe, Asia Pacific, West Africa, and the Caspian form the strong foundation of our portfolio. These areas include long-life producing fields that have significant near-term potential for discovering and developing new near-field opportunities using existing infrastructure. In 2004, total liquids production was 2,571 thousand barrels per day. Gas production was 9,864 million cubic feet per day.
Our existing asset base includes about 59,000 productive wells from more than 8,300 reservoirs and nearly 600 offshore platforms. We invest in active work programs to maintain this profitable base. ExxonMobil’s production portfolio includes a wide variety of assets. This diversity is extremely valuable when establishing new production.
ExxonMobil is the world’s largest nongovernmental producer of natural gas. Natural gas sales are made in 25 countries and across five continents in every major gas market in the world. ExxonMobil has leading-edge LNG, gas-to-liquids, gas pipeline, and power generation technologies. Our expertise in integrating these advanced technologies with global market requirements provides a substantial competitive advantage. The ability to participate in nearly all sectors of the global gas business is essential to optimizing a substantial base business and commercializing our large remote resources in an ever-changing market.
WIDE RANGE OF PROFITABLE GROWTH OPPORTUNITIES
ExxonMobil maintains the largest portfolio of exploration and development opportunities in the industry, which enables the selectivity required to optimize total profitability and mitigate overall political and technical risks.
As future development projects bring new resources on line, we expect a shift in the geographic mix of production volumes from North America and Europe to resource-rich regions including West Africa, the Caspian, the Middle East, and Russia. ExxonMobil is in a strong position in those areas, and continues to invest in new opportunities in all of these regions.
Exploration gross acreage totals 109 million acres in 34 countries. In addition, initiatives are under way worldwide to participate in emerging, high-potential but previously inaccessible regions offering the potential for future growth opportunities.
P r o j e c t e d V o l u m e C o n t i b u t i o n b y G e o g r a p h i c A r e a
Liquids
|
Gas | |
(millions of barrels per day)
|
(billions of cubic feet per day) |
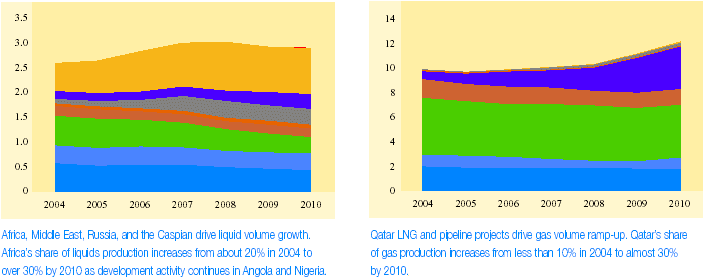
2004 FINANCIAL & OPERATING REVIEW • EXXON MOBIL CORPORATION
U p s t r e a m 27
OPPORTUNITIES SHIFTING TO EXXONMOBIL STRENGTHS
The ExxonMobil opportunity portfolio is shifting by resource type as we look forward to the end of this decade. We expect our conventional opportunities to continue to deliver strong results, accounting for about 60 percent of production in 2010. Our Upstream competitive advantages – commitment to technology, a global functional organization, and financial strength – also position us to capture value from a new set of opportunities. These opportunities trend toward more nonconventional and frontier resources, including LNG, arctic, deepwater, heavy oil, tight gas, and acid/sour gas. By 2010, they are likely to account for about 40 percent of our production volumes. This shift is not unique to ExxonMobil, but it does play to our strengths. ExxonMobil is unique in its ability to effectively execute the variety of projects needed to efficiently commercialize this diverse resource base.
P R O D U C T I O N V O L U M E C O N T R I B U T I O N B Y R E S O U R C E T Y P E

LEADING PROPRIETARY TECHNOLOGY
ExxonMobil’s long-standing commitment to the development and application of leading-edge Upstream technology is unmatched in the industry and provides a sustainable competitive advantage. Technology is the lifeblood of our business. It allows us to maximize value by increasing recoverable resources, reducing costs, and creating new markets for our products. We manage technology development and application with the same disciplined approach we use in making all of our business decisions. Our approach to technology and our track record of developing new industry-leading technology serve us well in countries where we have an established business presence, and in emerging areas where we are positioned to be the partner of choice. Technology is, and will continue to be, fundamental to our business success.
TECHNICAL TRAINING CENTER
The 100,000-square-foot Upstream Technical Training Center opened in Houston, Texas, in June, underscoring ExxonMobil’s commitment to the technical excellence of the Corporation’s earth scientists and engineers.
This new center provides a learning environment that is unique in the petroleum industry.
Among its many state-of-the-art features is a room dedicated to training employees in the use of emerging visualization technologies. The ability to view and analyze 3D images of oil and gas reservoirs aids in evaluation of new discoveries and development of known reservoirs.
ExxonMobil’s Upstream training curriculum, accessed by nearly 5,000 employees each year, helps ensure that the best technology is applied to the Corporation’s assets worldwide.

2004 FINANCIAL & OPERATING REVIEW • EXXON MOBIL CORPORATION
28
GLOBAL FUNCTIONAL ORGANIZATION
ExxonMobil has an experienced, dedicated, and diverse work force of exceptional quality. Our unique global functional organization is structured along the life cycle of an asset and provides a significant competitive advantage. This allows us to establish priorities on a global basis, effectively leverage the transfer of technology and best practices across our vast worldwide portfolio, focus on operational excellence in all aspects of our business, and efficiently deploy experienced people with the right skills. This approach yields significant advantages in both cost efficiencies and our ability to recognize and respond to the changing business environment.
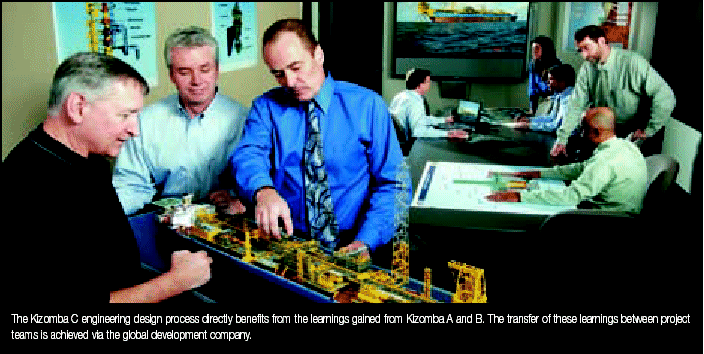
FUNCTIONAL ORGANIZATION DELIVERS RESULTS
ExxonMobil, by virtue of its participation in a variety of joint ventures and operated-by-other projects, has access to data that can be utilized to benchmark our performance versus that of industry. This data allows insight into the tangible efficiencies in both cost and schedule achieved through our global functional organization. Specifically, ExxonMobil-operated projects and drilling performance demonstrate industry-leading results in several key metrics.
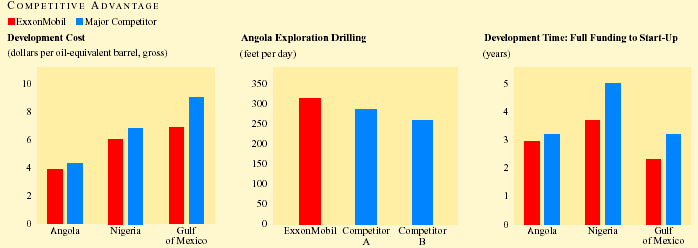
In Africa and the Gulf of Mexico, ExxonMobil’s global technology transfer, as well as cost and schedule discipline, has resulted in best-in-class execution results. Development costs are up to 30% lower than competition on projects of similar size in a given region.
In Angola exploration, ExxonMobil’s use of advanced drilling technology has resulted in top-tier performance. Drilling performance as measured in feet per day was on average 13% better than competition.
Superior planning and execution enable ExxonMobil to minimize the cycle time from initial funding to start-up. In Africa and the Gulf of Mexico, ExxonMobil-operated projects have consistently started up on or ahead of schedule. This cycle time has been up to 15 months shorter than competition.
EXXON MOBIL CORPORATION • 2004 FINANCIAL & OPERATING REVIEW
U p s t r e a m 29
FINANCIAL STRENGTH AND DISCIPLINED APPROACH
ExxonMobil’s financial strength and access to capital are competitive advantages that allow us to pursue all attractive projects that meet our rigorous criteria. We continually invest in our existing asset base to increase resource recovery, maximize profitability and extend economic life. Projects are tested over a wide range of economic scenarios to substantiate the resiliency of expected returns. They are evaluated for strategic fit and long-term advantage versus competition, and they undergo a rigorous appraisal process to capture lessons learned and ensure improvements are incorporated into future decisions. This disciplined approach to making investments and managing assets clearly distinguishes us from competition.
ExxonMobil believes that return on average capital employed (ROCE) is the most relevant metric for measuring financial performance in a capital-intensive industry such as the Upstream.
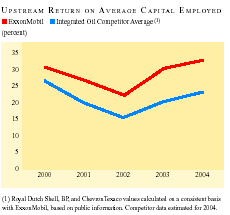
ROCE is a direct measure of the cumulative contribution from all of our Upstream competitive advantages, and it has distinguished the performance of our Upstream business relative to competition not only in 2004, but on average, for the last five years.
Disciplined Approach to Proved Reserves
The annual reporting of proved reserves is the product of ExxonMobil’s long-standing processes, which ensure consistency and management accountability with respect to all reserve bookings. All reserve additions and revisions follow a rigorous and structured management review process that is stewarded by a team of experienced reserve experts with global responsibilities. ExxonMobil has always taken this approach to booking proved reserves in full alignment with the standard set by the SEC of reasonable certainty for recovery.
Historically, ExxonMobil has consistently added significant reserves through revisions based on technical analysis and performance. Increasingly, the nature of large projects with long development times is likely to increase the swings in reserves additions due to timing.
Although we participate in joint ventures with other companies, ExxonMobil maintains an independent view of reserves. Each company must make its own determination for booking reserves and for moving them into the proved category. As a result, reserve figures can (and usually do) vary from one company to the next.
For the first time, ExxonMobil has stated our 2004 results to reflect impacts to the proved reserve base using year-end prices. However, the use of prices from a single date is not relevant to the investment decisions made by the Corporation, and annual variations in reserves based on such year-end prices are not of consequence in how the business is actually managed.
DEFINITIONS - RESOURCES AND PROVED RESERVES
See Frequently Used Terms on pages 88 through 91 for further information.
Resource base, resources, recoverable oil, recoverable hydrocarbons, recoverable resources: quantities of oil and gas that may not yet be classified as proved reserves, but which ExxonMobil believes will likely be moved to proved reserves and produced in the future.
Proved oil and gas reserves: estimated quantities of crude oil, natural gas, and natural gas liquids that ExxonMobil has determined to be reasonably certain of recovery under existing economic and operating conditions on the basis of our long standing, rigorous management review process. ExxonMobil only records proved reserves when we have made significant funding commitments for the related projects. In this report, reserves:
| § | Include 100 percent of majority-owned affiliates’ proved reserves; | |||
| § | Include ExxonMobil’s percentage ownership of equity-company proved reserves; | |||
| § | Include proved reserves from Syncrude tar sands operations in Canada. Syncrude reserves are reported separately as a mining operation in SEC filings; and, | |||
| § | Exclude royalties and quantities due others. | |||
Reserve bookings for certain deepwater fields may be made prior to conducting flow tests due to safety and cost implications of such tests. In those situations, other industry-accepted analyses are used.
Proved developed reserves: volumes recoverable through existing wells with existing equipment and operating methods.
Proved undeveloped reserves: volumes expected to be recovered as a result of future investments.
Year-end price/cost revisions: The Corporation is also stating, for the first time, our 2004 reserves to reflect the impacts to the proved reserves base utilizing December 31, 2004 prices and costs. Changes to proved reserves from these revisions are reported as year-end price/cost revisions. Refer to page 59 as well as page A58 of the 2005 Proxy Statement for more detail.
| 2004 FINANCIAL & OPERATING REVIEW • EXXON MOBIL CORPORATION |
30
Resources and Proved Reserves
The size, quality, and breadth of ExxonMobil’s total inventory of discovered oil and gas resources are major strengths of the Company. ExxonMobil’s discovered resource base now stands at 73 billion oil-equivalent barrels (31 percent proved). It has grown by over 28 percent, or 16 billion oil-equivalent barrels, during the last 10 years.
At year-end 2004, the resource base included 22.2 billion oil-equivalent barrels of proved oil and gas reserves, excluding year-end price/cost revisions (21.7 billion including year-end price/cost revisions). ExxonMobil added 1.8 billion oil-equivalent barrels to proved reserves in 2004 (excluding year-end price/cost revisions), while producing 1.6 billion oil-equivalent barrels, and replacing 112 percent of reserves produced, including asset sales (125 percent, excluding asset sales). This is the 11th consecutive year that the Company’s reserves replacement has exceeded 100 percent (excluding year-end price/cost revisions). We have also stated, for the first time, our 2004 reserves to reflect the impact to the proved reserve base from using prices on December 31, 2004. Including sales and year-end price/cost revisions, we replaced 83 percent of reserves produced.

RESOURCE BASE
The resource base is updated annually to add new discoveries and resource acquisitions, and to reflect any changes in estimates of existing resources. ExxonMobil refers to new discoveries and acquisitions of discovered, but undeveloped, resources as new field resource additions. The Company includes only those resources it believes are likely to be produced in the future. Adjustments to existing field resources reflect changes in recovery expectations resulting from new technologies, drilling, ongoing evaluations, and any other revisions. During the update process, volumes produced or sold during the year are removed from the resource base.
Resources are classified as either proved or nonproved. The processto move nonproved resources to proved reserves begins once technical and commercial confidence support a development decision.
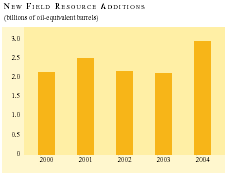
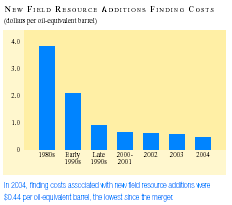
Resource Base Changes
| 5-Year | ||||||||
| (billions of oil-equivalent barrels) | 2004 | Average | ||||||
New field resource additions/acquisitions |
2.9 | 2.3 | ||||||
Existing fields |
(0.4 | ) | 0.2 | |||||
Production |
(1.6 | ) | (1.6 | ) | ||||
Sales |
(0.4 | ) | (0.2 | ) | ||||
Net change |
0.5 | 0.7 | ||||||

EXXON MOBIL CORPORATION • 2004 FINANCIAL & OPERATING REVIEW
U p s t r e a m 31
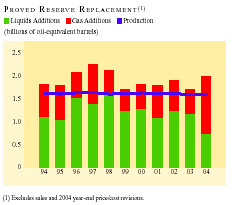
Proved Reserves Additions
| 5-Year | ||||||||
| (millions of oil-equivalent barrels) | 2004 | Average | ||||||
Revisions (excluding year-end
price/cost revisions) |
140 | 551 | ||||||
Discoveries/extensions |
1,809 | 1,180 | ||||||
Improved recovery |
28 | 103 | ||||||
Purchases |
11 | 3 | ||||||
Total excluding sales |
1,988 | 1,837 | ||||||
Asset sales |
(211 | ) | (59 | ) | ||||
Total including sales |
1,777 | 1,778 | ||||||
Production |
(1,591 | ) | (1,604 | ) | ||||
Reserve replacement excluding sales(1) (percent) |
125 | 115 | ||||||
Reserve replacement including sales(1) (percent) |
112 | 111 | ||||||
Year-End Reserves
| (billions of oil-equivalent barrels) | ||||
Year-end 2003 reserves |
22.0 | |||
2004 additions |
2.0 | |||
2004 production |
(1.6 | ) | ||
Year-end 2004 reserves before year-end
price/cost revisions and sales |
22.4 | |||
2004 sales |
(0.2 | ) | ||
Year-end 2004 reserves before year-end
price/cost revisions |
22.2 | |||
Year-end 2004 price/cost revisions* |
(0.5 | ) | ||
Year-end 2004 reserves including year-end price/cost revisions |
21.7 | |||
PROVED RESERVES
Total proved reserves remain at 22 billion oil-equivalent barrels with near-term emphasis on large LNG projects in the Middle East, heavy oil projects in Canada and Venezuela, and conventional projects in Africa and offshore eastern Canada.
Excluding sales and year-end price/cost revisions, the Company has added 19 billion oil-equivalent barrels to proved reserves over the last 10 years, more than replacing production. Over the last five years, reserves have been added at an average replacement cost of $4.91 per oil-equivalent barrel.
Performance-related revisions have averaged 551 million oil-equivalent barrels per year over the last five years, and have resulted from effective reservoir management and the application of new technology. In 2004, upward revisions were made at fields such as Zafiro in Equatorial Guinea and Marlin in Australia.
The development of new fields discovered through exploration and extensions of existing fields has added 1.2 billion oil-equivalent barrels per year to proved reserves over the past five years. These include proved additions in 2004 in Qatar, Nigeria, and Angola.
ExxonMobil’s proved reserve base of 22.2 billion oil-equivalent barrels (excluding year-end price/cost revisions) equates to a reserve life at current production rates of 14 years.
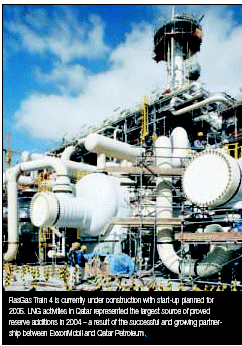
2004 FINANCIAL & OPERATING REVIEW • EXXON MOBIL CORPORATION
32
Major Development Projects
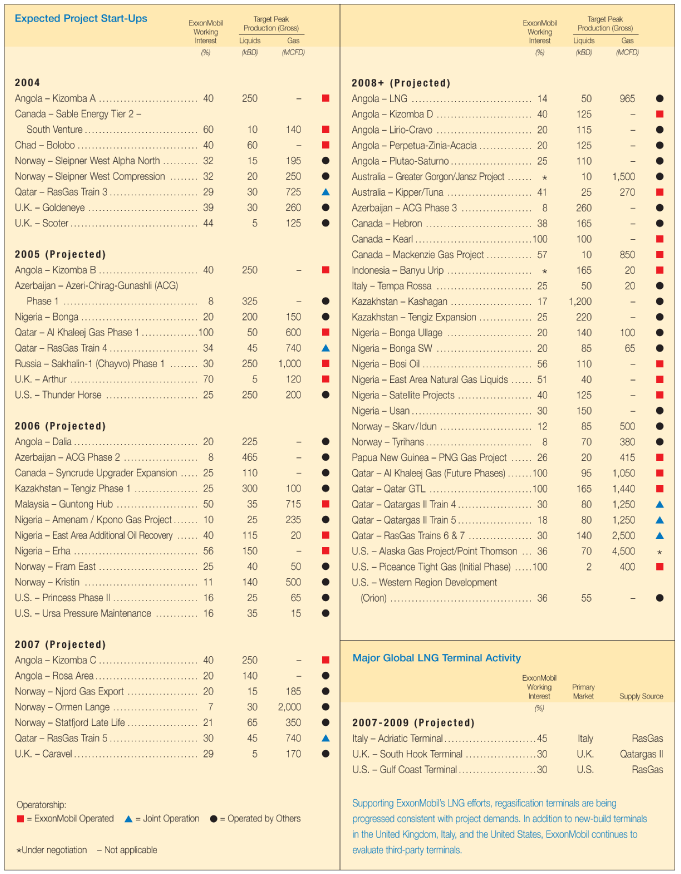
| Major Development Projects Expected Project Start-Ups Target Peak Target Peak ExxonMobil ExxonMobil _ ______________________________________________ Production (Gross) _ ______________________________________________ Production (Gross) Working Working Interest Liquids Gas Interest Liquids Gas (%) (kBD) (MCFD) (%) (kBD) (MCFD) 2 0 0 4 2 0 0 8 + ( P r o j e c t e d ) Angola - Kizomba A . . . . . . . . . . . . . . . . . . . . . . . . . . . . 40 250 - n Angola - LNG . . . . . . . . . . . . . . . . . . . . . . . . . . . . . . . . . . 14 50 965 l Canada - Sable Energy Tier 2 - Angola - Kizomba D . . . . . . . . . . . . . . . . . . . . . . . . . . . 40 125 - n South Venture . . . . . . . . . . . . . . . . . . . . . . . . . . . . . . . . 60 10 140 n Angola - Lirio-Cravo . . . . . . . . . . . . . . . . . . . . . . . . . . . 20 115 - l Chad - Bolobo . . . . . . . . . . . . . . . . . . . . . . . . . . . . . . . . . . 40 60 - n Angola - Perpetua-Zinia-Acacia . . . . . . . . . . . . . . . 20 125 - l Norway - Sleipner West Alpha North . . . . . . . . . . 32 15 195 l Angola - Plutao-Saturno . . . . . . . . . . . . . . . . . . . . . . . 25 110 - l Norway - Sleipner West Compression . . . . . . . . 32 20 250 l Australia - Greater Gorgon/Jansz Project . . . . . . . * 10 1,500 l Qatar - RasGas Train 3 . . . . . . . . . . . . . . . . . . . . . . . . . 29 30 725 s Australia - Kipper/Tuna . . . . . . . . . . . . . . . . . . . . . . . . 41 25 270 n U.K. - Goldeneye . . . . . . . . . . . . . . . . . . . . . . . . . . . . . . . 39 30 260 l Azerbaijan - ACG Phase 3 . . . . . . . . . . . . . . . . . . . . 8 260 - l U.K. - Scoter . . . . . . . . . . . . . . . . . . . . . . . . . . . . . . . . . . . . 44 5 125 l Canada - Hebron . . . . . . . . . . . . . . . . . . . . . . . . . . . . . . 38 165 - l Canada - Kearl . . . . . . . . . . . . . . . . . . . . . . . . . . . . . . . . .100 100 - n 2 0 0 5 ( P r o j e c t e d ) Canada - Mackenzie Gas Project . . . . . . . . . . . . . 57 10 850 n Angola - Kizomba B . . . . . . . . . . . . . . . . . . . . . . . . . . . . 40 250 - n Indonesia - Banyu Urip . . . . . . . . . . . . . . . . . . . . . . . . * 165 20 n Azerbaijan - Azeri-Chirag-Gunashli (ACG) Italy - Tempa Rossa . . . . . . . . . . . . . . . . . . . . . . . . . . . 25 50 20 l Phase 1 . . . . . . . . . . . . . . . . . . . . . . . . . . . . . . . . . . . . . . 8 325 - l Kazakhstan - Kashagan . . . . . . . . . . . . . . . . . . . . . . . 17 1,200 - l Nigeria - Bonga . . . . . . . . . . . . . . . . . . . . . . . . . . . . . . . . . 20 200 150 l Kazakhstan - Tengiz Expansion . . . . . . . . . . . . . . . 25 220 - l Qatar - Al Khaleej Gas Phase 1 . . . . . . . . . . . . . . . .100 50 600 n Nigeria - Bonga Ullage . . . . . . . . . . . . . . . . . . . . . . . . 20 140 100 l Qatar - RasGas Train 4 . . . . . . . . . . . . . . . . . . . . . . . . . 34 45 740 s Nigeria - Bonga SW . . . . . . . . . . . . . . . . . . . . . . . . . . . 20 85 65 l Russia - Sakhalin-1 (Chayvo) Phase 1 . . . . . . . . 30 250 1,000 n Nigeria - Bosi Oil . . . . . . . . . . . . . . . . . . . . . . . . . . . . . . . 56 110 - n U.K. - Arthur . . . . . . . . . . . . . . . . . . . . . . . . . . . . . . . . . . . . 70 5 120 n Nigeria - East Area Natural Gas Liquids . . . . . . 51 40 - n U.S. - Thunder Horse . . . . . . . . . . . . . . . . . . . . . . . . . . 25 250 200 l Nigeria - Satellite Projects . . . . . . . . . . . . . . . . . . . . . 40 125 - n Nigeria - Usan . . . . . . . . . . . . . . . . . . . . . . . . . . . . . . . . . . 30 150 - l 2 0 0 6 ( P r o j e c t e d ) Norway - Skarv/Idun . . . . . . . . . . . . . . . . . . . . . . . . . . 12 85 500 l Angola - Dalia . . . . . . . . . . . . . . . . . . . . . . . . . . . . . . . . . . . 20 225 - l Norway - Tyrihans . . . . . . . . . . . . . . . . . . . . . . . . . . . . . . 8 70 380 l Azerbaijan - ACG Phase 2 . . . . . . . . . . . . . . . . . . . . . 8 465 - l Papua New Guinea - PNG Gas Project . . . . . . 26 20 415 n Canada - Syncrude Upgrader Expansion . . . . . 25 110 - l Qatar - Al Khaleej Gas (Future Phases) . . . . . . .100 95 1,050 n Kazakhstan - Tengiz Phase 1 . . . . . . . . . . . . . . . . . . 25 300 100 l Qatar - Qatar GTL . . . . . . . . . . . . . . . . . . . . . . . . . . . . .100 165 1,440 n Malaysia - Guntong Hub . . . . . . . . . . . . . . . . . . . . . . . 50 35 715 n Qatar - Qatargas II Train 4 . . . . . . . . . . . . . . . . . . . . . 30 80 1,250 s Nigeria - Amenam / Kpono Gas Project . . . . . . . 10 25 235 l Qatar - Qatargas II Train 5 . . . . . . . . . . . . . . . . . . . . . 18 80 1,250 s Nigeria - East Area Additional Oil Recovery . . . . . . 40 115 20 n Qatar - RasGas Trains 6 & 7 . . . . . . . . . . . . . . . . . . 30 140 2,500 s Nigeria - Erha . . . . . . . . . . . . . . . . . . . . . . . . . . . . . . . . . . . 56 150 - n U.S. - Alaska Gas Project/Point Thomson . . . 36 70 4,500 * Norway - Fram East . . . . . . . . . . . . . . . . . . . . . . . . . . . . 25 40 50 l U.S. - Piceance Tight Gas (Initial Phase) . . . . .100 2 400 n Norway - Kristin . . . . . . . . . . . . . . . . . . . . . . . . . . . . . . . . 11 140 500 l U.S. - Western Region Development U.S. - Princess Phase II . . . . . . . . . . . . . . . . . . . . . . . . 16 25 65 l (Orion) . . . . . . . . . . . . . . . . . . . . . . . . . . . . . . . . . . . . . . . . 36 55 - l U.S. - Ursa Pressure Maintenance . . . . . . . . . . . . 16 35 15 l 2 0 0 7 ( P r o j e c t e d ) Angola - Kizomba C . . . . . . . . . . . . . . . . . . . . . . . . . . . . 40 250 - n Major Global LNG Terminal Activity Angola - Rosa Area . . . . . . . . . . . . . . . . . . . . . . . . . . . . . 20 140 - l ExxonMobil Working Primary Norway - Njord Gas Export . . . . . . . . . . . . . . . . . . . . 20 15 185 l Interest Market Supply Source Norway - Ormen Lange . . . . . . . . . . . . . . . . . . . . . . . . 7 30 2,000 l (%) Norway - Statfjord Late Life . . . . . . . . . . . . . . . . . . . . 21 65 350 l 2 0 0 7 - 2 0 0 9 ( P r o j e c t e d ) Qatar - RasGas Train 5 . . . . . . . . . . . . . . . . . . . . . . . . . 30 45 740 s Italy - Adriatic Terminal . . . . . . . . . . . . . . . . . . . . . . . . . . 45 Italy RasGas U.K. - Caravel . . . . . . . . . . . . . . . . . . . . . . . . . . . . . . . . . . . 29 5 170 l U.K. - South Hook Terminal . . . . . . . . . . . . . . . . . . . . 30 U.K. Qatargas II U.S. - Gulf Coast Terminal . . . . . . . . . . . . . . . . . . . . . . 30 U.S. RasGas Operatorship: Supporting ExxonMobil's LNG efforts, regasification terminals are being n = ExxonMobil Operated s = Joint Operation l = Operated by Others progressed consistent with project demands. In addition to new-build terminals in the United Kingdom, Italy, and the United States, ExxonMobil continues to *Under negotiation - Not applicable evaluate third-party terminals. E X X O N M O B I L C O R P O R A T I O N o 2 0 0 4 F I N A N C I A L & O P E R A T I N G R E V I E W |
EXXON MOBIL CORPORATION • 2004 FINANCIAL & OPERATING REVIEW
U p s t r e a m 33
Development Project Execution
START-UPS DELIVERING VOLUMES
ExxonMobil-operated major project start-ups since the merger (1999 to 2004) are delivering on volume, cost, and schedule commitments. Over 70 major projects have been brought on line since 1999 and will produce 3.7 billion oil-equivalent barrels by 2010. Peak rates for these start-ups total 1.3 million oil-equivalent barrels per day. With the largest portfolio of development and exploration opportunities in the industry, ExxonMobil is well-positioned continue this trend.
INNOVATIVE EARLY PRODUCTION SYSTEMS CAPTURING VALUE
The early production system (EPS) is an example of ExxonMobil’s innovative execution strategies. The EPS, a generic floating, production, storage, and offloading (FPSO) vessel, is deployed to capture early production volumes until the full-field development can be completed. Coupled with the “design one, build multiple” concept, the EPS offers significant project management and schedule efficiencies that improve overall project economics. Initial deployments in West Africa have delivered about 160 million oil-equivalent barrels (gross) with best-in-class reliability.
DEVELOPMENT COST HOLDING AT $3 PER OIL-EQUIVALENT BARREL
With ExxonMobil’s industry-leading resource base and proved reserves, our organization is focused on developing the most attractive opportunities through a disciplined process of selectivity and efficient deployment of capital. Since the merger, Upstream capital expenditures have grown over 50 percent. Spending on projects to develop major new resources accounts for the largest proportion of the growth and has tripled since the merger. Even with the shift to deepwater, arctic, and other technically challenging environments, average overall development cost remains relatively constant at around $3 per barrel for the Upstream development portfolio. In this context, development cost refers to expected gross Upstream investment divided by expected gross resource additions for the full ExxonMobil opportunity portfolio.
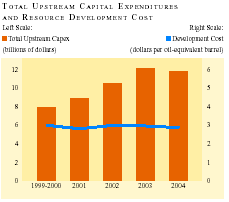
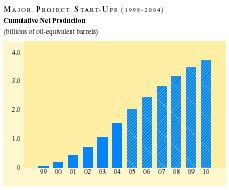
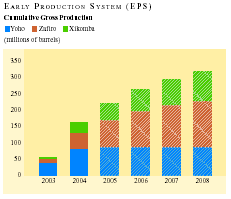
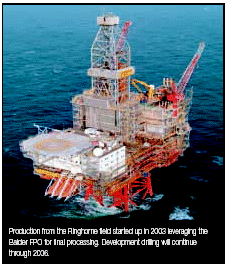
2004 FINANCIAL & OPERATING REVIEW • EXXON MOBIL CORPORATION
34
The Americas
ExxonMobil’s operations in the Americas contributed about 35 percent of ExxonMobil’s 2004 worldwide production on an oil-equivalent basis and about 42 percent of Upstream earnings. Base production continues to yield strong returns. We expect future production will be augmented by multiple nonconventional opportunities, including deepwater Gulf of Mexico, tight gas, heavy oil, and arctic developments. Additionally, ExxonMobil has secured positions in new exploration areas including Canada’s Orphan Basin and offshore Colombia.
Americas Highlights
| 2004 | 2003 | 2002 | ||||||||||
Earnings (billions of dollars) |
7.1 | 5.5 | 3.7 | |||||||||
Proved Reserves(1) (BOEB) |
7.4 | 8.1 | 8.6 | |||||||||
Acreage (gross acres, million) |
64.6 | 51.9 | 69.8 | |||||||||
Net Liquids Production (MBD) |
1.0 | 1.1 | 1.1 | |||||||||
Net Gas Production (BCFD) |
3.0 | 3.2 | 3.5 | |||||||||
| Americas Projects | Target Peak | |||||||||||||
| Working | Production (Gross) | |||||||||||||
| Projected Start-Ups | Interest | Liquids | Gas | |||||||||||
| (%) | (kBD) | (MCFD) | ||||||||||||
2004 |
Sable Tier 2 - South Venture | 60 | 10 | 140 | ||||||||||
2005 |
Thunder Horse | 25 | 250 | 200 | ||||||||||
2006 |
Princess Phase II | 16 | 25 | 65 | ||||||||||
| Syncrude Upgrader Expansion | 25 | 110 | — | |||||||||||
| Ursa Pressure Maintenance | 16 | 35 | 15 | |||||||||||
2008+ |
Hebron | 38 | 165 | — | ||||||||||
| Kearl | 100 | 100 | — | |||||||||||
| Mackenzie Gas Project | 57 | 10 | 850 | |||||||||||
| Alaska Gas Proj./Pt. Thomson | 36 | 70 | 4,500 | |||||||||||
| Piceance Gas (Initial Phase) | 100 | 2 | 400 | |||||||||||
| Western Region Development | 36 | 55 | — | |||||||||||

UNITED STATES
ExxonMobil is one of the largest oil and gas producers and reserve holders in the United States. The Corporation’s well-established portfolio is geographically diverse with significant positions in all major producing regions including Alaska, onshore Gulf Coast, shelf and deepwater areas of the Gulf of Mexico, onshore and offshore California, and the midcontinent region. United States properties contributed 21 percent of the Company’s net oil and gas production in 2004 and accounted for 21 percent of proved reserves at year end.
In the United States, the Upstream continues to provide a significant contribution to ExxonMobil’s profitability through a sizable but selective drilling program, investments in the existing base as well as in attractive new projects, and continued operational efficiency improvements. Technology and quality reservoir management enhance the long-term performance of each field. Base production decline is mitigated through active workover and development drilling programs. Mature, higher-cost properties are considered for divestment to prioritize our resources on the highest-value opportunities.

LaBarge Acid Gas Injection
High-pressure acid gas injection will replace existing sulfur recovery units at the Shute Creek Treating Facility in La Barge, Wyoming. The $400 million (gross) project includes two injection wells and a 110-megawatt power cogeneration unit, and will increase the existing plant capacity from 650 to 720 million cubic feet per day (gross). In addition, the project will generate plant electrical needs, with excess power to sell, and efficiently utilize exhaust gas to generate steam for process heat needs. Start-up of the cogeneration turbine occurred in 2004, and acid gas injection will commence early in 2005.
Thunder Horse
Located in the central Gulf of Mexico, this deepwater development will include a semisub-mersible floating production, drilling, and quarters unit with capacity of 250 thousand barrels per day (gross), and will accommodate 11 direct-access subsea wells and 13 remote subsea wells. Export will occur via a joint-venture oil pipeline to southern Louisiana and a third-party gas pipeline to southern Mississippi. Drilling and construction activities are under way with start-up projected for the second half of 2005.
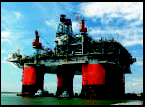
EXXON MOBIL CORPORATION • 2004 FINANCIAL & OPERATING REVIEW
U p s t r e a m 35
OPTIMIZING THE BASE
ExxonMobil’s diverse North American portfolio is optimized through selective investment in high-value opportunities, while enhancing existing capacity, leveraging technology, and participating in selective acreage monetization opportunities. 3D seismic technology, advanced subsurface modeling, and extended-reach drilling are adding new potential to mature areas.
In 2004, ExxonMobil announced an arrangement that will optimize hydrocarbon exploration and development in the United States and Canada. The agreement will capitalize on our strengths and enhance shareholder value through transfers and joint-venture activity with our partner across a broad range of prospective and mature properties in West Texas, western Canada, onshore Louisiana, and the Gulf of Mexico. ExxonMobil will operate deep-gas prospects that rely on state-of-the-art technology, and will retain an option to also participate in shallower prospects.
As part of the agreement, ExxonMobil has farmed out its interest in more than 300,000 acres of undeveloped property interests in mature areas of the western Canadian province of Alberta. Thirty-five wells were drilled in 2004 and more than 250 wells are expected to be drilled over an initial two-year period with opportunities for further drilling.
Gulf of Mexico
ExxonMobil holds one of the leading acreage positions in the Gulf of Mexico with 547 deepwater blocks (about 3.2 million gross acres) and 118 shelf blocks (about 800,000 gross acres). This acreage position includes interests in two highly active industry plays, the ultradeepwater foldbelt in the Walker Ridge area, and deep gas underlying the Louisiana shelf.
In the ultradeepwater foldbelt, a successful appraisal of the 2003 St. Malo discovery (ExxonMobil interest, 4 percent) was drilled to 28,905 feet in 8,830 feet of water. The well encountered more than 400 net feet of oil and provided valuable geotechnical data that has been applied in reservoir modeling studies of the field. These results will help optimize investigation of ExxonMobil’s strong acreage position including analysis of several additional prospects in this highly active play.
On the shelf, plans include drilling three or more wells to test deep gas potential, including drilling one of the deepest wildcats in North America. The high-risk, over 30,000-foot Blackbeard well (ExxonMobil interest, 25 percent) spudded in February 2005, and will test an unproven, but potentially very large, ultrahigh-temperature, high-pressure play. We will also jointly explore for deep gas on 800,000 gross acres of high-potential onshore Louisiana and offshore Gulf of Mexico shelf acreage through an agreement completed in 2004.
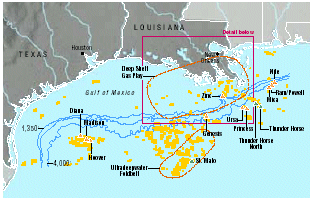
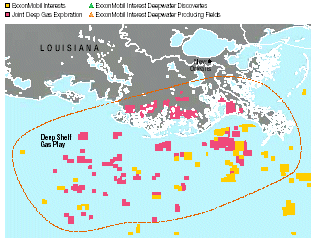
2004 FINANCIAL & OPERATING REVIEW • EXXON MOBIL CORPORATION
36
THE AMERICAS GAS MARKET
North America continues to be an important market for ExxonMobil. With gas demand likely to grow 1.3 percent per year on average to 2020, and domestic supply from existing wells declining, continued investment in existing fields and new discoveries is required, representing a great opportunity for those with the technology to locate and produce gas. ExxonMobil has developed technology to produce gas resources such as tight and deep gas. ExxonMobil has a leading position in arctic gas resources in the Mackenzie Delta region of northern Canada and on the North Slope of Alaska. LNG imports are forecast to play an increasingly important role. We expect ExxonMobil LNG projects in Qatar will supply approximately 2 billion cubic feet per day of gas (ExxonMobil interest, 30 percent) to the United States beginning in 2009. In 2004, ExxonMobil made progress in permitting and land acquisition for LNG offloading and regasification terminals along the Gulf Coast.
Supply And Demand In United States
And Canada
(billions of cubic feet per day)
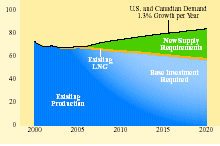
New Gas Supplies For United States
And Canada
(billions of cubic feet per day)
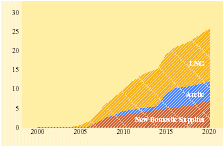
TIGHT GAS OPPORTUNITIES – PICEANCE BASIN
ExxonMobil is initiating development of approximately 300,000 gross acres of tight gas resources in the Piceance Basin, located in northwestern Colorado. Our strong acreage position in this basin offers the potential of over 35 trillion cubic feet of gas resources. Breakthrough technology, involving state-of-the-art ExxonMobil proprietary multistaged fracturing techniques, is being used to stimulate stacked tight sands. Full development is expected to involve deviated wells drilled from multiwell pads, significantly reducing the environmental impact in this remote region.
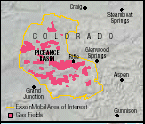
ARCTIC GAS OPPORTUNITIES
Federal legislation was passed and progress made with the State of Alaska on a fiscal contract for the Alaska Gas Project. Progress was also made in 2004 on key regulatory milestones for the Mackenzie Gas Project.
The Alaska Gas Project is designed to treat and transport gas from Prudhoe Bay and Point Thomson, Alaska. The project scope includes a gas-treating plant on the North Slope and construction of a large-diameter, high-pressure pipeline to North American gas markets. Start-up for the project is anticipated in the middle of the next decade.
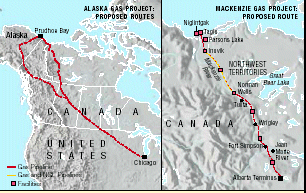
The Mackenzie Gas Project ($5.6 billion, gross) is expected to develop approximately 6 trillion cubic feet of gas from three onshore arctic fields including Taglu field (Imperial Oil-operated, 100 percent interest) and Parsons Lake field (ExxonMobil interest, 25 percent).
EXXON MOBIL CORPORATION • 2004 FINANCIAL & OPERATING REVIEW
CANADA
ExxonMobil is the largest crude oil producer in Canada, is a leading natural gas producer, and holds the largest resource position through its wholly owned affiliate, ExxonMobil Canada, and its majority-owned affiliate, Imperial Oil (ExxonMobil interest, 69.6 percent). The Company has a significant presence in major development projects in offshore eastern Canada and a well-established production base with expansion opportunities in western Canada. Our position has been further strengthened with our recent acquisition of exploration rights in the Orphan Basin.
Offshore Canada Operations
The ExxonMobil-operated Sable Offshore Energy Project (ExxonMobil interest, 60 percent) consists of five producing fields containing estimated recoverable hydrocarbons of 2.1 trillion cubic feet of natural gas and 90 million barrels of natural gas liquids (gross). Production in 2004 was approximately 400 million cubic feet per day of natural gas (gross) and 13 thousand barrels per day of liquids (gross).
The Company also operates the Hibernia oil field (ExxonMobil interest, 33 percent). Hibernia, located 195 miles from St. John’s, Newfoundland, holds an estimated 950 million barrels (gross) of recoverable oil. Production in 2004 was over 200 thousand barrels of oil per day (gross). The Hibernia field consists of a large concrete Gravity Base Structure (GBS) with two drilling rigs.
The non-operated Terra Nova development (ExxonMobil interest, 22 percent), located 200 miles southeast of St.John’s, Newfoundland, produces up to 150 thousand barrels of oil per day (gross). Located in 300 feet of water, Terra Nova consists of a unique, harsh-environment-equipped FPSO and 24 subsea wells that are expected to recover 380 million oil-equivalent barrels (gross).
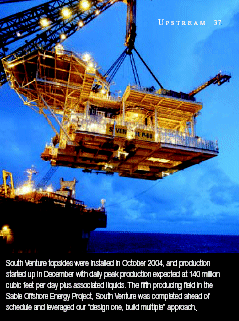
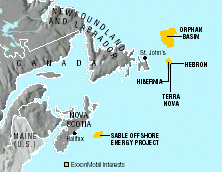
Orphan Basin, Canada
ExxonMobil Canada and Imperial Oil successfully participated in a tender for eight high-potential, frontier deepwater exploration blocks in the Orphan Basin, located offshore Newfoundland (ExxonMobil interest, 25 percent; Imperial Oil interest, 25 percent). Acquisition of a 2,000-square-kilometer, 3D seismic survey was completed in 2004. Two additional 3D seismic surveys are planned for 2005.
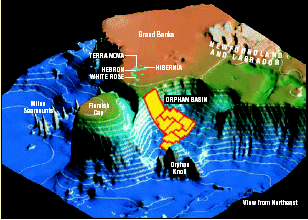
2004 FINANCIAL & OPERATING REVIEW • EXXON MOBIL CORPORATION
38
HEAVY OIL
Current estimates of extra heavy oil and tar sands exceed 4 trillion barrels in-place worldwide. While heavy oil has been commercially produced since the 1960s, worldwide cumulative production to date is small relative to the overall size of the resource base. ExxonMobil is well-positioned to capitalize on new heavy oil opportunities based on our operational expertise gained through participation in Cerro Negro in Venezuela, Cold Lake, and Syncrude projects in Canada
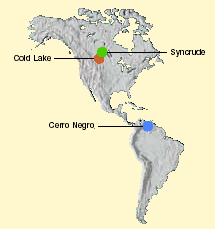
Heavy Oil Production In Canada
And South America
(thousands of barrels per day, net ExxonMobil)
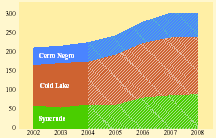
Recovery Techniques
ExxonMobil engineers select the process that best suits the resource characteristics and ensures maximum recovery. ExxonMobil’s experience across a broad range of these technologies is a competitive advantage.
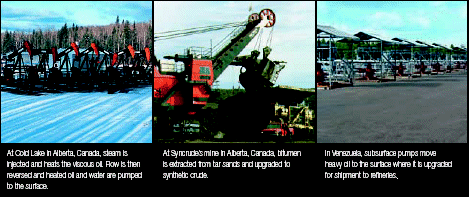
ONSHORE CANADA OPERATIONS
The Cold Lake field (Imperial Oil interest, 100 percent) and the Syncrude tar sands operation (Imperial Oil interest, 25 percent) in Alberta account for the majority of Imperial Oil’s production in western Canada. Cold Lake averaged 126 thousand barrels of oil per day in 2004 and at Syncrude, 2004 production of synthetic crude averaged 240 thousand barrels per day (gross). Staged expansion is under way at Syncrude to further develop reserves in the area and expand the upgrading facilities. This expansion is planned to increase production to over 350 thousand barrels of upgraded crude oil per day (gross).
ExxonMobil holds interests in three large Kearl Lake tar sands mining leases. A 200-well delineation program continued in 2004 to further define the resource and support the conceptual design for the project.
EXXON MOBIL CORPORATION • 2004 FINANCIAL & OPERATING REVIEW
UPSTREAM 39
Syncrude Upgrader Expansion
The Syncrude Upgrader Expansion project consists of adding a second train at the Aurora tar sands mine and increasing capacity of the upgrader by about 110 thousand barrels of oil per day (gross). Mining for the second train started in 2003. The upgrader expansion, which includes the addition of a third coker, a new aromatic saturation unit, and a new hydrogen plant, is scheduled for completion in 2006. The project is expected to develop in excess of 1 billion barrels of resource (gross) with an investment of more than $5 billion (gross).
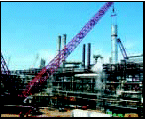
SOUTH AMERICA
Cerro Negro and
Venezuela
Operations
ExxonMobil operates the Cerro Negro field (ExxonMobil interest, 42 percent) in Venezuela. The 120 thousand barrels of extra-heavy crude produced daily (gross) are processed through an upgrader into synthetic crude oil.
ExxonMobil also has a 25-percent interest in the Quiamare La Ceiba block in eastern Venezuela and a 50-percent interest in the 122,000-acre La Ceiba block on the southeastern shore of Lake Maracaibo. Work has begun on the La Ceiba commercialization evaluation plan, including extended production testing that started in October 2004.
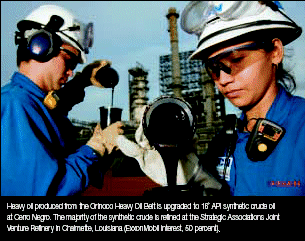
Offshore Colombia
ExxonMobil signed an exploration and production contract with Colombia’s National Hydrocarbon Agency to begin exploration activities offshore Colombia (ExxonMobil interest, 40 percent). The agreement covers the 11-million-acre Tayrona block, off Colombia’s northern coast in the Caribbean Sea. During the initial 18-month phase of the exploratory program, ExxonMobil is utilizing its industry-leading Remote Reservoir Resistivity Mapping (R3M) technology, a proprietary electromagnetic survey technique that ExxonMobil has successfully applied in other offshore areas of the world.
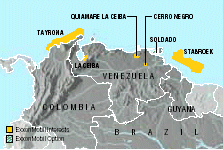
Other South America
ExxonMobil holds a 51-percent interest in the Chihuidos block, which contains the Sierra Chata gas field, located in the Neuquen Basin in central Argentina. The Company also holds a 23-percent interest in the Aguarague concession in northwest Argentina. Net daily gas production of 89 million cubic feet is sold into markets in Argentina and central and northern Chile.
ExxonMobil holds interests in two blocks offshore Brazil located in the prolific Campos Basin deepwater play. Also offshore Brazil, ExxonMobil acquired an interest and operatorship of Block BM-S-22 (ExxonMobil interest, 40 percent), a 340 thousand acre block in the Santos Basin. Activity planned for 2005 includes acquisition of a 3D survey.
In addition, the Company holds exploration rights onshore Bolivia, and offshore Guyana and Trinidad.
2004 FINANCIAL & OPERATING REVIEW • EXXON MOBIL CORPORATION
40
Europe
ExxonMobil is the largest net producer of hydrocarbons in Europe with daily net production of about 600 thousand barrels of liquids and 4.6 billion cubic feet of gas. The Company has exploration and/or production operations in the United Kingdom, Norway, the Netherlands, Germany, France, and Italy. Extensive North Sea oil and natural gas production operations and significant onshore natural gas production are among the Company’s key assets. ExxonMobil’s operations in Europe accounted for almost 32 percent of the Company’s 2004 net oil and gas production and about 26 percent of Upstream earnings.
Europe Highlights
| 2004 | 2003 | 2002 | ||||||||||
Earnings (billions of dollars) |
4.4 | 5.3 | 3.0 | |||||||||
Proved Reserves(1)(BOEB) |
4.7 | 5.2 | 5.4 | |||||||||
Acreage (gross acres, million) |
19.8 | 19.9 | 21.1 | |||||||||
Net Liquids Production (MBD) |
0.6 | 0.6 | 0.6 | |||||||||
Net Gas Production (BCFD) |
4.6 | 4.5 | 4.5 | |||||||||
Europe Projects
| Target Peak | ||||||||||||||||
| Working | Production (Gross) | |||||||||||||||
| Projected Start-Ups | Interest | Liquids | Gas | |||||||||||||
| ( | %) | (kBD) | (MCFD) | |||||||||||||
| 2004 | Sleipner West Alpha North |
32 | 15 | 195 | ||||||||||||
Sleipner West Compression |
32 | 20 | 250 | |||||||||||||
Goldeneye |
30 | 260 | 39 | |||||||||||||
Scoter |
5 | 125 | 44 | |||||||||||||
| 2005 | Arthur |
5 | 120 | 70 | ||||||||||||
| 2006 | Kristin |
140 | 500 | 11 | ||||||||||||
Fram East |
40 | 50 | 25 | |||||||||||||
| 2007 | Njord Gas Export |
15 | 185 | 20 | ||||||||||||
Ormen Lange |
30 | 2,000 | 7 | |||||||||||||
Statfjord Late Life |
65 | 350 | 21 | |||||||||||||
Caravel |
5 | 170 | 29 | |||||||||||||
| 2008+ | Skarv/Idun |
85 | 500 | 12 | ||||||||||||
Tyrihans |
70 | 380 | 8 | |||||||||||||
Tempa Rossa |
50 | 20 | 25 | |||||||||||||

(1) Excludes 2004 year-end price/cost revisions.
CONTINENTAL EUROPE
ExxonMobil has significant gas holdings onshore in the Netherlands and Germany, and is the largest gas producer in both countries. Capacity is being optimized to meet market demand and peak-day needs. A multiyear upgrade of the Groningen facilities, along with additional compression for future deliverability, is progressing in the Netherlands. In late 2004, the Dutch Parliament endorsed Cabinet recommendations to allow both exploration and gas production from the Waddenzee under carefully controlled conditions to ensure environmental integrity. This action is expected to enable Nederlandse Aardolie Maatschappij B.V. (NAM) (ExxonMobil interest, 50 percent) to develop and further explore significant gas resources in the area.
Offshore the Netherlands, the K/7-FB project (ExxonMobil interest, 23 percent) began production in late December 2003; the project is anticipated to recover 11 million oil-equivalent barrels (gross). K/15-FB-South began production in July 2004, and is expected to recover 6 million oil-equivalent barrels (gross). Also offshore, NAM is embarking on its first major tight gas development at K/17, utilizing an innovative monotower platform and underbalanced horizontal wells.
In Germany, ExxonMobil increased gas capacity with the start-up of the Visbek sour gas compression project. To unlock the tight gas potential that exists in Germany, a regional study that includes a high-resolution aeromagnetic survey, is being conducted as a first step of a comprehensive development strategy.
Groningen
The Groningen field started production in 1963. It is the largest gas field in northwest Europe, with estimated ultimate recoverable reserves of 100 trillion cubic feet of gas (gross). Groningen is a swing producer, allowing the primary Dutch gas marketing company, Gasunie, to meet sales commitments. A multiyear major project is under way to renovate production clusters to ensure the long-term integrity of existing facilities, and install new compression to maintain capacity and extend field life. NAM’s underground gas storage facility is shown at right.
Visbek Compression
Compression projects for ExxonMobil’s onshore gas assets are key enablers to enhance and maintain production capacity when reservoir pressures are declining. The two gas turbine engines (7.5 megawatts each) driving the new sour gas compression in north German Visbek field are among the largest of their kind in Europe. Visbek Compression started up in fourth quarter 2004. A sweet gas compression project will start up at Soehlingen in 2005, followed by the start-up of Scholen compression in 2006.
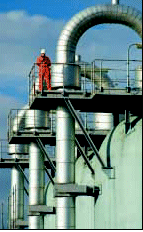
EXXON MOBIL CORPORATION • 2004 FINANCIAL & OPERATING REVIEW
UPSTREAM 41
EUROPEAN GAS MARKET
One objective of the second European Gas Directive, which went into effect in June 2004, is to further liberalize gas markets and facilitate market liquidity, which we believe creates new opportunities for ExxonMobil. European gas demand is likely to grow at about 2.5 percent per year on average to 2020, while local production is declining in the United Kingdom, and is expected to decline on the Continent later in the decade. Significant new LNG imports, plus North African, Russian, and Caspian pipeline supplies are expected to satisfy future demand.
SUPPLY AND DEMAND IN EUROPE
(billions of cubic feet per day)
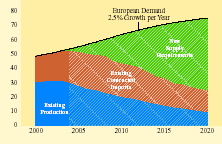
NEW GAS SUPPLIES FOR EUROPE
(billions of cubic feet per day)
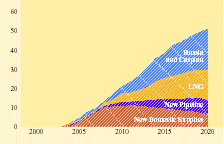
EUROPEAN LNG TERMINALS
In the United Kingdom, ExxonMobil and Qatar Petroleum are developing the South Hook LNG (ExxonMobil interest, 30 percent) receiving terminal at ExxonMobil’s former refinery site in Milford Haven, Wales. This terminal will be used to import up to 15.6 million tons per annum from the Qatargas II LNG project. Also under development is the offshore Adriatic LNG receiving terminal (ExxonMobil interest, 45 percent) in Italy. In 2004, ExxonMobil and Qatar Petroleum signed a long-term subscription agreement with Fluxys for 3.4 million tons per annum of capacity at Fluxys’ Zeebrugge Terminal. In southern Europe, ExxonMobil is assessing potential terminal development opportunities at its refinery sites in Fos (France) and Augusta (Italy).
EUROPEAN GAS MARKET RESTRUCTURING
Europe is one of the largest gas markets in the ExxonMobil portfolio and equity production from the Continent continues to deliver much-needed volumes to the region. Restructuring activities have been progressed by ExxonMobil to continue to compete effectively as the European gas market evolves. These changes anticipate the impact of the European Gas Directives and enable ExxonMobil to directly market more of its equity production. ExxonMobil Gas Marketing Europe was formed to enable marketing on a pan-European basis. Restructuring efforts include:
| • | Independent marketing of Norwegian equity production following dissolution of the government-mandated Gas Sales Committee and unitization of the offshore and onshore Norwegian gas infrastructure; |
| • | Transfer of the company’s shareholding in Ruhrgas AG to E.ON AG; | |||
| • | Sale of the industrial and commercial business in the United Kingdom; | |||
| • | Transfer and sale of minority shareholdings in marketing and transport companies and transportation assets in Germany; and, | |||
| • | Transfer of gas marketing activities from the 50/50 BEB German joint venture into separate ExxonMobil and Shell companies, which enables independent marketing to customers. | |||
In November 2004, ExxonMobil announced that its subsidiary, Esso Nederland B.V., signed a Heads of Agreement (HOA) with the State of the Netherlands and Shell Nederland B.V. to restructure its interest in the Dutch gas business. Under the terms of the agreement, Esso Nederland B.V. and Shell Nederland B.V. will transfer their ownership share of 25 percent each in Gasunie’s gas transportation business to the State of the Netherlands. The final transaction remains subject to regulatory reviews. The parties intend to finalize the restructuring by mid-2005.
CONTINENTAL EUROPE CONTINUES
AS SIGNIFICANT GAS PRODUCER
(billions of cubic feet per day)
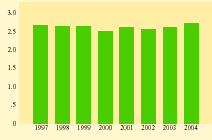
2004 FINANCIAL & OPERATING REVIEW • EXXON MOBIL CORPORATION
42
NORTH SEA
The North Sea continues to be a strong producer for ExxonMobil. Activities continue in all sectors of the North Sea (northern, central, and southern) and include execution of greenfield projects, leveraging of existing infrastructure, and maximizing recovery in mature assets.
In order to improve effectiveness and capture synergies in the mature ExxonMobil-operated areas in the North Sea, the operating organizations in the United Kingdom and Norway merged into one business unit, effective January 1, 2005.
Northern North Sea – New Developments
Two Norwegian deepwater development projects are under way at Kristin (ExxonMobil interest, 11 percent) and Ormen Lange (ExxonMobil interest, 7 percent). These new developments are projected to start up in 2006 and 2007, respectively.
NORTH SEA CONTINUES AS
STRONG PRODUCER FOR EXXONMOBIL
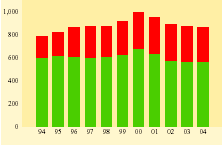
Kristin
The Kristin project ($3 billion, gross), in the Norwegian sector of the North Sea, will develop high-pressure, high-temperature hydrocarbon resources. Four subsea templates will be tied back to a semisubmersible production vessel in 1,200 feet of water with daily production capacity of 140 thousand barrels of liquids and 500 million cubic feet of gas. The semisubmersible production platform for the Kristin field is under construction in Norway. First production is expected in early 2006.
Ormen Lange
The Ormen Lange project ($10 billion, gross) is designed to develop over 13 trillion cubic feet of gas (gross) from the Ormen Lange field. The gas will be transported by the world’s longest subsea export pipeline, approximately 750 miles, from Nyhamna on the west coast of Norway, via Sleipner in the North Sea, to Easington in the United Kingdom. Still in its early stages, the project scope includes a new onshore gas processing plant at Nyhamna, and subsea wells in 2,840 feet of water. At plateau, Ormen Lange is expected to produce 2 billion cubic feet of gas per day.
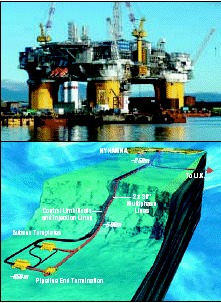
Central North Sea – Maximizing Recovery
In March 2004, in the Norwegian sector of the North Sea, the Ringhorne Jurassic project was completed, which tied part of the Ringhorne production to the ExxonMobil-operated Jotun FPSO. In 2005, Ringhorne (ExxonMobil interest, 100 percent) will export oil and gas through the Balder and Jotun FPSOs at a peak rate of about 90 thousand barrels per day of oil and 30 million cubic feet per day of natural gas.
During 2004, a successful evaluation well supported development plans for the 2003 Ringhorne East discovery. Development drilling activities are planned from the Ringhorne platform in 2005/2006.
EXXON MOBIL CORPORATION . 2004 FINANCIAL & OPERATING REVIEW
UPSTREAM 43
In the U.K. North Sea, the Goldeneye project (ExxonMobil interest, 39 percent) started production in October 2004. The project is expected to recover 135 million oil-equivalent barrels (gross). This five-well development uses an unmanned wellhead platform with the full well-stream sent to the existing St. Fergus gas plant for separation.
ExxonMobil participated in an extensive maintenance and upgrading program at the Norwegian Sleipner West field (ExxonMobil interest, 32 percent) that will boost the estimated recoverable resources by approximately 350 million oil-equivalent barrels (gross). The program will hold Sleipner West’s gas production at its plateau level of around 775 million standard cubic feet per day for another three years. A key part of this upgrade is the Sleipner Alpha North satellite development, which includes the installation of a subsea template and the drilling of four wells. The project was delivered on time and at a cost of about $350 million, some 25 percent below the original estimate. The upgrade program also consists of the Sleipner West compression project. Through this project, the existing Sleipner T platform was modified rather than rebuilt, for cost savings of $380 million.
ExxonMobil continues to acquire exploration interests in the North Sea. Through the 18th licensing round in Norway, ExxonMobil acquired a 30-percent working interest in 11 blocks on the Norwegian Continental Shelf. In 2005, ExxonMobil (operator) and its co-venturers plan to drill the first exploration well on these interests.
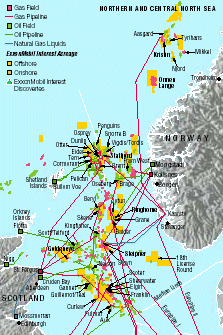
Statfjord Late Life
The Statfjord Late Life project (ExxonMobil interest, 21 percent) is a capacity enhancement project to transition Statfjord operations from reservoir pressure maintenance to reservoir depressurization for enhanced oil and gas recovery. The project involves debottlenecking three platforms to recover 365 million oil-equivalent barrels (gross) of incremental resources with an investment of $3 billion (gross). This will involve facility modifications to accommodate changing reservoir conditions, and to allow for continued drilling and extension of facilities’ life beyond 2020. In addition, a new pipeline will be built to allow export of gas into the UK FLAGS system (ExxonMobil interest, 50 percent).
Southern North Sea – Leveraging Infrastructure
The Arthur field (ExxonMobil interest, 70 percent), discovered in October 2003, started up in January 2005. The field is located in approximately 140 feet of water and will be developed with three subsea wells tied back to the existing ExxonMobil-operated Thames platform via a new 20-mile, 12-inch pipeline and umbilical. The project is expected to recover approximately 130 billion cubic feet (gross) of gas resources.

2004 FINANCIAL & OPERATING REVIEW . EXXON MOBIL CORPORATION
44
Africa
ExxonMobil has a substantial and profitable production base, as well as significant growth potential in Africa, with production from Angola, Chad, Cameroon, Equatorial Guinea, and Nigeria. Exploration and development activities continue in Angola, Chad, Cameroon, Equatorial Guinea, Niger, Nigeria, Madagascar, Senegal, Guinea Bissau, and the Republic of Congo. ExxonMobil’s acreage portfolio ranges from onshore to a world-class position in the high-potential deepwater. ExxonMobil is also pursuing LNG opportunities in Nigeria and Angola.
In deepwater areas offshore Africa, ExxonMobil holds interests in 19 blocks totaling nearly 21 million gross acres. Fourteen deepwater exploration wells were completed offshore West Africa during 2004, adding about 340 million barrels (net) to ExxonMobil’s resource base.
Africa Highlights
| 2004 | 2003 | 2002 | ||||||||||
Earnings (billions of dollars) |
2.1 | 1.3 | 0.8 | |||||||||
Proved Reserves(1) (BOEB) |
2.8 | 2.8 | 2.7 | |||||||||
Acreage (gross acres, million) |
42.6 | 29.5 | 31.7 | |||||||||
Net Liquids Production (MBD) |
0.6 | 0.4 | 0.3 | |||||||||
Net Gas Production (BCFD) |
— | — | — | |||||||||
Africa Projects
| Target Peak | ||||||||||||||
| Working | Production (Gross) | |||||||||||||
| Projected Start-Ups | Interest | Liquids | Gas | |||||||||||
| (%) | (kBD) | (MCFD) | ||||||||||||
2004 |
Kizomba A | 40 | 250 | — | ||||||||||
| Bolobo | 40 | 60 | — | |||||||||||
2005 |
Bonga | 20 | 200 | 150 | ||||||||||
| Kizomba B | 40 | 250 | — | |||||||||||
2006 |
Dalia | 20 | 225 | — | ||||||||||
| Amenam/Kpono Gas Project | 10 | 25 | 235 | |||||||||||
| East Area Add'l Oil Recovery | 40 | 115 | 20 | |||||||||||
| Erha | 56 | 150 | — | |||||||||||
2007 |
Rosa Area | 20 | 140 | — | ||||||||||
| Kizomba C | 40 | 250 | — | |||||||||||
2008+ |
Bonga Ullage | 20 | 140 | 100 | ||||||||||
| Bonga SW | 20 | 85 | 65 | |||||||||||
| Bosi Oil | 56 | 110 | — | |||||||||||
| Nigeria East Area NGLs | 51 | 40 | — | |||||||||||
| Nigeria Satellite Projects | 40 | 125 | — | |||||||||||
| Usan | 30 | 150 | — | |||||||||||
| Angola LNG | 14 | 50 | 965 | |||||||||||
| Kizomba D | 40 | 125 | — | |||||||||||
| Lirio-Cravo | 20 | 115 | — | |||||||||||
| Perpetua-Zinia-Acacia | 20 | 125 | — | |||||||||||
| Plutao-Saturno | 25 | 110 | — | |||||||||||

- Not applicable
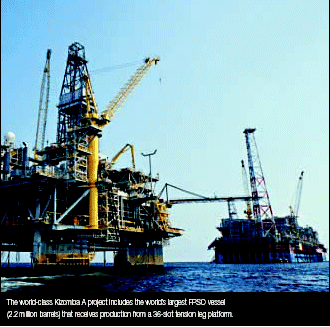
ANGOLA
ExxonMobil has interests in five deepwater blocks that cover 4.5 million gross acres. The Company and its co-venturers have announced 38 discoveries in Angola, which represent world-class development opportunities with recoverable resource potential of almost 12 billion oil-equivalent barrels (gross).
Kizomba A
Initial production from the Kizomba A project occurred in August 2004, setting an industry record for project execution time from contract award to first oil for a project of this size. This offshore Angola Block 15 project is developing the Hungo and Chocalho fields in water depths of 3,300 to 4,200 feet. Peak production is estimated at 250 thousand barrels of oil per day (gross) with estimated recovery from the project of 1 billion barrels of oil (gross).
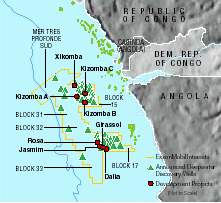
EXXON MOBIL CORPORATION • 2004 FINANCIAL & OPERATING REVIEW
U P S T R E A M 45
Kizomba B
Construction is under way on the offshore Angola Block 15 Kizomba B project ($3.5 billion, gross), which utilizes a design similar to Kizomba A to achieve reduced costs and cycle time. Kizomba B is designed to develop 1 billion barrels of oil (gross) from the Kissanje and Dikanza fields. Installation of the tension leg platform (TLP) and sailaway of the FPSO vessel are scheduled for early 2005. First oil is anticipated in the third quarter 2005.
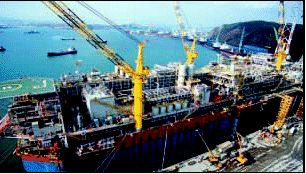
Kizomba C
The Kizomba C project ($3.5 billion, gross) is planned to include the fourth and fifth offshore production hubs in Angola Block 15. Two FPSOs will be required to develop Mondo, Saxi, and Batuque fields, which have combined resources of over 650 million barrels of oil (gross). The project is currently in the design phase, and initial production is expected in 2007.

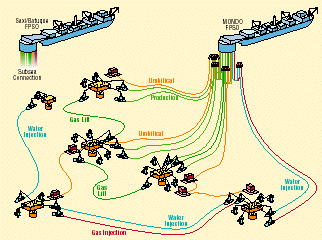
Dalia
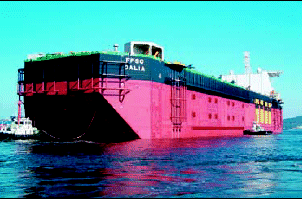
The Dalia project ($3.8 billion, gross) includes a 2-million barrel FPSO vessel to recover nearly 1 billion barrels of oil (gross) from the offshore Angola Block 17 structure. Subsea templates at a water depth of 4,400 feet will handle production and injection for 73 subsea wells. Construction is under way with start-up anticipated in 2006.

2004 FINANCIAL & OPERATING REVIEW • EXXON MOBIL CORPORATION
46
NIGERIA
ExxonMobil participates in a joint venture (ExxonMobil interest, 40 percent for crude and condensate; 51 percent for natural gas liquids) with the Nigerian National Petroleum Corporation, for which it operates five leases covering over 800,000 acres in shallow water offshore southeastern Nigeria. ExxonMobil is the operator for over 90 platforms, the terminal at Qua Iboe, the Falcon FPSO at Yoho, the Oso Condensate Recovery/NGL extraction plant, and the Bonny Fractionation Plant. In 2004, ExxonMobil operations in offshore Nigeria produced an average of 276 thousand barrels of liquids per day (net). In addition to activities in the Joint Venture Area, ExxonMobil is expanding into deepwater Nigeria via the Bonga and Erha fields.
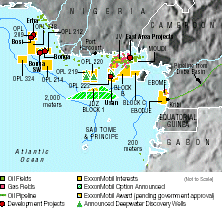
Nigeria Joint Venture – Shelf Development
Activities are progressing to increase production capacity in the Joint Venture Area. Production growth will result from development drilling, satellite field developments, enhanced recovery projects, and a series of platform upgrades, which will enhance facility integrity and production capacity, and optimally develop additional resources on the joint-venture acreage. The Amenam/Kpono project (ExxonMobil interest, 10 percent), which achieved first oil production in 2003, is expected to deliver first gas in 2006. Three major projects, the Yoho Full-Field Project, the East Area Additional Oil Recovery Project, and the East Area Natural Gas Liquids Project, are under way.
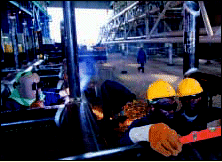
Fabrication for the Erha development is under way in Port Harcourt, Nigeria.
Yoho
Yoho full-field drilling and installations continue in offshore Nigeria. With investment of $1.3 billion (gross), the project is developing the Yoho and Awawa fields with estimated recoverable reserves of 400 million barrels of oil. Full-field development is expected to be completed in 2005 and consists of production and quarters platforms, a floating storage and offloading vessel, multiple wellhead platforms and an oil export system. Successful implementation of an early production system in 2002 enabled first oil from Yoho about three years ahead of full-field production.
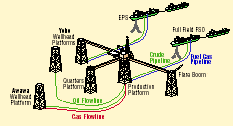
East Area Additional Oil Recovery
The East Area Additional Oil Recovery project ($2.3 billion, gross) will increase recovery and minimize gas flaring from six joint-venture East Area producing fields. Project scope includes expansion of the gas gathering and injection systems, and installation of gas compression and quarters platforms. The project is expected to recover 550 million oil-equivalent barrels (gross). Construction is under way for first gas injection in 2006.
East Area Natural Gas Liquids
The East Area NGL project ($1 billion, gross) will include offshore extraction facilities, a 120-mile pipeline system, and expansion of the Bonny River Terminal to recover 275 million oil-equivalent barrels (gross) of natural gas liquids from East Area joint-venture fields. Contracting is under way with project start-up in 2008.
EXXON MOBIL CORPORATION • 2004 FINANCIAL & OPERATING REVIEW
U P S T R E A M 47
Nigeria Deepwater Development
Complementing the activity in the Joint Venture Area, development projects are now under way to capture the potential of Nigeria’s deepwater. The first of these, Bonga, will start up in 2005 followed closely by Erha in 2006. Development plans continue for Usan on Block 222.
Bonga
Offshore installation is in progress on the Bonga project ($3.9 billion, gross), ExxonMobil’s first participation in a deepwater (3,300 feet) development offshore Nigeria. Starting up in 2005, the project is designed to produce 200 thousand barrels of oil per day (gross) from 22 subsea wells tied back to a newly constructed FPSO vessel.
Erha
Fabrication of the Erha FPSO topsides is in progress in Singapore and Malaysia. The FPSO will be moored 60 miles offshore Nigeria in 3,400 feet of water, with capacity to handle production of 150 thousand barrels of oil per day from 15 subsea producers. Project investment totals $2.5 billion (gross) and first oil is anticipated in the first half of 2006.
BUILDING CAPABILITY — FIRST SUBSEA INTEGRATION TEST IN WEST AFRICA
In 2004, the first subsea integration test (SIT) ever conducted in West Africa took place in Nigeria for the Erha Project. The SIT lays out all subsea equipment on land, including wellheads, manifolds, and flowlines, and tests the necessary connections, functions, and interfaces prior to mobilization for offshore installation. The SIT, a critical execution milestone for subsea production equipment, was completed successfully, and represented a dramatic move forward in capability for West Africa, and specifically, Nigeria.
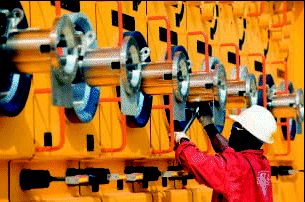
EQUATORIAL GUINEA
ExxonMobil is the largest producer in Equatorial Guinea and operates two blocks which cover about 1 million acres (gross). The Zafiro field is located on Block B (ExxonMobil interest, 71 percent) approximately 40 miles northwest of Malabo in water depths between 400 and 2,800 feet.
In 2004, total field production increased to an average of over 280 thousand barrels of oil per day (gross). This is approximately 40 percent above 2003 volumes with substantial volume contributions from the Southern Expansion Area Project. Production from this project is through the FPSO Serpentina, an EPS, with production from the remainder of the field supported by the Jade Platform and the Zafiro Producer, a floating production unit (FPU). In 2004, 14 wells were completed in the Zafiro field.
CHAD
With start-up of Kome field production in January 2004 and the Bolobo field in August 2004, five months ahead of schedule, combined Chad production exceeded 200 thousand barrels of oil per day (gross) through a 650-mile pipeline that extends from the Doba Basin to Kribi, Cameroon. The Nya and Moundouli fields are expected to begin production in 2005 and 2006, respectively. An estimated 1 billion barrels of oil (gross) will be recovered from the Chad fields. Additionally, ExxonMobil finalized an agreement allowing continued exploration in the over-8-million-acre (gross) Permit H through 2008. Exploration drilling is under way.
OTHER AFRICA
During 2004, ExxonMobil continued to acquire deepwater exploration interests in Africa. Through the first license round in the Nigeria-Sao Tome and Principe Joint Development Zone, ExxonMobil acquired a 40-percent participating interest in the 174,000-acre Block1 (pending completion of final agreements). ExxonMobil also farmed into the 4.4-million-acre Majunga concession on the northwest coast of Madagascar to earn a 40-percent participating interest, and acquired 100-percent interest in the offsetting Cap Saint Andre Offshore block. In 2005, ExxonMobil and its co-venturers will conduct technical studies on these interests with plans for near-term exploration drilling.
2004 FINANCIAL & OPERATING REVIEW • EXXON MOBIL CORPORATION
48
Middle East
ExxonMobil has a substantial production base and significant growth potential in the resource-rich Middle East region. In addition to Qatar, ExxonMobil is pursuing additional opportunities, focusing where ExxonMobil’s industry-leading technology and capabilities can contribute to increased recovery of oil and gas, while enhancing training and development of national work forces. In Kuwait, ExxonMobil leads a consortium competing for the Operating Services Agreement covering four fields in the northern part of the country. ExxonMobil is also pursuing investment opportunities in the United Arab Emirates where we currently produce 116 thousand barrels of liquids per day.
Middle East Highlights
| 2004 | 2003 | 2002 | ||||||||||
Earnings (billions of dollars) |
0.6 | 0.4 | 0.3 | |||||||||
Proved Reserves(1) (BOEB) |
3.6 | 2.0 | 1.8 | |||||||||
Acreage (gross acres, million) |
7.6 | 7.5 | 7.5 | |||||||||
Net Liquids Production (MBD) |
0.1 | 0.1 | 0.1 | |||||||||
Net Gas Production (BCFD) |
0.7 | 0.5 | 0.4 | |||||||||
Middle East Projects
| Target Peak | ||||||||||||||
| Working | Production (Gross) | |||||||||||||
| Projected Start-Ups | Interest | Liquids | Gas | |||||||||||
| (%) | (kBD) | (MCFD) | ||||||||||||
2004 |
RasGas Train 3 | 29 | 30 | 725 | ||||||||||
2005 |
Al Khaleej Gas Phase 1 | 100 | 50 | 600 | ||||||||||
| RasGas Train 4 | 34 | 45 | 740 | |||||||||||
2007 |
RasGas Train 5 | 30 | 45 | 740 | ||||||||||
2008+ |
RasGas Trains 6 & 7 | 30 | 140 | 2,500 | ||||||||||
| Qatargas II Train 4 | 30 | 80 | 1,250 | |||||||||||
| Qatargas II Train 5 | 18 | 80 | 1,250 | |||||||||||
| Al Khaleej Gas (Future Phases) | 100 | 95 | 1,050 | |||||||||||
| Qatar GTL | 100 | 165 | 1,440 | |||||||||||

| (1) | Excludes 2004 year-end price/cost revisions. |
| Qatar Existing and Planned LNG Trains |
| Joint | Capacity | Working | Scheduled | ||||||||||||||
| Venture | Train | MTA | Interest | Market | Completion | ||||||||||||
| (%) | |||||||||||||||||
Qatargas |
1,2,3 | 9.4 | 10 | Japan/Europe | Complete | ||||||||||||
Qatargas II |
4 | 7.8 | 30 | United Kingdom | 2008 | ||||||||||||
Qatargas II |
5 | 7.8 | 18 | United Kingdom | 2009 | ||||||||||||
RasGas |
1,2 | 6.6 | 25 | Korea | Complete | ||||||||||||
RasGas |
3 | 4.7 | 29 | India | Complete | ||||||||||||
RasGas |
4 | 4.7 | 34 | Europe | 2005 | ||||||||||||
RasGas |
5 | 4.7 | 30 | Europe | 2007 | ||||||||||||
RasGas |
6 | 7.8 | 30 | United States | 2008 | ||||||||||||
RasGas |
7 | 7.8 | 30 | United States | 2010 | ||||||||||||
Total |
61.3 | ||||||||||||||||
QATAR
ExxonMobil and Qatar Petroleum, with other joint-venture partners, are further developing the giant North Field, the largest nonassociated gas field in the world. Resources to be developed through existing and planned LNG trains, the gas-to-liquids (GTL) project, and pipeline sales projects exceed 25 billion oil-equivalent barrels (gross). Natural gas from the North Field is competitive for supplying Liquefied Natural Gas (LNG) to the Asia Pacific region, Europe, and the United States.
In 2004, three existing LNG trains at the Qatargas joint venture produced 9.2 million tons (gross), which were sold mainly to customers in Japan and Spain. Work is progressing on the Qatargas II project (ExxonMobil interest, Train 4, 30 percent and Train 5, 18 percent), which includes two LNG trains each with a capacity of 7.8 million tons per year with sales commencing in 2008. In 2004, construction started on the South Hook LNG receiving terminal in Milford Haven, Wales.
The RasGas joint venture (ExxonMobil interest, 25 to 34 percent) produced 9.5 million tons in 2004 (gross), sold mainly to Korea and India, with the bulk of the remainder going into markets in the United States and Spain. RasGas Train 3 started up in February 2004, and supplied the first LNG sales ever into India. RasGas Trains 4 and 5 will commence production in 2005 and 2007, respectively, with sales predominantly to Europe.
RasGas is progressing plans to produce and deliver 15.6 million tons per year of LNG to the United States. This project will be the largest LNG import project for supply of gas to the United States. Two LNG trains of 7.8 million tons per year each and 24 ships are included in the RasGas Trains 6 and 7 development.
The Qatar natural gas projects will also produce natural gas liquids for both domestic use and export.
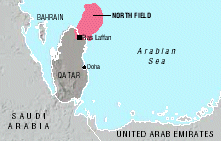
EXXON MOBIL CORPORATION • 2004 FINANCIAL & OPERATING REVIEW
U p s t r e a m 49
RasGas Trains 3, 4, and 5
RasGas LNG Trains 3, 4, and 5 are designed to expand Qatar’s North Field production with combined capacity of over 14 million tons of LNG per year. First production from Train 3 occurred ahead of schedule in February 2004, with sales to India. Trains 4 and 5 are targeted for sales primarily in Europe, with start-up scheduled in 2005 and 2007, respectively.

LARGE TRAINS – LOWER SUPPLY COST
Advances in design and engineering of key process equipment, including spiral-wound heat exchangers, compressors, and turbines have allowed ExxonMobil to leverage economy of scale to lower cost of supply.

RasGas Trains 6 and 7
RasGas Trains 6 and 7 are expected to be the largest LNG export project to supply the United States market ($12 billion, gross). Designed to produce and deliver 15.6 million tons per year of LNG from Qatar’s North Field, the project will be an important element in meeting future gas demand in the United States. Start-up of Train 6 is targeted for 2008, followed by Train 7 in 2010.
Qatargas II – Trains 4 and 5
A joint project between Qatar Petroleum and ExxonMobil, the Qatargas II project ($12 billion, gross) is expected to further develop Qatar’s North Field through the addition of the world’s largest (7.8 million tons per year) onshore LNG liquefaction trains. Each project will encompass production, liquefaction, shipping, and regasification facilities. Construction is in progress on the South Hook LNG receiving terminal in Milford Haven, Wales. With first gas sales in 2008, Qatargas II LNG will supply markets in the United Kingdom and continental Europe.
Al Khaleej Gas
The multiphase Al Khaleej Gas Project is another opportunity to develop natural gas from Qatar’s giant North Field. Construction is in progress on Phase 1 ($1 billion, gross), which is expected to supply over 600 million cubic feet of gas per day plus associated condensate, natural gas liquids and ethane. First gas sales are anticipated in 2005. Future phases of the project will supply additional domestic requirements as well as regional export sales.
Qatar Gas-to-Liquids (GTL)
In July 2004, ExxonMobil signed a Heads of Agreement with Qatar Petroleum to build the world’s largest fully integrated GTL plant ($7 billion, gross). The upstream project will be designed to produce over 1.4 billion cubic feet per day (gross) of feed gas, along with 165 thousand barrels per day (gross) of associated condensate and natural gas liquids. The GTL plant will process the feed gas to yield an industry-leading 154 thousand barrels per day (gross) of products, such as low-sulfur diesel, lube basestocks, and naphtha. ExxonMobil holds over 3,500 patents or patents pending associated with GTL technology. Start-up is targeted for 2011.
2004 FINANCIAL & OPERATING REVIEW • EXXON MOBIL CORPORATION
50
COMPETITIVE ADVANTAGE IN LNG
LNG TECHNOLOGY LEADERSHIP
ExxonMobil is well-positioned to continue its leadership in the growing LNG trade. ExxonMobil’s access and knowledge of world markets combined with advanced technology have allowed us to commercialize new resources.
Technology has played a very important part in enabling economic supply of gas from remote sources. For example, LNG liquefaction trains will increase in size from around 3 million tons per annum of capacity in 2000 to almost 8 million tons by 2008. New technology and economies of scale are expected to lower unit liquefaction costs by 15 to 20 percent.
Likewise, in the same time frame, LNG ship sizes are increasing from a capacity of about 140,000 cubic meters to as large as 250,000 cubic meters. A unique ExxonMobil-designed testing program has enabled the qualification of membrane tanks in what will be the world’s largest LNG ships, almost 50 percent larger than conventional ships today. Unit transportation costs as a result are expected to be reduced by 10 to 15 percent.
LNG OPPORTUNITIES
Between 2005 and 2010, ExxonMobil has plans to participate in start-up of nine LNG trains in Qatar, Angola, and Australia. These new trains have a gross capacity of over 7 billion cubic feet per day or 55 million tons per year. These projects represent about half of the industry’s new LNG capacity expected to be added by 2010.
The Greater Gorgon/Jansz Project will develop resources in the Gorgon, Jansz, and nearby fields in northwest Australia. The Angola LNG project provides a disposition for the associated gas from offshore oil developments.
Beyond 2010, ExxonMobil is evaluating new LNG opportunities, including additional trains in Qatar, Nigeria, and Australia.
Global LNG Opportunities

Cost Leadership – LNG Construction
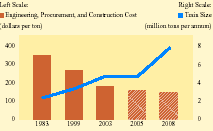
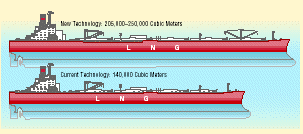
LNG MARKET – EXXONMOBIL MARKET SHARE
Global LNG demand is growing at approximately 7 percent per year, faster than overall gas demand. Between 2001 and 2020, world LNG demand is expected to grow nearly four times (from about 120 to over 450 million tons per annum). By 2020, the United States is expected to become the largest market for LNG.
As of 2004, the Company’s participation in LNG joint ventures had a combined gross capacity of 27 million tons per year, or 20 percent of the global industry capacity, making ExxonMobil one of the largest LNG suppliers in the world.
LNG MARKETS GROWING
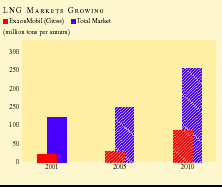
EXXON MOBIL CORPORATION • 2004 FINANCIAL & OPERATING REVIEW
Russia and Caspian
ExxonMobil operates and holds a 30-percent interest in the Sakhalin-1 blocks offshore mainland Russia. Gas marketing efforts have resulted in Letters of Intent for sales with customers in eastern Russia. Progress was made for potential sales into China, and discussions continue with potential customers in Japan.
Exploration activities on the Sakhalin III blocks are pending award of Exploration and Production licenses by the Russian government.
In the Caspian, ExxonMobil holds the unique position of participating in the development of three of the largest fields in the world: Kashagan and Tengiz in Kazakhstan, and Azeri-Chirag-Gunashli in Azerbaijan.
Caspian Highlights
| 2004 | 2003 | 2002 | ||||||||||
Earnings
(billions of dollars) |
0.4 | 0.3 | 0.2 | |||||||||
Proved
Reserves(1) (BOEB) |
2.1 | 2.0 | 1.4 | |||||||||
Acreage (gross acres, million) |
2.8 | 3.1 | 3.1 | |||||||||
Net Liquids Production (MBD) |
0.1 | 0.1 | 0.1 | |||||||||
Net Gas Production (BCFD) |
0.1 | 0.1 | 0.1 | |||||||||
Russia and Caspian Projects
| Target Peak | ||||||||||||||
| Working | Production(Gross) | |||||||||||||
| Projected Start-Ups | Interest | Liquids | Gas | |||||||||||
| (%) | (kBD) | (MCFD) | ||||||||||||
2005 |
Azeri-Chirag-Gunashli | |||||||||||||
| (ACG) Phase 1 | 8 | 325 | – | |||||||||||
| Sakhalin-1 (Chayvo) Phase 1 | 30 | 250 | 1,000 | |||||||||||
2006 |
ACG Phase 2 | 8 | 465 | – | ||||||||||
| Tengiz Phase 1 | 25 | 300 | 100 | |||||||||||
2008+ |
ACG Phase 3 | 8 | 260 | – | ||||||||||
| Kashagan | 17 | 1,200 | – | |||||||||||
| Tengiz Expansion | 25 | 220 | – | |||||||||||

| (1) | Excludes 2004 year-end price/cost revisions. | |
| – | Not applicable |
Sakhalin - 1
The multiphase Sakhalin-1 project ($12+ billion, gross) in the arctic region offshore the Russian Far East will develop more than 5 billion oil-equivalent barrels (gross). The initial phase of the project is designed to produce 250 thousand barrels of oil and 1 billion cubic feet of gas per day (gross) from the Chayvo field utilizing onshore and offshore extended-reach drilling technologies for some of the longest extended-reach drillwells in the world. Oil production will be processed in an onshore facility and exported via pipeline to the new DeKastri terminal facility on the Russian mainland. Phase 1 construction and drilling activities are under way. An early production system will accelerate initial production to mid-2005, followed by full-field production in 2006. Beginning in 2005, gas will be sold to domestic utilities in the Khabarovsk Krai in the Russian Far East. Sales will increase to 270 million cubic feet per day (gross) in 2009. Future phases will develop the remaining Chayvo, Odoptu, and Arkutun-Dagi resources.

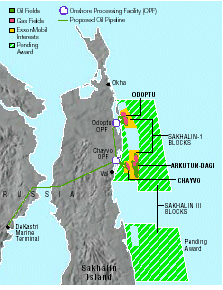
2004 FINANCIAL & OPERATING REVIEW • EXXON MOBIL CORPORATION
52
EXTENDED REACH DRILLING TECHNOLOGY
The Sakhalin-1 Phase 1 development has benefited significantly from application of leading-edge technology. The use of extended-reach drillwells (ERDs) to access reserves about six miles from shore has allowed the elimination of a costly offshore platform and minimized activity in the sensitive offshore area. To drill these wells to very long measured depths, state-of-the-art rotary steerable technology (RST) is applied, which delivers a smooth wellpath and enables successful installation of casing at these record depths.
In 2003 to 2004, four wells were drilled into the reservoir. Two more wells will be drilled prior to starting production operations, and another nine wells are planned over the next three years. One well has been perforated and tested, and two more wells are equipped with production tubing awaiting completion. The completion and perforation of these wells utilizes coil tubing, which is run to distances never before attempted. The first ERD well set the world record for a coiled-tubing run at 30,600 feet.
Sakhalin-1 ERD well design utilized a systematic planning approach that incorporated a study of local Russian and worldwide geometric offset wells and application of ExxonMobil proprietary technologies (integrated hole quality/quantitative risk assessment). A comprehensive directional plan was developed to successfully intersect the reservoir target objective at a precise depth and location. ERD technology utilized at Sakhalin is making this challenging project technically feasible and economically attractive.
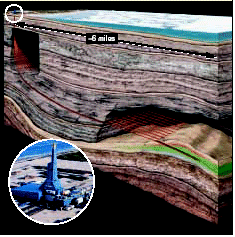
AZERBAIJAN
Production from the Azeri-Chirag-Gunashli (ACG) development (ExxonMobil interest, 8 percent) in the south Caspian Sea totaled 130 thousand barrels of oil per day (gross) in 2004. In total, the development is expected to recover resources of over 6 billion barrels of oil and 6 trillion cubic feet of natural gas (gross). The first phase of a multiphase expansion started up in February 2005.
ExxonMobil participates in three other Production Sharing Agreements that cover 570 thousand gross acres in the Azeri sector of the Caspian Sea: Nakhchivan (ExxonMobil-operated, 50 percent interest); Zafar Mashal (ExxonMobil-operated, 30 percent interest); and Araz-Alov-Sharg (ExxonMobil interest, 15 percent). The first exploration well on the Zafar Mashal prospect completed drilling in 2004 but no commercial hydrocarbons were found.
Azeri-Chirag-Gunashli (ACG)
The $12 billion (gross) multiphase Azeri-Chirag-Gunashli project is under way in the western Caspian Sea offshore Azerbaijan. Adding to existing production at Chirag, ACG Phase 1, which started up in February 2005, will develop the Central Azeri field with gross capacity of 325 thousand barrels of oil per day. Phase 1 includes the construction and installation of drilling, production, compression, and injection platforms in 420 feet of water, along with 100 miles of subsea oil and gas pipelines. Phase 2 will further develop the Azeri field, and Phase 3 will develop the Gunashli field. Gross developed resource from the three-phase expansion is expected to total 5.4 billion oil-equivalent barrels (gross).

EXXON MOBIL CORPORATION • 2004 FINANCIAL & OPERATING REVIEW
U p s t r e a m 53
KAZAKHSTAN
Development planning activities are under way to initiate production from the giant Kashagan field, located in the offshore Caspian Sea and part of the North Caspian Production Sharing Agreement (NCPSA). In addition to the Kashagan field, the NCPSA includes exploration acreage where ExxonMobil participated in the successful testing and discovery of hydrocarbons at the Kairan prospect during 2004, following suspension of drilling operations in 2003 for the winter season.
During 2003, ExxonMobil exercised its preferential right to purchase its share of BG Group equity in the NCPSA. Upon close of the equity purchase, now anticipated in 2005, ExxonMobil will increase its interest in the NCPSA. Final equity percentages are still to be determined.
ExxonMobil participates in the Tengizchevroil (TCO) joint venture (ExxonMobil interest, 25 percent), which includes a production license area of 380 thousand gross acres encompassing the Tengiz field, an associated processing plant complex, and the adjacent Korolev field. TCO also holds a prospective exploration license that covers over 600 thousand gross acres surrounding the production license.

Kashagan
The super-giant Kashagan field is located in the northern Caspian Sea offshore Kazakhstan. The $40+ billion (gross) development of the field will occur in phases, with the first phase targeting 5.2 billion barrels of oil reserves (gross) at a producing rate of 450 thousand barrels per day. Phase 1 development is under way and will include an offshore production/separation hub on an artificial island, three drilling islands, three onshore oil stabilization trains, and two onshore gas treating plants. Future phases will increase recovery to 13 billion barrels of oil (gross) at a producing rate of more than 1 million barrels of oil per day.
Tengiz
Production capacity for Tengiz, in Kazakhstan, is currently 300 thousand barrels of oil per day with over 3 billion barrels of oil reserves developed. Planned expansions and optimizations ($15 billion, gross) will add 520 thousand barrels per day of oil production (gross) and incremental reserves of nearly 3 billion barrels. The first expansion will integrate a second-generation gas-handling project with a sour gas injection project resulting in incremental peak production of 300 thousand barrels of oil per day (gross). Construction is under way with initial oil production in 2006.
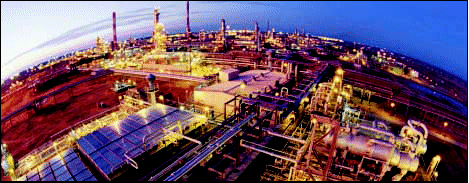
2004 FINANCIAL & OPERATING REVIEW • EXXON MOBIL CORPORATION
54
Asia Pacific
ExxonMobil has an established large-scale and profitable production base throughout the Asia Pacific region. Net daily production of about 200 thousand barrels of liquids and 1.5 billion cubic feet of gas represented 11 percent of ExxonMobil’s worldwide production in 2004.

Asia Pacific Highlights
| 2004 | 2003 | 2002 | ||||||||||
Earnings (billions of dollars) |
2.1 | 1.7 | 1.6 | |||||||||
Proved
Reserves(1) (BOEB) |
1.6 | 1.9 | 2.0 | |||||||||
Acreage (gross acres, million) |
10.6 | 22.9 | 29.5 | |||||||||
Net Liquids Production (MBD) |
0.2 | 0.2 | 0.3 | |||||||||
Net Gas Production (BCFD) |
1.5 | 1.8 | 2.0 | |||||||||
Asia Pacific Projects
| Target Peak | ||||||||||||||
| Working | Production (Gross) | |||||||||||||
| Projected Start-Ups | Interest | Liquids | Gas | |||||||||||
| (%) | (kBD) | (MCFD) | ||||||||||||
2006 |
Guntong Hub | 50 | 35 | 715 | ||||||||||
2008+ |
Banyu Urip | * | 165 | 20 | ||||||||||
| Greater Gorgon/Jansz Project | * | 10 | 1,500 | |||||||||||
| Kipper/Tuna | 41 | 25 | 270 | |||||||||||
| PNG Gas Project | 26 | 20 | 415 | |||||||||||
| (1) | Excludes 2004 year-end price/cost revisions. | |
| * | Under negotiation |
INDONESIA
ExxonMobil operates Indonesia’s Arun natural gas field (ExxonMobil interest, 100 percent), which supplies gas to the P.T. Arun LNG plant. In 2004, net production from the Arun and satellite fields in Pase/South Lhok Sukon and the North Sumatra Offshore field totaled almost 580 million cubic feet of gas per day.
ExxonMobil is continuing negotiations with PT Pertamina (Persero) and the government of Indonesia to extend the term of the Cepu contract. Once agreement is reached, plans are to begin development of the Banyu Urip oil field. In addition, analysis of the large, 3D seismic survey over the block will guide future exploratory and development programs.
ExxonMobil, along with co-participant PT Pertamina (Persero), is proceeding with the next phase of development of the Natuna gas field (ExxonMobil interest, 76 percent). During this phase, the participating parties will work to complete marketing arrangements for the gas and update cost and design studies. The Natuna D-Alpha gas field, located north of the Kalimantan Province, Indonesia, and approximately 850 miles from Java, was discovered in 1973 and has estimated recoverable hydrocarbon resources of 46 trillion cubic feet of natural gas (gross).
Banyu Urip
Pending resolution of commercial agreements, development of the Banyu Urip field in eastern Java will include construction of an initial oil production facility followed by a central processing facility. A 50-mile pipeline will transport the processed oil to a 2-million-barrel floating storage and offloading vessel moored off the nearby Tuban coast in the Java Sea. Estimated recovery from the field is over 250 million barrels of oil (gross).
MALAYSIA
ExxonMobil is the largest oil producer in Malaysia and the largest supplier of natural gas to Peninsular Malaysia. Net production in 2004 was over 90 thousand barrels of liquids per day and 510 million cubic feet of gas per day. The Company participates in six Production Sharing Contracts offshore Peninsular Malaysia, operates 39 platforms in 17 fields and has plans to install three new platforms over the next few years. In total, ExxonMobil holds an interest in 500 thousand net acres offshore.
Guntong Hub
The Guntong Hub project (ExxonMobil interest, 50 percent) will develop approximately 800 million oil-equivalent barrels (gross) and features the installation of a compression platform, Guntong E. Scheduled for start-up in 2006, the Hub project will process approximately 715 million cubic feet of gas per day and 35 thousand barrels of liquids per day (gross). The project facilitates a series of future gas developments with investments totaling $1.6 billion over 15 years. Future gas developments include adjacent fields at Tabu, Palas, Irong Barat, Telok, and Bindu.
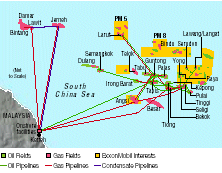
EXXON MOBIL CORPORATION • 2004 FINANCIAL & OPERATING REVIEW
U p s t r e a m 55
AUSTRALIA / PAPUA NEW GUINEA
In 2004, daily net production from ExxonMobil’s Australian and Papua New Guinea operations was about 400 million cubic feet of gas and 100 thousand barrels of liquids. In the Bass Strait, the Company continues to operate offshore producing facilities, a crude stabilization plant, three gas processing plants, and one fractionation plant, while supplying natural gas throughout southeast Australia. After 35 years of production, this mature area still contains significant gas resources, with new exploration and infill drilling targets resulting from the recent 3,900-square-kilometer Northern Fields and 1,100-square-kilometer Tuskfish 3D seismic surveys. Drilling of these targets commenced in 2004 and will continue through 2005.
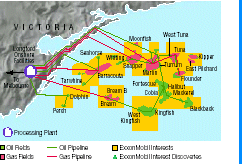
Greater Gorgon / Jansz Project
Development of Gorgon, Jansz, and Io fields will result in 10 million tons per year (gross) of LNG targeted principally for markets in Asia Pacific and the west coast of North America. Currently in the planning phase, the project scope includes installation of two 5-million-ton-per-year LNG trains on Barrow Island. Start-up of the first LNG train will occur in 2009, and the second train will start up in 2010. ExxonMobil has participated in the discovery of over 50 trillion cubic feet (gross) of gas resources in the deepwater off Australia’s Northwest Shelf.
PNG Gas Project
The PNG Gas Project will develop gas from the Hides field in the Southern Highlands of Papua New Guinea for export to Queensland, Australia, via a 3,000-kilometer pipeline with a capacity of approximately 415 million cubic feet per day (gross). The project is currently in the front-end engineering and design stage. ExxonMobil and co-venturers are actively negotiating gas sales contracts with customers to support project development.

Power
ExxonMobil has significant holdings in electric power generation, with interests in 13,700 megawatts of generation capacity, including 3,300 megawatts of cogeneration. In 2004, 400 megawatts of cogeneration capacity started up at the Beaumont, Baytown, and Sarnia refineries.
Power – Statistical Highlights(1)
| 2004 | 2003 | 2002 | ||||||||||
Earnings (millions of dollars) |
315 | 311 | 299 | |||||||||
Electricity
sales(2) (gigawatt hours) |
31,719 | 31,043 | 29,888 | |||||||||
Average capital employed |
||||||||||||
(millions of dollars) |
1,982 | 1,956 | 1,978 | |||||||||
Capital expenditures |
||||||||||||
(millions
of dollars) |
129 | 165 | 73 | |||||||||
| (1) | ExxonMobil share of power affiliate results, except electricity sales, which are stated at 100 percent. | |
| (2) | China Light & Power sales to consumers in China. |
In 2004, ExxonMobil celebrated the 40th anniversary of partnership with China Light & Power in the Hong Kong power business. ExxonMobil has a 60-percent interest in three power stations in Hong Kong totaling almost 6,300 megawatts of electricity generation capacity, and a 51-percent interest in an additional 600 megawatts of capacity in southern China. These stations supply electricity to China Light & Power, which serves Hong Kong, and surplus power is sold to neighboring Guangdong. Since 2000, power sales have been growing at 3.7 percent per year.
To supply growing electrical demand, construction is in progress on two additional combined cycle gas turbine (CCGT) units at the Black Point Power Station. Completion of these units will add 625 megawatts of gas-fired generation capacity in 2005.
Coal
ExxonMobil operates the Monterey coal mine in the United States (Illinois) with production of 2.8 million metric tons in 2004. The coal is supplied to local power generation and cement processing industries.
2004 FINANCIAL & OPERATING REVIEW • EXXON MOBIL CORPORATION
56
Upstream Operating Statistics
NET LIQUIDS PRODUCTION ( 1 )–Including Tar Sands and Non-Consolidated Operations
| (thousands of barrels per day) | 2004 | 2003 | 2002 | 2001 | 2000 | |||||||||||||||
United States |
||||||||||||||||||||
Alaska |
174 | 188 | 197 | 210 | 232 | |||||||||||||||
Lower 48 |
383 | 422 | 484 | 502 | 501 | |||||||||||||||
Total United States |
557 | 610 | 681 | 712 | 733 | |||||||||||||||
Canada |
355 | 363 | 349 | 331 | 304 | |||||||||||||||
Total North America |
912 | 973 | 1,030 | 1,043 | 1,037 | |||||||||||||||
Europe |
||||||||||||||||||||
United Kingdom |
235 | 278 | 305 | 320 | 355 | |||||||||||||||
Norway |
328 | 280 | 263 | 307 | 320 | |||||||||||||||
Other |
20 | 21 | 24 | 26 | 29 | |||||||||||||||
Total Europe |
583 | 579 | 592 | 653 | 704 | |||||||||||||||
Asia Pacific |
||||||||||||||||||||
Australia |
91 | 111 | 122 | 131 | 140 | |||||||||||||||
Malaysia |
94 | 105 | 115 | 98 | 90 | |||||||||||||||
Other |
17 | 21 | 23 | 18 | 23 | |||||||||||||||
Total Asia Pacific |
202 | 237 | 260 | 247 | 253 | |||||||||||||||
Africa |
||||||||||||||||||||
Nigeria |
276 | 260 | 213 | 249 | 253 | |||||||||||||||
Equatorial Guinea |
136 | 124 | 98 | 89 | 67 | |||||||||||||||
Other |
160 | 58 | 38 | 4 | 3 | |||||||||||||||
Total Africa |
572 | 442 | 349 | 342 | 323 | |||||||||||||||
Middle East |
158 | 149 | 127 | 135 | 137 | |||||||||||||||
Other Areas |
144 | 136 | 138 | 122 | 99 | |||||||||||||||
Total worldwide |
2,571 | 2,516 | 2,496 | 2,542 | 2,553 | |||||||||||||||
Gas Plant Liquids Included Above |
||||||||||||||||||||
United States |
86 | 90 | 111 | 120 | 120 | |||||||||||||||
Non-U.S. |
168 | 166 | 178 | 185 | 180 | |||||||||||||||
Total worldwide |
254 | 256 | 289 | 305 | 300 | |||||||||||||||
Tar Sands and Non-Consolidated Volumes Included Above |
||||||||||||||||||||
United States |
101 | 106 | 106 | 109 | 115 | |||||||||||||||
Canada |
59 | 52 | 57 | 52 | 42 | |||||||||||||||
Europe |
9 | 9 | 9 | 10 | 13 | |||||||||||||||
Middle East |
140 | 127 | 102 | 108 | 107 | |||||||||||||||
Other |
74 | 71 | 74 | 70 | 57 | |||||||||||||||
Total worldwide |
383 | 365 | 348 | 349 | 334 | |||||||||||||||
| (1) Net liquids production quantities are the volumes of crude oil and natural gas liquids withdrawn from ExxonMobil’ s oil and gas reserves, excluding royalties and quantities due to others when produced, and are based on the volumes delivered from the lease or at the point measured for royalty and/or severance tax purposes. Volumes include 100 percent of the production of majority-owned affiliates, including liquids production from tar sands operations in Canada, and ExxonMobil’ s ownership of the production by companies owned 50 percent or less. |
EXXON MOBIL CORPORATION • 2004 FINANCIAL & OPERATING REVIEW
Upstream 57
NET NATURAL GAS PRODUCTION AVAILABLE FOR SALE ( 1 ) - Including Non-Consolidated Operations
| (millions of cubic feet per day) | 2004 | 2003 | 2002 | 2001 | 2000 | |||||||||||||||
United States |
1,947 | 2,246 | 2,375 | 2,598 | 2,856 | |||||||||||||||
Canada |
972 | 943 | 1,024 | 1,006 | 844 | |||||||||||||||
Total North America |
2,919 | 3,189 | 3,399 | 3,604 | 3,700 | |||||||||||||||
Europe |
||||||||||||||||||||
Netherlands |
1,725 | 1,591 | 1,601 | 1,637 | 1,519 | |||||||||||||||
United Kingdom |
1,196 | 1,234 | 1,417 | 1,547 | 1,506 | |||||||||||||||
Norway |
645 | 667 | 503 | 445 | 451 | |||||||||||||||
Germany |
1,048 | 1,006 | 942 | 966 | 987 | |||||||||||||||
Total Europe |
4,614 | 4,498 | 4,463 | 4,595 | 4,463 | |||||||||||||||
Asia Pacific |
||||||||||||||||||||
Australia |
397 | 450 | 453 | 449 | 346 | |||||||||||||||
Malaysia |
511 | 563 | 690 | 645 | 649 | |||||||||||||||
Indonesia |
578 | 745 | 825 | 401 | 701 | |||||||||||||||
Other |
33 | 45 | 51 | 52 | 59 | |||||||||||||||
Total Asia Pacific |
1,519 | 1,803 | 2,019 | 1,547 | 1,755 | |||||||||||||||
Middle East |
642 | 455 | 408 | 354 | 278 | |||||||||||||||
Other Areas |
170 | 174 | 163 | 179 | 147 | |||||||||||||||
Total worldwide |
9,864 | 10,119 | 10,452 | 10,279 | 10,343 | |||||||||||||||
Non-Consolidated Natural Gas Volumes Included Above |
||||||||||||||||||||
United States |
2 | 2 | 2 | 13 | 15 | |||||||||||||||
Europe |
1,667 | 1,531 | 1,539 | 1,556 | 1,433 | |||||||||||||||
Middle East |
642 | 455 | 408 | 354 | 278 | |||||||||||||||
Other |
74 | 73 | 77 | 65 | 38 | |||||||||||||||
Total worldwide |
2,385 | 2,061 | 2,026 | 1,988 | 1,764 | |||||||||||||||
| (1) Net natural gas available for sale quantities are the volumes withdrawn from ExxonMobil’ s natural gas reserves, excluding royalties and volumes due to others when produced, and excluding gas purchased from others, gas consumed in producing operations, field processing plant losses, volumes used for gas lift, gas injection and cycling operations, quantities flared, and volume shrinkage due to the removal of condensate or natural gas liquids fractions. |
NATURAL GAS SALES ( 1 )
| (millions of cubic feet per day) | 2004 | 2003 | 2002 | 2001 | 2000 | |||||||||||||||
United States |
2,277 | 4,793 | 6,939 | 5,925 | 5,829 | |||||||||||||||
Canada |
1,253 | 1,919 | 2,051 | 2,305 | 2,324 | |||||||||||||||
Europe |
6,262 | 6,610 | 7,544 | 7,570 | 7,213 | |||||||||||||||
Asia Pacific |
1,448 | 1,708 | 1,907 | 1,472 | 1,683 | |||||||||||||||
Middle East |
525 | 384 | 334 | 308 | 235 | |||||||||||||||
Other |
177 | 181 | 188 | 205 | 160 | |||||||||||||||
Total worldwide |
11,942 | 15,595 | 18,963 | 17,785 | 17,444 | |||||||||||||||
| (1) Natural gas sales include 100 percent of the sales of ExxonMobil and majority-owned affiliates and ExxonMobil’ s ownership of sales by companies owned 50 percent or less. Numbers include sales of gas purchased from third parties. |
2004 FINANCIAL & OPERATING REVIEW • EXXON MOBIL CORPORATION
58
NUMBER OF NET WELLS DRILLED ANNUALLY ( 1 )
| Productive | Dry | Total | ||||||||||||||||||||||||||||||||||||||||||||||||||||||||||
| (net wells drilled) | 2004 | 2003 | 2002 | 2001 | 2000 | 2004 | 2003 | 2002 | 2001 | 2000 | 2004 | 2003 | 2002 | 2001 | 2000 | |||||||||||||||||||||||||||||||||||||||||||||
Exploratory(2) |
21 | 38 | 46 | 51 | 62 | 15 | 28 | 23 | 41 | 26 | 36 | 66 | 69 | 92 | 88 | |||||||||||||||||||||||||||||||||||||||||||||
Development |
1,164 | 1,060 | 1,287 | 1,313 | 934 | 18 | 34 | 29 | 24 | 13 | 1,182 | 1,094 | 1,316 | 1,337 | 947 | |||||||||||||||||||||||||||||||||||||||||||||
Total |
1,185 | 1,098 | 1,333 | 1,364 | 996 | 33 | 62 | 52 | 65 | 39 | 1,218 | 1,160 | 1,385 | 1,429 | 1,035 | |||||||||||||||||||||||||||||||||||||||||||||
NET ACREAGE AT YEAR END ( 3 )
| Undeveloped | Developed | |||||||||||||||||||||||||||||||||||||||
| (thousands of net acres) | 2004 | 2003 | 2002 | 2001 | 2000 | 2004 | 2003 | 2002 | 2001 | 2000 | ||||||||||||||||||||||||||||||
United States |
7,055 | 7,353 | 7,309 | 7,669 | 7,399 | 5,480 | 5,655 | 5,695 | 5,714 | 5,993 | ||||||||||||||||||||||||||||||
Canada(4) |
6,144 | 5,204 | 8,851 | 9,708 | 9,775 | 2,527 | 2,457 | 2,382 | 2,426 | 2,402 | ||||||||||||||||||||||||||||||
Europe |
2,245 | 2,611 | 2,687 | 4,624 | 6,244 | 4,715 | 4,746 | 4,874 | 4,819 | 4,816 | ||||||||||||||||||||||||||||||
Asia Pacific |
4,219 | 8,769 | 12,163 | 14,161 | 19,641 | 1,080 | 1,723 | 1,692 | 1,640 | 1,528 | ||||||||||||||||||||||||||||||
Africa |
21,797 | 11,447 | 12,205 | 15,736 | 20,111 | 475 | 462 | 685 | 630 | 387 | ||||||||||||||||||||||||||||||
Latin America |
19,688 | 15,141 | 17,459 | 19,205 | 25,122 | 388 | 388 | 387 | 388 | 363 | ||||||||||||||||||||||||||||||
Middle East |
46 | 10 | 10 | 10 | — | 1,356 | 1,356 | 1,354 | 1,354 | 1,354 | ||||||||||||||||||||||||||||||
Other |
476 | 516 | 543 | 1,241 | 1,241 | 103 | 103 | 104 | 104 | 104 | ||||||||||||||||||||||||||||||
Total worldwide |
61,670 | 51,051 | 61,227 | 72,354 | 89,533 | 16,124 | 16,890 | 17,173 | 17,075 | 16,947 | ||||||||||||||||||||||||||||||
NET CAPITALIZED COSTS AT YEAR END ( 3 )
| (millions of dollars) | 2004 | 2003 | 2002 | 2001 | 2000 | |||||||||||||||
United States |
16,217 | 16,711 | 15,739 | 15,408 | 14,887 | |||||||||||||||
Canada(4) |
8,907 | 8,114 | 6,114 | 5,772 | 5,827 | |||||||||||||||
Europe |
16,169 | 15,830 | 12,872 | 10,704 | 11,361 | |||||||||||||||
Asia Pacific |
6,496 | 6,888 | 5,702 | 5,207 | 5,274 | |||||||||||||||
Africa |
10,706 | 8,606 | 5,755 | 4,355 | 3,711 | |||||||||||||||
Middle East |
1,063 | 738 | 641 | 415 | 452 | |||||||||||||||
Other |
5,689 | 4,659 | 3,936 | 3,601 | 3,410 | |||||||||||||||
Total worldwide |
65,247 | 61,546 | 50,759 | 45,462 | 44,922 | |||||||||||||||
COSTS INCURRED IN PROPERTY ACQUISITION, EXPLORATION, AND DEVELOPMENT ACTIVITIES ( 3 )
| (millions of dollars) | United States | Canada(4) | Europe | Asia Pacific | Africa | Middle East | Other | Worldwide | ||||||||||||||||||||||||
During 2004 |
||||||||||||||||||||||||||||||||
Property acquisition costs |
14 | 1 | — | 2 | 92 | — | 25 | 134 | ||||||||||||||||||||||||
Exploration costs |
233 | 80 | 143 | 113 | 382 | 64 | 240 | 1,255 | ||||||||||||||||||||||||
Development costs |
1,581 | 1,196 | 1,381 | 660 | 2,788 | 362 | 1,154 | 9,122 | ||||||||||||||||||||||||
Total |
1,828 | 1,277 | 1,524 | 775 | 3,262 | 426 | 1,419 | 10,511 | ||||||||||||||||||||||||
During
2003(5) |
||||||||||||||||||||||||||||||||
Property acquisition costs |
17 | 7 | 4 | — | 17 | — | — | 45 | ||||||||||||||||||||||||
Exploration costs |
253 | 102 | 171 | 138 | 264 | 40 | 213 | 1,181 | ||||||||||||||||||||||||
Development costs |
1,780 | 1,079 | 1,968 | 929 | 3,117 | 208 | 775 | 9,856 | ||||||||||||||||||||||||
Total |
2,050 | 1,188 | 2,143 | 1,067 | 3,398 | 248 | 988 | 11,082 | ||||||||||||||||||||||||
During 2002 |
||||||||||||||||||||||||||||||||
Property acquisition costs |
32 | 20 | — | — | 10 | — | 125 | 187 | ||||||||||||||||||||||||
Exploration costs |
281 | 109 | 160 | 95 | 301 | 18 | 199 | 1,163 | ||||||||||||||||||||||||
Development costs |
1,843 | 949 | 1,975 | 936 | 1,708 | 144 | 546 | 8,101 | ||||||||||||||||||||||||
Total |
2,156 | 1,078 | 2,135 | 1,031 | 2,019 | 162 | 870 | 9,451 | ||||||||||||||||||||||||
During 2001
|
||||||||||||||||||||||||||||||||
Property acquisition costs |
95 | 17 | 1 | (1 | ) | 2 | 1 | 9 | 124 | |||||||||||||||||||||||
Exploration costs |
356 | 141 | 165 | 148 | 281 | 26 | 443 | 1,560 | ||||||||||||||||||||||||
Development costs |
1,816 | 798 | 1,619 | 666 | 995 | 32 | 327 | 6,253 | ||||||||||||||||||||||||
Total |
2,267 | 956 | 1,785 | 813 | 1,278 | 59 | 779 | 7,937 | ||||||||||||||||||||||||
| (1) A regional breakout of this data is included on page 11 of ExxonMobil’s 2004 Form 10-K. |
| (2) These include near-field and appraisal wells classified as exploratory for SEC reporting. |
| (3) Includes non-consolidated interests and Canadian tar sands operations and is not directly comparable to data on pages A56 and A57 of ExxonMobil’s 2005 Proxy Statement, and page 5 of ExxonMobil’s 2004 Form 10-K, which due to financial reporting requirements, treat Canadian tar sands as a mining operation. |
| (4) Canadian tar sands data included above: net acreage of 28,000 developed acres and 147,000 undeveloped acres at year-end 2004, net capitalized cost of about $2.3 billion at yearend 2004, exploration costs of $12 million, and development costs of $502 million incurred during 2004. |
| (5) Per FAS 143, development costs beginning in 2003 also include new asset retirement obligations established in the current year, as well as increases or decreases to the asset retirement obligation resulting from changes in cost estimates or abandonment date. |
EXXON MOBIL CORPORATION • 2004 FINANCIAL & OPERATING REVIEW
UPSTREAM 59
PROVED OIL AND GAS RESERVES ( 1 )
The Corporation is also stating, for the first time, its 2004 reserves on the basis of December 31, 2004, prices and costs.
The use of year-end prices for reserves estimation introduces short-term price volatility into the process since annual adjustments will be required based on prices occurring on a single day. The Corporation believes that this approach is inconsistent with the long-term nature of the upstream business where production from individual projects often spans multiple decades. The use of prices from a single date is not relevant to the investment decisions made by the Corporation and annual variations in reserves based on such year-end prices are not of consequence to how the business is actually managed.
Performance-related revisions can include upward or downward changes in previously estimated volumes of proved reserves for existing fields due to the evaluation or re-evaluation of: (1) already available geologic, reservoir or production data; or (2) new geologic, reservoir, or production data. This category can also include changes associated with the performance of improved recovery projects and significant changes in either development strategy or production equipment/facility capacity. During the past five years, performance-related revisions averaged 551 million oil-equivalent barrels per year.
| 2004 | 2003 | 2002 | 2001 | 2000 | ||||||||||||||||
Liquids, Including Tar Sands and Non-Consolidated Reserves |
||||||||||||||||||||
(millions of barrels at year end) |
||||||||||||||||||||
Net proved developed and undeveloped reserves |
||||||||||||||||||||
United States |
2,894 | 3,218 | 3,352 | 3,494 | 3,480 | |||||||||||||||
Canada(1) |
1,848 | 1,975 | 2,085 | 2,098 | 1,940 | |||||||||||||||
Europe |
1,029 | 1,204 | 1,359 | 1,503 | 1,591 | |||||||||||||||
Asia Pacific |
613 | 684 | 691 | 622 | 690 | |||||||||||||||
Africa |
2,654 | 2,742 | 2,626 | 2,461 | 2,384 | |||||||||||||||
Middle East |
1,216 | 833 | 803 | 788 | 756 | |||||||||||||||
Other |
2,259 | 2,200 | 1,707 | 1,346 | 1,330 | |||||||||||||||
Total worldwide excluding
year-end price/cost revisions |
12,513 | 12,856 | 12,623 | 12,312 | 12,171 | |||||||||||||||
Year-end price/cost revisions |
(862 | ) | — | — | — | — | ||||||||||||||
Total worldwide |
11,651 | 12,856 | 12,623 | 12,312 | 12,171 | |||||||||||||||
Proportional interest in tar sands and non-consolidated
reserves included above, excluding year-end price/cost revisions |
||||||||||||||||||||
United States |
402 | 426 | 444 | 466 | 494 | |||||||||||||||
Canada (tar sands)(2) |
757 | 781 | 800 | 821 | 610 | |||||||||||||||
Europe |
17 | 20 | 26 | 27 | 33 | |||||||||||||||
Middle East |
1,161 | 767 | 779 | 758 | 726 | |||||||||||||||
Other |
981 | 973 | 949 | 688 | 658 | |||||||||||||||
Net proved developed reserves included above |
||||||||||||||||||||
United States |
2,551 | 2,711 | 2,835 | 2,957 | 3,042 | |||||||||||||||
Canada(1) |
1,089 | 1,301 | 1,255 | 1,184 | 1,240 | |||||||||||||||
Europe |
778 | 821 | 817 | 900 | 999 | |||||||||||||||
Asia Pacific |
394 | 473 | 487 | 477 | 504 | |||||||||||||||
Africa |
1,117 | 1,107 | 1,057 | 1,022 | 989 | |||||||||||||||
Middle East |
651 | 632 | 675 | 716 | 755 | |||||||||||||||
Other |
763 | 678 | 645 | 547 | 419 | |||||||||||||||
Total worldwide |
7,343 | 7,723 | 7,771 | 7,803 | 7,948 | |||||||||||||||
Natural
Gas, Including Non-Consolidated Reserves
|
||||||||||||||||||||
(billions of cubic feet at year end)
|
||||||||||||||||||||
Net proved developed and undeveloped reserves |
||||||||||||||||||||
United States |
10,578 | 11,424 | 12,239 | 12,924 | 13,296 | |||||||||||||||
Canada |
1,979 | 2,341 | 2,882 | 3,183 | 3,516 | |||||||||||||||
Europe |
21,916 | 23,849 | 24,336 | 25,252 | 26,017 | |||||||||||||||
Asia Pacific |
6,029 | 7,285 | 7,958 | 8,301 | 8,546 | |||||||||||||||
Africa |
771 | 583 | 436 | 379 | 375 | |||||||||||||||
Middle East |
14,122 | 6,921 | 5,722 | 4,275 | 2,595 | |||||||||||||||
Other |
2,545 | 2,366 | 2,145 | 1,632 | 1,521 | |||||||||||||||
Total worldwide excluding
year-end price/cost revisions |
57,940 | 54,769 | 55,718 | 55,946 | 55,866 | |||||||||||||||
Year-end price/cost revisions |
2,422 | — | — | — | — | |||||||||||||||
Total worldwide |
60,362 | 54,769 | 55,718 | 55,946 | 55,866 | |||||||||||||||
Proportional interest non-consolidated reserves included above,
excluding year-end price/cost revisions |
||||||||||||||||||||
United States |
140 | 152 | 177 | 192 | 251 | |||||||||||||||
Europe |
12,873 | 13,703 | 13,828 | 14,321 | 14,847 | |||||||||||||||
Middle East |
13,339 | 6,055 | 5,692 | 4,237 | 2,548 | |||||||||||||||
Other |
1,473 | 1,464 | 1,440 | 942 | 901 | |||||||||||||||
Net proved developed reserves included above |
||||||||||||||||||||
United States |
9,254 | 9,637 | 10,128 | 10,511 | 11,118 | |||||||||||||||
Canada |
1,647 | 1,962 | 2,294 | 2,517 | 2,850 | |||||||||||||||
Europe |
16,881 | 14,966 | 12,928 | 13,641 | 14,325 | |||||||||||||||
Asia Pacific |
4,428 | 5,764 | 5,887 | 6,005 | 6,300 | |||||||||||||||
Africa |
279 | 155 | 112 | 122 | 125 | |||||||||||||||
Middle East |
4,590 | 2,710 | 2,388 | 2,389 | 2,595 | |||||||||||||||
Other |
1,120 | 1,040 | 1,006 | 837 | 704 | |||||||||||||||
Total worldwide |
38,199 | 36,234 | 34,743 | 36,022 | 38,017 | |||||||||||||||
| (1) See Frequently Used Terms on pages 88 through 91. |
| (2) Includes proven reserves from Canadian tar sands operations in Canada and, therefore, is not directly comparable to data shown on pages A59 to A61 of ExxonMobil’s 2005 Proxy Statement, which due to financial reporting requirements, treat Canadian tar sands as a mining operation. |
2004 FINANCIAL & OPERATING REVIEW • EXXON MOBIL CORPORATION
60
PROVED OIL AND GAS RESERVES REPLACEMENT ( 1 )
| Average | ||||||||||||||||||||||||
| 2004 | 2003 | 2002 | 2001 | 2000 | 2000-2004 | |||||||||||||||||||
Liquids(millions of barrels) |
||||||||||||||||||||||||
Performance-related revisions |
97 | 375 | 355 | 264 | 628 | 344 | ||||||||||||||||||
Improved recovery |
22 | 111 | 94 | 121 | 123 | 94 | ||||||||||||||||||
Extensions/discoveries |
595 | 674 | 777 | 683 | 517 | 649 | ||||||||||||||||||
Purchases |
10 | 1 | — | — | — | 2 | ||||||||||||||||||
Sales |
(132 | ) | (16 | ) | (13 | ) | (9 | ) | (6 | ) | (35 | ) | ||||||||||||
Total additions before year-end price/cost revisions |
592 | 1,145 | 1,213 | 1,059 | 1,262 | 1,054 | ||||||||||||||||||
Year-end price/cost revisions |
(862 | ) | NA | NA | NA | NA | NA | |||||||||||||||||
Total additions |
(270 | ) | NA | NA | NA | NA | NA | |||||||||||||||||
Production |
935 | 912 | 902 | 918 | 928 | 919 | ||||||||||||||||||
Reserves replacement ratio, excluding sales(2)(percent) |
77 | 127 | 136 | 116 | 137 | 119 | ||||||||||||||||||
Reserves
replacement ratio, including sales(2)(percent) |
63 | 126 | 134 | 115 | 136 | 115 | ||||||||||||||||||
Reserves
replacement ratio, including sales
and year-end price/cost revisions(percent) |
— | NA | NA | NA | NA | NA | ||||||||||||||||||
Natural Gas(billions of cubic feet)
|
||||||||||||||||||||||||
Performance-related revisions |
256 | 1,462 | 1,447 | 836 | 2,207 | 1,242 | ||||||||||||||||||
Improved recovery |
37 | 25 | 4 | 39 | 166 | 54 | ||||||||||||||||||
Extensions/discoveries |
7,282 | 1,719 | 2,597 | 3,431 | 873 | 3,181 | ||||||||||||||||||
Purchases |
9 | 10 | 2 | 1 | 10 | 6 | ||||||||||||||||||
Sales |
(477 | ) | (120 | ) | (43 | ) | (69 | ) | (8 | ) | (143 | ) | ||||||||||||
Total additions before year-end price/cost revisions |
7,107 | 3,096 | 4,007 | 4,238 | 3,248 | 4,340 | ||||||||||||||||||
Year-end price/cost revisions |
2,422 | NA | NA | NA | NA | NA | ||||||||||||||||||
Total additions |
9,529 | NA | NA | NA | NA | NA | ||||||||||||||||||
Production |
3,936 | 4,045 | 4,235 | 4,158 | 4,178 | 4,110 | ||||||||||||||||||
Reserves replacement ratio, excluding sales(2)(percent) |
193 | 80 | 96 | 104 | 78 | 109 | ||||||||||||||||||
Reserves
replacement ratio, including sales(2)(percent) |
181 | 77 | 95 | 102 | 78 | 106 | ||||||||||||||||||
Reserves
replacement ratio, including sales
and year-end price/cost revisions(percent) |
242 | NA | NA | NA | NA | NA | ||||||||||||||||||
Oil-Equivalent (millions of barrels) |
||||||||||||||||||||||||
Performance-related revisions |
140 | 619 | 597 | 403 | 996 | 551 | ||||||||||||||||||
Improved recovery |
28 | 116 | 95 | 127 | 151 | 103 | ||||||||||||||||||
Extensions/discoveries |
1,809 | 961 | 1,210 | 1,255 | 662 | 1,180 | ||||||||||||||||||
Purchases |
11 | 2 | — | — | 2 | 3 | ||||||||||||||||||
Sales |
(211 | ) | (36 | ) | (21 | ) | (20 | ) | (8 | ) | (59 | ) | ||||||||||||
Total additions before year-end price/cost revisions |
1,777 | 1,662 | 1,881 | 1,765 | 1,803 | 1,778 | ||||||||||||||||||
Year-end price/cost revisions |
(459 | ) | NA | NA | NA | NA | NA | |||||||||||||||||
Total additions |
1,318 | NA | NA | NA | NA | NA | ||||||||||||||||||
Production |
1,591 | 1,587 | 1,608 | 1,611 | 1,624 | 1,604 | ||||||||||||||||||
Reserves replacement ratio, excluding sales(2)(percent) |
125 | 107 | 118 | 111 | 112 | 115 | ||||||||||||||||||
Reserves
replacement ratio, including sales(2)(percent) |
112 | 105 | 117 | 110 | 111 | 111 | ||||||||||||||||||
Reserves
replacement ratio, including sales
and year-end price/cost revisions(percent) |
83 | NA | NA | NA | NA | NA | ||||||||||||||||||
2004 Reserves Changes by Region
| Crude Oil and Natural Gas Liquids (millions of barrels) | Natural Gas (billions of cubic feet) | |||||||||||||||||||||||||||||||||||||||||||||||||||||||||||||||
| United | Asia | Middle | United | Asia | Middle | |||||||||||||||||||||||||||||||||||||||||||||||||||||||||||
| States | Canada | Europe | Pacific | Africa | East | Other | Total | States | Canada | Europe | Pacific | Africa | East | Other | Total | |||||||||||||||||||||||||||||||||||||||||||||||||
Performance-related revisions |
(49 | ) | 2 | 35 | 17 | (39 | ) | 21 | 110 | 97 | 26 | 19 | (290 | ) | (375 | ) | 165 | 455 | 256 | 256 | ||||||||||||||||||||||||||||||||||||||||||||
Improved recovery |
22 | — | — | — | — | — | — | 22 | 6 | — | 31 | — | — | — | — | 37 | ||||||||||||||||||||||||||||||||||||||||||||||||
Extensions/discoveries |
15 | 4 | 3 | 2 | 150 | 419 | 2 | 595 | 121 | 36 | 48 | 44 | 39 | 6,991 | 3 | 7,282 | ||||||||||||||||||||||||||||||||||||||||||||||||
Purchases |
— | — | — | — | 10 | — | — | 10 | — | — | — | — | 9 | — | — | 9 | ||||||||||||||||||||||||||||||||||||||||||||||||
Sales |
(113 | ) | (3 | ) | — | (16 | ) | — | — | — | (132 | ) | (141 | ) | (18 | ) | (17 | ) | (301 | ) | — | — | — | (477 | ) | |||||||||||||||||||||||||||||||||||||||
Total additions before year-
end price/cost revisions |
(125 | ) | 3 | 38 | 3 | 121 | 440 | 112 | 592 | 12 | 37 | (228 | ) | (632 | ) | 213 | 7,446 | 259 | 7,107 | |||||||||||||||||||||||||||||||||||||||||||||
Year-end price/cost revisions |
101 | (464 | ) | 2 | (12 | ) | (210 | ) | 3 | (282 | ) | (862 | ) | 1,891 | (96 | ) | 826 | (110 | ) | — | 18 | (107 | ) | 2,422 | ||||||||||||||||||||||||||||||||||||||||
Total additions |
(24 | ) | (461 | ) | 40 | (9 | ) | (89 | ) | 443 | (170 | ) | (270 | ) | 1,903 | (59 | ) | 598 | (742 | ) | 213 | 7,464 | 152 | 9,529 | ||||||||||||||||||||||||||||||||||||||||
Production |
198 | 130 | 213 | 74 | 209 | 58 | 53 | 935 | 859 | 399 | 1,705 | 624 | 25 | 244 | 80 | 3,936 | ||||||||||||||||||||||||||||||||||||||||||||||||
Net change |
(222 | ) | (591 | ) | (173 | ) | (83 | ) | (298 | ) | 385 | (223 | ) | (1,205 | ) | 1,044 | (458 | ) | (1,107 | ) | (1,366 | ) | 188 | 7,220 | 72 | 5,593 | ||||||||||||||||||||||||||||||||||||||
Reserves replacement ratio,
excluding sales(2)(percent) |
— | 5 | 18 | 26 | 58 | 759 | 211 | 77 | 18 | 14 | — | — | 852 | 3,052 | 324 | 193 | ||||||||||||||||||||||||||||||||||||||||||||||||
Reserves replacement ratio,
including sales(2)(percent) |
— | 2 | 18 | 4 | 58 | 759 | 211 | 63 | 1 | 9 | — | — | 852 | 3,052 | 324 | 181 | ||||||||||||||||||||||||||||||||||||||||||||||||
Reserves
replacement ratio, including
sales and year-end price/cost
revisions(percent) |
— | — | 19 | — | — | 764 | — | — | 222 | — | 35 | — | 852 | 3,059 | 190 | 242 | ||||||||||||||||||||||||||||||||||||||||||||||||
| (1) The data shown above and on the facing page include reserves, production, and costs from Canadian tar sands operations. This is a more complete summary of ExxonMobil’s exploration and production operations than the data on pages A59 to A61 of ExxonMobil’s 2005 Proxy Statement, which due to financial reporting requirements, treat Canadian tar sands as a mining operation. See Frequently Used Terms on pages 88 through 91 for definitions of reserves and reserves replacement ratio. |
| (2) Excluding year-end revisions associated with using December 31, 2004, prices and costs. |
EXXON MOBIL CORPORATION • 2004 FINANCIAL & OPERATING REVIEW
U p s t r e a m 61
PROVED OIL AND GAS RESERVES REPLACEMENT – Units are million barrels of oil or billion cubic feet of gas unless specified otherwise
| Average | ||||||||||||||||||||||||
| 2004 | 2003 | 2002 | 2001 | 2000 | 2000-2004 | |||||||||||||||||||
Non-U.S. |
||||||||||||||||||||||||
E&P costs (millions of dollars) |
8,683 | 9,032 | 7,295 | 5,670 | 4,466 | 7,029 | ||||||||||||||||||
Oil reserves additions |
(246 | ) | 1,063 | 1,116 | 795 | 805 | 707 | |||||||||||||||||
Oil production |
737 | 695 | 663 | 668 | 666 | 686 | ||||||||||||||||||
Gas reserves additions |
7,626 | 2,900 | 3,635 | 3,477 | 2,004 | 3,928 | ||||||||||||||||||
Gas production |
3,077 | 3,034 | 3,177 | 3,026 | 3,003 | 3,063 | ||||||||||||||||||
Oil-equivalent reserves additions, excluding sales(1) |
1,974 | 1,554 | 1,722 | 1,375 | 1,145 | 1,554 | ||||||||||||||||||
Oil-equivalent reserves additions, including sales(1) |
1,900 | 1,547 | 1,722 | 1,374 | 1,139 | 1,537 | ||||||||||||||||||
Oil-equivalent reserves additions,
including sales and price/cost revisions |
1,025 | NA | NA | NA | NA | NA | ||||||||||||||||||
Oil-equivalent production |
1,250 | 1,201 | 1,193 | 1,172 | 1,166 | 1,196 | ||||||||||||||||||
Reserves replacement ratio, excluding sales(1)(percent) |
158 | 129 | 144 | 117 | 98 | 130 | ||||||||||||||||||
Reserves replacement ratio, including sales(1)(percent) |
152 | 129 | 144 | 117 | 98 | 129 | ||||||||||||||||||
Reserves replacement ratio, including sales
and year-end price/cost revisions (percent) |
82 | NA | NA | NA | NA | NA | ||||||||||||||||||
Reserves replacement costs(2) (dollars per barrel) |
4.40 | 5.81 | 4.24 | 4.12 | 3.90 | 4.52 | ||||||||||||||||||
United States |
||||||||||||||||||||||||
E&P costs (millions of dollars) |
1,828 | 2,050 | 2,156 | 2,267 | 1,682 | 1,997 | ||||||||||||||||||
Oil reserves additions |
(24 | ) | 82 | 97 | 264 | 457 | 175 | |||||||||||||||||
Oil production |
198 | 217 | 239 | 250 | 262 | 233 | ||||||||||||||||||
Gas reserves additions |
1,903 | 196 | 372 | 761 | 1,244 | 895 | ||||||||||||||||||
Gas production |
859 | 1,011 | 1,058 | 1,132 | 1,175 | 1,047 | ||||||||||||||||||
Oil-equivalent reserves additions, excluding sales(1) |
14 | 144 | 180 | 410 | 666 | 283 | ||||||||||||||||||
Oil-equivalent reserves additions, including sales(1) |
(123 | ) | 115 | 159 | 391 | 664 | 241 | |||||||||||||||||
Oil-equivalent reserves additions, including sales
and year-end price/cost revisions |
293 | NA | NA | NA | NA | NA | ||||||||||||||||||
Oil-equivalent production |
341 | 386 | 415 | 439 | 458 | 408 | ||||||||||||||||||
Reserves replacement ratio, excluding sales(1)(percent) |
4 | 37 | 43 | 93 | 145 | 69 | ||||||||||||||||||
Reserves replacement ratio, including sales(1)(percent) |
– | 30 | 38 | 89 | 145 | 59 | ||||||||||||||||||
Reserves replacement ratio, including sales
and year-end price/cost revisions (percent) |
86 | NA | NA | NA | NA | NA | ||||||||||||||||||
Reserves replacement costs(2) (dollars per barrel) |
130.57 | 14.24 | 11.98 | 5.53 | 2.53 | 7.06 | ||||||||||||||||||
Worldwide |
||||||||||||||||||||||||
E&P costs (millions of dollars) |
10,511 | 11,082 | 9,451 | 7,937 | 6,148 | 9,026 | ||||||||||||||||||
Oil reserves additions |
(270 | ) | 1,145 | 1,213 | 1,059 | 1,262 | 882 | |||||||||||||||||
Oil production |
935 | 912 | 902 | 918 | 928 | 919 | ||||||||||||||||||
Gas reserves additions |
9,529 | 3,096 | 4,007 | 4,238 | 3,248 | 4,823 | ||||||||||||||||||
Gas production |
3,936 | 4,045 | 4,235 | 4,158 | 4,178 | 4,110 | ||||||||||||||||||
Oil-equivalent reserves additions, excluding sales(1) |
1,988 | 1,698 | 1,902 | 1,785 | 1,811 | 1,837 | ||||||||||||||||||
Oil-equivalent reserves additions, including sales(1) |
1,777 | 1,662 | 1,881 | 1,765 | 1,803 | 1,778 | ||||||||||||||||||
Oil-equivalent reserves additions,
including sales and price/cost revisions |
1,318 | NA | NA | NA | NA | NA | ||||||||||||||||||
Oil-equivalent production |
1,591 | 1,587 | 1,608 | 1,611 | 1,624 | 1,604 | ||||||||||||||||||
Reserves replacement ratio, excluding sales(1)(percent) |
125 | 107 | 118 | 111 | 112 | 115 | ||||||||||||||||||
Reserves replacement ratio, including sales(1)(percent) |
112 | 105 | 117 | 110 | 111 | 111 | ||||||||||||||||||
Reserves replacement ratio, including sales
and year-end price/cost revisions (percent) |
83 | NA | NA | NA | NA | NA | ||||||||||||||||||
Reserves replacement costs(2) (dollars per barrel) |
5.29 | 6.53 | 4.97 | 4.45 | 3.39 | 4.91 | ||||||||||||||||||
| (1) Excluding year-end revisions associated with using December 31, 2004, prices and costs. See Frequently Used Terms on pages 88 through 91 for definitions of reserves and reserves replacement ratio. |
| (2) Calculation based on exploration and production costs divided by oil-equivalent reserves additions. All values exclude the impact of asset sales; i.e., reserves sold and proceeds received; and price/cost related revisions associated with using December 31, 2004, prices and costs. See Frequently Used Terms for definition of reserves replacement costs. |
2004 FINANCIAL & OPERATING REVIEW • EXXON MOBIL CORPORATION
62
OIL AND GAS EXPLORATION AND PRODUCTION EARNINGS
The revenue, cost, and earnings data are shown both on a total dollar and unit basis, and are inclusive of non-consolidated and Canadian tar sands operations. They are not directly comparable to the data on pages A54 and A55 of ExxonMobil’s 2005 Proxy Statement, which due to financial reporting requirements, treat Canadian tar sands as a mining operation. The data displayed here provide a more complete summary of ExxonMobil’s exploration and production operations.
| Total Revenues and Costs, Including Non-Consolidated Interests and Tar Sands | Revenues and Costs per Unit of Sales or Production(1) | |||||||||||||||||||||||||||||||||||||||||||||||
| United | Asia | Middle | United | Outside North | ||||||||||||||||||||||||||||||||||||||||||||
| States | Canada | Europe | Pacific | Africa | East | Other | Total | States | Canada | America | Worldwide | |||||||||||||||||||||||||||||||||||||
| 2004 | (millions of dollars) |
(dollars per unit of sales) | ||||||||||||||||||||||||||||||||||||||||||||||
Revenue |
||||||||||||||||||||||||||||||||||||||||||||||||
Crude oil and NGL |
7,119 | 4,148 | 7,647 | 2,920 | 7,301 | 2,151 | 1,523 | 32,809 | 34.92 | 31.92 | 35.51 | 34.88 | ||||||||||||||||||||||||||||||||||||
Natural gas |
3,943 | 1,860 | 7,642 | 1,895 | – | 734 | 58 | 16,132 | 5.53 | 5.23 | 4.06 | 4.47 | ||||||||||||||||||||||||||||||||||||
| (dollars per barrel of net oil-equivalent production) |
||||||||||||||||||||||||||||||||||||||||||||||||
Total revenue |
11,062 | 6,008 | 15,289 | 4,815 | 7,301 | 2,885 | 1,581 | 48,941 | 34.28 | 31.74 | 30.92 | 31.72 | ||||||||||||||||||||||||||||||||||||
Less costs: |
||||||||||||||||||||||||||||||||||||||||||||||||
Production costs
excluding taxes |
1,787 | 1,444 | 2,209 | 622 | 719 | 93 | 242 | 7,116 | 5.54 | 7.63 | 3.77 | 4.61 | ||||||||||||||||||||||||||||||||||||
Depreciation and depletion |
1,454 | 1,020 | 2,296 | 667 | 839 | 73 | 158 | 6,507 | 4.50 | 5.38 | 3.91 | 4.22 | ||||||||||||||||||||||||||||||||||||
Exploration expenses |
202 | 104 | 137 | 108 | 321 | 32 | 229 | 1,133 | 0.63 | 0.55 | 0.80 | 0.73 | ||||||||||||||||||||||||||||||||||||
Taxes other than income |
571 | 52 | 1,747 | 633 | 722 | 1,069 | 45 | 4,839 | 1.77 | 0.28 | 4.09 | 3.14 | ||||||||||||||||||||||||||||||||||||
Related income tax |
2,546 | 1,147 | 4,971 | 1,022 | 2,789 | 924 | 301 | 13,700 | 7.89 | 6.06 | 9.71 | 8.88 | ||||||||||||||||||||||||||||||||||||
Results of
producing activities |
4,502 | 2,241 | 3,929 | 1,763 | 1,911 | 694 | 606 | 15,646 | 13.95 | 11.84 | 8.64 | 10.14 | ||||||||||||||||||||||||||||||||||||
Other earnings(2) |
458 | (313 | ) | 459 | (27 | ) | 201 | (59 | ) | 7 | 726 | 1.42 | (1.65 | ) | 0.56 | 0.47 | ||||||||||||||||||||||||||||||||
Total earnings, excluding
power and coal |
4,960 | 1,928 | 4,388 | 1,736 | 2,112 | 635 | 613 | 16,372 | 15.37 | 10.19 | 9.20 | 10.61 | ||||||||||||||||||||||||||||||||||||
Power and coal |
(12 | ) | – | – | 315 | – | – | – | 303 | |||||||||||||||||||||||||||||||||||||||
Total earnings |
4,948 | 1,928 | 4,388 | 2,051 | 2,112 | 635 | 613 | 16,675 | ||||||||||||||||||||||||||||||||||||||||
| 2003 | (millions of dollars) |
(dollars per unit of sales) |
||||||||||||||||||||||||||||||||||||||||||||||
Revenue |
||||||||||||||||||||||||||||||||||||||||||||||||
Crude oil and NGL |
5,785 | 3,307 | 5,683 | 2,484 | 4,499 | 1,530 | 1,081 | 24,369 | 26.00 | 24.80 | 27.47 | 26.72 | ||||||||||||||||||||||||||||||||||||
Natural gas |
4,152 | 1,587 | 6,720 | 1,869 | – | 473 | 54 | 14,855 | 5.07 | 4.61 | 3.60 | 4.02 | ||||||||||||||||||||||||||||||||||||
| (dollars per barrel of net oil-equivalent production) |
||||||||||||||||||||||||||||||||||||||||||||||||
Total revenue |
9,937 | 4,894 | 12,403 | 4,353 | 4,499 | 2,003 | 1,135 | 39,224 | 27.67 | 25.75 | 24.77 | 25.57 | ||||||||||||||||||||||||||||||||||||
Less costs: |
||||||||||||||||||||||||||||||||||||||||||||||||
Production costs
excluding taxes |
1,780 | 1,372 | 1,951 | 558 | 564 | 94 | 217 | 6,536 | 4.96 | 7.22 | 3.44 | 4.26 | ||||||||||||||||||||||||||||||||||||
Depreciation and depletion |
1,574 | 821 | 1,997 | 727 | 459 | 70 | 154 | 5,802 | 4.37 | 4.32 | 3.46 | 3.78 | ||||||||||||||||||||||||||||||||||||
Exploration expenses |
257 | 92 | 166 | 146 | 217 | 33 | 122 | 1,033 | 0.72 | 0.48 | 0.69 | 0.67 | ||||||||||||||||||||||||||||||||||||
Taxes other than income |
554 | 42 | 1,594 | 447 | 528 | 707 | 44 | 3,916 | 1.54 | 0.22 | 3.37 | 2.55 | ||||||||||||||||||||||||||||||||||||
Related income tax |
2,017 | 808 | 3,420 | 1,046 | 1,496 | 624 | 171 | 9,582 | 5.62 | 4.25 | 6.86 | 6.25 | ||||||||||||||||||||||||||||||||||||
Results of
producing activities |
3,755 | 1,759 | 3,275 | 1,429 | 1,235 | 475 | 427 | 12,355 | 10.46 | 9.26 | 6.95 | 8.06 | ||||||||||||||||||||||||||||||||||||
Other earnings(2) |
149 | (246 | ) | 1,977 | 2 | 14 | (66 | ) | 5 | 1,835 | 0.41 | (1.30 | ) | 1.96 | 1.19 | |||||||||||||||||||||||||||||||||
Total earnings, excluding
power and coal |
3,904 | 1,513 | 5,252 | 1,431 | 1,249 | 409 | 432 | 14,190 | 10.87 | 7.96 | 8.91 | 9.25 | ||||||||||||||||||||||||||||||||||||
Power and coal |
1 | – | – | 311 | – | – | – | 312 | ||||||||||||||||||||||||||||||||||||||||
Total earnings |
3,905 | 1,513 | 5,252 | 1,742 | 1,249 | 409 | 432 | 14,502 | ||||||||||||||||||||||||||||||||||||||||
| (1) The per unit data is divided into two separate sections: (a) revenue per unit of sales from ExxonMobil’s own production; and, (b) operating costs and earnings per unit of net oil-equivalent production. Units for crude oil and natural gas liquids (NGL) are barrels, while units for natural gas are thousands of cubic feet. The volumes of crude oil and natural gas liquids production and net natural gas production available for sale used in this calculation are shown on pages 56 and 57 of this document. The volumes of natural gas were converted to oil-equivalent barrels based on a conversion factor of 6 thousand cubic feet per barrel. |
| (2) Includes earnings related to transportation operations, LNG liquefaction and transportation operations, sale of third-party purchases, technical services agreements, other non-operating activities, and adjustments for minority interests. |
| (3) Other revenue includes carbon dioxide, helium, and sulfur. Revenue from these products has been included in “other earnings” beginning in 2002. |
EXXON MOBIL CORPORATION • 2004 FINANCIAL & OPERATING REVIEW
U p s t r e a m 63
Oil and Gas Exploration and Production Earnings (continued)
| Total Revenues and Costs, Including Non-Consolidated Interests and Tar Sands | Revenues and Costs per Unit of Sales or Production(1) | |||||||||||||||||||||||||||||||||||||||||||||||
| United | Asia | Middle | United | Outside North | ||||||||||||||||||||||||||||||||||||||||||||
| States | Canada | Europe | Pacific | Africa | East | Other | Total | States | Canada | America | Worldwide | |||||||||||||||||||||||||||||||||||||
| 2002 | (millions of dollars) |
(dollars per unit of sales) |
||||||||||||||||||||||||||||||||||||||||||||||
Revenue |
||||||||||||||||||||||||||||||||||||||||||||||||
Crude oil and NGL |
5,203 | 2,715 | 4,979 | 2,352 | 3,064 | 1,134 | 878 | 20,325 | 20.95 | 21.56 | 23.15 | 22.33 | ||||||||||||||||||||||||||||||||||||
Natural gas |
2,320 | 876 | 5,304 | 1,664 | – | 356 | 29 | 10,549 | 2.68 | 2.34 | 2.86 | 2.77 | ||||||||||||||||||||||||||||||||||||
| (dollars per barrel of net oil-equivalent production) |
||||||||||||||||||||||||||||||||||||||||||||||||
Total revenue |
7,523 | 3,591 | 10,283 | 4,016 | 3,064 | 1,490 | 907 | 30,874 | 19.14 | 18.94 | 20.49 | 19.96 | ||||||||||||||||||||||||||||||||||||
Less costs: |
||||||||||||||||||||||||||||||||||||||||||||||||
Production costs
excluding taxes |
1,675 | 1,010 | 1,674 | 592 | 455 | 91 | 211 | 5,708 | 4.26 | 5.33 | 3.13 | 3.69 | ||||||||||||||||||||||||||||||||||||
Depreciation and depletion |
1,644 | 716 | 1,869 | 651 | 354 | 62 | 173 | 5,469 | 4.19 | 3.77 | 3.22 | 3.54 | ||||||||||||||||||||||||||||||||||||
Exploration expenses |
222 | 66 | 133 | 101 | 177 | 21 | 237 | 957 | 0.56 | 0.35 | 0.69 | 0.62 | ||||||||||||||||||||||||||||||||||||
Taxes other than income |
477 | 33 | 1,007 | 403 | 345 | 479 | 39 | 2,783 | 1.21 | 0.17 | 2.36 | 1.80 | ||||||||||||||||||||||||||||||||||||
Related income tax |
1,153 | 566 | 2,828 | 939 | 972 | 466 | (99 | ) | 6,825 | 2.93 | 2.99 | 5.30 | 4.41 | |||||||||||||||||||||||||||||||||||
Results of
producing activities |
2,352 | 1,200 | 2,772 | 1,330 | 761 | 371 | 346 | 9,132 | 5.99 | 6.33 | 5.79 | 5.90 | ||||||||||||||||||||||||||||||||||||
Other earnings(2) |
165 | (202 | ) | 228 | (32 | ) | 76 | (77 | ) | 2 | 160 | 0.41 | (1.07 | ) | 0.20 | 0.10 | ||||||||||||||||||||||||||||||||
Total earnings, excluding
power and coal |
2,517 | 998 | 3,000 | 1,298 | 837 | 294 | 348 | 9,292 | 6.40 | 5.26 | 5.99 | 6.00 | ||||||||||||||||||||||||||||||||||||
Power and coal |
7 | – | – | 307 | – | – | (8 | ) | 306 | |||||||||||||||||||||||||||||||||||||||
Total earnings |
2,524 | 998 | 3,000 | 1,605 | 837 | 294 | 340 | 9,598 | ||||||||||||||||||||||||||||||||||||||||
| 2001 | (millions of dollars) |
(dollars per unit of sales) |
||||||||||||||||||||||||||||||||||||||||||||||
Revenue |
||||||||||||||||||||||||||||||||||||||||||||||||
Crude oil and NGL |
5,124 | 2,095 | 5,372 | 2,167 | 2,911 | 1,209 | 603 | 19,481 | 19.70 | 17.43 | 22.74 | 21.19 | ||||||||||||||||||||||||||||||||||||
Natural gas |
4,126 | 1,364 | 5,790 | 1,019 | – | 351 | 70 | 12,720 | 4.35 | 3.71 | 2.97 | 3.39 | ||||||||||||||||||||||||||||||||||||
Other(3) |
90 | 7 | 23 | – | – | – | 2 | 122 | ||||||||||||||||||||||||||||||||||||||||
| (dollars per barrel of net oil-equivalent production) |
||||||||||||||||||||||||||||||||||||||||||||||||
Total revenue |
9,340 | 3,466 | 11,185 | 3,186 | 2,911 | 1,560 | 675 | 32,323 | 22.35 | 19.05 | 20.47 | 20.81 | ||||||||||||||||||||||||||||||||||||
Less costs: |
||||||||||||||||||||||||||||||||||||||||||||||||
Production costs
excluding taxes |
1,650 | 884 | 1,613 | 549 | 414 | 130 | 211 | 5,451 | 3.95 | 4.86 | 3.06 | 3.51 | ||||||||||||||||||||||||||||||||||||
Depreciation and depletion |
1,522 | 602 | 1,781 | 557 | 318 | 55 | 180 | 5,015 | 3.64 | 3.31 | 3.03 | 3.22 | ||||||||||||||||||||||||||||||||||||
Exploration expenses |
216 | 109 | 128 | 103 | 217 | 19 | 399 | 1,191 | 0.52 | 0.60 | 0.91 | 0.77 | ||||||||||||||||||||||||||||||||||||
Taxes other than income |
567 | 56 | 1,178 | 410 | 375 | 419 | 30 | 3,035 | 1.36 | 0.31 | 2.53 | 1.96 | ||||||||||||||||||||||||||||||||||||
Related income tax |
1,957 | 603 | 3,079 | 622 | 1,023 | 564 | (137 | ) | 7,711 | 4.68 | 3.31 | 5.40 | 4.96 | |||||||||||||||||||||||||||||||||||
Results of
producing activities |
3,428 | 1,212 | 3,406 | 945 | 564 | 373 | (8 | ) | 9,920 | 8.20 | 6.66 | 5.54 | 6.39 | |||||||||||||||||||||||||||||||||||
Other earnings(2) |
504 | (151 | ) | 224 | (27 | ) | 32 | (43 | ) | (30 | ) | 509 | 1.21 | (0.83 | ) | 0.16 | 0.32 | |||||||||||||||||||||||||||||||
Total earnings, excluding
power and coal |
3,932 | 1,061 | 3,630 | 918 | 596 | 330 | (38 | ) | 10,429 | 9.41 | 5.83 | 5.70 | 6.71 | |||||||||||||||||||||||||||||||||||
Power and coal |
1 | – | – | 314 | – | – | (8 | ) | 307 | |||||||||||||||||||||||||||||||||||||||
Total earnings |
3,933 | 1,061 | 3,630 | 1,232 | 596 | 330 | (46 | ) | 10,736 | |||||||||||||||||||||||||||||||||||||||
| 2000 | (millions of dollars) |
(dollars per unit of sales) |
||||||||||||||||||||||||||||||||||||||||||||||
Revenue |
||||||||||||||||||||||||||||||||||||||||||||||||
Crude oil and NGL |
6,438 | 2,542 | 6,985 | 2,636 | 3,232 | 1,389 | 685 | 23,907 | 23.99 | 22.75 | 27.06 | 25.66 | ||||||||||||||||||||||||||||||||||||
Natural gas |
4,026 | 1,105 | 4,687 | 1,661 | – | 281 | 55 | 11,815 | 3.85 | 3.58 | 2.75 | 3.12 | ||||||||||||||||||||||||||||||||||||
Other(3) |
59 | 8 | 30 | – | – | – | – | 97 | ||||||||||||||||||||||||||||||||||||||||
| (dollars per barrel of net oil-equivalent production) |
||||||||||||||||||||||||||||||||||||||||||||||||
Total revenue |
10,523 | 3,655 | 11,702 | 4,297 | 3,232 | 1,670 | 740 | 35,819 | 23.78 | 22.46 | 22.54 | 22.88 | ||||||||||||||||||||||||||||||||||||
Less costs: |
||||||||||||||||||||||||||||||||||||||||||||||||
Production costs
excluding taxes |
1,526 | 818 | 1,829 | 543 | 400 | 101 | 204 | 5,421 | 3.45 | 5.03 | 3.20 | 3.46 | ||||||||||||||||||||||||||||||||||||
Depreciation and depletion |
1,545 | 616 | 2,060 | 556 | 340 | 67 | 147 | 5,331 | 3.49 | 3.78 | 3.30 | 3.41 | ||||||||||||||||||||||||||||||||||||
Exploration expenses |
145 | 81 | 156 | 164 | 196 | 13 | 199 | 954 | 0.33 | 0.50 | 0.76 | 0.61 | ||||||||||||||||||||||||||||||||||||
Taxes other than income |
655 | 35 | 841 | 506 | 446 | 457 | 43 | 2,983 | 1.48 | 0.21 | 2.39 | 1.90 | ||||||||||||||||||||||||||||||||||||
Related income tax |
2,419 | 820 | 3,662 | 1,005 | 1,093 | 639 | 45 | 9,683 | 5.47 | 5.04 | 6.71 | 6.19 | ||||||||||||||||||||||||||||||||||||
Results of
producing activities |
4,233 | 1,285 | 3,154 | 1,523 | 757 | 393 | 102 | 11,447 | 9.56 | 7.90 | 6.18 | 7.31 | ||||||||||||||||||||||||||||||||||||
Other earnings(2) |
312 | (155 | ) | 630 | 148 | 30 | (14 | ) | (29 | ) | 922 | 0.71 | (0.96 | ) | 0.79 | 0.59 | ||||||||||||||||||||||||||||||||
Total earnings, excluding
power and coal |
4,545 | 1,130 | 3,784 | 1,671 | 787 | 379 | 73 | 12,369 | 10.27 | 6.94 | 6.97 | 7.90 | ||||||||||||||||||||||||||||||||||||
Power and coal |
(3 | ) | – | – | 323 | – | – | (4 | ) | 316 | ||||||||||||||||||||||||||||||||||||||
Total earnings |
4,542 | 1,130 | 3,784 | 1,994 | 787 | 379 | 69 | 12,685 | ||||||||||||||||||||||||||||||||||||||||
2 0 0 4 F I N A N C I A L & O P E R A T I N G R E V I E W • E X X O N M O B I L C O R P O R A T I O N
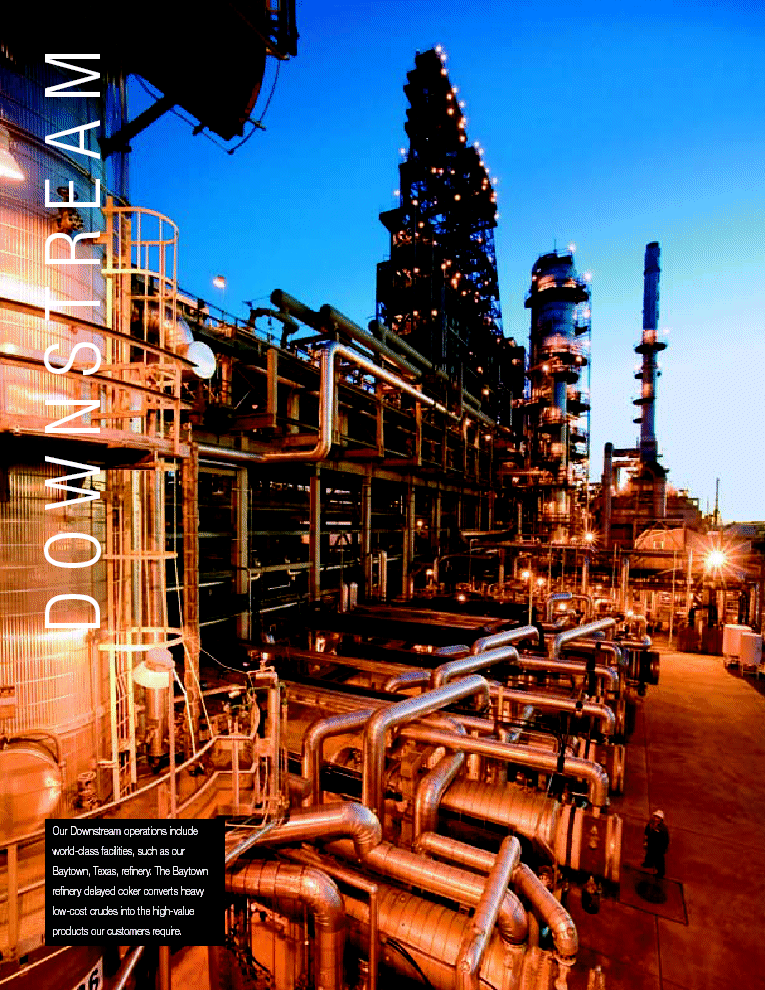
| M A E R T S N W O D Our Downstream operations include world-class facilities, such as our Baytown, Texas, refinery. The Baytown refinery delayed coker converts heavy low-cost crudes into the high-value products our customers require. |
65
Operating and capital discipline positions ExxonMobil’s Downstream as an industry leader, capable of outperforming the competition under a variety of market conditions.
Refining and Supply, Fuels Marketing, and Lubricants and Specialties
DOWNSTREAM STRATEGIES
ExxonMobil has refining operations in 25 countries, over 37,000 retail sites in more than 100 countries, and lubricants marketing in about 200 countries and territories. Our financial objectives in the Downstream can be summarized into three broad areas – margin enhancement, cost efficiency, and capital discipline. Delivering on these objectives enables us to create value for shareholders through industry-leading return on average capital employed. The key strategies we pursue to meet these objectives are:
| § | Maintain best-in-class operations, in all respects; | |||
| § | Provide quality, valued products and services to our customers; | |||
| § | Lead industry in efficiency and effectiveness; | |||
| § | Capitalize on integration with other ExxonMobil businesses; | |||
| § | Selectively invest for resilient, advantaged returns; and, | |||
| § | Maximize value from leading-edge technology. | |||
DOWNSTREAM RETURN ON AVERAGE CAPITAL EMPLOYED

| (1) | Royal Dutch Shell, BP, and ChevronTexaco values calculated on a consistent basis with ExxonMobil, based on public information. Competitor data estimated for 2004. |
2004 RESULTS AND HIGHLIGHTS
Continued leadership in safety, reliability, scale, and technology helped contribute to our best-ever financial and operating results.
Earnings increased 62 percent to $5.7 billion versus 2003.
More than $1.7 billion of pretax operating cost efficiencies and revenue enhancements were achieved.
We have delivered an average of $1.4 billion in pretax savings per year since 2000 through improvements that leverage our industry-leading proprietary technology, scale, and global functional organization.
Downstream capital expenditures were $2.4 billion in 2004, down 14 percent versus 2003, reflecting the completion of many low-sulfur fuel projects.
Downstream return on average capital employed was 21 percent, up from 13 percent in 2003, aided by stronger industry margins and ongoing “self-help” improvements.
Refinery throughput, at 5.7 million barrels per day, was up 4 percent versus 2003, with improved unit reliability that captured stronger industry margins.
Petroleum product sales were up 3 percent in 2004, largely due to stronger industry demand and higher refinery throughput.
| STATISTICAL RECAP | 2004 | 2003 | 2002 | 2001 | 2000 | |||||||||||||||
Earnings (millions of dollars) |
5,706 | 3,516 | 1,300 | 4,227 | 3,418 | |||||||||||||||
Refinery throughput (thousands of barrels per day) |
5,713 | 5,510 | 5,443 | 5,542 | 5,642 | |||||||||||||||
Petroleum product sales (thousands of barrels per day) |
8,210 | 7,957 | 7,757 | 7,971 | 7,993 | |||||||||||||||
Average capital employed (millions of dollars) |
27,173 | 26,965 | 26,045 | 26,321 | 27,732 | |||||||||||||||
Return on average capital employed (percent) |
21.0 | 13.0 | 5.0 | 16.1 | 12.3 | |||||||||||||||
Capital expenditures (millions of dollars) |
2,405 | 2,781 | 2,450 | 2,322 | 2,618 | |||||||||||||||
2004 FINANCIAL & OPERATING REVIEW • EXXON MOBIL CORPORATION
66
Downstream Competitive Advantages
“SELF-HELP” IN A CHALLENGING ENVIRONMENT
Downstream earnings were strong in 2004, while the business environment remained very competitive. Long-term real refining margins have historically declined at a rate of about 2 percent per year driven by productivity improvements, in part enabled by technology advancement. Intense competition in the retail fuels market has driven long-term real margins down by 4 percent per year. Combined with an outlook for modest industry growth in mature markets, cost pressures from inflation, and increasing requirements for regulatory investments, we must rely on “self-help” measures to generate attractive returns and create value for our shareholders.
ExxonMobil’s Downstream business is a large, diversified, and profitable portfolio, with marketing presence and refining facilities around the world. In pursuing our Downstream strategies, we have created sustainable competitive advantages in a number of areas. We build on these advantages with an array of self-help initiatives in the areas of margin enhancement, cost efficiency, and capital discipline.
| § | The scale of our global operations is a key advantage for ExxonMobil. Our refineries are, on average, 70 percent larger than the industry average. |
| § | Our manufacturing facilities are highly integrated with other ExxonMobil operations. Integration provides us with the flexibility to optimize feedstock and product streams in a refining-chemical complex to the highest-value outlet. It also enables us to share infrastructure and support staff, lowering operating costs. |
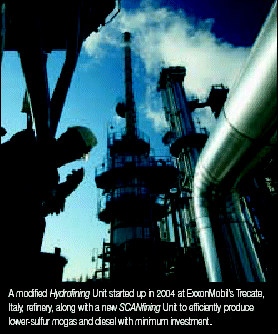
| § | Our global functional organization enables better prioritization and rapid deployment of new technologies, while fully leveraging best practices and cost efficiencies across the Downstream businesses. |
| § | The Exxon, Mobil, and Esso brands are well recognized and respected throughout the world, and are valued by customers for superior quality, performance, and reliability. |
| § | The competitive strength resulting from our in-house proprietary technical capability is enhanced through close cooperation between the technology and business organizations. This alignment of research priorities results in timely and cost-effective solutions to the highest-value business opportunities. |
Refining and Supply
ExxonMobil’s Refining and Supply business provides quality products and feedstocks to customers around the world. We manufacture clean fuels, lubes, and other high-value products utilizing a highly efficient asset base. Our global supply organization optimizes the supply of crude and feedstock to our refineries and places our equity crude production in its highest-value disposition. As a result, we process about one-half of our equity crude and purchase nearly 5 million barrels per day of crude oil and feedstocks to maximize value from our refining assets. Timely application of technological advances continues to improve our operations.
Largest Global Refiner
Refinery interests |
45 | |||
Distillation
capacity(barrels per day) |
6.4 million | |||
Lube
basestock capacity (barrels per day) |
145 thousand | |||
Crude oil and product tanker interests (>1kDWT) |
32 | |||
Major petroleum products terminals |
282 | |||
Refining gross margin is the small difference between the price at which we sell the products we manufacture and what we pay for the raw materials we buy. Those prices are set by the global marketplace. Within this context, there are three ways for us to improve returns and create shareholder value:
| § | Improve the yield of high-value products; for example, by converting more of the barrel to lighter products, such as motor gasoline; |
| § | Lower the cost of raw materials; for example, by using technology advancements to process more difficult, lower-cost crude; and, |
| § | Operate more efficiently; for example, by using less energy to manufacture our products. |
GLOBAL SCALE AND INTEGRATION ARE STRUCTURAL ADVANTAGES
Our scale, integration, functional organization, and technological capabilities combine to provide us with significant competitive advantages versus industry. Structural factors such as these differentiate us and are strengths that are difficult for competitors to duplicate. We leverage these advantages across our global network to yield results that are better than industry.
EXXON MOBIL CORPORATION • 2004 FINANCIAL & OPERATING REVIEW
D o w n s t r e a m 67
Structural Advantages
Equity Distillation and Conversion Capacity(1)
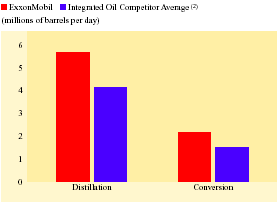
| (1) | Conversion capacity includes cat cracking, coking, and hydrocracking. | |
| (2) | Royal Dutch Shell and BP values calculated on a consistent basis with ExxonMobil, based on public information. |
Source: Oil & Gas Journal
World–Class Refinery Size
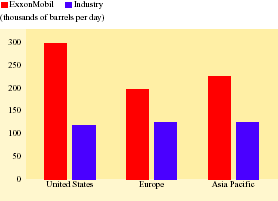
Source: Oil & Gas Journal
We have more distillation and conversion capacity than any refiner in the world. Overall, our refineries are 70 percent larger than the industry average and are integrated with chemical operations at many locations. Combined, these factors enable the disposition of molecules to the highest-value outlet and provide advantages through improved feedstock flexibility and lower site operating costs.
We have multiple refineries concentrated in some major refining centers, which enable further operational and supply optimization among facilities. These centers are located on the U.S. Gulf Coast, northwest Europe, Japan, and Southeast Asia. Collectively, these represent over 60 percent of our total refining capacity.
ENHANCING MARGIN
Improving profitability includes identifying and delivering initiatives that enhance margin generation. We do this using sophisticated molecule management tools as described on page 68. In addition, one of the most straightforward and least capital-intensive ways to increase refinery profitability is to increase refinery utilization and overall yield.
INTEGRATION OPTIMIZES THE YIELD OF HIGH-VALUE PRODUCTS
About 80 percent of our fuels refining capacity is integrated with either chemical and/or lubes and specialties operations. Obvious advantages include shared site costs, energy management efficiency, and common infrastructure. Even more sizable value capture accrues from our ability to optimize many product and feedstock streams and exchanges between plants. This cannot be matched by standalone operations. For example, by integrating a large chemical operation with a refinery, streams that would normally end up as fuels products can be upgraded to higher-value chemical products. Similarly, the economic incentive to run chemical feed alternatives changes daily. An integrated complex is able to continually and promptly respond to changing market dynamics, and create additional shareholder value.
In 2004, unplanned capacity loss was reduced by over 20 percent versus 2003. We are also reducing planned downtime by extending the intervals between required turnarounds and reducing the time required to complete a turnaround.
These improvements are driven by the disciplined application of our Reliability and Maintenance Management System. This program is safely increasing plant reliability and availability while lowering total facility maintenance costs. The program has been applied to all ExxonMobil sites and provides a structured, rigorous approach to the management of more than $1 billion of annual maintenance work. Since its introduction, we have reduced the amount of time that units are down for maintenance by 40 percent, and reduced maintenance costs by 30 percent. We are an industry leader in operating reliability and we continue to improve the economic utilization of our refining capacity.
Refining Unit Utilization
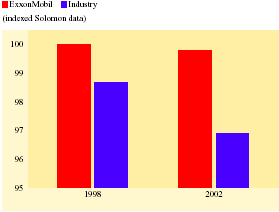
The most recent Solomon survey showed ExxonMobil refineries widened their utilization lead over competition.
2004 FINANCIAL & OPERATING REVIEW • EXXON MOBIL CORPORATION
68
MOLECULE MANAGEMENT LOWERS RAW MATERIAL COST
We continue to find new, innovative methods to increase the yields of high-value products, while reducing overall raw material costs. We have made advancements in molecular fingerprinting and modeling technologies that improve our understanding of the behavior and characteristics of materials moving through our refineries. This technology enables us to optimize the chemical composition of feedstocks and products in real-time, and:
| • | More precisely select and blend crudes with properties that will maximize margins through our hardware; | |||
| • | Identify and better utilize advantaged crudes that may be discounted in the marketplace; and, | |||
| • | Optimize value for each product stream. | |||
Molecule Management Improvements
(millions of dollars per year)
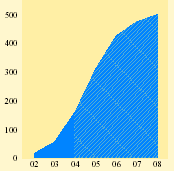
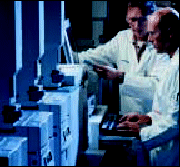
Lab technicians at ExxonMobil’s Rotterdam, Netherlands, refinery analyze distillation profiles for heavy refining components.
ENERGY INITIATIVES LOWER OPERATING COSTS
The improved energy efficiency of operations is a key contributor to our better-than-industry cost performance. ExxonMobil’s proprietary Global Energy Management System (GEMS) focuses on opportunities to reduce the energy consumed at our refineries and chemical complexes. The benefits from energy initiatives have increased with higher energy prices.
| § | More than $1 billion of pretax energy savings has been identified to date, equal to 15 to 20 percent of the energy consumed at our refinery and chemical facilities. |
| § | Our rate of energy improvement from 2002 to 2004 has been five times the historical industry pace. |
We also continue to make significant investments in cogeneration facilities. Cogeneration, the simultaneous production of electric power and steam, requires substantially less energy and results in lower emissions versus separate conventional steam and power generation.
| § | More than 90 percent of the power generating capacity at our manufacturing sites comes from cogeneration, meeting two-thirds of our power requirements at these facilities. |
| § | Three new cogeneration facilities started up in 2004 at Baytown, Beaumont, and Sarnia. |
Exxon Mobil Energy Efficiency
(indexed Solomon data)
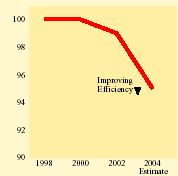
PERSISTENT PURSUIT OF OPERATING EFFICIENCIES
We combine our structural advantages with a continuous and disciplined effort to implement operating efficiencies and reduce costs in all of our facilities. Together, work force and energy costs comprise two-thirds of total refining cash operating costs. An ongoing focus on being the most efficient we can be, in all aspects of the business, has resulted in worldwide cash operating costs at our refineries that are substantially below the industry average.
Refining Cash Operating Costs
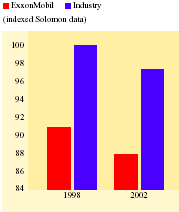
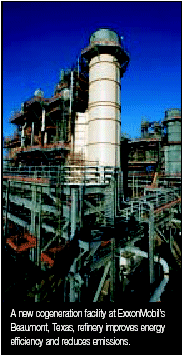
EXXON MOBIL CORPORATION • 2004 FINANCIAL & OPERATING REVIEW
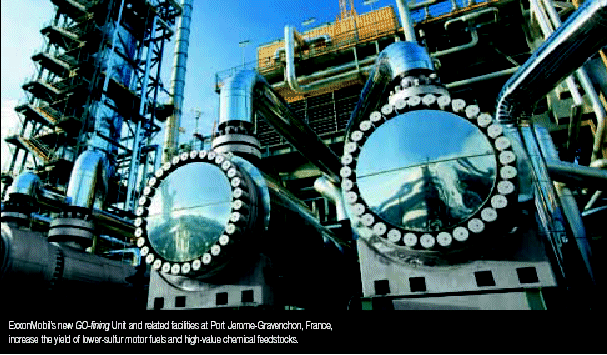
INVESTING TO MEET CUSTOMER NEEDS FOR IMPROVED PRODUCTS
Refining and Supply capital expenditures are focused on selective and resilient investments to meet future product quality requirements, reduce environmental impact, further upgrade safety systems, lower operating costs, and produce higher-value products and chemical feedstocks using lower-cost raw materials.
In 2004, we completed construction and successfully started up several facilities to produce lower-sulfur gasoline and diesel. (See page 75 for details of 2004 and 2005 investments.) ExxonMobil’s proprietary SCANfining technology provides a competitive edge by producing lower-sulfur motor gasoline with less octane loss and a minimum of new investment. Through application in our own refineries and licensing to third parties, this technology will be used in producing about 25 percent of the low-sulfur gasoline required by U.S. and Canadian customers.
Similarly, demand is strong for the Nebula-20 catalyst technology application for ultralow-sulfur diesel. Eleven applications are expected by the end of 2005.
Spending on projects that enhance refinery capacity and yield also continued. In 2004, we completed the $200 million enhanced-conversion project at the Port Jerome-Gravenchon, France, refinery. The investment increases yields of motor fuels and high-value chemical feedstocks and also provides the capability to meet lower-sulfur motor fuel specifications.
Overall, ExxonMobil’s Capital Project Management System continues to provide top-tier performance in project execution. Through a rigorous post-project completion appraisal process and confirmed by external benchmarking, our project execution performance is at the leading edge of industry. Leveraging our global scale, we continue to increase our capital execution efficiency.
EMERGING MARKET GROWTH
World-class scale and integration, industry-leading efficiency, leading-edge technology, and globally respected brands enable ExxonMobil to take advantage of attractive emerging-growth opportunities around the globe. For example, our assets are well-positioned and configured to supply demand growth in Asia Pacific, which we estimate will rise 3 percent annually through 2020.
FUJIAN – PUTTING IT ALL TOGETHER
| § | In 2004, an agreement was signed between ExxonMobil, Sinopec, Saudi Aramco, and Fujian Petrochemical to advance the design and planning of an integrated project. | |||
| This project is the only fully integrated project announced in China with foreign participation. Scale, integration, leading technology, and world-class operations will help ensure this project is highly competitive and resilient to market volatility. | ||||
| § | Plans include an expansion of the existing refinery in Fujian from 80 thousand barrels per day to 240 thousand barrels per day. | |||
| § | This project includes a world-scale integrated chemical plant, including an 800 thousand ton per year flexible-feed steam cracker plus polyolefins and aromatics units. | |||
| A fuels marketing joint venture is expected to market products through more than 600 retail sites, which ensures a high-value outlet for the manufacturing complex. | ||||
2004 FINANCIAL & OPERATING REVIEW • EXXON MOBIL CORPORATION
70
Fuels Marketing
ExxonMobil Fuels Marketing helps make life easier for customers on the move in more than 100 countries across the globe, creating value with high-quality and convenient products and services under our three strong brands: Exxon, Mobil, and Esso. Our business portfolio leverages globally common, consistently applied processes, marketing programs, and best practices to enhance worldwide business performance. Improvement in return on average capital employed is driven through disciplined execution in the areas of safety, cost efficiency, nonfuels income growth, and retail chain portfolio management.
Diverse Customer Base Provides Global Outlet
Operations
|
100 countries on six continents | |
Service stations
|
37 thousand | |
Industrial and wholesale customers
|
1 million | |
Aviation operations
|
600 airports | |
Marine operations.
|
300 ports |
GLOBAL SCALE DELIVERS COST EFFICIENCIES
Our scale, global organization, and disciplined approach provide advantages in an intensely competitive industry. We capture efficiencies by implementing innovative technology, streamlining and automating work processes, and centralizing support activities, while continuing to improve customer service. Our on-site and above-site operating costs are lowered by consistently applying retail best practices that are tested and proven around the world. Results include:
| • | Customer Service Centers have been consolidated in the past five years, with the network of core locations down 80 percent; | |||
| • | Regular employee staffing is 20 percent lower than in 2000; and, | |||
| • | In 2004, our cost reduction initiatives reduced ongoing operating expenses by over $200 million. | |||
Improved category management in our convenience stores, car wash execution, and strategic alliances with leading food and grocery marketers have yielded efficiencies and increased nonfuels income by $30 million per year since 2000.
U.S.
B r e a k e v e n F u e l s M a r g i n
(indexed 2000 = 100; real 2004 dollars)
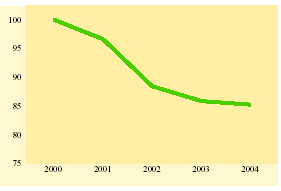
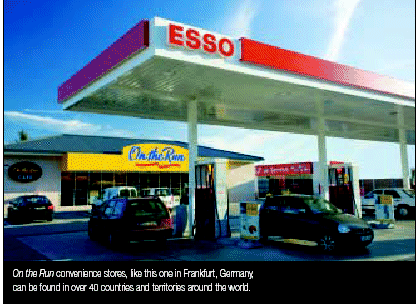
The combined benefit of our efficiency savings and nonfuels income growth results in a reduction to the fuels margin required for a retail site to break even after netting nonfuels income against operating costs. In the United States, for example, we have reduced our breakeven margin by 15 percent since 2000.
CAPITAL DISCIPLINE ENHANCES PERFORMANCE
Our retail capital management strategy combines selective investments with ongoing asset highgrading to create a resilient asset base. We have adopted a global focused market approach to manage retail marketing capital effectiveness. Markets are selected and prioritized through a rigorous and consistent market planning process. Within each market, we assess customer preferences, develop detailed market models, and produce comprehensive network plans. These plans generally result in a smaller but higher-performing chain of retail outlets.
A common measure of asset performance in the retail business is market effectiveness, which is the ratio of the percentage of volume sold to the percentage of industry retail sites in a given market. While the size of our retail chain is approximately 15 percent lower since 2000 as a result of highgrading our assets, our market effectiveness in markets where we have seen the full benefits of a focused market approach is 50 percent better than industry. We are in the early years of a long-term program to apply these tools.
I m p a c t o f F o c u s M a r k e t I n v e s t m e n t s
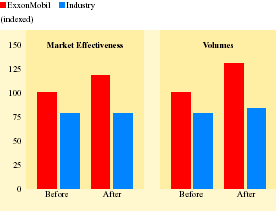
EXXON MOBIL CORPORATION • 2004 FINANCIAL & OPERATING REVIEW
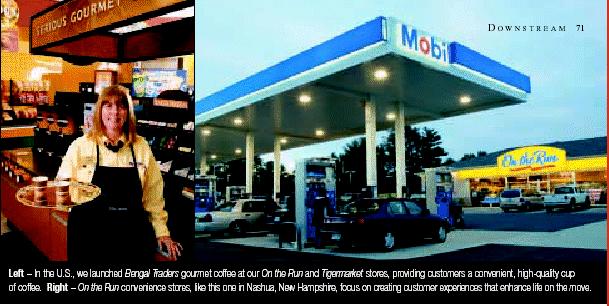
CUSTOMER FOCUSED INITIATIVES IMPROVE MARGINS
Around the world we employ a portfolio of innovative retail formats designed to appeal to customers by delivering quality products, convenience, and value. Nonfuels products make up a significant and growing part of our offering.
In 2004, we added nearly 300 On the Run convenience stores worldwide, bringing the total to nearly 1,300 in over 40 countries and territories. Our award-winning On the Run convenience store format reflects extensive market research and incorporates leading-edge technology.
In selected markets, we use strategic alliances to enhance our convenience store offering, building on the strength of our partners’ brands or distribution networks. Examples include our alliances with Tesco in the United Kingdom and Thailand, Doutor and 7-Eleven in Japan, Tim Hortons in Canada, and Innscor across Africa.
Our Speedpass payment offering provides more than 7 million users in the United States, Canada, Japan, and Singapore, the ability to purchase fuel, car wash, or convenience products with ease, building customer loyalty. Speedpass is accepted at over 10,000 Exxon, Mobil, and Esso sites worldwide.
H i g h g r a d i n g R e t a i l S i t e s
Retail Sites in Operation
(thousands)
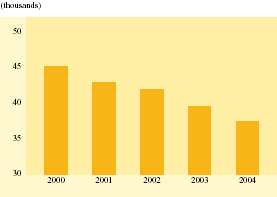
INDUSTRIAL AND WHOLESALE, AVIATION, AND MARINE
In addition to retail, Fuels Marketing has a significant global presence in commercial fuels businesses. Functional teams, integrated with Refining and Supply, have been organized to capture the highest value for the fuel products we make. These teams market ExxonMobil-produced fuels to 1 million industrial and wholesale customers, 600 airports, and 300 marine ports, maximizing utilization of our global logistics assets.
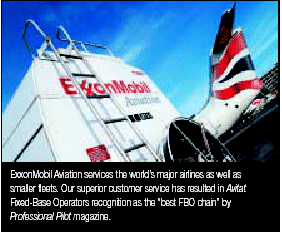
G l o b a l N o n f u e l s I n c o m e G r o w t h
Convenience Retailing, Car Wash, Card/Alliance, Rent
(millions of dollars per year)
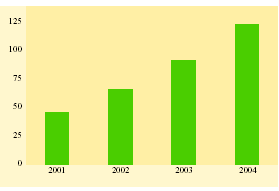
2004 FINANCIAL & OPERATING REVIEW • EXXON MOBIL CORPORATION
72
Lubricants & Specialties
ExxonMobil is the world’s largest supplier of lube basestocks and a leading marketer of finished lubricants and specialty products. Leveraging three strong global brands, Mobil, Exxon, and Esso, along with the world’s leading full-synthetic motor oil, Mobil 1, we are trusted by customers to deliver technically superior products in a global market. A dedicated organization and a strong distributor network supply high-quality lubricants and our application expertise to customers around the world.
Global Lubes Leadership Position
Lube basestock refineries
|
12 | |
Average capacity per site
|
2 times industry | |
Blend plants
|
58 | |
Lube basestock market share
|
18 percent | |
Finished lubricant market share
|
13 percent |
LEVERAGING OUR BRAND AND TECHNOLOGY
ExxonMobil’s leading lubricant brands – Mobil, Exxon, and Esso –continue to meet customer needs for transportation and industrial applications around the world. Customers rely on Mobil, Exxon, and Esso branded products because of their quality, reliability, technological leadership, a close association with many leading original-equipment manufacturers, and their demonstrated ability to withstand performance stresses, including those of motorsports racing. They are also backed by a variety of technical services designed to provide customers with worry-free operations.
In 2005, ExxonMobil took another step in technology leadership with the U.S. introduction of a new line of passenger car lubricants that guarantee extended engine protection. Mobil 1 Extended Performance, Mobil Clean 5000 and Mobil Clean 7500 provide consumers protection for their vehicles’ engines for longer oil change intervals than conventional lubricants.
ExxonMobil also applies technology in improving customer satisfaction and service. In 2004, ExxonMobil’s revenue from e-based ordering was up 35 percent over the prior year. Many customers can now place orders directly, check order status, and manage accounts using the Internet.
G
l o b a l L e a d e r s h i p P o s i t i o n
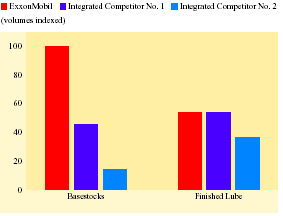
Source: ExxonMobil estimate and industry data
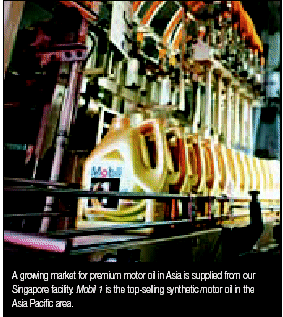
GROWING FLAGSHIP AND PREMIUM PRODUCTS
As the world’s economies grow, so does the demand for higher-quality lubricants. ExxonMobil continues to grow market share in this most profitable part of the finished lubes business.
| • | Mobil 1 is the endorsed, recommended, and/or approved engine oil for more than 50 percent of new luxury vehicles in the North American market. No other motor oil holds as many engine specification approvals. | |||
| • | The growing list of automotive manufacturers recommending Mobil 1 for their high-performance vehicles include the makers of Aston Martin, Bentley, BMW, Cadillac, Chrysler, Corvette, Dodge, Mercedes Benz, Porsche, and Saab. | |||
| • | In 2005, we introduced new higher mileage, extended-performance Mobil 1 and Mobil product lines in the United States that will further differentiate these premium brands. | |||
S y n t h e t i c L u b e s S a l e s G r o w t h
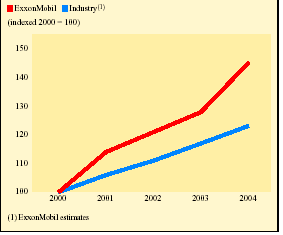
EXXON MOBIL CORPORATION • 2004 FINANCIAL & OPERATING REVIEW
D o w n s t r e a m 73
E
m e r g i n g M a r k e t s
f o r F i n i s h e d L u b e s
(indexed 2000 = 100)
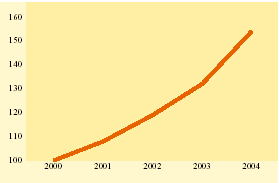
ExxonMobil lubricants have grown over 50 percent in profitable emerging markets. Our globally recognized brands are a good platform to establish the ExxonMobil name with new customers.
STRATEGIC GLOBAL ALLIANCES
Globally respected brands and industry-leading technology enable ExxonMobil to build on strategic global alliances with automotive and industrial equipment manufacturers. A strong global presence enables ExxonMobil to better serve customers with worldwide operations that demand consistently reliable, high-quality products and services. For example, ExxonMobil is a global supplier of premium oils to Caterpillar factories and dealers in over 90 countries. ExxonMobil’s worldwide service capability and integrated sales focus on strategic global customers differentiate us from competitors.
Motorsports sponsorships, like those in Formula 1 with the West McLaren Mercedes and Toyota teams, lead to new business with strategic global customers and provide an ideal environment for developing high-performance lubricants. Sponsorship of Toyota’s new Formula 1 team, for example, helped strengthen ExxonMobil’s position as a primary supplier of factory and service fill lubricants for Toyota Motor Company.
Relationships with strategic accounts extend off the track as well, through our technology partnerships with Toyota, DaimlerChrysler, and General Motors, where we collaborate on developing innovative new lubricants.
GROWTH IN PROFITABLE EMERGING MARKETS
As economies develop and industrialize, there is an increasing demand for high-quality industrial and automotive lubricants. For example, in China, we have leveraged our well-recognized brands, strong equipment manufacturer relationships, and technical expertise to become the leading international lubes marketer. China is now our fourth largest market for finished lubricants.
Steps we have taken to increase our operating efficiency include simplifying our operations, such as reducing the number of blend plants and product formulations in our supply chain.
SUPPLY CHAIN EFFICIENCY IMPROVES RESULTS
Building on a 30-percent reduction in the number of blend plants and a 65-percent reduction in product formulations, ExxonMobil continues to improve supply chain efficiency. Further optimization of the supply chain network includes a 29-percent reduction in third-party blenders and packagers, and a 9-percent reduction in distribution warehouses in 2004.
Worldwide implementation of sophisticated supply chain planning tools was completed in 2004, and reduced inventories by more than 5 percent. The further development of these leading-edge analytical tools is expected to capture additional working capital efficiencies while ensuring superior execution of our marketing offerings.
O
p e r at i n g E f f i c i e n c y
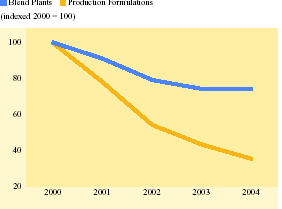
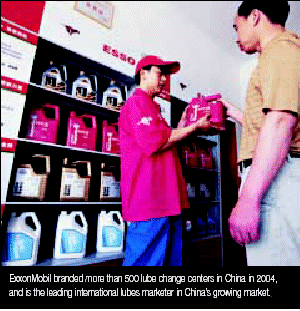
2004 FINANCIAL & OPERATING REVIEW • EXXON MOBIL CORPORATION
74
Downstream Operating Statistics
REFINING CAPACITY AT YEAR-END 2004 (1)
| Capacity at 100% | ||||||||||||||||||||||||||||||||||||||
| ExxonMobil | ExxonMobil | |||||||||||||||||||||||||||||||||||||
| Share | Atmospheric | Catalytic | Residuum | Interest | ||||||||||||||||||||||||||||||||||
| (thousands of barrels per day) | kBD(2) | Distillation | Cracking | Hydrocracking | Conversion(3) | Lubes(4) | % | |||||||||||||||||||||||||||||||
United States |
||||||||||||||||||||||||||||||||||||||
Torrance |
California | l | 150 | 150 | 96 | 21 | 53 | – | 100 | |||||||||||||||||||||||||||||
Joliet |
Illinois | l | 238 | 238 | 93 | – | 56 | – | 100 | |||||||||||||||||||||||||||||
Baton Rouge |
Louisiana | n | l | 494 | 494 | 229 | 24 | 113 | 16 | 100 | ||||||||||||||||||||||||||||
Chalmette |
Louisiana | l | 5 | 93 | 187 | 68 | 19 | 33 | – | 50 | ||||||||||||||||||||||||||||
Billings |
Montana | l | 60 | 60 | 23 | 6 | 9 | – | 100 | |||||||||||||||||||||||||||||
Baytown |
Texas | n | l | 557 | 557 | 203 | 26 | 82 | 21 | 100 | ||||||||||||||||||||||||||||
Beaumont |
Texas | n | l | 349 | 349 | 108 | 62 | 48 | 13 | 100 | ||||||||||||||||||||||||||||
Total United States |
1,941 | 2,035 | 820 | 158 | 394 | 50 | ||||||||||||||||||||||||||||||||
Canada |
||||||||||||||||||||||||||||||||||||||
Strathcona |
Alberta | 187 | 187 | 55 | – | – | 2 | 69.6 | ||||||||||||||||||||||||||||||
Dartmouth |
Nova Scotia | 5 | 82 | 82 | 29 | – | – | – | 69.6 | |||||||||||||||||||||||||||||
Nanticoke |
Ontario | l | 112 | 112 | 48 | – | – | – | 69.6 | |||||||||||||||||||||||||||||
Sarnia |
Ontario | n | l | 121 | 121 | 26 | 18 | 23 | 6 | 69.6 | ||||||||||||||||||||||||||||
Total Canada |
502 | 502 | 158 | 18 | 23 | 8 | ||||||||||||||||||||||||||||||||
Europe |
||||||||||||||||||||||||||||||||||||||
Antwerp |
Belgium | n | l | 275 | 275 | 34 | – | – | – | 100 | ||||||||||||||||||||||||||||
Fos-sur-Mer |
France | l | 5 | 119 | 119 | 28 | – | – | – | 83 | ||||||||||||||||||||||||||||
Port Jerome-
Gravenchon |
France | n | l | 233 | 233 | 34 | – | – | 17 | 83 | ||||||||||||||||||||||||||||
Ingolstadt |
Germany | l | 5 | 106 | 106 | 28 | – | – | – | 100 | ||||||||||||||||||||||||||||
Karlsruhe |
Germany | l | 5 | 76 | 302 | 87 | – | 50 | – | 25 | ||||||||||||||||||||||||||||
Augusta |
Italy | l | 5 | 198 | 198 | 46 | – | – | 18 | 100 | ||||||||||||||||||||||||||||
Trecate |
Italy | l | 5 | 174 | 174 | 29 | – | – | – | 75.4 | ||||||||||||||||||||||||||||
Rotterdam |
Netherlands | n | l | 188 | 188 | – | 50 | 39 | – | 100 | ||||||||||||||||||||||||||||
Slagen |
Norway | 110 | 110 | – | – | 32 | – | 100 | ||||||||||||||||||||||||||||||
Fawley |
United Kingdom | n | l | 321 | 321 | 72 | – | 28 | 9 | 100 | ||||||||||||||||||||||||||||
Total Europe |
1,800 | 2,026 | 358 | 50 | 149 | 44 | ||||||||||||||||||||||||||||||||
Japan |
||||||||||||||||||||||||||||||||||||||
Chiba |
Japan | l | 88 | 175 | 34 | 39 | – | – | 50 | |||||||||||||||||||||||||||||
Kawasaki(5) |
Japan | n | l | 296 | 296 | 88 | 23 | – | – | 50 | ||||||||||||||||||||||||||||
Okinawa(5) |
Japan | 90 | 90 | – | – | – | – | 43.8 | ||||||||||||||||||||||||||||||
Sakai(5) |
Japan | l | 5 | 140 | 140 | 38 | – | – | – | 50 | ||||||||||||||||||||||||||||
Wakayama(5) |
Japan | l | 5 | 155 | 155 | 37 | – | – | 7 | 50 | ||||||||||||||||||||||||||||
Total Japan |
769 | 856 | 197 | 62 | – | 7 | ||||||||||||||||||||||||||||||||
| n | Integrated refinery and chemical complex | |
| l | Cogeneration capacity | |
| 5 | Refineries with some chemical production |
(1) Capacity data is based on 100 percent of rated refinery process unit capacities. ExxonMobil has additional interests with a total net capacity of 6 thousand barrels per day of lubes in Dunkirk, France; Jeddah, Saudi Arabia; and Yanbu, Saudi Arabia.
(2) ExxonMobil share reflects 100 percent of atmospheric distillation capacity in operations of ExxonMobil and majority-owned subsidiaries. For companies owned 50 percent or less, ExxonMobil share is the greater of ExxonMobil’s equity interest or that portion of distillation capacity normally available to ExxonMobil.
(3) Includes thermal cracking, visbreaking, coking, and hydrorefining processes.
(4) Lubes capacity based on dewaxed oil production.
(5) Operated by majority-owned subsidiaries.
(6) Facility mothballed.
EXXON MOBIL CORPORATION • 2004 FINANCIAL & OPERATING REVIEW
D o w n s t r e a m 75
Refining Capacity at Year-End 2004(1) (continued)
| Capacity at 100% | ||||||||||||||||||||||||||||||||||||||
| ExxonMobil | ExxonMobil | |||||||||||||||||||||||||||||||||||||
| Share | Atmospheric | Catalytic | Residuum | Interest | ||||||||||||||||||||||||||||||||||
| (thousands of barrels per day) | kBD(2) | Distillation | Cracking | Hydrocracking | Conversion(3) | Lubes(4) | % | |||||||||||||||||||||||||||||||
Asia Pacific excluding Japan |
||||||||||||||||||||||||||||||||||||||
Adelaide(6) |
Australia | – | – | – | – | – | – | 100 | ||||||||||||||||||||||||||||||
Altona |
Australia | n | 130 | 130 | 30 | – | – | – | 100 | |||||||||||||||||||||||||||||
Port Dickson |
Malaysia | 86 | 86 | – | – | – | – | 65 | ||||||||||||||||||||||||||||||
Whangerei |
New Zealand | 28 | 104 | – | 26 | – | – | 19.2 | ||||||||||||||||||||||||||||||
Jurong/PAC |
Singapore | n | l | 605 | 605 | – | 34 | 116 | 31 | 100 | ||||||||||||||||||||||||||||
Sriracha |
Thailand | n | l | 174 | 174 | 35 | – | – | – | 87.5 | ||||||||||||||||||||||||||||
Total Asia Pacific
excluding Japan |
1,023 | 1,099 | 65 | 60 | 116 | 31 | ||||||||||||||||||||||||||||||||
Latin America/Other |
||||||||||||||||||||||||||||||||||||||
Campana |
Argentina | l | 5 | 85 | 85 | 27 | – | 24 | – | 100 | ||||||||||||||||||||||||||||
Sonara |
Cameroon | 3 | 42 | – | – | – | – | 8 | ||||||||||||||||||||||||||||||
Abidjan |
Cote d’Ivoire | 5 | 65 | – | 15 | – | – | 8 | ||||||||||||||||||||||||||||||
Acajutla |
El Salvador | 22 | 22 | – | – | – | – | 65 | ||||||||||||||||||||||||||||||
Sogara |
Gabon | 2 | 17 | – | – | – | – | 11.7 | ||||||||||||||||||||||||||||||
Martinique |
Martinique | 2 | 17 | – | – | – | – | 14.5 | ||||||||||||||||||||||||||||||
Managua |
Nicaragua | 5 | 20 | 20 | – | – | – | – | 100 | |||||||||||||||||||||||||||||
La Pampilla |
Peru | 6 | 102 | 14 | – | – | – | 6 | ||||||||||||||||||||||||||||||
Yanbu |
Saudi Arabia | 188 | 375 | 91 | – | 46 | – | 50 | ||||||||||||||||||||||||||||||
Dakar |
Senegal | 3 | 27 | – | – | – | – | 11.8 | ||||||||||||||||||||||||||||||
Total Latin America/Other |
336 | 772 | 132 | 15 | 70 | – | ||||||||||||||||||||||||||||||||
Total worldwide |
6,371 | 7,290 | 1,730 | 363 | 752 | 140 | ||||||||||||||||||||||||||||||||
| n | Integrated refinery and chemical complex | |
| l | Cogeneration capacity | |
| 5 | Refineries with some chemical production |
(1) Capacity data is based on 100 percent of rated refinery process unit capacities. ExxonMobil has additional interests with a total net capacity of 6 thousand barrels per day of lubes in Dunkirk, France; Jeddah, Saudi Arabia; and Yanbu, Saudi Arabia.
(2) ExxonMobil share reflects 100 percent of atmospheric distillation capacity in operations of ExxonMobil and majority-owned subsidiaries. For companies owned 50 percent or less, ExxonMobil share is the greater of ExxonMobil’s equity interest or that portion of distillation capacity normally available to ExxonMobil.
(3) Includes thermal cracking, visbreaking, coking, and hydrorefining processes.
(4) Lubes capacity based on dewaxed oil production.
(5) Operated by majority-owned subsidiaries.
(6) Facility mothballed.
LOWER-SULFUR GASOLINE & DIESEL FACILITY START-UPS
| 2004 | Location | |
SCANfining Unit
|
Chalmette, Louisiana | |
SCANfining Unit, Hydrofining Unit Modifications
|
Fos, France | |
GO-fining Unit & Related Facilities
|
Port Jerome-Gravenchon, France | |
SCANfining Unit, Hydrofining Unit Modifications
|
Augusta, Italy | |
SCANfining Unit, Hydrofining Unit Modifications
|
Trecate, Italy | |
GO-fining Unit, Naphtha Desulfurization Upgrades & Related Facilities
|
Kawasaki, Japan | |
GO-fining UnitUpgrade & Related Facilities
|
Wakayama, Japan | |
| 2005 | Location | |
Distillate Hydrotreater
|
Joliet, Illinois | |
Distillate Hydrotreater
|
Baton Rouge, Louisiana | |
Distillate Hydrotreater
|
Billings, Montana | |
SCANfining Unit & Related Facilities
|
Fawley, United Kingdom | |
Hydrofining Unit Debottleneck
|
Sakai, Japan | |
SCANfining Unit
|
Altona, Australia | |
2004 FINANCIAL & OPERATING REVIEW • EXXON MOBIL CORPORATION
76
THROUGHPUT, CAPACITY, AND UTILIZATION (1)
| 2004 | 2003 | 2002 | 2001 | 2000 | ||||||||||||||||
Refinery
Throughput(2) (thousands of barrels per day) |
||||||||||||||||||||
United States |
1,850 | 1,806 | 1,834 | 1,811 | 1,862 | |||||||||||||||
Canada |
468 | 450 | 447 | 449 | 451 | |||||||||||||||
Europe |
1,663 | 1,566 | 1,539 | 1,563 | 1,578 | |||||||||||||||
Japan |
685 | 704 | 671 | 707 | 708 | |||||||||||||||
Asia Pacific excluding Japan |
738 | 686 | 708 | 729 | 754 | |||||||||||||||
Latin America/Other |
309 | 298 | 244 | 283 | 289 | |||||||||||||||
Total worldwide |
5,713 | 5,510 | 5,443 | 5,542 | 5,642 | |||||||||||||||
Average
Refinery Capacity(3) (thousands of barrels per day) |
||||||||||||||||||||
United States |
1,940 | 1,919 | 1,895 | 1,878 | 1,938 | |||||||||||||||
Canada |
502 | 501 | 500 | 499 | 498 | |||||||||||||||
Europe |
1,786 | 1,768 | 1,756 | 1,740 | 1,732 | |||||||||||||||
Japan |
772 | 774 | 770 | 761 | 758 | |||||||||||||||
Asia Pacific excluding Japan |
1,014 | 1,027 | 1,048 | 1,045 | 1,055 | |||||||||||||||
Latin America/Other |
317 | 308 | 299 | 310 | 318 | |||||||||||||||
Total worldwide |
6,331 | 6,297 | 6,268 | 6,233 | 6,299 | |||||||||||||||
Utilization of Refining Capacity (percent) |
||||||||||||||||||||
United States |
95 | 94 | 97 | 96 | 96 | |||||||||||||||
Canada |
93 | 90 | 89 | 90 | 91 | |||||||||||||||
Europe |
93 | 89 | 88 | 90 | 91 | |||||||||||||||
Japan |
89 | 91 | 87 | 93 | 93 | |||||||||||||||
Asia Pacific excluding Japan |
73 | 67 | 68 | 70 | 71 | |||||||||||||||
Latin America/Other |
97 | 97 | 82 | 91 | 91 | |||||||||||||||
Total worldwide |
90 | 88 | 87 | 89 | 90 | |||||||||||||||
| (1) | Includes the Benicia, California, refinery until its divestment in May 2000. Excludes ExxonMobil’s minor interests in certain small refineries. | |
| (2) | Refinery throughput includes100 percent of crude oil and feedstocks sent directly to atmospheric distillation units in operations of ExxonMobil and majority-owned subsidiaries. For companies owned 50 percent or less, throughput includes the greater of either crude and feedstocks processed for ExxonMobil or ExxonMobil’s equity interest in raw material inputs. | |
| (3) | Refinery capacity is the stream-day capability to process inputs to atmospheric distillation units under normal operating conditions, less the impact of shutdowns for regular repair and maintenance activities, averaged over an extended period of time. These annual averages include partial-year impacts for capacity additions or deletions during the year. Any idle capacity that cannot be made operable in a month or less has been excluded. Capacity volumes include 100 percent of the capacity of refinery facilities managed by ExxonMobil or majority-owned subsidiaries. At facilities of companies owned 50 percent or less, the greater of either that portion of capacity normally available to ExxonMobil or ExxonMobil’s equity interest is included. |
EXXON MOBIL CORPORATION • 2004 FINANCIAL & OPERATING REVIEW
D o w n s t r e a m 77
RETAIL SITES
| (number of sites at year end) | 2004 | 2003 | 2002 | 2001 | 2000 | |||||||||||||||
United States |
||||||||||||||||||||
Owned/leased |
2,698 | 3,072 | 3,346 | 3,501 | 3,769 | |||||||||||||||
Distributors/resellers |
9,421 | 9,401 | 9,787 | 9,805 | 10,269 | |||||||||||||||
Canada |
||||||||||||||||||||
Owned/leased |
720 | 787 | 865 | 927 | 978 | |||||||||||||||
Distributors/resellers |
1,258 | 1,287 | 1,283 | 1,324 | 1,418 | |||||||||||||||
Europe |
||||||||||||||||||||
Owned/leased |
4,727 | 4,817 | 4,955 | 5,079 | 4,912 | |||||||||||||||
Distributors/resellers |
3,154 | 3,582 | 3,813 | 3,960 | 4,370 | |||||||||||||||
Asia Pacific |
||||||||||||||||||||
Owned/leased |
2,912 | 2,912 | 3,026 | 3,125 | 3,266 | |||||||||||||||
Distributors/resellers |
5,888 | 6,318 | 6,682 | 7,171 | 7,842 | |||||||||||||||
Latin America |
||||||||||||||||||||
Owned/leased |
1,388 | 1,429 | 1,449 | 1,440 | 1,465 | |||||||||||||||
Distributors/resellers |
3,437 | 3,891 | 4,465 | 4,427 | 4,630 | |||||||||||||||
Middle East/Africa |
||||||||||||||||||||
Owned/leased |
1,214 | 1,360 | 1,443 | 1,444 | 1,460 | |||||||||||||||
Distributors/resellers |
557 | 632 | 672 | 650 | 622 | |||||||||||||||
Total |
||||||||||||||||||||
Owned/leased |
13,659 | 14,377 | 15,084 | 15,516 | 15,850 | |||||||||||||||
Distributors/resellers |
23,715 | 25,111 | 26,702 | 27,337 | 29,151 | |||||||||||||||
Total worldwide |
37,374 | 39,488 | 41,786 | 42,853 | 45,001 | |||||||||||||||
2004 FINANCIAL & OPERATING REVIEW • EXXON MOBIL CORPORATION
78
PETROLEUM PRODUCT SALES (1) BY GEOGRAPHIC AREA
| (thousands of barrels per day) | 2004 | 2003 | 2002 | 2001 | 2000 | |||||||||||||||
United States |
||||||||||||||||||||
Motor gasoline, naphthas |
1,695 | 1,606 | 1,608 | 1,585 | 1,511 | |||||||||||||||
Heating oils, kerosene, diesel oils |
484 | 456 | 432 | 442 | 443 | |||||||||||||||
Aviation fuels |
250 | 234 | 256 | 261 | 250 | |||||||||||||||
Heavy fuels |
98 | 93 | 92 | 102 | 104 | |||||||||||||||
Lubricants, specialty, and other petroleum products |
345 | 340 | 343 | 361 | 361 | |||||||||||||||
Total United States |
2,872 | 2,729 | 2,731 | 2,751 | 2,669 | |||||||||||||||
Canada |
||||||||||||||||||||
Motor gasoline, naphthas |
250 | 249 | 246 | 238 | 231 | |||||||||||||||
Heating oils, kerosene, diesel oils |
186 | 184 | 176 | 173 | 173 | |||||||||||||||
Aviation fuels |
33 | 29 | 27 | 30 | 33 | |||||||||||||||
Heavy fuels |
37 | 36 | 31 | 35 | 33 | |||||||||||||||
Lubricants, specialty, and other petroleum products |
109 | 104 | 113 | 109 | 107 | |||||||||||||||
Total Canada |
615 | 602 | 593 | 585 | 577 | |||||||||||||||
Europe |
||||||||||||||||||||
Motor gasoline, naphthas |
557 | 558 | 571 | 584 | 607 | |||||||||||||||
Heating oils, kerosene, diesel oils |
895 | 840 | 815 | 823 | 809 | |||||||||||||||
Aviation fuels |
203 | 197 | 192 | 201 | 225 | |||||||||||||||
Heavy fuels |
214 | 217 | 213 | 214 | 232 | |||||||||||||||
Lubricants, specialty, and other petroleum products |
270 | 249 | 251 | 257 | 256 | |||||||||||||||
Total Europe |
2,139 | 2,061 | 2,042 | 2,079 | 2,129 | |||||||||||||||
Asia Pacific |
||||||||||||||||||||
Motor gasoline, naphthas |
513 | 523 | 442 | 439 | 454 | |||||||||||||||
Heating oils, kerosene, diesel oils |
594 | 599 | 518 | 581 | 585 | |||||||||||||||
Aviation fuels |
113 | 109 | 123 | 136 | 144 | |||||||||||||||
Heavy fuels |
222 | 218 | 201 | 234 | 233 | |||||||||||||||
Lubricants, specialty, and other petroleum products |
247 | 226 | 219 | 219 | 251 | |||||||||||||||
Total Asia Pacific |
1,689 | 1,675 | 1,503 | 1,609 | 1,667 | |||||||||||||||
Latin America |
||||||||||||||||||||
Motor gasoline, naphthas |
181 | 180 | 194 | 198 | 206 | |||||||||||||||
Heating oils, kerosene, diesel oils |
209 | 203 | 204 | 211 | 207 | |||||||||||||||
Aviation fuels |
46 | 43 | 44 | 48 | 51 | |||||||||||||||
Heavy fuels |
44 | 40 | 37 | 52 | 40 | |||||||||||||||
Lubricants, specialty, and other petroleum products |
24 | 24 | 23 | 23 | 24 | |||||||||||||||
Total Latin America |
504 | 490 | 502 | 532 | 528 | |||||||||||||||
| (1) Petroleum product sales include 100 percent of the sales of ExxonMobil and majority-owned subsidiaries, and the ExxonMobil equity interest in sales by companies owned 50 percent or less. |
EXXON MOBIL CORPORATION • 2004 FINANCIAL & OPERATING REVIEW
D o w n s t r e a m 79
Petroleum Product Sales(1) by Geographic Area (continued)
| (thousands of barrels per day) | 2004 | 2003 | 2002 | 2001 | 2000 | |||||||||||||||
Middle East/Africa |
||||||||||||||||||||
Motor gasoline, naphthas |
105 | 122 | 115 | 121 | 113 | |||||||||||||||
Heating oils, kerosene, diesel oils |
149 | 150 | 147 | 159 | 156 | |||||||||||||||
Aviation fuels |
53 | 50 | 49 | 45 | 46 | |||||||||||||||
Heavy fuels |
44 | 34 | 30 | 31 | 52 | |||||||||||||||
Lubricants, specialty, and other petroleum products |
40 | 44 | 45 | 59 | 56 | |||||||||||||||
Total Middle East/Africa |
391 | 400 | 386 | 415 | 423 | |||||||||||||||
Worldwide |
||||||||||||||||||||
Motor gasoline, naphthas |
3,301 | 3,238 | 3,176 | 3,165 | 3,122 | |||||||||||||||
Heating oils, kerosene, diesel oils |
2,517 | 2,432 | 2,292 | 2,389 | 2,373 | |||||||||||||||
Aviation fuels |
698 | 662 | 691 | 721 | 749 | |||||||||||||||
Heavy fuels |
659 | 638 | 604 | 668 | 694 | |||||||||||||||
Lubricants, specialty, and other petroleum products |
1,035 | 987 | 994 | 1,028 | 1,055 | |||||||||||||||
Total worldwide |
8,210 | 7,957 | 7,757 | 7,971 | 7,993 | |||||||||||||||
| (1) | Petroleum product sales include 100 percent of the sales of ExxonMobil and majority-owned subsidiaries, and the ExxonMobil equity interest in sales by companies owned 50 percent or less. |
PETROLEUM PRODUCT SALES
| (thousands of barrels per day) | 2004 | 2003 | 2002 | 2001 | 2000 | |||||||||||||||
Market and Supply Sales(1) |
||||||||||||||||||||
Market sales |
||||||||||||||||||||
Motor gasoline, naphthas |
2,248 | 2,273 | 2,288 | 2,270 | 2,311 | |||||||||||||||
Heating oils, kerosene, diesel oils |
1,625 | 1,626 | 1,625 | 1,671 | 1,674 | |||||||||||||||
Aviation fuels |
503 | 514 | 529 | 566 | 581 | |||||||||||||||
Heavy fuels |
382 | 367 | 358 | 371 | 380 | |||||||||||||||
Lubricants, specialty,
and other petroleum products |
495 | 483 | 494 | 484 | 519 | |||||||||||||||
Total market sales |
5,253 | 5,263 | 5,294 | 5,362 | 5,465 | |||||||||||||||
Total supply sales |
2,957 | 2,694 | 2,463 | 2,609 | 2,528 | |||||||||||||||
Total market and supply sales |
8,210 | 7,957 | 7,757 | 7,971 | 7,993 | |||||||||||||||
| (1) | Market sales are to retail site dealers, consumers (including government and military), jobbers, and small resellers. Supply sales are to large oil marketers, large unbranded resellers, and other oil companies. |
2 0 0 4 F I N A N C I A L & O P E R A T I N G R E V I E W • E X X O N M O B I L C O R P O R A T I O N
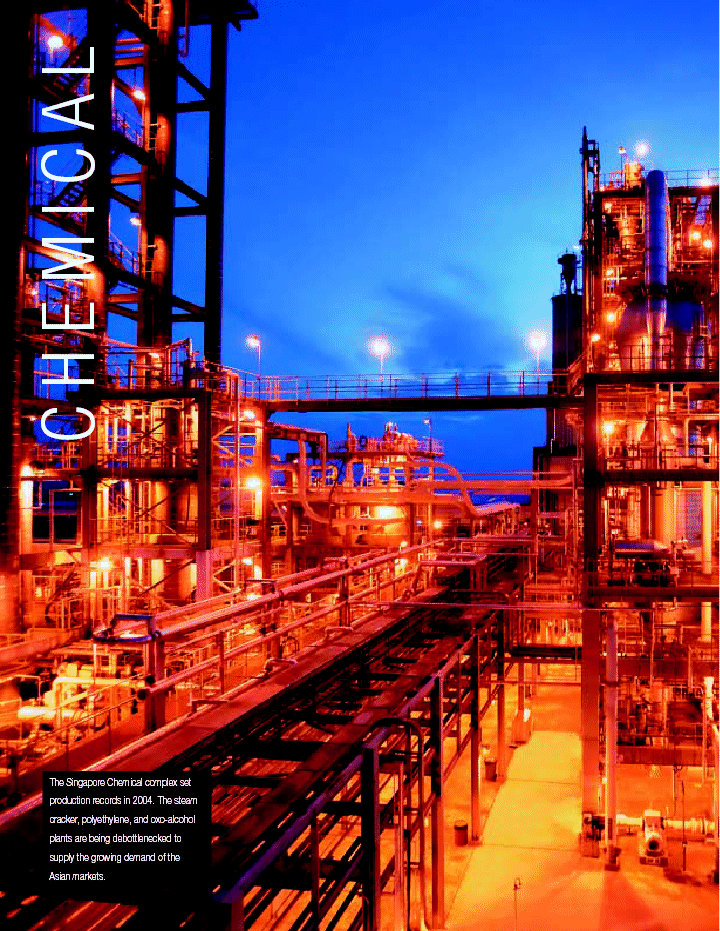
| LACIMEHC The Singapore Chemical complex set production records in 2004. The steam cracker, polyethylene, and oxo-alcohol plants are being debottlenecked to supply the growing demand of the Asian markets. |
81
Technology differentiates ExxonMobil Chemical.
Concentration on our core competencies, as well as selective
investment, produces growth and results that set us apart.
Chemical
CHEMICAL STRATEGIES
ExxonMobil Chemical has produced industry-leading returns and earnings growth through the effective implementation of our long-term strategies that capitalize on our competitive advantages. These strategies include:
| § Focus on businesses that capitalize on core competencies; |
| § Capture full benefits of integration across all ExxonMobil operations; |
| § Continuously reduce costs to achieve best-in-class performance; |
| § Build proprietary technology positions; and, |
| § Invest selectively in globally advantaged projects. |
C h e m i c a l O u t p e r f o r m e d C o m p e t i t i o n
A c r o s s T h e B u s i n e s s C y c l e
Return on Average Capital Employed
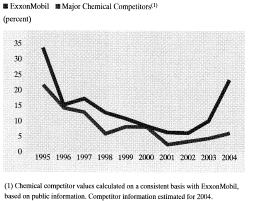
2004 RESULTS AND HIGHLIGHTS
2004 earnings of $3.4 billion set a record – more than double those in 2003. Our unique mix of businesses, broad geographic coverage, and feedstock and integration advantages ideally positioned ExxonMobil to capitalize on an improved industry environment.
Chemical return on average capital employed reached 23 percent, up from 10 percent in 2003. ExxonMobil’s returns exceeded the average returns of our major chemical competitors. Over the last 10 years, our Chemical segment achieved an average return of 14 percent. During the same period, we estimate our competitors’ average return to have been 8 percent.
2004 prime product sales volume of 27.8 million tons was a record – 5 percent higher than in 2003.
Growth in all regions was achieved by higher utilization of existing assets, supported by strong reliability and global supply optimization.
Capital expenditures were $0.7 billion. The Company continued to invest selectively in high-return efficiency projects, low-cost debottlenecks, and projects to support the growth of our specialty businesses.
Capacity is more than 40 percent higher than the last chemical cycle peak in 1995. Recent advantaged capacity additions in Saudi Arabia and Singapore are contributing significantly to earnings growth. We are particularly well-positioned to continue to meet growing demand in Asia, which has been led by an expanding Chinese economy.
| STATISTICAL RECAP | 2004 | 2003 | 2002 | 2001 | 2000 | |||||||||||||||
Earnings(1)(millions of dollars) |
3,428 | 1,432 | 830 | 882 | 1,161 | |||||||||||||||
Prime product sales(2)(thousands of metric tons) |
27,788 | 26,567 | 26,606 | 25,780 | 25,637 | |||||||||||||||
Average capital employed (millions of dollars) |
14,608 | 14,099 | 13,645 | 13,839 | 13,814 | |||||||||||||||
Return on average capital employed (percent) |
23.5 | 10.2 | 6.1 | 6.4 | 8.4 | |||||||||||||||
Capital expenditures (millions of dollars) |
690 | 692 | 954 | 872 | 1,468 | |||||||||||||||
| (1) | Earnings included a $175 million extraordinary gain on asset divestitures in 2001. | |
| (2) | Prime product sales include ExxonMobil’ s share of equity-company volumes and finished-product transfers to the Downstream. Carbon-black oil volumes are excluded. |
2 0 0 4 F I N A N C I A L & O P E R A T I N G R E V I E W • E X X O N M O B I L C O R P O R A T I O N
82
Chemical Competitive Advantages
The implementation of focused, long-term strategies has produced competitive advantages that result in superior returns versus competition across the business cycle. These advantages include our business mix, investment discipline, petroleum integration, world-class operations, leading proprietary technologies, and product application expertise. Effective execution of our business strategies enables the Company to deliver strong earnings growth and returns, and strengthens our position as the world’s premier petrochemical company.
Premier Petrochemical Company
Return on average capital employed (10-year)
|
14 percent | |
Businesses ranked 1 or 2 by market share
|
>90 percent | |
Capital employed (at year end)
|
$15 billion | |
Prime product sales (tons)
|
28 million | |
Percent integrated capacity
|
>90 percent | |
Product marketing diversity
|
>150 countries |
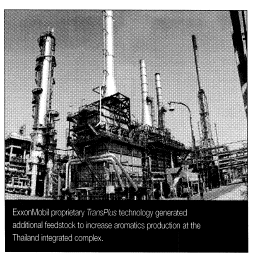
Businesses
| Worldwide Rank | ||
| Based on Market Share | ||
nCommodities |
||
Paraxylene
|
#1 | |
Olefins
|
#2 | |
Polyethylene
|
#2 | |
Polypropylene
|
#4 | |
nSpecialties |
||
Butyl Polymers
|
#1 | |
Fluids
|
#1 | |
Plasticizers/Oxo
|
#1 | |
Synthetics
|
#1 | |
Oriented Polypropylene Films
|
#1 | |
Adhesive Polymers
|
#1 | |
Petroleum Additives
|
#2 | |
Ethylene Elastomers
|
#2 |
CAPITALIZING ON CORE COMPETENCIES
ExxonMobil’s unique mix of chemical business lines delivers superior performance relative to competition throughout the business cycle. The Company holds strong positions in the supply chain for many of the largest-volume and highest-growth petrochemicals in the global economy. Specifically, we are:
| § | One of the largest producers of olefins, a basic petrochemical building block; | |||
| § | The largest worldwide producer of polyolefins, which include polyethylene, the largest-volume plastic; and polypropylene, one of the fastest-growing and most versatile polymers; and, | |||
| § | The largest global producer of paraxylene and benzene.Paraxylene is one of the fastest-growing petrochemicals and the main raw material for the manufacture of polyester fibers and polyethylene terephthalate (PET) recyclable bottles. Benzene is a primary building block for a broad array of products ranging from nylon to polystyrene. | |||
In addition to being a leading global supplier of primary petrochemicals, the Company also has premier positions in a diverse portfolio of less-cyclical specialty business lines. These leading specialty businesses include butyl polymers, ethylene elastomers, synthetic lubricant basestock fluids, petroleum additives, oriented polypropylene films, plasticizers, hydrocarbon and oxygenated fluids, oxo-alcohols, acids, and adhesive polymers. Strong competitive advantages are created from unique combinations of low-cost feedstocks, proprietary technology, operational excellence, product application expertise, and synergies among businesses. ExxonMobil continues to grow and strengthen these businesses through new product development and expansion into new markets.
CAPTURING FULL BENEFITS OF INTEGRATION
More than 90 percent of our owned and operated chemical capacity is adjacent to and integrated with our large refining complexes or gas processing plants. ExxonMobil’s long-standing emphasis on petroleum integration is a key component of our strong competitive position – one that is difficult for competitors to replicate. Manufacturing sites are designed and managed to
| B u s i n e s s M i x E n h a n c e s P r o f i t a b i l i t y |
Segment Earnings
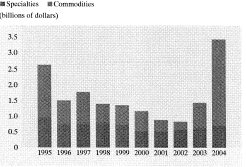
E X X O N M O B I L C O R P O R A T I O N • 2 0 0 4 F I N A N C I A L & O P E R A T I N G R E V I E W
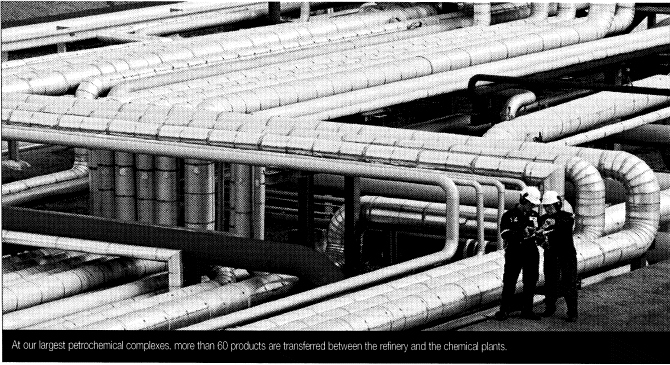
maximize synergies through optimized molecule management, coordinated technology development, joint facilities planning, and common shared systems and support functions.
The flexibility that comes from feedstock and fuels integration with world-scale refineries allows ExxonMobil Chemical to consistently outperform competition. Production plans are reviewed continuously and optimized using sophisticated models to identify the highest value for each process stream. Supply plans are also optimized on a regional and global level in response to changes in feedstock costs and market conditions.
CONTINUALLY REDUCING COSTS TO ACHIEVE BEST-IN-CLASS PERFORMANCE
Unit costs decreased 4 percent in 2004 as we continued to capture efficiencies. We maintain constant focus on reducing manufacturing, selling, and distribution costs. Work force productivity, a key underlying component, has improved 15 percent since 2001.
The Company’s demonstrated strength of focusing on safety, productivity, reliability, and quality increases the contribution of existing assets by identifying and rapidly capturing process improvements. Over the past three years, this program has delivered over 1 million tons per annum of reliability improvements. This is equivalent to the annual production of a world-scale steam cracker.
P
r o d u c t i v i t y I m p r o v e m e n t
(indexed; sales/workforce)

We are capturing energy savings opportunities at our facilities through the extensive use of our Global Energy Management System, a uniform set of best practices and technologies. The energy efficiency of our steam crackers, which use 60 percent of the Chemical company’s energy requirements, has improved 7 percent since 2002.
Implementation of our Global Enterprise Management System was also completed in 2004. This platform supports the use of common business practices across our global operations, enabling us to consistently meet the needs of our customers more effectively.
ExxonMobil Chemical has developed marketing tools, processes, and skills to fully support our businesses. Ultimately, the goal is to provide more value to our customers by better understanding their expectations and meeting those expectations with the optimum products and expected services at the right price.
BUILDING PROPRIETARY TECHNOLOGY
Technology is a major source of competitive advantage and differentiation. Our technology expertise enables us to process low-value feedstocks, achieve industry-leading yields, and increase effective capacity by debottlenecking our plants at significantly less than grassroots costs. We also use our application technology expertise to develop and tailor products to meet specific customer needs and provide profitable volume growth.
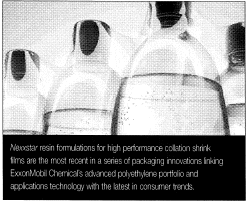
2 0 0 4 F I N A N C I A L & O P E R A T I N G R E V I E W • E X X O N M O B I L C O R P O R A T I O N
84
Selectively Investing in Globally Advantaged Projects and Businesses
Investment discipline is a cornerstone of ExxonMobil Chemical’s strategy. We seek investment opportunities that offer distinctive competitive advantages that will enhance returns above those generally available to industry. A highly structured approach to project evaluation, development, and execution contributes to effective project selection and implementation.
In 2004, the Company continued to focus on selective growth of our specialty businesses, low-cost debottleneck projects, and high-return efficiency projects. In addition, planning progressed on four major projects that will provide growth opportunities toward the end of this decade.
SELECTIVE INVESTING FOR FURTHER GROWTH
Growth of the Specialty Businesses
§
|
The Baton Rouge metallocene ethylene elastomers plant started up in early 2004. This one-of-a-kind, 90,000-ton-per-year capacity facility uses ExxonMobil’s Exxpol metallocene catalyst and a proprietary manufacturing process to make next-generation elastomers. This facility further strengthens our position as a premier supplier of ethylene elastomers. | |
§
|
An expansion of our Pensacola thermoplastic elastomers production plant will further strengthen our position as the leading supplier of thermoplastic vulcanizates. These products, commercialized under the Santoprene brand, have the performance and aesthetics of rubber and the processing ease of plastic. They are used in a wide variety of applications ranging from automotive to appliances. | |
§
|
Tonen, our Chemical affiliate in Japan, is increasing its capacity to meet rapidly growing demand for microporous film, a key component of batteries used in computers and cellular phones. |
Expansion of Existing Facilities
§
|
The Singapore, Kemya, and Yanpet steam crackers, and some of their associated derivative units, are being debottlenecked to meet the growing demand of our customers in Asia. | |
§
|
Other debottleneck projects planned for 2005 and 2006 include oxo-alcohols in Singapore, and polypropylene in Baton Rouge. | |
§
|
In 2004, we acquired Basell’s 50-percent interest in the CIPEN manufacturing joint venture, providing ExxonMobil with 100-percent ownership of the facility. This acquisition supports Exceed metallocene polyethylene growth. |
Major Projects
§
|
Project development activities continue on the Fujian integrated refining, petrochemical, and fuels marketing joint venture in China. This integrated project includes the construction of an 800,000-ton-per-year ethylene steam cracker, polyethylene and polypropylene units, and a 700,000-ton-per-year paraxylene unit. | |
§
|
A feasibility study for a second steam-cracking train in Singapore is being progressed. The new world-scale train would be located at and integrated with the existing ExxonMobil Singapore complex and would include derivative units. | |
§
|
A joint feasibility study for a world-scale cracker and derivatives complex is progressing between Qatar Petroleum and ExxonMobil. The complex will utilize ethane feedstock from new gas development projects in Qatar’s North Field, and supply competitively-advantaged products to Asia. | |
§
|
ExxonMobil and Pequiven SA are jointly progressing a petrochemical project in Venezuela that would include a steam cracker and derivatives units fed with advantaged ethane. |
Project Start-Ups
| Capacity(1) | ||||||||||
| (metric tons | ||||||||||
| Location | per year) | |||||||||
| Olefins/Polyolefins | ||||||||||
2004 |
Ethylene Glycol (50% interest) | Yanpet | 52,000 | |||||||
2004 |
Polyethylene (acquisition) | NDG, France | 220,000 | |||||||
2004 |
Paraxylene | Sriracha, Thailand | 45,000 | |||||||
2005 |
Ethylene (50% interest) | Yanpet | 78,000 | |||||||
2005 |
Polyethylene (50% interest) | Yanpet | 47,000 | |||||||
2006 |
Ethylene | Kemya | 30,000 | |||||||
2006 |
Ethylene | Singapore | 75,000 | |||||||
2006 |
Polyethylene | Singapore | 45,000 | |||||||
2006 |
Polypropylene | Baton Rouge, Louisiana | 60,000 | |||||||
| Less-Cyclical Specialty Businesses | ||||||||||
2004 |
Ethylene Elastomers | Baton Rouge, Louisiana | 90,000 | |||||||
2005 |
Coated OPP Film | Virton, Belgium | 16,000 | |||||||
2006 |
Thermoplastic Elastomers | Pensacola, Florida | 1 line | |||||||
2005 |
Oxo-Alcohols | Singapore | 40,000 | |||||||
2006 |
Polyethylene Film | Nasu, Japan | 25,000 | (2) | ||||||
| (1) | ExxonMobil equity share of capacity addition. | |
| (2) | Square meters per year. |
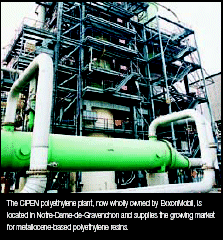
EXXON MOBIL CORPORATION • 2004 FINANCIAL & OPERATING REVIEW
C h e m i c a l 85
Key Products – Meeting Diverse Consumer Needs
In addition to being a premier supplier of olefins, polyolefins and aromatics, ExxonMobil Chemical has strong market positions in a wide variety of other petrochemicals.
| PVC, other ethylene derivatives Pipe, electrical, medical Ethylene Polyethylene Flexible food packaging Milk bottles, storage containers Automotive fuel tanks, containers Ethylene Glycol PET, PBT Soda bottles Polyester fibers Synthetics / PAO Lube base fluids Ethylene Elastomers Seals, cable insulation, Appliances, household goods Isopropyl Alcohol Rubbing alcohol, coatings Propylene Polypropylene Interior/Exterior automobile trim parts Appliances Diapers, personal care Oriented PP Film Packaging Petroleum Additives Motor and gear lubricants Steam Cracking Higher Olefins Oxo-Alcohols Surfactants Catalytic Cracking Plasticizers Flexible PVC Specialty Fluids Reaction dilutants, inks Butylenes Butyl Rubber Tires Syringe parts, vial closures Hoses, tubing Methyl Ethyl Ketone Tapes, inks, coatings Pentenes Adhesive Polymers Tapes and labels Diaper assembly Glue, road marking Middle Distillates Benzene Polystyrene Packaging, construction Reforming Cyclo Hexane Nylon Textile, flooring, auto parts Toluene Solvents Paraxylene PET, PBT Soda bottles Polyester fibers Orthoxylene Phthalic Anhydride Plasticizers Aromatic Fluids Pesticides / Herbicides Solvents Dearomatized Fluids Reprographics, drilling muds n Olefins, Polyolefins, Aromatics, Other l Less-Cyclical Specialties 2 0 0 4 F I N A N C I A L & O P E R A T I N G R E V I E W o E X X O N M O B I L C O R P O R A T I O N |
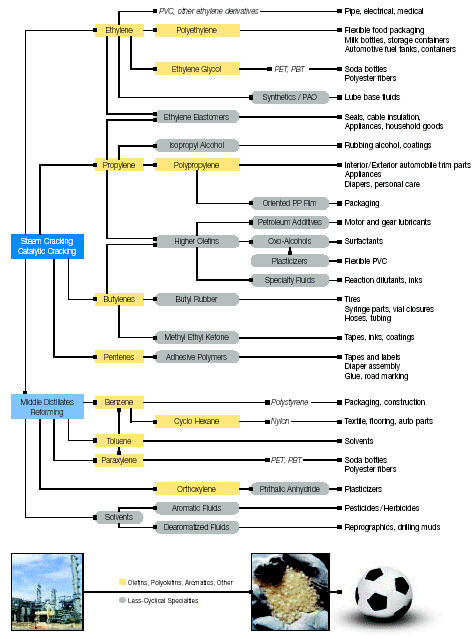
2004 FINANCIAL & OPERATING REVIEW • EXXON MOBIL CORPORATION
86
Chemical Operating Statistics
LARGE / INTEGRATED PRODUCTION COMPLEXES (Based on size or breadth of product slate)
| Capacity (millions of tons per year) | Ethylene | Paraxylene | Polyethylene | Polypropylene | Additional Products | |||||||||||||||||||||||||||||||||||||||
North America |
||||||||||||||||||||||||||||||||||||||||||||
Baton Rouge, Louisiana |
1.0 | — | 1.3 | 0.3 | P | B | E | A | F | O | ||||||||||||||||||||||||||||||||||
Baytown, Texas |
2.2 | 0.6 | — | 0.8 | P | B | F | |||||||||||||||||||||||||||||||||||||
Beaumont, Texas |
0.8 | 0.3 | 1.0 | — | P | S | ||||||||||||||||||||||||||||||||||||||
Mont Belvieu, Texas |
— | — | 1.0 | — | ||||||||||||||||||||||||||||||||||||||||
Sarnia, Ontario |
0.3 | — | 0.5 | — | P | F | ||||||||||||||||||||||||||||||||||||||
Europe |
||||||||||||||||||||||||||||||||||||||||||||
Antwerp, Belgium |
0.5 | — | 0.3 | — | P | F | O | |||||||||||||||||||||||||||||||||||||
Fawley, England |
0.1 | — | — | — | P | B | F | O | ||||||||||||||||||||||||||||||||||||
Fife, Scotland |
0.4 | — | — | — | ||||||||||||||||||||||||||||||||||||||||
Meerhout, Belgium |
— | — | 0.5 | — | ||||||||||||||||||||||||||||||||||||||||
Notre-Dame-de-Gravenchon, France |
0.4 | — | 0.4 | 0.4 | P | B | E | A | S | |||||||||||||||||||||||||||||||||||
Rotterdam, Netherlands |
— | 0.6 | — | — | O | |||||||||||||||||||||||||||||||||||||||
Middle East |
||||||||||||||||||||||||||||||||||||||||||||
Al-Jubail, Saudi Arabia |
0.6 | — | 0.6 | — | ||||||||||||||||||||||||||||||||||||||||
Yanbu, Saudi Arabia |
0.9 | — | 0.6 | 0.2 | P | |||||||||||||||||||||||||||||||||||||||
Asia Pacific |
||||||||||||||||||||||||||||||||||||||||||||
Kawasaki, Japan |
0.5 | 0.3 | — | — | P | B | A | F | ||||||||||||||||||||||||||||||||||||
Singapore |
0.8 | 0.8 | 0.6 | 0.3 | P | F | O | |||||||||||||||||||||||||||||||||||||
Sriracha, Thailand |
— | 0.5 | — | — | F | |||||||||||||||||||||||||||||||||||||||
All other |
0.6 | 0.3 | 0.4 | 0.1 | ||||||||||||||||||||||||||||||||||||||||
Total worldwide |
9.1 | 3.4 | 7.2 | 2.1 | ||||||||||||||||||||||||||||||||||||||||
| P | Propylene | |
| B | Butyl | |
| E | Ethylene Elastomers | |
| A | Adhesive Polymers | |
| F | Fluids | |
| O | Oxo | |
| S | Synthetics |
OTHER MANUFACTURING LOCATIONS (1)
| Location | Product | |||||||||||||||
United States |
||||||||||||||||
Bayway, New Jersey (2) |
l | |||||||||||||||
Chalmette, Louisiana |
n | |||||||||||||||
Edison, New Jersey |
l | |||||||||||||||
Houston, Texas |
n | |||||||||||||||
Jeffersonville, Indiana |
5 | |||||||||||||||
LaGrange, Georgia |
w | |||||||||||||||
Pensacola, Florida |
5 | |||||||||||||||
Plaquemine, Louisiana |
5 | |||||||||||||||
Shawnee, Oklahoma |
w | |||||||||||||||
Stratford, Connecticut |
w | |||||||||||||||
Canada |
||||||||||||||||
Belleville, Ontario |
w | |||||||||||||||
Dartmouth, Nova Scotia |
l | |||||||||||||||
Latin America |
||||||||||||||||
Campana, Argentina |
l | |||||||||||||||
Ensenada, Argentina |
l | |||||||||||||||
Managua, Nicaragua |
l | |||||||||||||||
Paulinia, Brazil |
l | |||||||||||||||
Europe |
||||||||||||||||
Amsterdam, Netherlands |
l | |||||||||||||||
Augusta, Italy |
n | |||||||||||||||
Brindisi, Italy |
w | |||||||||||||||
Cologne, Germany |
5 | |||||||||||||||
Fos-sur-Mer, France |
n | |||||||||||||||
Geleen, Netherlands |
5 | |||||||||||||||
Harnes, France (2) |
l | |||||||||||||||
Ingolstadt, Germany |
n | |||||||||||||||
Karlsruhe, Germany |
n | |||||||||||||||
Kerkrade, Netherlands |
w | |||||||||||||||
Newport, Wales |
5 | |||||||||||||||
Trecate, Italy |
l | |||||||||||||||
Virton, Belgium |
w | |||||||||||||||
Asia Pacific |
||||||||||||||||
Adelaide, Australia (2) |
l | |||||||||||||||
Altona, Australia |
n | 5 | ||||||||||||||
Botany Bay, Australia |
n | 5 | ||||||||||||||
Jinshan, China |
5 | |||||||||||||||
Kashima, Japan |
5 | |||||||||||||||
Nasu, Japan |
w | |||||||||||||||
Panyu, China |
l | |||||||||||||||
Sakai, Japan |
n | l | ||||||||||||||
Wakayama, Japan |
n | l | ||||||||||||||
Yosu, South Korea |
5 | |||||||||||||||
| (1) | Includes joint venture plants, with the exception of the Infineum additives joint ventures. | |
| (2) | Facility mothballed. | |
| n | Olefins/Aromatics | |
| 5 | Polymers | |
| l | Other Chemicals | |
| w | Films |
EXXON MOBIL CORPORATION • 2004 FINANCIAL & OPERATING REVIEW
C h e m i c a l 87
VOLUMES
| Includes ExxonMobil’s share of equity companies | 2004 | 2003 | 2002 | 2001 | 2000 | |||||||||||||||
Worldwide Production Volumes |
||||||||||||||||||||
(thousands of metric tons) |
||||||||||||||||||||
Ethylene |
8,271 | 7,567 | 7,539 | 7,320 | 6,725 | |||||||||||||||
Polyethylene |
6,248 | 6,091 | 6,235 | 5,768 | 5,507 | |||||||||||||||
Polypropylene |
1,885 | 1,965 | 1,944 | 1,701 | 1,297 | |||||||||||||||
Paraxylene |
2,826 | 2,531 | 2,275 | 2,088 | 2,326 | |||||||||||||||
Prime Product Sales Volumes(1)
|
||||||||||||||||||||
(thousands of metric tons) |
||||||||||||||||||||
Americas(2) |
12,842 | 11,939 | 12,614 | 12,278 | 12,913 | |||||||||||||||
Europe/Middle East/Africa |
7,334 | 7,180 | 7,002 | 6,661 | 6,424 | |||||||||||||||
Asia Pacific |
7,612 | 7,448 | 6,990 | 6,841 | 6,300 | |||||||||||||||
Total worldwide |
27,788 | 26,567 | 26,606 | 25,780 | 25,637 | |||||||||||||||
Prime Product Sales Volumes(1)
|
||||||||||||||||||||
(thousands of metric tons) |
||||||||||||||||||||
Less-cyclical specialty businesses |
6,324 | 6,113 | 6,022 | 5,711 | 6,030 | |||||||||||||||
Olefins/polyolefins/aromatics/other |
21,464 | 20,454 | 20,584 | 20,069 | 19,607 | |||||||||||||||
Total |
27,788 | 26,567 | 26,606 | 25,780 | 25,637 | |||||||||||||||
| (1) | Prime product sales include ExxonMobil’s share of equity-company volumes and finished product transfers to the Downstream. Carbon-black oil volumes are excluded. | |
| (2) | Includes the United States, Canada, and Latin America. |
2004 Prime Product Sales Volumes

2004 FINANCIAL & OPERATING REVIEW • EXXON MOBIL CORPORATION
88
Frequently Used Terms
Listed below are definitions of several of ExxonMobil’s key business and financial performance measures and other terms. These definitions are provided to facilitate understanding of the terms and their calculation. In the case of financial measures that we believe constitute “non-GAAP financial measures” under Securities and Exchange Commission Regulation G, we provide a reconciliation to the most comparable Generally Accepted Accounting Principles (GAAP) measure and other information required by that rule.
EARNINGS EXCLUDING MERGER EXPENSES,
DISCONTINUED OPERATIONS, ACCOUNTING CHANGE, AND OTHER SPECIAL ITEMS
In addition to reporting U.S. GAAP defined net income, ExxonMobil also presents a measure of earnings that excludes merger effects, earnings from discontinued operations, a required accounting change, and other quantified special items. Earnings excluding the aforementioned items is a non-GAAP financial measure, and is included to facilitate comparisons of base business performance across periods. A reconciliation to net income is shown on page 16. We also refer to earnings excluding merger expenses, discontinued operations, accounting change and other special items as normalized earnings. Earnings per share amounts use the same average common shares outstanding as used for the calculation of net income per common share and net income per common share – assuming dilution.
OPERATING COSTS
Operating costs are the combined total of production, manufacturing, selling, general, administrative, exploration, depreciation, and depletion expenses from the Consolidated Statement of Income and ExxonMobil’s share of similar costs for equity companies. Operating costs are the costs during the period to produce, manufacture, and otherwise prepare the Company’s products for sale – including energy costs, staffing, maintenance, and other costs to explore for and produce oil and gas and operate refining and chemical plants. Distribution and marketing expenses are also included. Operating costs exclude the cost of raw materials, taxes, interest expense and separately reported merger-related expenses. These expenses are on a before-tax basis. While ExxonMobil’s management is responsible for all revenue and expense elements of net income, operating costs, as defined below, represent the expenses most directly under management’s control. Information regarding these costs is therefore useful for investors and ExxonMobil management in evaluating management’s performance. In 2004, cost increases associated with higher energy prices, adverse foreign exchange impacts, and new operations were partly offset by efficiency initiatives captured in all business lines.
Reconciliation of operating costs
| 2004 | 2003 | 2002 | ||||||||||
| (millions of dollars) | ||||||||||||
From ExxonMobil’s Consolidated Statement of Income |
||||||||||||
Total costs and other deductions |
256,794 | 214,772 | 186,996 | |||||||||
Less: |
||||||||||||
Crude oil and product purchases |
139,224 | 107,658 | 90,950 | |||||||||
Merger-related expenses |
– | – | 410 | |||||||||
Interest expense |
638 | 207 | 398 | |||||||||
Excise taxes |
27,263 | 23,855 | 22,040 | |||||||||
Other taxes and duties |
40,954 | 37,645 | 33,572 | |||||||||
Income applicable to minority and preferred interests |
776 | 694 | 209 | |||||||||
Subtotal |
47,939 | 44,713 | 39,417 | |||||||||
ExxonMobil’s share of equity-company expenses |
4,209 | 3,937 | 3,800 | |||||||||
Total operating costs excluding merger expenses |
52,148 | 48,650 | 43,217 | |||||||||
Components of operating costs
| 2004 | 2003 | 2002 | ||||||||||
| (millions of dollars) | ||||||||||||
From ExxonMobil’s Consolidated Statement of Income |
||||||||||||
Production and manufacturing expenses |
23,225 | 21,260 | 17,831 | |||||||||
Selling, general, and administrative expenses |
13,849 | 13,396 | 12,356 | |||||||||
Depreciation and depletion |
9,767 | 9,047 | 8,310 | |||||||||
Exploration expenses, including dry holes |
1,098 | 1,010 | 920 | |||||||||
Subtotal |
47,939 | 44,713 | 39,417 | |||||||||
ExxonMobil’s share of equity-company expenses |
4,209 | 3,937 | 3,800 | |||||||||
Total operating costs excluding merger expenses |
52,148 | 48,650 | 43,217 | |||||||||
EXXON MOBIL CORPORATION • 2004 FINANCIAL & OPERATING REVIEW
F R E Q U E N T L Y U S E D T E R M S 89
CAPITAL EMPLOYED
Capital employed is a measure of net investment. When viewed from the perspective of how the capital is used by the businesses, it includes ExxonMobil’s net share of property, plant, and equipment and other assets less liabilities, excluding both short-term and long-term debt. When viewed from the perspective of the sources of capital employed in total for the Corporation, it includes ExxonMobil’s share of total debt and shareholders’ equity. Both of these views include ExxonMobil’s share of amounts applicable to equity companies, which the Corporation believes should be included to provide a more comprehensive measure of capital employed.
| 2004 | 2003 | 2002 | ||||||||||
| (millions of dollars) | ||||||||||||
Business uses: asset and liability perspective |
||||||||||||
Total assets |
195,256 | 174,278 | 152,644 | |||||||||
Less liabilities and minority share of assets and liabilities
|
||||||||||||
Total current liabilities excluding notes and loans payable |
(39,701 | ) | (33,597 | ) | (29,082 | ) | ||||||
Total long-term liabilities excluding long-term debt and equity of minority
and preferred shareholders in affiliated companies |
(41,554 | ) | (37,839 | ) | (35,449 | ) | ||||||
Minority share of assets and liabilities |
(5,285 | ) | (4,945 | ) | (4,210 | ) | ||||||
Add ExxonMobil share of debt-financed equity-company net assets |
3,914 | 4,151 | 4,795 | |||||||||
Total capital employed |
112,630 | 102,048 | 88,698 | |||||||||
Total corporate sources: debt and equity perspective
|
||||||||||||
Notes and loans payable |
3,280 | 4,789 | 4,093 | |||||||||
Long-term debt |
5,013 | 4,756 | 6,655 | |||||||||
Shareholders’ equity |
101,756 | 89,915 | 74,597 | |||||||||
Less minority share of total debt |
(1,333 | ) | (1,563 | ) | (1,442 | ) | ||||||
Add ExxonMobil share of equity-company debt |
3,914 | 4,151 | 4,795 | |||||||||
Total capital employed |
112,630 | 102,048 | 88,698 | |||||||||
RETURN ON AVERAGE CAPITAL EMPLOYED (ROCE)
Return on average capital employed is a performance measure ratio. From the perspective of the business segments, ROCE is annual business segment earnings divided by average business segment capital employed (average of beginning and end-of-year amounts). These segment earnings include ExxonMobil’s share of segment earnings of equity companies, consistent with our capital employed definition, and exclude the cost of financing. The Corporation’s total ROCE is net income excluding the after-tax cost of financing, divided by total corporate average capital employed. The Corporation has consistently applied its ROCE definition for many years, and views it as the best measure of historical capital productivity in our capital-intensive, long-term industry, both to evaluate management’s performance and to demonstrate to shareholders that capital has been used wisely over the long term. Additional measures, which tend to be more cash-flow based, are used for future investment decisions.
Return on Average Capital Employed
| 2004 | 2003 | 2002 | ||||||||||
| (millions of dollars) | ||||||||||||
Net income |
25,330 | 21,510 | 11,460 | |||||||||
Financing costs (after tax) |
||||||||||||
Third-party debt |
(137 | ) | (69 | ) | (81 | ) | ||||||
ExxonMobil share of equity companies |
(185 | ) | (172 | ) | (227 | ) | ||||||
All other financing costs – net(1) |
54 | 1,775 | (127 | ) | ||||||||
Total financing costs |
(268 | ) | 1,534 | (435 | ) | |||||||
Earnings excluding financing costs |
25,598 | 19,976 | 11,895 | |||||||||
Average capital employed |
107,339 | 95,373 | 88,342 | |||||||||
Return on average capital employed – corporate total |
23.8 | % | 20.9 | % | 13.5 | % | ||||||
| (1) | “All other financing costs – net” in 2003 includes interest income (after tax) associated with the settlement of a U.S. tax dispute. |
2004 FINANCIAL & OPERATING REVIEW • EXXON MOBIL CORPORATION
90
TOTAL SHAREHOLDER RETURN
Shareholder return measures the change in value of an investment in stock over a specified period of time, assuming dividend reinvestment. We calculate shareholder return over a particular measurement period by: dividing (1) the sum of (a) the cumulative value of dividends received during the measurement period, assuming reinvestment, plus (b) the difference between the stock price at the end and at the beginning of the measurement period; by (2) the stock price at the beginning of the measurement period. For this purpose, we assume dividends are reinvested in stock at market prices at approximately the same time actual dividends are paid. Shareholder return is usually quoted on an annualized basis.
CAPITAL AND EXPLORATION EXPENDITURES (Capex)
Capital and exploration expenditures are the combined total of additions at cost to property, plant, and equipment and exploration expenses on a before-tax basis from the Consolidated Statement of Income. ExxonMobil’s Capex includes its share of similar costs for equity companies. Capex excludes depreciation on the cost of exploration support equipment and facilities recorded to property, plant, and equipment when acquired. While ExxonMobil’s management is responsible for all investments and elements of net income, particular focus is placed on managing the controllable aspects of this group of expenditures.
FINDING COSTS
Finding costs per oil-equivalent barrel is a performance measure that is calculated using the Exploration portion of Upstream capital and exploration expenditures divided by new field resource additions (in oil-equivalent barrels). ExxonMobil refers to new discoveries and acquisitions of discovered, but undeveloped, resources as new field resource additions. It includes quantities of oil and gas that are not yet classified as proved reserves, but which ExxonMobil believes will likely be moved into the proved reserves category and produced in the future.
| 2004 | 2003 | 2002 | ||||||||||
Exploration portion of Upstream capital & exploration expenditures (millions of dollars) |
1,283 | 1,215 | 1,310 | |||||||||
New field resource additions (millions of oil-equivalent barrels) |
2,940 | 2,110 | 2,150 | |||||||||
Finding cost per oil-equivalent barrel (dollars) |
0.44 | 0.58 | 0.61 | |||||||||
LIQUIDS AND NATURAL GAS RESERVES
In this report, we use the term “reserves” to mean quantities of oil and gas that ExxonMobil has determined to be reasonably certain of recovery under existing economic and operating conditions on the basis of our long-standing, rigorous management review process. We only book reserves when we have made significant funding commitments for the related projects. In this report, we aggregate reserves of consolidated and equity companies, excluding royalties and quantities due others, since ExxonMobil does not view these reserves differently from a management perspective. To reflect management’s view of ExxonMobil’s total liquids reserves, oil and gas reserves in this report also include tar sands reserves from Canadian Syncrude operations, which are reported separately as mining reserves in our SEC filings. Tar sands reserves included in this report totaled 757 million barrels at year-end 2004, 781 million barrels at year-end 2003, 800 million barrels at year-end 2002, 821 million barrels at year-end 2001, and 610 million barrels at year-end 2000. We determine reserves based on our long-term view of future price levels consistent with our investment decisions. Based on Securities and Exchange Commission guidance, ExxonMobil is also stating, for the first time, our 2004 results to reflect the impacts to the proved reserve base utilizing December 31 liquids and natural gas prices (“year-end price/cost revisions”). On this basis, 2004 year-end reserves, including year-end price/cost revisions, totaled 21.7 billion oil-equivalent barrels. Excluding year-end price/cost revisions, 2004 reserves totaled 22.2 billion oil-equivalent barrels.
RESOURCES, RESOURCE BASE, AND RECOVERABLE RESOURCES
Resources, resource base, recoverable oil, recoverable hydrocarbons, recoverable resources, and similar terms used in this report include quantities of oil and gas that are not yet classified as proved reserves, but which ExxonMobil believes will likely be moved into the proved reserves category and produced in the future.
RESERVES REPLACEMENT RATIO
Reserves replacement ratio is a performance measure that is calculated using proved oil-equivalent reserves additions divided by oil-equivalent production. Both proved reserves additions and production include amounts applicable to equity companies. The ratio usually reported by ExxonMobil excludes sales and year-end price/cost revisions, and includes Canadian tar sands operations in both additions and production volumes. See the definition of “liquids and natural gas reserves” above. When reporting the ratio, the inclusions and exclusions are listed, as shown on pages 60 and 61.
EXXON MOBIL CORPORATION • 2004 FINANCIAL & OPERATING REVIEW
F R E Q U E N T L Y U S E D T E R M S 91
RESERVES REPLACEMENT COSTS
Reserves replacement costs per oil-equivalent barrel is a performance measure ratio. Reserves replacement costs per barrel are costs incurred in property acquisition and exploration, plus costs incurred in development activities divided by proved oil-equivalent reserves additions, excluding sales. Both the costs incurred and the proved reserves additions include amounts applicable to equity companies as well as Canadian tar sands operations and exclude year-end price/cost revisions. See the definition of “liquids and natural gas reserves” above.
| 2004 | 2003 | 2002 | ||||||||||
Costs incurred |
(millions of dollars) | |||||||||||
Property acquisition costs |
134 | 45 | 187 | |||||||||
Exploration costs |
1,255 | 1,181 | 1,163 | |||||||||
Development costs |
9,122 | 9,856 | 8,101 | |||||||||
Total costs incurred |
10,511 | 11,082 | 9,451 | |||||||||
Oil-equivalent reserves additions |
(millions of barrels) | |||||||||||
Performance-related revisions |
140 | 619 | 597 | |||||||||
Improved recovery |
28 | 116 | 95 | |||||||||
Extensions/discoveries |
1,809 | 961 | 1,210 | |||||||||
Purchases |
11 | 2 | — | |||||||||
Total oil-equivalent reserves additions |
1,988 | 1,698 | 1,902 | |||||||||
Reserves replacement costs |
5.29 | 6.53 | 4.97 | |||||||||
USES OF CASH
“Uses of cash” means the net sum of additions to property, plant and equipment;
additional investments and advances net of collection; changes in minority interests; the net cost
of common stock acquired to offset the dilutive impact of shares issued in conjunction with company
benefit plans; effects of exchange rate changes on cash; and cash dividends to ExxonMobil
shareholders and to minority interests from the Consolidated Statement of Cash Flows. It does not
include increases in restricted cash and cash equivalents, which relates to the appeal of pending
litigation.
CASH FLOW FROM OPERATIONS AND ASSET SALES
Cash flow from operations and asset sales is the sum of the net cash provided by operating activities and proceeds from sales of subsidiaries, investments, and property, plant, and equipment from the Summary Statement of Cash Flows. This cash flow is the total sources of cash from both operating the Corporation’s assets and from the divesting of assets. The Corporation employs a long-standing and regular disciplined review process to ensure that all assets are contributing to the Corporation’s strategic and financial objectives. Assets are divested when they are no longer meeting these objectives, or are worth considerably more to others. Because of the regular nature of this activity, we believe it is useful for investors to consider sales proceeds together with cash provided by operating activities when evaluating cash available for investment in the business and financing activities, including shareholder distributions.
| 2004 | 2003 | 2002 | ||||||||||
| (millions of dollars) | ||||||||||||
Net cash provided by operating activities |
40,551 | 28,498 | 21,268 | |||||||||
Sales of subsidiaries, investments and property, plant, and equipment |
2,754 | 2,290 | 2,793 | |||||||||
Cash flow from operations and asset sales |
43,305 | 30,788 | 24,061 | |||||||||
2004 FINANCIAL & OPERATING REVIEW • EXXON MOBIL CORPORATION
92
Index |
||||
Acreage
|
58 | |||
Africa
|
44-47 | |||
Americas gas market
|
36 | |||
Asia Pacific
|
54-55 | |||
Balance sheet
|
21 | |||
Business strategies and competitive advantages
|
4-5, 25-29, 65-66, 81-83 | |||
Canada
|
37 | |||
Capital and exploration expenditures
|
4, 18-19, 91 | |||
Capital employed
|
4, 17, 89 | |||
Cash flow
|
5,89 | |||
Cash flow statement
|
23 | |||
Chemical businesses
|
82 | |||
Chemical capacity
|
86 | |||
Chemical products
|
85 | |||
Chemical projects
|
84 | |||
Chemical results
|
81 | |||
Chemical volumes and revenues
|
87 | |||
Depreciation and depletion
|
20 | |||
Dividend and shareholder information
|
6 | |||
Downstream results
|
65 | |||
Earnings
|
2, 88 | |||
Earnings, business segments
|
16 | |||
Earnings, oil and gas
|
62 | |||
Energy management
|
15, 34, 55, 68 | |||
Energy outlook
|
7-9 | |||
Europe
|
40-43 | |||
European gas market
|
41 | |||
Financial highlights
|
2 | |||
Finding costs
|
30, 90 | |||
Frequently used terms
|
88 | |||
Fuels Marketing
|
70-71 | |||
Gas to liquids
|
12, 49 | |||
Global functional organization
|
5, 28 | |||
Heavy oil
|
38 | |||
Income statement
|
22 | |||
Integration
|
67, 82-83 | |||
Key financial ratios
|
2 | |||
LNG
|
9, 41, 49-50 | |||
Lubricants and Specialties
|
72-73 | |||
Middle East
|
48-50 | |||
Molecule management
|
13, 68 | |||
Net income per barrel
|
25 | |||
Operating costs
|
20, 88 | |||
Petroleum product sales
|
78 | |||
Power
|
55 | |||
Production volumes
|
56-57 | |||
Property, plant, and equipment
|
20 | |||
Refinery utilization
|
67, 76 | |||
Refining and Supply
|
66-69 | |||
Refining capacity
|
74-76 | |||
Reserves and resources
|
29-31, 59-61, 91 | |||
Reserves replacement costs
|
61, 90 | |||
Reserves replacement ratio
|
60, 91 | |||
Resource development cost
|
33 | |||
Retail sites
|
77 | |||
Return on average capital employed
|
17, 29, 65, 81, 89 | |||
Russia and Caspian
|
51-53 | |||
Safety, health and environment
|
4, 14-15 | |||
South America
|
39 | |||
Technology (manufacturing and product)
|
12-13 | |||
Technology (Upstream)
|
10-11, 27 | |||
Tight gas
|
36 | |||
Total shareholder return
|
2, 6, 90 | |||
United States
|
34-35 | |||
Upstream development project summary
|
32 | |||
Upstream production profile
|
26-27 | |||
Upstream results
|
25 | |||
Wells, net drilled
|
58 |
Exxon Mobil Corporation has numerous affiliates, many with names that include ExxonMobil, Exxon, Esso, and Mobil. For convenience and simplicity, terms like Corporation, company, our, we, and its are sometimes used as abbreviated references to specific affiliates or affiliate groups. Abbreviated references describing global or regional operational organizations and global or regional business lines are also sometimes used for convenience and simplicity. Similarly, ExxonMobil has business relationships with thousands of customers, suppliers, governments, and others. Words like venture, joint venture, partnership, co-venturer, and partner are used to indicate business relationships involving common activities and interests, and those words may not indicate precise legal relationships.
The following terms are trademarks, service marks, or proprietary process names of Exxon Mobil Corporation or its affiliates: AGC-21, Avitat, Bengal Traders, EMpower, Esso, Exceed, Exxon, Exxpol, GO-fining, Hydrofining, Mobil, Mobil 1, Mobil 1 Extended Performance, Mobil Clean 5000, Mobil Clean 7500, MSDW-2, Nexxstar, On the Run, Santoprene, SCANfining, Speedpass, Tigermarket, TransPlus, and Vistamaxx.
The following third-party trademarks or service marks, referenced in the text of this report, are owned by the entities indicated: Aston Martin (Aston Martin Lagonda Limited); Bentley (Bentley Motors Limited); BMW (Bayerische Motoren Werke AG); Cadillac and Corvette (General Motors Corporation); Chrysler (DaimlerChrysler AG); Dodge (DaimlerChrysler AG); Doutor (Doutor Coffee Co. Ltd.); Formula 1 (Formula One Licensing BV); Innscor (Innscor Africa Limited); McLaren (McLaren International Limited); Mercedes (DaimlerChrysler AG); Nebula-20 (Akzo Nobel); Porsche (Dr. Ing, h.c. F. Porsche AG); Professional Pilot (Queensmith Communications Corp.); Saab (Saab AB); 7-Eleven (7-Eleven, Inc.); Tesco (Tesco Stores Limited); Tim Hortons (TDL Marks Corporation); Toyota (Toyota Jidosha KK); and West (Reemtsma Cigarettenfabriken GmbH).
EXXON MOBIL CORPORATION • 2004 FINANCIAL & OPERATING REVIEW
| WHETSTONE DESIGN LAB / RBMM | (C)2005 EXXON MOBIL CORPORATION | PRINTED IN U.S.A. | ||
| General Information | ||||
| Corporate Headquarters | ||||
| Exxon Mobil Corporation | ||||
| 5959 Las Colinas Boulevard | ||||
| Irving, TX 75039-2298 | ||||
| Additional copies may be | ||||
| obtained by writing or phoning: | ||||
| Phone: 972-444-1157 | ||||
| Fax: 972-444-1505 | ||||
| Shareholder Relations | ||||
| Exxon Mobil Corporation | ||||
| P.O. Box 140369 | ||||
| Irving, TX 75014-0369 | ||||
| Market Information | ||||
| The New York Stock Exchange is the principal exchange | ||||
| on which Exxon Mobil Corporation common stock | ||||
| (symbol XOM) is traded. | ||||
| Annual Meeting | ||||
| The 2005 Annual Meeting of Shareholders will be held | ||||
| at 9:00 a.m. Central Time on Wednesday, May 25, at: | ||||
| The Morton H. Meyerson Symphony Center | ||||
| 2301 Flora Street | ||||
| Dallas, Texas 75201 | ||||
| The meeting will be audiocast live on the Internet. Instructions for listening to this audiocast will be available on the Internet at www.exxonmobil.com approximately one week prior to the event. | ||||
 |

5959 Las Colinas Boulevard
Irving, Texas 75039-2298
www.exxonmobil.com