| ExxonMobil Taking on the world’s toughest energy challenges. 2011 Financial & Operating Review |
| ExxonMobil Taking on the world’s toughest energy challenges. 2011 Financial & Operating Review |
 |
Financial & Operating Summary |
1 | |||
Business Model |
2 | |||
Competitive Advantages |
3 | |||
Global Operations |
4 | |||
Upstream |
6 | |||
Downstream |
52 | |||
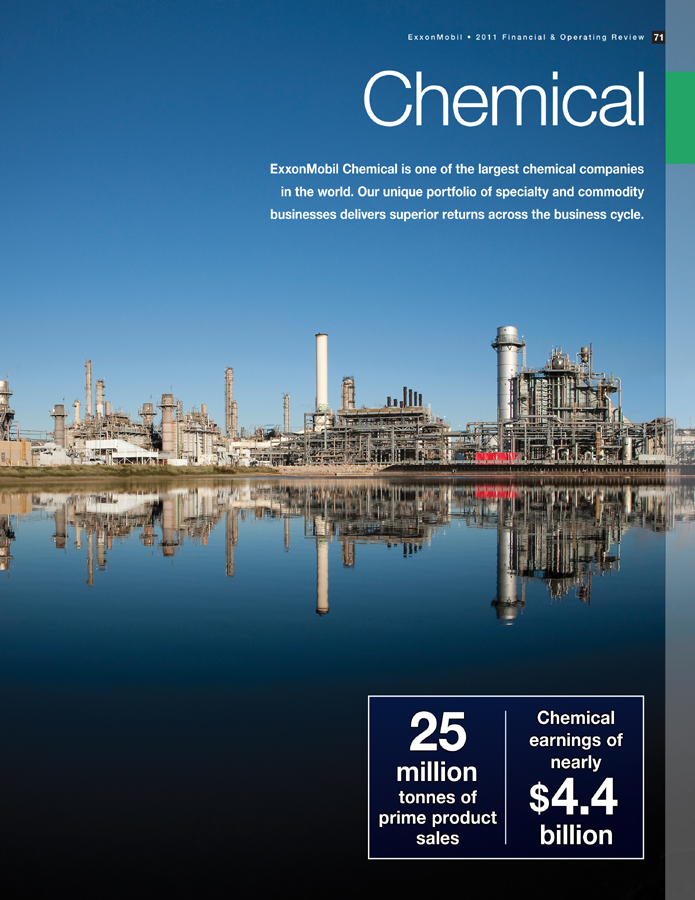
Chemical |
70 | |||
Financial Information |
84 | |||
Frequently Used Terms |
93 | |||
Index |
96 | |||
General Information |
97 |
 |
| Average | Return on | Capital and | ||||||||||||||
| Earnings After | Capital | Average Capital | Exploration | |||||||||||||
| (millions of dollars, unless noted) | Income Taxes | Employed | (1) | Employed (%) | (1) | Expenditures | (1) | |||||||||
Upstream |
34,439 | 129,807 | 26.5 | 33,091 | ||||||||||||
Downstream |
4,459 | 23,388 | 19.1 | 2,120 | ||||||||||||
Chemical |
4,383 | 19,798 | 22.1 | 1,450 | ||||||||||||
Corporate and Financing |
(2,221 | ) | (2,272 | ) | N.A. | 105 | ||||||||||
Total |
41,060 | 170,721 | 24.2 | 36,766 | ||||||||||||
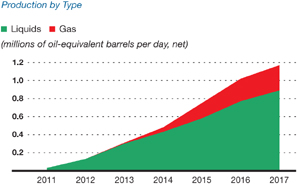
Liquids
production (net, thousands of barrels per day) |
2,312 | |||
Natural gas production available for sale (net, millions of cubic feet per day) |
13,162 | |||
Oil-equivalent production(2) (net, thousands of oil-equivalent barrels per day) |
4,506 | |||
Refinery
throughput (thousands of barrels per day) |
5,214 | |||
Petroleum
product sales (thousands of barrels per day) |
6,413 | |||
Chemical
prime product sales (thousands of tonnes) |
25,006 |
Safety performance remains strong in industry
|
Total shareholder return of 19 percent(1) | |
Strong cash flow from operations and asset sales
of $66.5 billion(1)
|
Total shareholder distributions of $29 billion(1) | |
Proved oil and gas reserve additions of 2.0 billion oil-equivalent barrels, replacing 116 percent of production, excluding asset sales(1) |
Annual dividend per share growth of 6 percent
versus 2010, the 29th consecutive year of dividend per share increases |

2
|
ExxonMobil • 2011 Financial & Operating Review |
Business
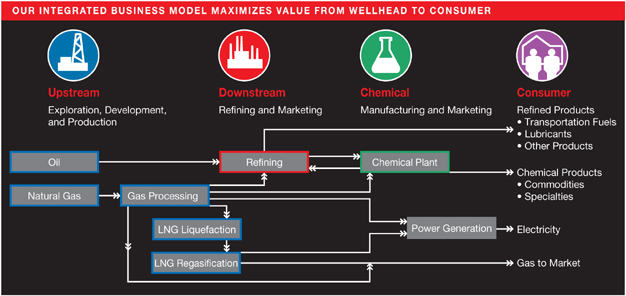
Model We employ a business model focused on achieving excellence in our daily operations, generating superior cash flow, and creating long-term shareholder value. As a result of the consistent application of this proven business model, we possess competitive advantages that support strong results today and position us well for decades to come. Rex W. Tillerson Chairman and CEO |
 |
3
|
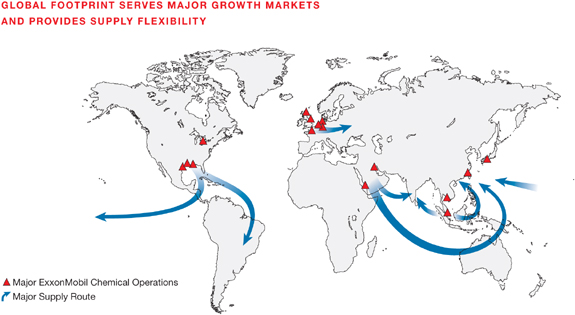
| Global Operations |
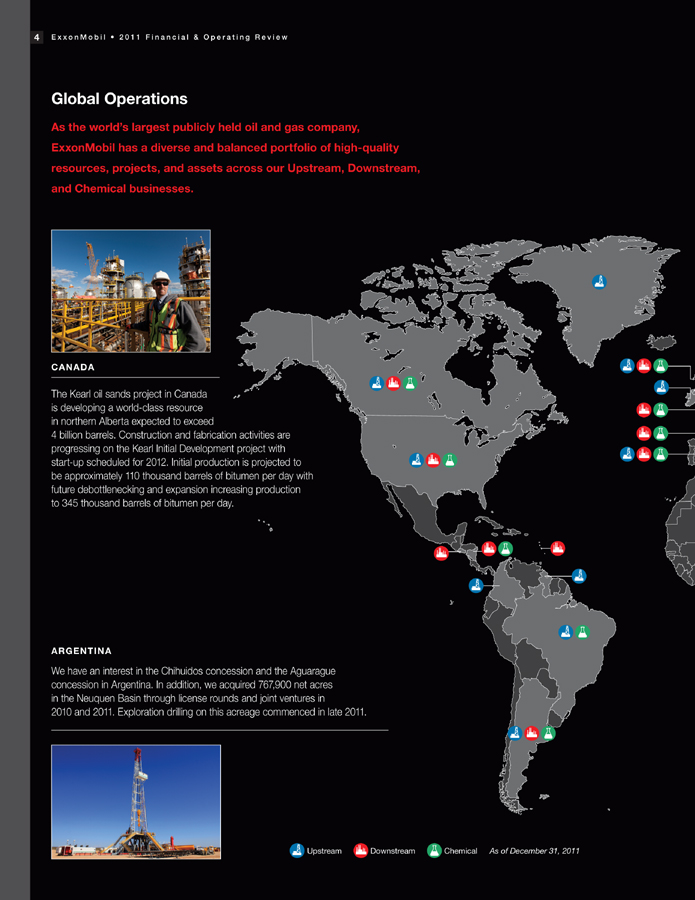
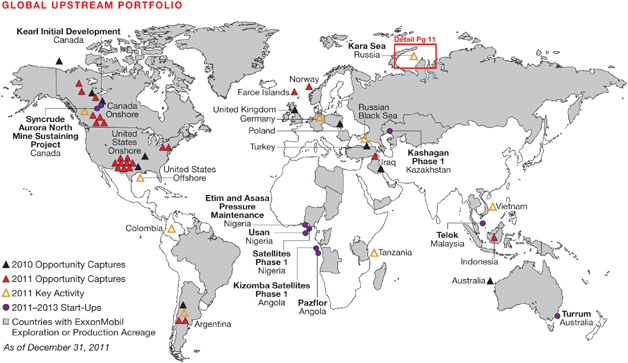
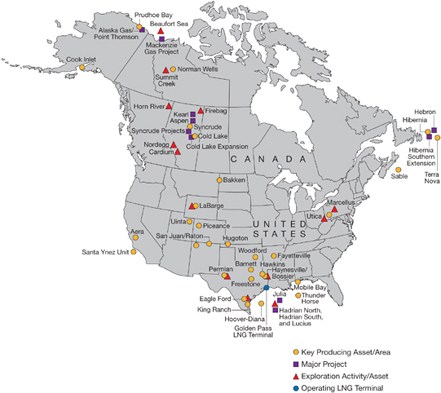
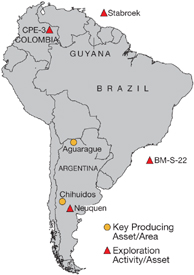
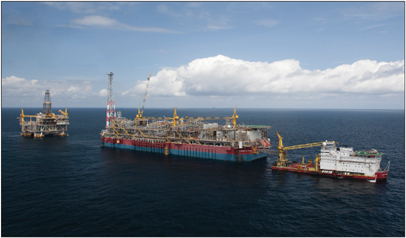
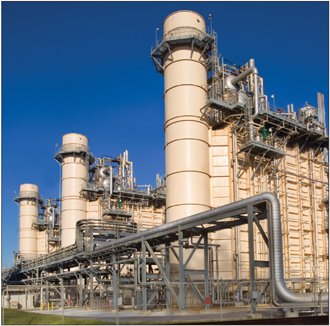
| ExxonMobil • 2011 Financial & Global Operations As the world’s largest publicly held oil and gas company, ExxonMobil has a diverse and balanced portfolio of high-quality resources, projects, and assets across our Upstream, Downstream, and Chemical businesses. CANADA The Kearl oil sands project in Canada is developing a world-class resource in northern Alberta expected to exceed 4 billion barrels. Construction and fabrication activities are progressing on the Kearl Initial Development project with start-up scheduled for 2012. Initial production is projected to be approximately 110 thousand barrels of bitumen per day with future debottlenecking and expansion increasing production to 345 thousand barrels of bitumen per day. ARGENTINA We have an interest in the Chihuidos concession and the Aguarague concession in Argentina. In addition, we acquired 767,900 net acres in the Neuquen Basin through license rounds and joint ventures in 2010 and 2011. Exploration drilling on this acreage commenced in late 2011. Upstream Downstream Chemical As of December 31, 2011 |
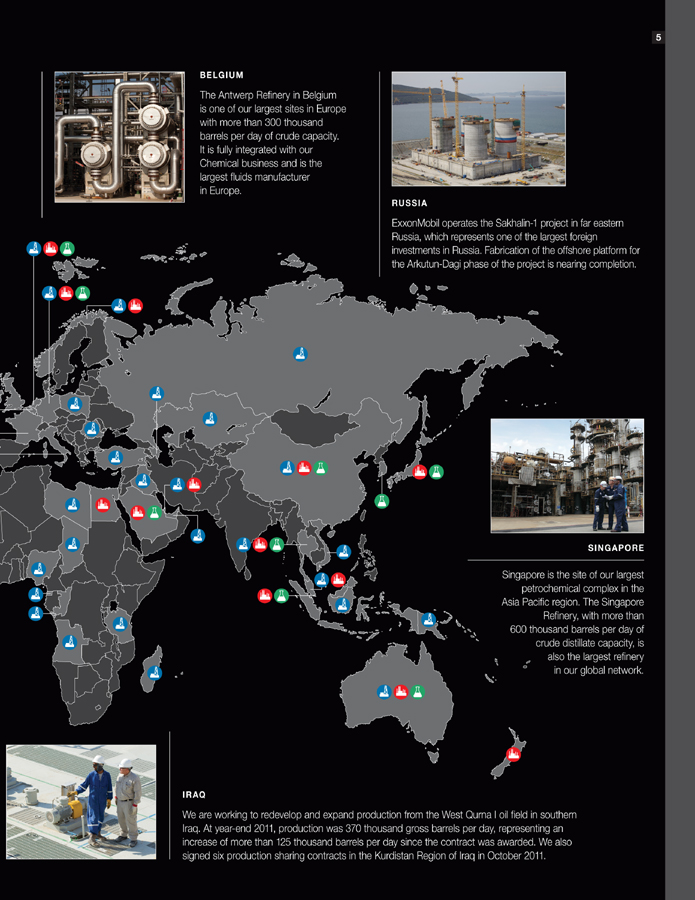
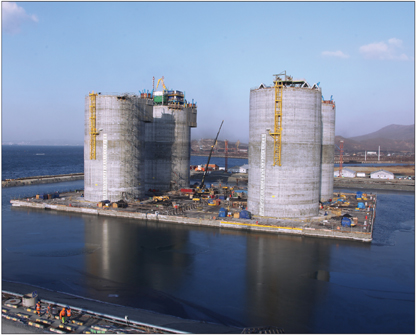
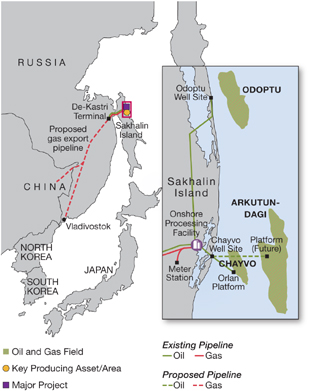
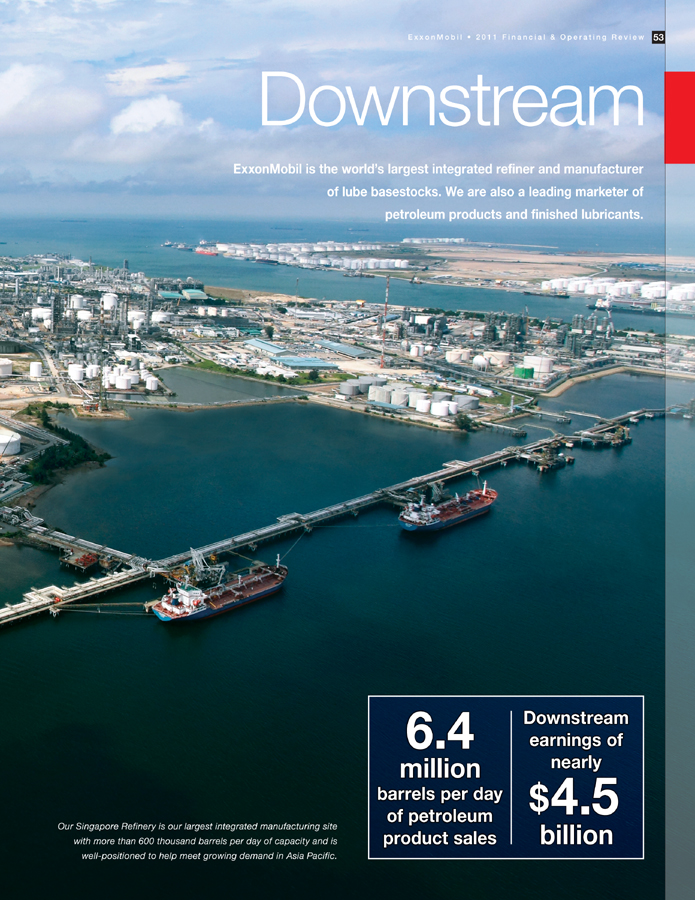
| BELGIUM The Antwerp Refinery in Belgium is one of our largest sites in Europe with more than 300 thousand barrels per day of crude capacity. It is fully integrated with our Chemical business and is the largest fluids manufacturer in Europe. RUSSIA ExxonMobil operates the Sakhalin-1 project in far eastern Russia, which represents one of the largest foreign investments in Russia. Fabrication of the offshore platform for the Arkutun-Dagi phase of the project is nearing completion. SINGAPORE Singapore is the site of our largest petrochemical complex in the Asia Pacific region. The Singapore Refinery, with more than 600 thousand barrels per day of crude distillate capacity, is also the largest refinery in our global network. IRAQ We are working to redevelop and expand production from the West Qurna I oil field in southern Iraq. At year-end 2011, production was 370 thousand gross barrels per day, representing an increase of more than 125 thousand barrels per day since the contract was awarded. We also signed six production sharing contracts in the Kurdistan Region of Iraq in October 2011. |
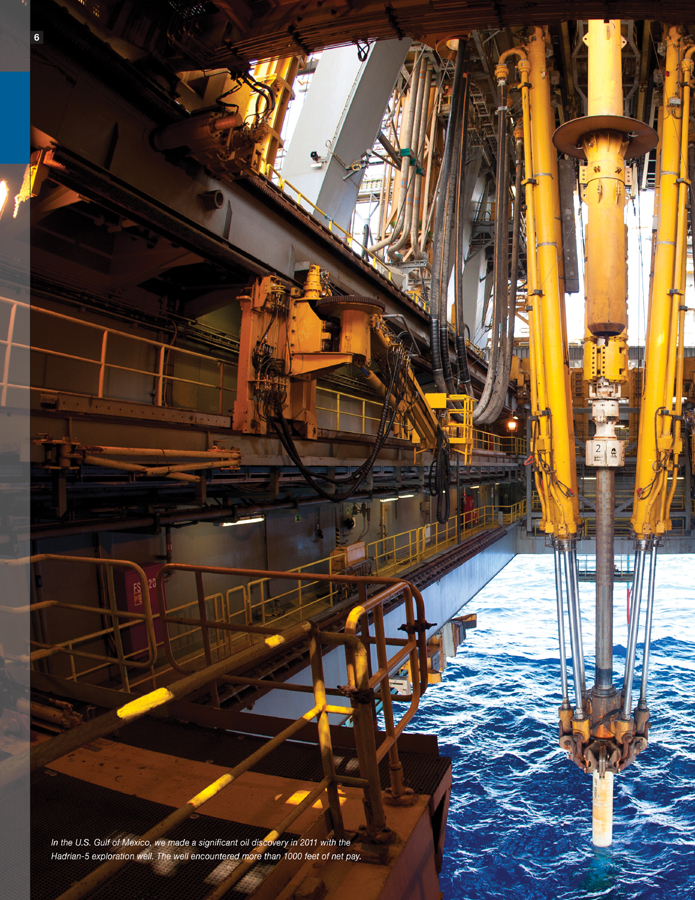
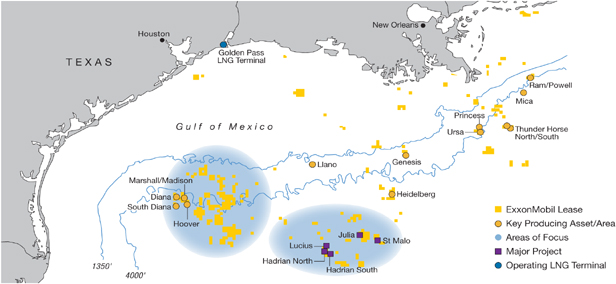
| In the U.S. Gulf of Mexico, we made a significant oil discovery in 2011 with the Hadrian-5 exploration well. The well encountered more than 1000 feet of net pay. |
| Upstream |
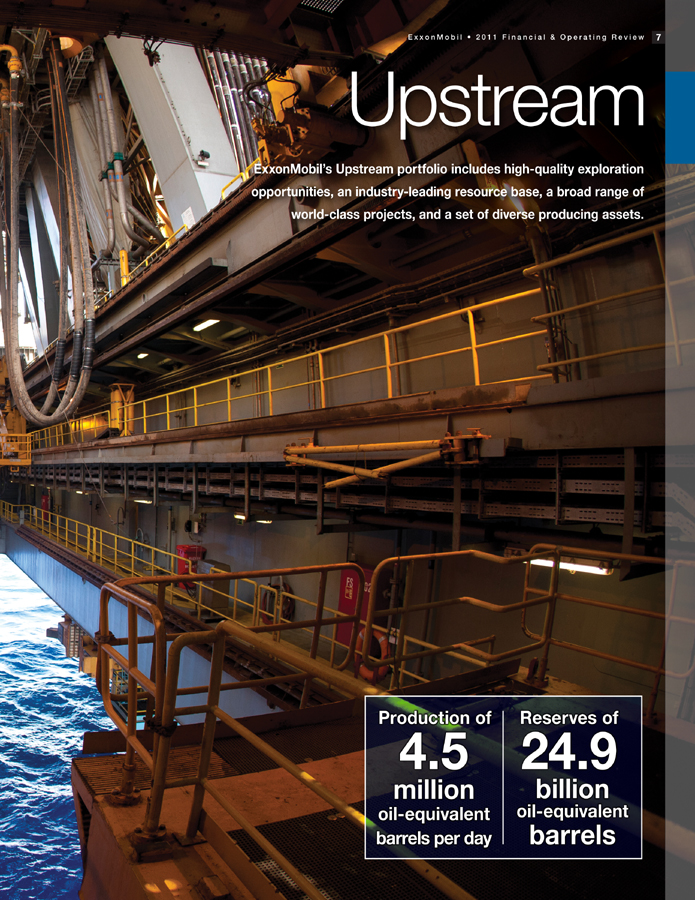
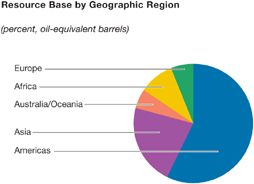
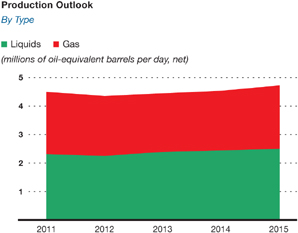
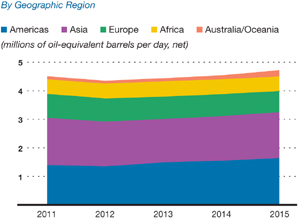
| ExxonMobil • 2011 Financial & 7 Upstream ExxonMobil’s Upstream portfolio includes high-quality exploration opportunities, an industry-leading resource base, a broad range of world-class projects, and a set of diverse producing assets. Production of Reserves of 4.5 24.9 million billion oil-equivalent oil-equivalent barrels per day barrels |
 |
8 |

| UPSTREAM STATISTICAL RECAP | 2011 | 2010 | 2009 | 2008 | 2007 | |||||||||||||||
Earnings (millions of dollars) |
34,439 | 24,097 | 17,107 | 35,402 | 26,497 | |||||||||||||||
Liquids production (net, thousands of barrels per day) |
2,312 | 2,422 | 2,387 | 2,405 | 2,616 | |||||||||||||||
Natural gas production available for sale
(net, millions of cubic feet per day) |
13,162 | 12,148 | 9,273 | 9,095 | 9,384 | |||||||||||||||
Oil-equivalent production(1) (net, thousands of barrels per day) |
4,506 | 4,447 | 3,932 | 3,921 | 4,180 | |||||||||||||||
Proved reserves replacement(2)(3) (percent) |
116 | 211 | 100 | 143 | 107 | |||||||||||||||
Resource additions(2) (millions of oil-equivalent barrels) |
4,086 | 14,580 | 2,860 | 2,230 | 2,010 | |||||||||||||||
Average capital employed(2) (millions of dollars) |
129,807 | 103,287 | 73,201 | 66,064 | 63,565 | |||||||||||||||
Return on average capital employed(2) (percent) |
26.5 | 23.3 | 23.4 | 53.6 | 41.7 | |||||||||||||||
Capital and exploration expenditures(2) (millions of dollars) |
33,091 | 27,319 | 20,704 | 19,734 | 15,724 | |||||||||||||||
| (1) | Natural gas converted to oil-equivalent at 6 million cubic feet per 1 thousand barrels. | |
| (2) | See Frequently Used Terms on pages 93 through 95. | |
| (3) | Proved reserves exclude asset sales and the 2007 Venezuela expropriation. Includes non-consolidated interests and Canadian oil sands. | |
| Note: Unless otherwise stated, production rates, project capacities, and acreage values referred to on pages 8 through 41 are gross. | ||

9
|
 |
|
10
|
11
|
|
|
12
|
| 5-Year | ||||||||
| (billions of oil-equivalent barrels) | 2011 | Average | ||||||
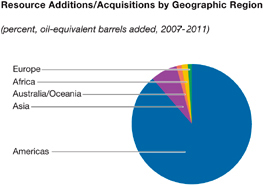
Resource additions/acquisitions |
4.1 | 5.2 | ||||||
Revisions to existing fields |
0.9 | (0.3 | ) | |||||
Production |
(1.7 | ) | (1.6 | ) | ||||
Sales |
(0.6 | ) | (0.6 | )(2) | ||||
Net change versus year-end 2010 |
2.7 | 2.7 | ||||||
| (1) | See Frequently Used Terms on pages 93 through 95. | |
| (2) | Includes impact of the Venezuela expropriation in 2007. |
| (1) | See Frequently Used Terms on pages 93 through 95. | |
| (2) | Includes asset sales and the 2007 Venezuela expropriation. |
13
|
|
|
14
|
| (Percent of plan, 2007-2011 Average) | Cost | Schedule | ||||||
ExxonMobil Operated |
103 | 109 | ||||||
Operated by Others |
109 | 114 | ||||||
| Target Peak | ||||||||||||||||
| Production (Gross) | ExxonMobil | |||||||||||||||
| Liquids | Gas | Working | ||||||||||||||
| (KBD) | (MCFD) | Interest (%) | ||||||||||||||
| 2011 (Actual) | ||||||||||||||||
| Angola | Pazflor |
220 | – | 20 | l | |||||||||||
| 2012-2014 (Projected) | ||||||||||||||||
| Angola | Cravo-Lirio-Orquidea-Violeta |
160 | – | 20 | l | |||||||||||
Kizomba Satellites Phase 1 |
100 | – | 40 | n | ||||||||||||
| Australia | Kipper/Tuna |
15 | 175 | 40 | n | |||||||||||
Turrum |
20 | 200 | 50 | n | ||||||||||||
| Canada | Cold Lake Nabiye Expansion |
40 | – | 100 | n | |||||||||||
Hibernia Southern Extension |
55 | – | 27 | n | ||||||||||||
Kearl Initial Development |
170 | – | 100 | n | ||||||||||||
Syncrude Aurora North |
215 | – | 25 | ▲ | ||||||||||||
Mine Sustaining Project |
||||||||||||||||
Syncrude
Mildred Lake |
180 | – | 25 | ▲ | ||||||||||||
Mine Sustaining Project |
||||||||||||||||
| Indonesia | Banyu Urip |
165 | 15 | 45 | n | |||||||||||
| Kazakhstan | Kashagan Phase 1 |
290 | – | 17 | l | |||||||||||
| Malaysia | Damar Gas |
5 | 200 | 50 | n | |||||||||||
Telok |
– | 370 | 50 | n | ||||||||||||
| Nigeria | Etim/Asasa Pressure Maintenance |
50 | – | 40 | n | |||||||||||
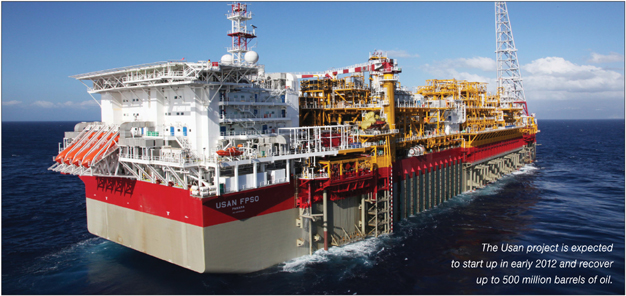
Usan |
180 | – | 30 | l | ||||||||||||
Satellite Field Development Phase 1 |
70 | – | 40 | n | ||||||||||||
| Papua
New Guinea |
PNG LNG |
30 | 940 | 33 | n | |||||||||||
| Russia | Sakhalin-1 Arkutun-Dagi |
90 | – | 30 | n | |||||||||||
| Qatar | Barzan |
85 | 1400 | 7 | ▲ | |||||||||||
| U.S. | Hadrian South |
– | 300 | 47 | n | |||||||||||
Lucius |
100 | 90 | 25 | l | ||||||||||||
| 2015+ (Projected) | ||||||||||||||||
| Angola | AB32 Kaombo Split Hub |
210 | – | 15 | l | |||||||||||
Kizomba Satellites Phase 2 |
65 | – | 40 | n | ||||||||||||
| Australia | Gorgon Area Expansion |
10 | 850 | 25 | l | |||||||||||
Gorgon Jansz |
20 | 2835 | 25 | l | ||||||||||||
Scarborough |
– | 1190 | 50 | n |
||||||||||||
| Target Peak | ||||||||||||||||
| Production (Gross) | ExxonMobil | |||||||||||||||
| Liquids | Gas | Working | ||||||||||||||
| (KBD) | (MCFD) | Interest (%) | ||||||||||||||
| 2015+ (Projected, continued) | ||||||||||||||||
Canada |
Aspen | 80 | – | 100 | n | |||||||||||
| Firebag | 280 | – | 80 | n | ||||||||||||
| Hebron | 130 | – | 36 | n | ||||||||||||
| Kearl Expansion | 175 | – | 100 | n | ||||||||||||
| Mackenzie Gas Project | 10 | 830 | 56 | n | ||||||||||||
| Syncrude Aurora South Phase 1 and 2 |
200 | – | 25 | ▲ | ||||||||||||
Indonesia |
Cepu Gas | – | 210 | 41 | n | |||||||||||
| Natuna | – | 1100 | ** | n | ||||||||||||
Iraq |
West Qurna I* | 2825 | – | 60 | ▲ | |||||||||||
Kazakhstan |
Kashagan Future Phases | 1260 | – | 17 | l | |||||||||||
| Aktote | 50 | 850 | 17 | l | ||||||||||||
| Tengiz Expansion | 250 | – | 25 | l | ||||||||||||
Nigeria |
Bonga North | 100 | 60 | 20 | l | |||||||||||
| Bonga Southwest | 200 | 15 | 16 | l | ||||||||||||
| Bosi | 135 | 140 | 56 | n | ||||||||||||
| Erha North Phase 2 | 60 | – | 56 | n | ||||||||||||
| Satellite Field Development Phase 2 |
80 | – | 40 | n | ||||||||||||
| Uge | 110 | 20 | 20 | n | ||||||||||||
| Usan Future Phases | 50 | – | 30 | l | ||||||||||||
| Usari Pressure Maintenance | 50 | – | 40 | n | ||||||||||||
Norway |
Aasgard Subsea Compression | 35 | 360 | 14 | l | |||||||||||
| Dagny | 65 | 185 | 33 | l | ||||||||||||
| Luva | – | 600 | 15 | l | ||||||||||||
Russia |
Sakhalin-1 Future Phases | 30 | 800 | 30 | n | |||||||||||
United Arab Emirates |
Upper Zakum 750 | 750 | – | 28 | ▲ | |||||||||||
U.K. |
Fram | 20 | 140 | 69 | l | |||||||||||
U.S. |
Alaska Gas/Point Thomson | 70 | 4500 | 36 | ** | |||||||||||
| Hadrian North | 100 | 100 | 50 | n | ||||||||||||
| Julia Phase 1 | 30 | – | 50 | n | ||||||||||||
15
|
|
|
16
|
|
|
Our petascale computational capability allows 1015 operations per second |
17
|
|
|
18
|
19
|
|
|
20
|
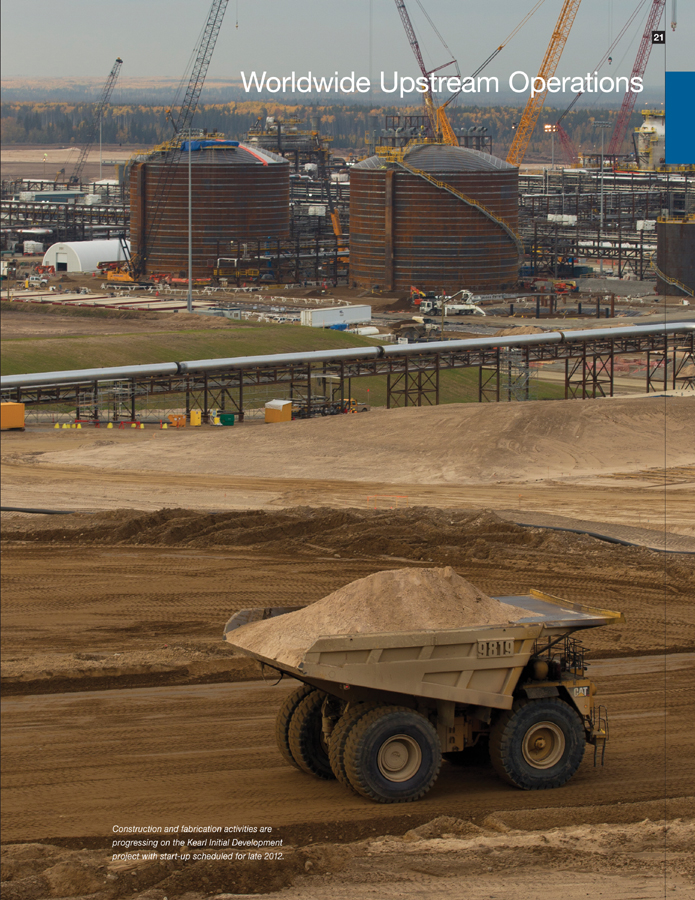
| Worldwide Upstream Operations Construction and fabrication activities are progressing on the Kearl Initial Development project with start-up scheduled for late 2012. |
|
22
|
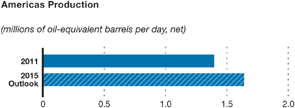
| Americas Highlights | 2011 | 2010 | 2009 | |||||||||
Earnings (billions of dollars) |
7.8 | 5.9 | 3.8 | |||||||||
Proved Reserves (BOEB) |
10.8 | 9.8 | 7.1 | |||||||||
Acreage (gross acres, million) |
50.2 | 51.4 | 49.5 | |||||||||
Net Liquids Production (MBD) |
0.7 | 0.7 | 0.7 | |||||||||
Net Gas Available for Sale (BCFD) |
4.3 | 3.2 | 1.9 | |||||||||
23
|
|
|
24
|
25
|
|
|
26
|
27
|
|
|
28
|
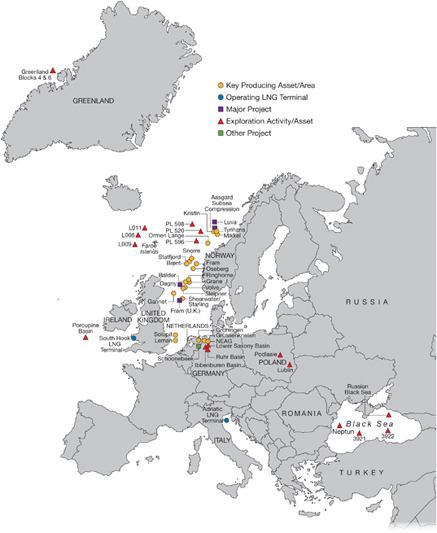
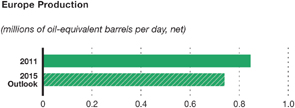
| Europe Highlights | 2011 | 2010 | 2009 | |||||||||
Earnings (billions of dollars) |
7.1 | 3.8 | 3.6 | |||||||||
Proved Reserves (BOEB) |
2.7 | 2.9 | 3.2 | |||||||||
Acreage (gross acres, million) |
44.1 | 43.1 | 35.2 | |||||||||
Net Liquids Production (MBD) |
0.3 | 0.3 | 0.4 | |||||||||
Net Gas Available for Sale (BCFD) |
3.4 | 3.8 | 3.7 | |||||||||
29
|
|
|
30
|
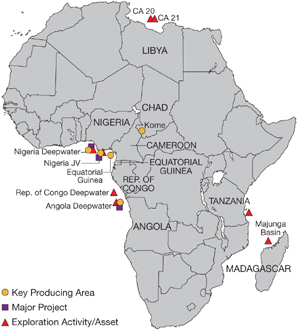
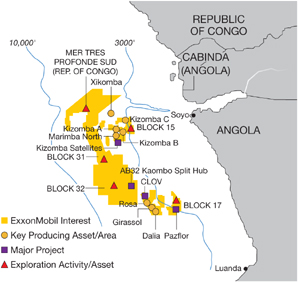
| Africa Highlights | 2011 | 2010 | 2009 | |||||||||
Earnings (billions of dollars) |
5.4 | 4.4 | 3.9 | |||||||||
Proved Reserves (BOEB) |
1.8 | 2.0 | 2.1 | |||||||||
Acreage (gross acres, million) |
15.1 | 16.5 | 17.7 | |||||||||
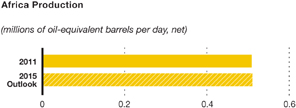
Net Liquids Production (MBD) |
0.5 | 0.6 | 0.7 | |||||||||
Net Gas Available for Sale (BCFD) |
– | – | – | |||||||||
31
|
|
|
32
|
33
|
|
|
34
|
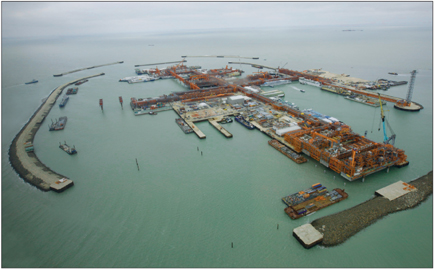
| Asia Highlights | 2011 | 2010 | 2009 | |||||||||
Earnings
(billions of
dollars) |
13.4 | 9.4 | 5.2 | |||||||||
Proved Reserves
(BOEB) |
8.1 | 8.6 | 9.1 | |||||||||
Acreage (gross
acres, million) |
31.0 | 31.4 | 32.9 | |||||||||
Net Liquids
Production (MBD) |
0.8 | 0.7 | 0.6 | |||||||||
Net Gas
Available for Sale
(BCFD) |
5.0 | 4.8 | 3.3 | |||||||||
35
|
|
|
36
|

37
|
|
|
38
|
39
|
|
|
40
|
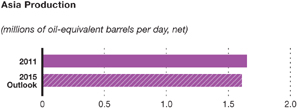
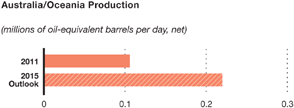
| Australia/Oceania Highlights | 2011 | 2010 | 2009 | |||||||
Earnings (billions of
dollars) |
0.8 | 0.6 | 0.6 | |||||||
Proved Reserves (BOEB) |
1.5 | 1.5 | 1.5 | |||||||
Acreage (gross acres,
million) |
7.8 | 7.1 | 11.7 | |||||||
Net Liquids Production (MBD) |
0.1 | 0.1 | 0.1 | |||||||
Net Gas Available for Sale
(BCFD) |
0.3 | 0.3 | 0.3 | |||||||
41
|
|
 |
42
|
| (thousands of barrels per day) | 2011 | 2010 | 2009 | 2008 | 2007 | |||||||||||||||
United States |
||||||||||||||||||||
Alaska |
114 | 117 | 123 | 130 | 132 | |||||||||||||||
Lower 48 |
309 | 291 | 261 | 237 | 260 | |||||||||||||||
Total United States |
423 | 408 | 384 | 367 | 392 | |||||||||||||||
Canada/South America |
252 | 263 | 267 | 292 | 324 | |||||||||||||||
Total Americas |
675 | 671 | 651 | 659 | 716 | |||||||||||||||
Europe |
||||||||||||||||||||
United Kingdom |
55 | 80 | 90 | 123 | 150 | |||||||||||||||
Norway |
205 | 246 | 280 | 295 | 319 | |||||||||||||||
Other |
10 | 9 | 9 | 10 | 11 | |||||||||||||||
Total Europe |
270 | 335 | 379 | 428 | 480 | |||||||||||||||
Africa |
||||||||||||||||||||
Nigeria |
324 | 391 | 391 | 364 | 415 | |||||||||||||||
Angola |
99 | 141 | 194 | 181 | 173 | |||||||||||||||
Equatorial Guinea |
45 | 53 | 55 | 60 | 76 | |||||||||||||||
Other |
40 | 43 | 45 | 47 | 53 | |||||||||||||||
Total Africa |
508 | 628 | 685 | 652 | 717 | |||||||||||||||
Asia |
||||||||||||||||||||
Malaysia |
38 | 48 | 52 | 56 | 67 | |||||||||||||||
Middle East |
567 | 478 | 368 | 381 | 374 | |||||||||||||||
Russia/Caspian |
191 | 191 | 182 | 160 | 185 | |||||||||||||||
Other |
12 | 13 | 5 | 2 | 3 | |||||||||||||||
Total Asia |
808 | 730 | 607 | 599 | 629 | |||||||||||||||
Australia/Oceania |
51 | 58 | 65 | 67 | 74 | |||||||||||||||
Total worldwide |
2,312 | 2,422 | 2,387 | 2,405 | 2,616 | |||||||||||||||
Gas Plant Liquids Included Above |
||||||||||||||||||||
United States |
78 | 59 | 50 | 49 | 57 | |||||||||||||||
Non-U.S. |
213 | 207 | 173 | 164 | 166 | |||||||||||||||
Total worldwide |
291 | 266 | 223 | 213 | 223 | |||||||||||||||
Oil Sands and Non-Consolidated Volumes Included Above |
||||||||||||||||||||
United States |
66 | 69 | 73 | 78 | 82 | |||||||||||||||
Canada/South America – Bitumen |
120 | 115 | 120 | 124 | 130 | |||||||||||||||
Canada/South America – Synthetic Oil |
67 | 67 | 65 | 62 | 65 | |||||||||||||||
Europe |
5 | 5 | 5 | 5 | 6 | |||||||||||||||
Asia |
425 | 404 | 320 | 280 | 265 | |||||||||||||||
Total worldwide |
683 | 660 | 583 | 549 | 548 | |||||||||||||||
| (1) | Net liquids production quantities are the volumes of crude oil and natural gas liquids withdrawn from ExxonMobil’s oil and gas reserves, excluding royalties and quantities due to others when produced, and are based on the volumes delivered from the lease or at the point measured for royalty and/or severance tax purposes. Volumes include 100 percent of the production of majority-owned affiliates, including liquids production from oil sands operations in Canada, and ExxonMobil’s ownership of the production by companies owned 50 percent or less. |
| (millions of cubic feet per day) | 2011 | 2010 | 2009 | 2008 | 2007 | |||||||||||||||
United States |
3,917 | 2,596 | 1,275 | 1,246 | 1,468 | |||||||||||||||
Canada/South America |
412 | 569 | 643 | 640 | 808 | |||||||||||||||
Total Americas |
4,329 | 3,165 | 1,918 | 1,886 | 2,276 | |||||||||||||||
Europe |
||||||||||||||||||||
Netherlands |
1,826 | 2,041 | 1,676 | 1,748 | 1,551 | |||||||||||||||
United Kingdom |
441 | 550 | 594 | 750 | 779 | |||||||||||||||
Norway |
663 | 700 | 786 | 764 | 705 | |||||||||||||||
Germany |
518 | 545 | 633 | 687 | 775 | |||||||||||||||
Total Europe |
3,448 | 3,836 | 3,689 | 3,949 | 3,810 | |||||||||||||||
Africa |
7 | 14 | 19 | 32 | 26 | |||||||||||||||
Asia |
||||||||||||||||||||
Indonesia |
164 | 215 | 245 | 239 | 286 | |||||||||||||||
Malaysia |
420 | 513 | 545 | 582 | 583 | |||||||||||||||
Middle East |
4,261 | 3,865 | 2,367 | 1,911 | 1,875 | |||||||||||||||
Russia/Caspian |
184 | 187 | 153 | 114 | 110 | |||||||||||||||
Other |
18 | 21 | 22 | 24 | 29 | |||||||||||||||
Total Asia |
5,047 | 4,801 | 3,332 | 2,870 | 2,883 | |||||||||||||||
Australia/Oceania |
331 | 332 | 315 | 358 | 389 | |||||||||||||||
Total worldwide |
13,162 | 12,148 | 9,273 | 9,095 | 9,384 | |||||||||||||||
Non-Consolidated Natural Gas Volumes Included Above |
||||||||||||||||||||
United States |
– | 1 | 1 | 1 | 1 | |||||||||||||||
Europe |
1,747 | 1,977 | 1,618 | 1,696 | 1,503 | |||||||||||||||
Asia |
3,168 | 2,954 | 1,918 | 1,433 | 1,351 | |||||||||||||||
Total worldwide |
4,915 | 4,932 | 3,537 | 3,130 | 2,855 | |||||||||||||||
| (1) | Net natural gas available for sale quantities are the volumes withdrawn from ExxonMobil’s natural gas reserves, excluding royalties and volumes due to others when produced, and excluding gas purchased from others, gas consumed in producing operations, field processing plant losses, volumes used for gas lift, gas injection and cycling operations, quantities flared, and volume shrinkage due to the removal of condensate or natural gas liquids fractions. |
| (millions of cubic feet per day) | 2011 | 2010 | 2009 | 2008 | 2007 | |||||||||||||||
United States |
5,002 | 3,166 | 1,321 | 1,292 | 1,560 | |||||||||||||||
Canada/South America |
517 | 696 | 739 | 845 | 968 | |||||||||||||||
Europe |
6,254 | 6,401 | 5,854 | 5,665 | 5,396 | |||||||||||||||
Africa |
7 | 14 | 19 | 32 | 26 | |||||||||||||||
Asia |
4,289 | 4,102 | 2,760 | 2,612 | 2,631 | |||||||||||||||
Australia/Oceania |
338 | 339 | 322 | 366 | 398 | |||||||||||||||
Total worldwide |
16,407 | 14,718 | 11,015 | 10,812 | 10,979 | |||||||||||||||
| (1) | Natural gas sales include 100 percent of the sales of ExxonMobil and majority-owned affiliates and ExxonMobil’s ownership of sales by companies owned 50 percent or less. Numbers include sales of gas purchased from third parties. |
43
|
 |
|
44
|
NUMBER OF NET WELLS DRILLED ANNUALLY(1)
|
||||||||||||||||||||
(net wells drilled) |
2011 | 2010 | 2009 | 2008 | 2007 | |||||||||||||||
Productive |
||||||||||||||||||||
Exploratory(2) |
25 | 37 | 20 | 19 | 19 | |||||||||||||||
Development |
1,554 | 1,200 | 829 | 731 | 917 | |||||||||||||||
Total |
1,579 | 1,237 | 849 | 750 | 936 | |||||||||||||||
Dry |
||||||||||||||||||||
Exploratory(2) |
11 | 7 | 9 | 9 | 16 | |||||||||||||||
Development |
16 | 5 | 5 | 4 | 19 | |||||||||||||||
Total |
27 | 12 | 14 | 13 | 35 | |||||||||||||||
Net Wells Drilled |
||||||||||||||||||||
Exploratory(2) |
36 | 44 | 29 | 28 | 35 | |||||||||||||||
Development |
1,570 | 1,205 | 834 | 735 | 936 | |||||||||||||||
Total |
1,606 | 1,249 | 863 | 763 | 971 | |||||||||||||||
NET ACREAGE AT YEAR END(3)
|
||||||||||||||||||||
(thousands of net acres) |
2011 | 2010 | 2009 | 2008 | 2007 | |||||||||||||||
Undeveloped |
||||||||||||||||||||
United States |
5,326 | 4,914 | 5,111 | 5,691 | 5,539 | |||||||||||||||
Canada/South America |
9,877 | 11,977 | 17,107 | 19,953 | 22,563 | |||||||||||||||
Europe |
16,107 | 16,118 | 13,470 | 7,913 | 6,002 | |||||||||||||||
Africa |
8,100 | 8,612 | 10,555 | 26,439 | 24,835 | |||||||||||||||
Asia |
19,919 | 19,086 | 20,457 | 6,824 | 7,715 | |||||||||||||||
Australia/Oceania |
1,476 | 1,352 | 5,216 | 5,738 | 5,844 | |||||||||||||||
Total worldwide |
60,805 | 62,059 | 71,916 | 72,558 | 72,498 | |||||||||||||||
Developed |
||||||||||||||||||||
United States |
10,311 | 9,919 | 5,120 | 5,148 | 5,174 | |||||||||||||||
Canada/South America |
1,959 | 2,439 | 2,460 | 2,488 | 2,366 | |||||||||||||||
Europe |
2,868 | 2,986 | 3,806 | 4,026 | 4,194 | |||||||||||||||
Africa |
700 | 684 | 758 | 756 | 729 | |||||||||||||||
Asia |
1,230 | 1,271 | 1,160 | 1,048 | 1,037 | |||||||||||||||
Australia/Oceania |
719 | 719 | 719 | 719 | 728 | |||||||||||||||
Total worldwide |
17,787 | 18,018 | 14,023 | 14,185 | 14,228 | |||||||||||||||
NET CAPITALIZED COSTS AT YEAR END(3)
|
||||||||||||||||||||
(millions of dollars) |
2011 | 2010 | 2009 | 2008 | 2007 | |||||||||||||||
United States |
76,363 | 70,011 | 20,363 | 18,542 | 16,948 | |||||||||||||||
Canada/South America |
21,721 | 18,089 | 13,408 | 9,967 | 11,338 | |||||||||||||||
Europe |
11,399 | 12,845 | 14,357 | 11,477 | 15,426 | |||||||||||||||
Africa |
24,790 | 22,563 | 20,917 | 17,797 | 15,149 | |||||||||||||||
Asia |
25,594 | 23,765 | 21,859 | 19,191 | 17,186 | |||||||||||||||
Australia/Oceania |
6,864 | 5,284 | 3,725 | 2,407 | 2,630 | |||||||||||||||
Total worldwide |
166,731 | 152,557 | 94,629 | 79,381 | 78,677 | |||||||||||||||
| (1) | A regional breakout of this data is included on pages 11 and 12 of ExxonMobil’s 2011 Form 10-K. | |
| (2) | These include near-field and appraisal wells classified as exploratory for SEC reporting. | |
| (3) | Includes non-consolidated interests and Canadian oil sands operations. |
| Property | ||||||||||||||||
| Acquisition | Exploration | Development | Total | |||||||||||||
| (millions of dollars) | Costs | Costs | Costs | Costs | ||||||||||||
During 2011 |
||||||||||||||||
United States |
2,967 | 484 | 8,505 | 11,956 | ||||||||||||
Canada/South America |
178 | 372 | 5,478 | 6,028 | ||||||||||||
Europe |
– | 672 | 2,063 | 2,735 | ||||||||||||
Africa |
– | 303 | 4,316 | 4,619 | ||||||||||||
Asia |
642 | 518 | 3,618 | 4,778 | ||||||||||||
Australia/Oceania |
– | 154 | 1,710 | 1,864 | ||||||||||||
Total worldwide |
3,787 | 2,503 | 25,690 | 31,980 | ||||||||||||
During 2010 |
||||||||||||||||
United States |
45,143 | 694 | 8,270 | 54,107 | ||||||||||||
Canada/South America |
136 | 527 | 4,757 | 5,420 | ||||||||||||
Europe |
64 | 606 | 1,452 | 2,122 | ||||||||||||
Africa |
3 | 453 | 4,390 | 4,846 | ||||||||||||
Asia |
115 | 547 | 3,195 | 3,857 | ||||||||||||
Australia/Oceania |
– | 228 | 1,146 | 1,374 | ||||||||||||
Total worldwide |
45,461 | 3,055 | 23,210 | 71,726 | ||||||||||||
During 2009 |
||||||||||||||||
United States |
205 | 549 | 2,787 | 3,541 | ||||||||||||
Canada/South America |
353 | 498 | 2,394 | 3,245 | ||||||||||||
Europe |
1 | 525 | 3,639 | 4,165 | ||||||||||||
Africa |
605 | 880 | 4,596 | 6,081 | ||||||||||||
Asia |
121 | 529 | 2,946 | 3,596 | ||||||||||||
Australia/Oceania |
– | 130 | 768 | 898 | ||||||||||||
Total worldwide |
1,285 | 3,111 | 17,130 | 21,526 | ||||||||||||
During 2008 |
||||||||||||||||
United States |
281 | 453 | 2,739 | 3,473 | ||||||||||||
Canada/South America |
126 | 325 | 1,421 | 1,872 | ||||||||||||
Europe |
25 | 401 | 1,863 | 2,289 | ||||||||||||
Africa |
82 | 686 | 4,783 | 5,551 | ||||||||||||
Asia |
73 | 307 | 3,384 | 3,764 | ||||||||||||
Australia/Oceania |
76 | 100 | 443 | 619 | ||||||||||||
Total worldwide |
663 | 2,272 | 14,633 | 17,568 | ||||||||||||
During 2007 |
||||||||||||||||
United States |
63 | 377 | 1,859 | 2,299 | ||||||||||||
Canada/South America |
93 | 231 | 902 | 1,226 | ||||||||||||
Europe |
– | 229 | 2,016 | 2,245 | ||||||||||||
Africa |
13 | 584 | 2,847 | 3,444 | ||||||||||||
Asia |
21 | 210 | 3,721 | 3,952 | ||||||||||||
Australia/Oceania |
4 | 131 | 225 | 360 | ||||||||||||
Total worldwide |
194 | 1,762 | 11,570 | 13,526 | ||||||||||||
| (1) | Includes non-consolidated interests and Canadian oil sands operations. |
45
|
|
|
46
|
| 2011 | 2010 | 2009 | 2008 | 2007 | ||||||||||||||||
| Liquids, Including Oil Sands and Non-Consolidated Reserves (millions of barrels at year end) | ||||||||||||||||||||
Net proved developed and undeveloped reserves |
||||||||||||||||||||
United States |
2,372 | 2,303 | 1,972 | 1,971 | 2,225 | |||||||||||||||
Canada/South America |
3,894 | 2,946 | 2,918 | 2,683 | 1,633 | |||||||||||||||
Europe |
405 | 454 | 517 | 560 | 699 | |||||||||||||||
Africa |
1,675 | 1,799 | 1,907 | 2,137 | 2,058 | |||||||||||||||
Asia |
3,620 | 3,896 | 4,049 | 4,424 | 4,246 | |||||||||||||||
Australia/Oceania |
262 | 275 | 288 | 231 | 213 | |||||||||||||||
Total worldwide |
12,228 | 11,673 | 11,651 | 12,006 | 11,074 | |||||||||||||||
Proportional interest in oil sands and non-consolidated
reserves included above |
||||||||||||||||||||
United States |
353 | 351 | 356 | 327 | 374 | |||||||||||||||
Canada/South America (bitumen)(2) |
3,106 | 2,102 | 2,055 | 1,767 | 717 | |||||||||||||||
Canada/South America (synthetic oil)(2) |
653 | 681 | 691 | 734 | 694 | |||||||||||||||
Europe |
29 | 31 | 30 | 27 | 26 | |||||||||||||||
Asia |
1,733 | 1,873 | 2,050 | 2,205 | 2,236 | |||||||||||||||
Net proved developed reserves included above |
||||||||||||||||||||
United States |
1,722 | 1,749 | 1,490 | 1,521 | 1,626 | |||||||||||||||
Canada/South America |
1,281 | 1,333 | 1,311 | 1,315 | 1,376 | |||||||||||||||
Europe |
330 | 382 | 386 | 419 | 526 | |||||||||||||||
Africa |
1,050 | 1,055 | 1,122 | 1,284 | 1,202 | |||||||||||||||
Asia |
2,617 | 2,929 | 2,876 | 2,514 | 2,214 | |||||||||||||||
Australia/Oceania |
126 | 139 | 153 | 165 | 185 | |||||||||||||||
Total worldwide |
7,126 | 7,587 | 7,338 | 7,218 | 7,129 | |||||||||||||||
| Natural Gas, Including Non-Consolidated Reserves (billions of cubic feet at year end) | ||||||||||||||||||||
Net proved developed and undeveloped reserves |
||||||||||||||||||||
United States |
26,366 | 26,111 | 11,802 | 11,890 | 13,297 | |||||||||||||||
Canada/South America |
835 | 1,258 | 1,368 | 1,383 | 1,559 | |||||||||||||||
Europe |
13,755 | 14,788 | 16,173 | 17,284 | 18,853 | |||||||||||||||
Africa |
982 | 908 | 920 | 918 | 1,006 | |||||||||||||||
Asia |
27,037 | 28,399 | 30,304 | 32,383 | 31,790 | |||||||||||||||
Australia/Oceania |
7,247 | 7,351 | 7,440 | 2,021 | 1,757 | |||||||||||||||
Total worldwide |
76,222 | 78,815 | 68,007 | 65,879 | 68,262 | |||||||||||||||
Proportional interest in non-consolidated reserves
included above |
||||||||||||||||||||
United States |
112 | 117 | 114 | 112 | 125 | |||||||||||||||
Europe |
10,169 | 10,746 | 11,450 | 11,839 | 12,341 | |||||||||||||||
Asia |
20,566 | 21,139 | 22,001 | 22,526 | 23,186 | |||||||||||||||
Net proved developed reserves included above |
||||||||||||||||||||
United States |
15,533 | 15,441 | 7,582 | 7,931 | 8,477 | |||||||||||||||
Canada/South America |
658 | 1,077 | 1,200 | 1,148 | 1,303 | |||||||||||||||
Europe |
10,629 | 11,683 | 12,782 | 13,710 | 14,743 | |||||||||||||||
Africa |
853 | 711 | 739 | 738 | 773 | |||||||||||||||
Asia |
25,067 | 27,087 | 25,206 | 17,876 | 14,021 | |||||||||||||||
Australia/Oceania |
1,070 | 1,174 | 1,262 | 1,346 | 1,403 | |||||||||||||||
Total worldwide |
53,810 | 57,173 | 48,771 | 42,749 | 40,720 | |||||||||||||||
| (1) | ExxonMobil reserves using SEC historical price bases. Proved reserves as defined by the SEC are based on historical market prices: prior to 2009, the SEC defined price as the market price on December 31; beginning in 2009, the SEC changed the definition to the average of the market prices on the first day of each calendar month during the year. Mining and equity company reserves are included for all periods. See Frequently Used Terms on pages 93 through 95. | |
| (2) | Proved reserves classified as bitumen are associated with the Cold Lake and Kearl projects in Canada. Proved reserves classified as synthetic oil are associated with the Syncrude project in Canada. Cold Lake uses in situ methods, and hydrocarbons are produced from wells drilled into the subsurface. Syncrude is an oil sands mining project which includes an upgrader that converts the mined hydrocarbons into a higher gravity crude oil. Kearl is an oil sands mining project that does not incorporate an upgrader. |
| 2011 | 2010 | 2009 | 2008 | 2007 | ||||||||||||||||
| Oil-Equivalent, Including Oil Sands and Non-Consolidated Reserves (millions of barrels at year end) | ||||||||||||||||||||
Net proved developed and undeveloped reserves |
||||||||||||||||||||
United States |
6,766 | 6,654 | 3,939 | 3,953 | 4,441 | |||||||||||||||
Canada/South America |
4,033 | 3,155 | 3,146 | 2,914 | 1,893 | |||||||||||||||
Europe |
2,698 | 2,919 | 3,212 | 3,441 | 3,841 | |||||||||||||||
Africa |
1,839 | 1,951 | 2,060 | 2,290 | 2,226 | |||||||||||||||
Asia |
8,126 | 8,630 | 9,100 | 9,820 | 9,544 | |||||||||||||||
Australia/Oceania |
1,470 | 1,500 | 1,528 | 568 | 506 | |||||||||||||||
Total worldwide |
24,932 | 24,809 | 22,985 | 22,986 | 22,451 | |||||||||||||||
| (million barrels of oil or billion cubic feet of gas | Average | |||||||||||||||||||||||
| unless specified otherwise) | 2011 | 2010 | 2009 | 2008 | 2007 | 2007-2011 | ||||||||||||||||||
Liquids (millions of barrels) |
||||||||||||||||||||||||
Revisions |
270 | 358 | 361 | 583 | 666 | 447 | ||||||||||||||||||
Improved recovery |
– | 5 | 15 | 6 | 35 | 12 | ||||||||||||||||||
Extensions/discoveries |
1,166 | 185 | 142 | 1,308 | 194 | 599 | ||||||||||||||||||
Purchases |
16 | 378 | – | – | – | 79 | ||||||||||||||||||
Sales |
(54 | ) | (21 | ) | (3 | ) | (86 | ) | (436 | ) | (120 | ) | ||||||||||||
Total additions |
1,398 | 905 | 515 | 1,811 | 459 | 1,017 | ||||||||||||||||||
Production |
843 | 883 | 870 | 879 | 953 | 886 | ||||||||||||||||||
Reserves replacement ratio,
excluding sales (percent) |
172 | 105 | 60 | 216 | 94 | 128 | ||||||||||||||||||
Reserves replacement ratio,
including sales (percent) |
166 | 102 | 59 | 206 | 48 | 115 | ||||||||||||||||||
Natural Gas (billions of cubic feet) |
||||||||||||||||||||||||
Revisions |
64 | 879 | 135 | 643 | 4,435 | 1,231 | ||||||||||||||||||
Improved recovery |
– | – | – | 1 | 4 | 1 | ||||||||||||||||||
Extensions/discoveries |
2,682 | 1,988 | 5,694 | 692 | 324 | 2,276 | ||||||||||||||||||
Purchases |
303 | 12,789 | 8 | – | 9 | 2,622 | ||||||||||||||||||
Sales |
(523 | ) | (106 | ) | (13 | ) | (82 | ) | (320 | ) | (209 | ) | ||||||||||||
Total additions |
2,526 | 15,550 | 5,824 | 1,254 | 4,452 | 5,921 | ||||||||||||||||||
Production |
5,119 | 4,742 | 3,696 | 3,637 | 3,750 | 4,189 | ||||||||||||||||||
Reserves replacement ratio,
excluding sales (percent) |
60 | 330 | 158 | 37 | 127 | 146 | ||||||||||||||||||
Reserves replacement ratio,
including sales (percent) |
49 | 328 | 158 | 34 | 119 | 141 | ||||||||||||||||||
Oil-Equivalent (millions of barrels) |
||||||||||||||||||||||||
Revisions |
281 | 505 | 383 | 690 | 1,405 | 653 | ||||||||||||||||||
Improved recovery |
– | 5 | 15 | 7 | 36 | 13 | ||||||||||||||||||
Extensions/discoveries |
1,613 | 516 | 1,091 | 1,423 | 248 | 978 | ||||||||||||||||||
Purchases |
67 | 2,510 | 1 | – | 2 | 516 | ||||||||||||||||||
Sales |
(141 | ) | (38 | ) | (5 | ) | (100 | ) | (490 | ) | (155 | ) | ||||||||||||
Total additions |
1,820 | 3,498 | 1,485 | 2,020 | 1,201 | 2,005 | ||||||||||||||||||
Production |
1,697 | 1,674 | 1,486 | 1,485 | 1,578 | 1,584 | ||||||||||||||||||
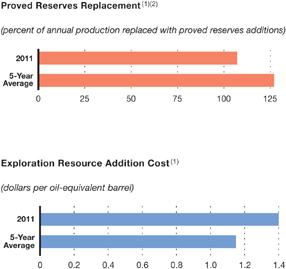
Reserves replacement ratio,
excluding sales (percent) |
116 | 211 | 100 | 143 | 107 | 136 | ||||||||||||||||||
Reserves replacement ratio,
including sales (percent) |
107 | 209 | 100 | 136 | 76 | 127 | ||||||||||||||||||
| (1) | ExxonMobil reserves using SEC historical price bases. Proved reserves as defined by the SEC are based on historical market prices: prior to 2009, the SEC defined price as the market price on December 31; beginning in 2009, the SEC changed the definition to the average of the market prices on the first day of each calendar month during the year. Mining and equity company reserves are included for all periods. See Frequently Used Terms on pages 93 through 95. | |
| (2) | The term “sales” includes the impact of expropriation of proved reserves in Venezuela (462 million oil-equivalent barrels) in 2007. |
47
|
|
|
48
|
| Crude Oil and Natural Gas Liquids | Bitumen | Synthetic Oil | ||||||||||||||||||||||||||||||||||||||
| Canada/ | Canada/ | Canada/ | ||||||||||||||||||||||||||||||||||||||
| (million barrels of oil or billion cubic feet of gas | United | South | Australia/ | South | South | Liquids | ||||||||||||||||||||||||||||||||||
| unless noted) | States | America | Europe | Africa | Asia | Oceania | Total | America | America | Total | ||||||||||||||||||||||||||||||
Liquids (millions of barrels) |
||||||||||||||||||||||||||||||||||||||||
Revisions |
139 | 13 | 78 | 60 | (75 | ) | 6 | 221 | 53 | (4 | ) | 270 | ||||||||||||||||||||||||||||
Improved recovery |
– | – | – | – | – | – | – | – | – | – | ||||||||||||||||||||||||||||||
Extensions/discoveries |
73 | – | 3 | 1 | 94 | – | 171 | 995 | – | 1,166 | ||||||||||||||||||||||||||||||
Purchases |
16 | – | – | – | – | – | 16 | – | – | 16 | ||||||||||||||||||||||||||||||
Sales |
(5 | ) | (18 | ) | (31 | ) | – | – | – | (54 | ) | – | – | (54 | ) | |||||||||||||||||||||||||
Total additions |
223 | (5 | ) | 50 | 61 | 19 | 6 | 354 | 1,048 | (4 | ) | 1,398 | ||||||||||||||||||||||||||||
Production |
154 | 23 | 99 | 185 | 295 | 19 | 775 | 44 | 24 | 843 | ||||||||||||||||||||||||||||||
Net change |
69 | (28 | ) | (49 | ) | (124 | ) | (276 | ) | (13 | ) | (421 | ) | 1,004 | (28 | ) | 555 | |||||||||||||||||||||||
Reserves replacement ratio, excluding sales (percent) |
148 | 57 | 82 | 33 | 6 | 32 | 53 | 2,382 | – | 172 | ||||||||||||||||||||||||||||||
Reserves replacement ratio, including sales (percent) |
145 | – | 51 | 33 | 6 | 32 | 46 | 2,382 | – | 166 | ||||||||||||||||||||||||||||||
Natural Gas (billions of cubic feet) |
||||||||||||||||||||||||||||||||||||||||
Revisions |
(235 | ) | 55 | 363 | 113 | (260 | ) | 28 | 64 | |||||||||||||||||||||||||||||||
Improved recovery |
– | – | – | – | – | – | – | |||||||||||||||||||||||||||||||||
Extensions/discoveries |
1,779 | 42 | 42 | – | 819 | – | 2,682 | |||||||||||||||||||||||||||||||||
Purchases |
303 | – | – | – | – | – | 303 | |||||||||||||||||||||||||||||||||
Sales |
(33 | ) | (347 | ) | (143 | ) | – | – | – | (523 | ) | |||||||||||||||||||||||||||||
Total additions |
1,814 | (250 | ) | 262 | 113 | 559 | 28 | 2,526 | ||||||||||||||||||||||||||||||||
Production |
1,559 | 173 | 1,295 | 39 | 1,921 | 132 | 5,119 | |||||||||||||||||||||||||||||||||
Net change |
255 | (423 | ) | (1,033 | ) | 74 | (1,362 | ) | (104 | ) | (2,593 | ) | ||||||||||||||||||||||||||||
Reserves replacement ratio, excluding sales (percent) |
118 | 56 | 31 | 290 | 29 | 21 | 60 | |||||||||||||||||||||||||||||||||
Reserves replacement ratio, including sales (percent) |
116 | – | 20 | 290 | 29 | 21 | 49 | |||||||||||||||||||||||||||||||||
| (1) | See Frequently Used Terms on pages 93 through 95. |
| (million barrels of oil or billion cubic feet of gas | Average | |||||||||||||||||||||||
| unless noted) | 2011 | 2010 | 2009 | 2008 | 2007 | 2007-2011 | ||||||||||||||||||
Non-U.S. |
||||||||||||||||||||||||
E&P costs (millions of dollars) |
20,024 | 17,619 | 17,985 | 14,095 | 11,227 | 16,190 | ||||||||||||||||||
Liquids reserves additions |
1,175 | 426 | 375 | 1,933 | 368 | 855 | ||||||||||||||||||
Liquids production |
689 | 735 | 731 | 747 | 812 | 743 | ||||||||||||||||||
Gas reserves additions |
712 | 179 | 5,340 | 2,099 | 2,685 | 2,203 | ||||||||||||||||||
Gas production |
3,560 | 3,680 | 3,124 | 3,075 | 3,101 | 3,308 | ||||||||||||||||||
Oil-equivalent reserves additions, excluding sales |
1,425 | 459 | 1,266 | 2,377 | 1,293 | 1,364 | ||||||||||||||||||
Oil-equivalent reserves additions, including sales |
1,295 | 456 | 1,264 | 2,283 | 815 | 1,223 | ||||||||||||||||||
Oil-equivalent production |
1,283 | 1,348 | 1,252 | 1,259 | 1,329 | 1,294 | ||||||||||||||||||
Reserves replacement ratio, excluding sales (percent) |
111 | 34 | 101 | 189 | 97 | 105 | ||||||||||||||||||
Reserves replacement ratio, including sales (percent) |
101 | 34 | 101 | 181 | 61 | 95 | ||||||||||||||||||
Reserves replacement costs(2) (dollars per barrel) |
14.05 | 38.39 | 14.21 | 5.93 | 8.68 | 11.87 | ||||||||||||||||||
United States |
||||||||||||||||||||||||
E&P costs (millions of dollars) |
11,956 | 54,107 | 3,541 | 3,473 | 2,299 | 15,075 | ||||||||||||||||||
Liquids reserves additions |
223 | 479 | 140 | (122 | ) | 91 | 162 | |||||||||||||||||
Liquids production |
154 | 148 | 139 | 132 | 141 | 143 | ||||||||||||||||||
Gas reserves additions |
1,814 | 15,371 | 484 | (845 | ) | 1,767 | 3,718 | |||||||||||||||||
Gas production |
1,559 | 1,062 | 572 | 562 | 649 | 881 | ||||||||||||||||||
Oil-equivalent reserves additions, excluding sales |
536 | 3,077 | 224 | (257 | ) | 398 | 796 | |||||||||||||||||
Oil-equivalent reserves additions, including sales |
525 | 3,041 | 221 | (263 | ) | 386 | 782 | |||||||||||||||||
Oil-equivalent production |
414 | 325 | 234 | 226 | 249 | 290 | ||||||||||||||||||
Reserves replacement ratio, excluding sales (percent) |
129 | 947 | 96 | – | 160 | 274 | ||||||||||||||||||
Reserves replacement ratio, including sales (percent) |
127 | 936 | 94 | – | 155 | 270 | ||||||||||||||||||
Reserves replacement costs(2) (dollars per barrel) |
22.31 | 17.58 | 15.81 | – | 5.78 | 18.94 | ||||||||||||||||||
Worldwide |
||||||||||||||||||||||||
E&P costs (millions of dollars) |
31,980 | 71,726 | 21,526 | 17,568 | 13,526 | 31,265 | ||||||||||||||||||
Liquids reserves additions |
1,398 | 905 | 515 | 1,811 | 459 | 1,017 | ||||||||||||||||||
Liquids production |
843 | 883 | 870 | 879 | 953 | 886 | ||||||||||||||||||
Gas reserves additions |
2,526 | 15,550 | 5,824 | 1,254 | 4,452 | 5,921 | ||||||||||||||||||
Gas production |
5,119 | 4,742 | 3,696 | 3,637 | 3,750 | 4,189 | ||||||||||||||||||
Oil-equivalent reserves additions, excluding sales |
1,961 | 3,536 | 1,490 | 2,120 | 1,691 | 2,160 | ||||||||||||||||||
Oil-equivalent reserves additions, including sales |
1,820 | 3,497 | 1,485 | 2,020 | 1,201 | 2,005 | ||||||||||||||||||
Oil-equivalent production |
1,697 | 1,673 | 1,486 | 1,485 | 1,578 | 1,584 | ||||||||||||||||||
Reserves replacement ratio, excluding sales (percent) |
116 | 211 | 100 | 143 | 107 | 136 | ||||||||||||||||||
Reserves replacement ratio, including sales (percent) |
107 | 209 | 100 | 136 | 76 | 127 | ||||||||||||||||||
Reserves replacement costs(2) (dollars per barrel) |
16.31 | 20.28 | 14.45 | 8.29 | 8.00 | 14.47 | ||||||||||||||||||
| (1) | ExxonMobil reserves using SEC historical price bases. Proved reserves as defined by the SEC are based on historical market prices: prior to 2009, the SEC defined price as the market price on December 31; beginning in 2009, the SEC changed the definition to the average of the market prices on the first day of each calendar month during the year. Mining and equity company reserves are included for all periods. See Frequently Used Terms on pages 93 through 95. | |
| (2) | Calculation based on exploration and production costs divided by oil-equivalent reserves additions. All values exclude the impact of asset sales; i.e., reserves sold and proceeds received. |
49
|
|
|
50
|
| Total Revenues and Costs, Including Non-Consolidated Interests and Oil Sands | Revenues and Costs per Unit of Sales or Production(1) | |||||||||||||||||||||||||||||||||||||||||||
| Canada/ | Canada/ | |||||||||||||||||||||||||||||||||||||||||||
| United | South | Australia/ | United | South | Outside | |||||||||||||||||||||||||||||||||||||||
| States | America | Europe | Africa | Asia | Oceania | Total | States | America | Americas | Worldwide | ||||||||||||||||||||||||||||||||||
| 2011 | (millions of dollars) | (dollars per unit of sales) | ||||||||||||||||||||||||||||||||||||||||||
Revenue |
||||||||||||||||||||||||||||||||||||||||||||
Liquids |
14,362 | 7,584 | 10,149 | 20,204 | 29,411 | 1,793 | 83,503 | 92.80 | 83.06 | 102.99 | 98.97 | |||||||||||||||||||||||||||||||||
Natural gas |
4,926 | 494 | 11,278 | 7 | 11,311 | 481 | 28,497 | 3.45 | 3.29 | 7.16 | 5.93 | |||||||||||||||||||||||||||||||||
| (dollars per barrel of net oil-equivalent production) | ||||||||||||||||||||||||||||||||||||||||||||
Total revenue |
19,288 | 8,078 | 21,427 | 20,211 | 40,722 | 2,274 | 112,000 | 49.10 | 69.25 | 74.58 | 68.11 | |||||||||||||||||||||||||||||||||
Less costs: Production costs excluding taxes |
4,589 | 2,751 | 3,037 | 2,608 | 2,050 | 497 | 15,532 | 11.68 | 23.58 | 7.22 | 9.45 | |||||||||||||||||||||||||||||||||
Depreciation and depletion |
4,815 | 980 | 2,088 | 2,159 | 2,256 | 236 | 12,534 | 12.26 | 8.40 | 5.94 | 7.62 | |||||||||||||||||||||||||||||||||
Exploration expenses |
278 | 290 | 612 | 233 | 618 | 73 | 2,104 | 0.71 | 2.49 | 1.35 | 1.28 | |||||||||||||||||||||||||||||||||
Taxes other than income |
2,193 | 79 | 3,626 | 2,055 | 8,337 | 295 | 16,585 | 5.58 | 0.68 | 12.61 | 10.08 | |||||||||||||||||||||||||||||||||
Related income tax |
2,445 | 969 | 7,689 | 7,888 | 14,062 | 353 | 33,406 | 6.22 | 8.31 | 26.43 | 20.32 | |||||||||||||||||||||||||||||||||
Results of producing activities |
4,968 | 3,009 | 4,375 | 5,268 | 13,399 | 820 | 31,839 | 12.65 | 25.79 | 21.03 | 19.36 | |||||||||||||||||||||||||||||||||
Other
earnings(2) |
133 | (322 | ) | 2,729 | 88 | (259 | ) | (9 | ) | 2,360 | 0.33 | (2.76 | ) | 2.24 | 1.44 | |||||||||||||||||||||||||||||
Total earnings, excluding power and coal |
5,101 | 2,687 | 7,104 | 5,356 | 13,140 | 811 | 34,199 | 12.98 | 23.03 | 23.27 | 20.80 | |||||||||||||||||||||||||||||||||
Power and coal |
(5 | ) | – | – | – | 245 | – | 240 | ||||||||||||||||||||||||||||||||||||
Total earnings |
5,096 | 2,687 | 7,104 | 5,356 | 13,385 | 811 | 34,439 | |||||||||||||||||||||||||||||||||||||
| 2010 | (millions of dollars) | (dollars per unit of sales) | ||||||||||||||||||||||||||||||||||||||||||
Revenue |
||||||||||||||||||||||||||||||||||||||||||||
Liquids |
10,567 | 6,343 | 8,935 | 17,511 | 19,118 | 1,418 | 63,892 | 70.98 | 66.27 | 74.67 | 73.12 | |||||||||||||||||||||||||||||||||
Natural gas |
3,716 | 707 | 9,358 | 11 | 7,990 | 401 | 22,183 | 3.92 | 3.41 | 5.42 | 5.00 | |||||||||||||||||||||||||||||||||
| (dollars per barrel of net oil-equivalent production) | ||||||||||||||||||||||||||||||||||||||||||||
Total revenue |
14,283 | 7,050 | 18,293 | 17,522 | 27,108 | 1,819 | 86,075 | 46.53 | 54.18 | 54.59 | 53.04 | |||||||||||||||||||||||||||||||||
Less costs: Production costs excluding taxes |
3,275 | 2,612 | 3,011 | 2,215 | 1,628 | 462 | 13,203 | 10.67 | 20.07 | 6.17 | 8.14 | |||||||||||||||||||||||||||||||||
Depreciation and depletion |
3,507 | 1,015 | 2,719 | 2,580 | 1,596 | 219 | 11,636 | 11.43 | 7.80 | 6.00 | 7.17 | |||||||||||||||||||||||||||||||||
Exploration expenses |
287 | 464 | 413 | 587 | 362 | 56 | 2,169 | 0.94 | 3.57 | 1.20 | 1.34 | |||||||||||||||||||||||||||||||||
Taxes other than income |
1,220 | 86 | 2,997 | 1,742 | 5,142 | 204 | 11,391 | 3.96 | 0.67 | 8.49 | 7.02 | |||||||||||||||||||||||||||||||||
Related income tax |
2,093 | 715 | 5,543 | 6,068 | 9,147 | 262 | 23,828 | 6.82 | 5.49 | 17.73 | 14.68 | |||||||||||||||||||||||||||||||||
Results of producing activities |
3,901 | 2,158 | 3,610 | 4,330 | 9,233 | 616 | 23,848 | 12.71 | 16.58 | 15.00 | 14.69 | |||||||||||||||||||||||||||||||||
Other
earnings(2) |
379 | (538 | ) | 216 | 96 | (120 | ) | (15 | ) | 18 | 1.23 | (4.13 | ) | 0.15 | 0.02 | |||||||||||||||||||||||||||||
Total earnings, excluding power and coal |
4,280 | 1,620 | 3,826 | 4,426 | 9,113 | 601 | 23,866 | 13.94 | 12.45 | 15.15 | 14.71 | |||||||||||||||||||||||||||||||||
Power and coal |
(8 | ) | – | – | – | 239 | – | 231 | ||||||||||||||||||||||||||||||||||||
Total earnings |
4,272 | 1,620 | 3,826 | 4,426 | 9,352 | 601 | 24,097 | |||||||||||||||||||||||||||||||||||||
| (1) | The per-unit data are divided into two sections: (a) revenue per unit of sales from ExxonMobil’s own production; and, (b) operating costs and earnings per unit of net oil-equivalent production. Units for crude oil and natural gas liquids are barrels, while units for natural gas are thousands of cubic feet. The volumes of crude oil and natural gas liquids production and net natural gas production available for sale used in this calculation are shown on pages 42 and 43. The volumes of natural gas were converted to oil-equivalent barrels based on a conversion factor of 6 thousand cubic feet per barrel. | |
| (2) | Includes earnings related to transportation operations, LNG liquefaction and transportation operations, sale of third-party purchases, technical services agreements, other nonoperating activities, and adjustments for minority interests. |
| Total Revenues and Costs, Including Non-Consolidated Interests and Oil Sands | Revenues and Costs per Unit of Sales or Production(1) | |||||||||||||||||||||||||||||||||||||||||||
| Canada/ | Canada/ | |||||||||||||||||||||||||||||||||||||||||||
| United | South | Australia/ | United | South | Outside | |||||||||||||||||||||||||||||||||||||||
| States | America | Europe | Africa | Asia | Oceania | Total | States | America | Americas | Worldwide | ||||||||||||||||||||||||||||||||||
| 2009 | (millions of dollars) | (dollars per unit of sales) | ||||||||||||||||||||||||||||||||||||||||||
Revenue |
||||||||||||||||||||||||||||||||||||||||||||
Liquids |
7,573 | 5,135 | 7,739 | 14,868 | 12,941 | 1,311 | 49,567 | 54.02 | 51.88 | 58.53 | 57.04 | |||||||||||||||||||||||||||||||||
Natural gas |
1,442 | 748 | 9,080 | 12 | 4,237 | 341 | 15,860 | 3.10 | 3.19 | 5.09 | 4.69 | |||||||||||||||||||||||||||||||||
| (dollars per barrel of net oil-equivalent production) | ||||||||||||||||||||||||||||||||||||||||||||
Total revenue |
9,015 | 5,883 | 16,819 | 14,880 | 17,178 | 1,652 | 65,427 | 41.41 | 43.02 | 46.74 | 45.58 | |||||||||||||||||||||||||||||||||
Less costs: |
||||||||||||||||||||||||||||||||||||||||||||
Production costs
excluding taxes |
2,736 | 2,428 | 2,923 | 2,027 | 1,498 | 386 | 11,998 | 12.57 | 17.75 | 6.32 | 8.36 | |||||||||||||||||||||||||||||||||
Depreciation and depletion |
1,833 | 948 | 2,246 | 2,293 | 1,182 | 195 | 8,697 | 8.42 | 6.93 | 5.47 | 6.06 | |||||||||||||||||||||||||||||||||
Exploration expenses |
220 | 339 | 387 | 662 | 393 | 33 | 2,034 | 1.01 | 2.48 | 1.36 | 1.42 | |||||||||||||||||||||||||||||||||
Taxes other than income |
767 | 78 | 2,826 | 1,343 | 3,111 | 252 | 8,377 | 3.52 | 0.57 | 6.97 | 5.83 | |||||||||||||||||||||||||||||||||
Related income tax |
1,127 | 597 | 5,179 | 4,667 | 5,943 | 237 | 17,750 | 5.18 | 4.37 | 14.83 | 12.37 | |||||||||||||||||||||||||||||||||
Results of producing activities |
2,332 | 1,493 | 3,258 | 3,888 | 5,051 | 549 | 16,571 | 10.71 | 10.92 | 11.79 | 11.54 | |||||||||||||||||||||||||||||||||
Other
earnings(2) |
565 | (605 | ) | 325 | 81 | (86 | ) | 36 | 316 | 2.60 | (4.43 | ) | 0.33 | 0.22 | ||||||||||||||||||||||||||||||
Total earnings, excluding power and coal |
2,897 | 888 | 3,583 | 3,969 | 4,965 | 585 | 16,887 | 13.31 | 6.49 | 12.12 | 11.76 | |||||||||||||||||||||||||||||||||
Power and coal |
(4 | ) | – | – | – | 224 | – | 220 | ||||||||||||||||||||||||||||||||||||
Total earnings |
2,893 | 888 | 3,583 | 3,969 | 5,189 | 585 | 17,107 | |||||||||||||||||||||||||||||||||||||
| 2008 | (millions of dollars) | (dollars per unit of sales) | ||||||||||||||||||||||||||||||||||||||||||
Revenue |
||||||||||||||||||||||||||||||||||||||||||||
Liquids |
11,788 | 8,540 | 13,910 | 20,606 | 20,288 | 2,111 | 77,243 | 87.95 | 81.43 | 91.66 | 89.84 | |||||||||||||||||||||||||||||||||
Natural gas |
3,296 | 1,834 | 15,230 | 39 | 7,005 | 389 | 27,793 | 7.23 | 7.82 | 8.59 | 8.35 | |||||||||||||||||||||||||||||||||
| (dollars per barrel of net oil-equivalent production) | ||||||||||||||||||||||||||||||||||||||||||||
Total revenue |
15,084 | 10,374 | 29,140 | 20,645 | 27,293 | 2,500 | 105,036 | 71.73 | 71.23 | 73.74 | 73.19 | |||||||||||||||||||||||||||||||||
Less costs: Production costs excluding taxes |
2,675 | 2,625 | 3,051 | 1,603 | 1,392 | 332 | 11,678 | 12.72 | 18.03 | 5.91 | 8.14 | |||||||||||||||||||||||||||||||||
Depreciation and depletion |
1,427 | 1,043 | 2,662 | 2,471 | 1,231 | 179 | 9,013 | 6.79 | 7.16 | 6.06 | 6.28 | |||||||||||||||||||||||||||||||||
Exploration expenses |
189 | 251 | 183 | 439 | 292 | 109 | 1,463 | 0.90 | 1.72 | 0.95 | 1.02 | |||||||||||||||||||||||||||||||||
Taxes other than income |
2,021 | 81 | 4,248 | 1,815 | 5,457 | 665 | 14,287 | 9.61 | 0.55 | 11.29 | 9.95 | |||||||||||||||||||||||||||||||||
Related income tax |
3,191 | 1,813 | 11,979 | 8,119 | 10,691 | 399 | 36,192 | 15.17 | 12.45 | 28.90 | 25.22 | |||||||||||||||||||||||||||||||||
Results of producing activities |
5,581 | 4,561 | 7,017 | 6,198 | 8,230 | 816 | 32,403 | 26.54 | 31.32 | 20.63 | 22.58 | |||||||||||||||||||||||||||||||||
Other
earnings(2) |
687 | (997 | ) | 2,860 | 212 | (45 | ) | 29 | 2,746 | 3.27 | (6.85 | ) | 2.83 | 1.91 | ||||||||||||||||||||||||||||||
Total earnings, excluding power and coal |
6,268 | 3,564 | 9,877 | 6,410 | 8,185 | 845 | 35,149 | 29.81 | 24.47 | 23.46 | 24.49 | |||||||||||||||||||||||||||||||||
Power and coal |
(25 | ) | – | – | – | 278 | – | 253 | ||||||||||||||||||||||||||||||||||||
Total earnings |
6,243 | 3,564 | 9,877 | 6,410 | 8,463 | 845 | 35,402 | |||||||||||||||||||||||||||||||||||||
| 2007 | (millions of dollars) | (dollars per unit of sales) | ||||||||||||||||||||||||||||||||||||||||||
Revenue |
||||||||||||||||||||||||||||||||||||||||||||
Liquids |
8,997 | 6,569 | 11,986 | 17,834 | 15,878 | 1,752 | 63,016 | 62.86 | 55.27 | 69.32 | 66.58 | |||||||||||||||||||||||||||||||||
Natural gas |
3,176 | 1,704 | 9,911 | 21 | 4,763 | 400 | 19,975 | 5.93 | 5.77 | 5.82 | 5.83 | |||||||||||||||||||||||||||||||||
| (dollars per barrel of net oil-equivalent production) | ||||||||||||||||||||||||||||||||||||||||||||
Total revenue |
12,173 | 8,273 | 21,897 | 17,855 | 20,641 | 2,152 | 82,991 | 52.42 | 49.40 | 55.55 | 54.40 | |||||||||||||||||||||||||||||||||
Less costs: |
||||||||||||||||||||||||||||||||||||||||||||
Production costs excluding taxes |
2,275 | 2,206 | 3,243 | 1,180 | 1,163 | 266 | 10,333 | 9.80 | 13.17 | 5.20 | 6.77 | |||||||||||||||||||||||||||||||||
Depreciation and depletion |
1,493 | 1,256 | 2,657 | 2,101 | 1,229 | 172 | 8,908 | 6.43 | 7.50 | 5.47 | 5.85 | |||||||||||||||||||||||||||||||||
Exploration expenses |
282 | 273 | 170 | 470 | 205 | 102 | 1,502 | 1.21 | 1.63 | 0.84 | 0.98 | |||||||||||||||||||||||||||||||||
Taxes other than income |
1,347 | 126 | 2,528 | 1,599 | 3,561 | 570 | 9,731 | 5.80 | 0.75 | 7.33 | 6.38 | |||||||||||||||||||||||||||||||||
Related income tax |
2,429 | 1,190 | 8,190 | 7,263 | 8,140 | 331 | 27,543 | 10.46 | 7.11 | 21.25 | 18.05 | |||||||||||||||||||||||||||||||||
Results of producing activities |
4,347 | 3,222 | 5,109 | 5,242 | 6,343 | 711 | 24,974 | 18.72 | 19.24 | 15.46 | 16.37 | |||||||||||||||||||||||||||||||||
Other earnings(2) |
609 | (504 | ) | 944 | 277 | (13 | ) | (1 | ) | 1,312 | 2.62 | (3.01 | ) | 1.07 | 0.86 | |||||||||||||||||||||||||||||
Total earnings, excluding power and coal |
4,956 | 2,718 | 6,053 | 5,519 | 6,330 | 710 | 26,286 | 21.34 | 16.23 | 16.53 | 17.23 | |||||||||||||||||||||||||||||||||
Power and coal |
(86 | ) | – | – | – | 297 | – | 211 | ||||||||||||||||||||||||||||||||||||
Total earnings |
4,870 | 2,718 | 6,053 | 5,519 | 6,627 | 710 | 26,497 | |||||||||||||||||||||||||||||||||||||
51
|
|
 |
54
|

| DOWNSTREAM STATISTICAL RECAP | 2011 | 2010 | 2009 | 2008 | 2007 | |||||||||||||||
Earnings (millions of dollars) |
4,459 | 3,567 | 1,781 | 8,151 | 9,573 | |||||||||||||||
Refinery throughput (thousands of barrels per day) |
5,214 | 5,253 | 5,350 | 5,416 | 5,571 | |||||||||||||||
Petroleum product sales (thousands of barrels per day) |
6,413 | 6,414 | 6,428 | 6,761 | 7,099 | |||||||||||||||
Average capital employed
(1)
(millions of dollars) |
23,388 | 24,130 | 25,099 | 25,627 | 25,314 | |||||||||||||||
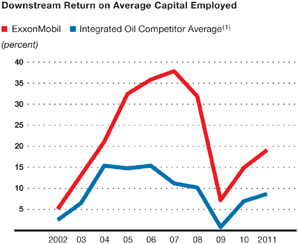
Return on average capital employed
(1)
(percent) |
19.1 | 14.8 | 7.1 | 31.8 | 37.8 | |||||||||||||||
Capital
expenditures(1)
(millions of dollars) |
2,120 | 2,505 | 3,196 | 3,529 | 3,303 | |||||||||||||||

55
|
 |
|
56
|
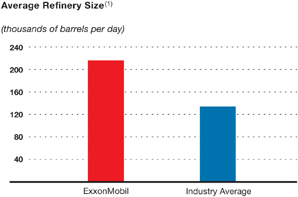
Refinery interests |
36 | |||
Distillation
capacity (barrels per day) |
6.2 million | |||
Lube
basestock capacity (barrels per day) |
131 thousand | |||
Branded service stations |
~25,000 | |||
Commercial customers |
~500,000 |
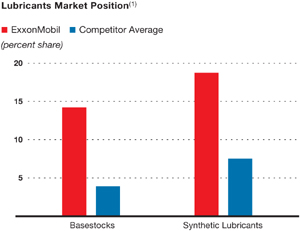
Market position
|
No.1 supplier of lube basestocks
and marketer of synthetic lubricants |
57
|
|
|
58
|
59
|
|
|
60
|
61
|
|
|
62
|
63
|
|
|
64
|
65
|
|
 |
66
|
| 2011 | 2010 | 2009 | 2008 | 2007 | ||||||||||||||||
Refinery Throughput(2) (thousands of barrels per day) |
||||||||||||||||||||
United States |
1,784 | 1,753 | 1,767 | 1,702 | 1,746 | |||||||||||||||
Canada |
430 | 444 | 413 | 446 | 442 | |||||||||||||||
Europe |
1,528 | 1,538 | 1,548 | 1,601 | 1,642 | |||||||||||||||
Japan |
520 | 536 | 556 | 563 | 618 | |||||||||||||||
Asia Pacific excluding Japan |
660 | 713 | 772 | 789 | 798 | |||||||||||||||
Middle East/Latin America/Other |
292 | 269 | 294 | 315 | 325 | |||||||||||||||
Total worldwide |
5,214 | 5,253 | 5,350 | 5,416 | 5,571 | |||||||||||||||
Average Refining Capacity(3) (thousands of barrels per day) |
||||||||||||||||||||
United States |
1,952 | 1,962 | 1,970 | 1,967 | 1,963 | |||||||||||||||
Canada |
506 | 505 | 502 | 502 | 502 | |||||||||||||||
Europe |
1,752 | 1,744 | 1,742 | 1,740 | 1,759 | |||||||||||||||
Japan |
653 | 681 | 680 | 702 | 769 | |||||||||||||||
Asia Pacific excluding Japan |
1,032 | 1,030 | 1,006 | 992 | 983 | |||||||||||||||
Middle East/Latin America/Other |
331 | 331 | 331 | 330 | 330 | |||||||||||||||
Total worldwide |
6,226 | 6,253 | 6,231 | 6,233 | 6,306 | |||||||||||||||
Utilization of Refining Capacity (percent) |
||||||||||||||||||||
United States |
91 | 89 | 90 | 87 | 89 | |||||||||||||||
Canada |
85 | 88 | 82 | 89 | 88 | |||||||||||||||
Europe |
87 | 88 | 89 | 92 | 93 | |||||||||||||||
Japan |
80 | 79 | 82 | 80 | 80 | |||||||||||||||
Asia Pacific excluding Japan |
64 | 69 | 77 | 80 | 81 | |||||||||||||||
Middle East/Latin America/Other |
88 | 81 | 89 | 95 | 98 | |||||||||||||||
Total worldwide |
84 | 84 | 86 | 87 | 88 | |||||||||||||||
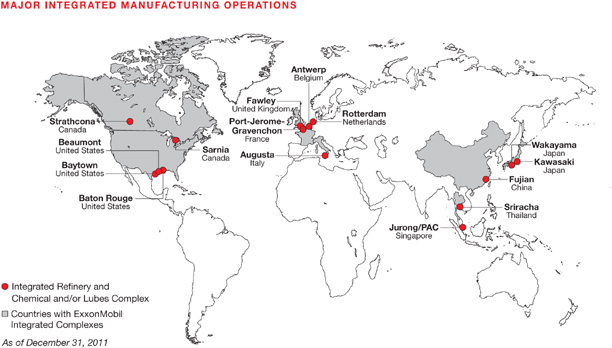
| (1) | Excludes ExxonMobil’s interest in the Laffan Refinery in Qatar and ExxonMobil’s minor interests in certain small refineries. |
| (2) | Refinery throughput includes 100 percent of crude oil and feedstocks sent directly to atmospheric distillation units in operations of ExxonMobil and majority-owned subsidiaries. For companies owned 50 percent or less, throughput includes the greater of either crude and feedstocks processed for ExxonMobil or ExxonMobil’s equity interest in raw material inputs. |
| (3) | Refining capacity is the stream-day capability to process inputs to atmospheric distillation units under normal operating conditions, less the impact of shutdowns for regular repair and maintenance activities, averaged over an extended period of time. These annual averages include partial-year impacts for capacity additions or deletions during the year. Any idle capacity that cannot be made operable in a month or less has been excluded. Capacity volumes include 100 percent of the capacity of refinery facilities managed by ExxonMobil or majority-owned subsidiaries. At facilities of companies owned 50 percent or less, the greater of either that portion of capacity normally available to ExxonMobil or ExxonMobil’s equity interest is included. |
| Capacity at 100% | ||||||||||||||||||||||||||||||||||||
| ExxonMobil | ||||||||||||||||||||||||||||||||||||
| ExxonMobil | Atmospheric | Catalytic | Residuum | Interest | ||||||||||||||||||||||||||||||||
| (thousands of barrels per day) | Share(2) | Distillation | Cracking | Hydrocracking | Conversion(3) | Lubricants(4) | % | |||||||||||||||||||||||||||||
United States |
||||||||||||||||||||||||||||||||||||
Torrance |
California | l | 150 | 150 | 83 | 21 | 50 | 0 | 100 | |||||||||||||||||||||||||||
Joliet |
Illinois | l | 238 | 238 | 94 | 0 | 56 | 0 | 100 | |||||||||||||||||||||||||||
Baton Rouge |
Louisiana | n | l | 502 | 502 | 231 | 25 | 117 | 16 | 100 | ||||||||||||||||||||||||||
Chalmette |
Louisiana | l | 5 | 95 | 189 | 72 | 0 | 29 | 0 | 50 | ||||||||||||||||||||||||||
Billings |
Montana | l | 60 | 60 | 19 | 6 | 10 | 0 | 100 | |||||||||||||||||||||||||||
Baytown |
Texas | n | l | 561 | 561 | 205 | 27 | 90 | 22 | 100 | ||||||||||||||||||||||||||
Beaumont |
Texas | n | l | 345 | 345 | 113 | 60 | 46 | 10 | 100 | ||||||||||||||||||||||||||
Total United States |
1,951 | 2,045 | 817 | 139 | 398 | 48 | ||||||||||||||||||||||||||||||
Canada |
||||||||||||||||||||||||||||||||||||
Strathcona |
Alberta | 189 | 189 | 63 | 0 | 0 | 2 | 69.6 | ||||||||||||||||||||||||||||
Dartmouth |
Nova Scotia | 5 | 85 | 85 | 31 | 0 | 0 | 0 | 69.6 | |||||||||||||||||||||||||||
Nanticoke |
Ontario | 5 | 113 | 113 | 48 | 0 | 0 | 0 | 69.6 | |||||||||||||||||||||||||||
Sarnia |
Ontario | n | l | 119 | 119 | 30 | 18 | 25 | 0 | 69.6 | ||||||||||||||||||||||||||
Total Canada |
506 | 506 | 172 | 18 | 25 | 2 | ||||||||||||||||||||||||||||||
Europe |
||||||||||||||||||||||||||||||||||||
Antwerp |
Belgium | n | l | 307 | 307 | 35 | 0 | 0 | 0 | 100 | ||||||||||||||||||||||||||
Fos-sur-Mer |
France | l | 5 | 129 | 129 | 31 | 0 | 0 | 0 | 82.9 | ||||||||||||||||||||||||||
Port-Jerome- |
||||||||||||||||||||||||||||||||||||
Gravenchon |
France | n | l | 235 | 235 | 39 | 0 | 0 | 13 | 82.9 | ||||||||||||||||||||||||||
Karlsruhe |
Germany | l | 5 | 78 | 310 | 86 | 0 | 30 | 0 | 25 | ||||||||||||||||||||||||||
Augusta |
Italy | l | 5 | 198 | 198 | 50 | 0 | 0 | 14 | 100 | ||||||||||||||||||||||||||
Trecate |
Italy | l | 5 | 174 | 174 | 35 | 0 | 0 | 0 | 74.1 | ||||||||||||||||||||||||||
Rotterdam |
Netherlands | n | l | 191 | 191 | 0 | 52 | 41 | 0 | 100 | ||||||||||||||||||||||||||
Slagen |
Norway | 116 | 116 | 0 | 0 | 32 | 0 | 100 | ||||||||||||||||||||||||||||
Fawley |
United Kingdom | n | l | 330 | 330 | 89 | 0 | 37 | 9 | 100 | ||||||||||||||||||||||||||
Total Europe |
1,758 | 1,990 | 365 | 52 | 140 | 36 | ||||||||||||||||||||||||||||||
Japan |
||||||||||||||||||||||||||||||||||||
Chiba |
Japan | l | 5 | 86 | 172 | 33 | 39 | 0 | 0 | 50 | ||||||||||||||||||||||||||
Kawasaki |
Japan | n | l | 240 | 240 | 87 | 23 | 0 | 0 | 50.1 | ||||||||||||||||||||||||||
Sakai |
Japan | l | 5 | 139 | 139 | 40 | 0 | 0 | 0 | 50.1 | ||||||||||||||||||||||||||
Wakayama |
Japan | l | 5 | 160 | 160 | 37 | 0 | 0 | 7 | 50.1 | ||||||||||||||||||||||||||
Total Japan |
625 | 711 | 197 | 62 | 0 | 7 | ||||||||||||||||||||||||||||||
| (1) | Capacity data is based on 100 percent of rated refinery process unit stream-day capacities under normal operating conditions, less the impact of shutdowns for regular repair and maintenance activities, averaged over an extended period of time. |
| (2) | ExxonMobil share reflects 100 percent of atmospheric distillation capacity in operations of ExxonMobil and majority-owned subsidiaries. For companies owned 50 percent or less, ExxonMobil share is the greater of ExxonMobil’s equity interest or that portion of distillation capacity normally available to ExxonMobil. |
| (3) | Includes thermal cracking, visbreaking, coking, and hydrorefining processes. |
| (4) | Lubes capacity based on dewaxed oil production. |
| (5) | Announced divestment in 2011. |
| (6) | Financial results incorporated into Upstream business. |
67
|
 |
|
68
|
| Capacity at 100% | ||||||||||||||||||||||||||||||||||||
| ExxonMobil | ||||||||||||||||||||||||||||||||||||
| ExxonMobil | Atmospheric | Catalytic | Residuum | Interest | ||||||||||||||||||||||||||||||||
| (thousands of barrels per day) | Share(2) | Distillation | Cracking | Hydrocracking | Conversion(3) | Lubricants(4) | % | |||||||||||||||||||||||||||||
| Asia Pacific excluding Japan | ||||||||||||||||||||||||||||||||||||
Altona |
Australia | 5 | 78 | 78 | 28 | 0 | 0 | 0 | 100 | |||||||||||||||||||||||||||
Fujian |
China | n | l | 63 | 252 | 37 | 41 | 10 | 0 | 25 | ||||||||||||||||||||||||||
Port Dickson(5) |
Malaysia | 86 | 86 | 0 | 0 | 0 | 0 | 65 | ||||||||||||||||||||||||||||
Whangarei |
New Zealand | 27 | 134 | 0 | 31 | 0 | 0 | 19.2 | ||||||||||||||||||||||||||||
Jurong/PAC |
Singapore | n | l | 605 | 605 | 0 | 36 | 106 | 38 | 100 | ||||||||||||||||||||||||||
Sriracha |
Thailand | n | l | 174 | 174 | 42 | 0 | 0 | 0 | 66 | ||||||||||||||||||||||||||
Total Asia Pacific excluding Japan |
1,033 | 1,329 | 107 | 108 | 116 | 38 | ||||||||||||||||||||||||||||||
Middle East |
||||||||||||||||||||||||||||||||||||
Laffan(6) |
Qatar | 14 | 139 | 0 | 0 | 0 | 0 | 10 | ||||||||||||||||||||||||||||
Yanbu |
Saudi Arabia | 200 | 400 | 91 | 0 | 46 | 0 | 50 | ||||||||||||||||||||||||||||
Total Middle East |
214 | 539 | 91 | 0 | 46 | 0 | ||||||||||||||||||||||||||||||
Latin America/Other |
||||||||||||||||||||||||||||||||||||
Campana(5) |
Argentina | l | 5 | 87 | 87 | 27 | 0 | 24 | 0 | 100 | ||||||||||||||||||||||||||
Acajutla(5) |
El Salvador | 22 | 22 | 0 | 0 | 0 | 0 | 65 | ||||||||||||||||||||||||||||
Martinique |
Martinique | 2 | 17 | 0 | 0 | 0 | 0 | 14.5 | ||||||||||||||||||||||||||||
Managua(5) |
Nicaragua | 5 | 20 | 20 | 0 | 0 | 0 | 0 | 100 | |||||||||||||||||||||||||||
Total Latin America/Other |
131 | 146 | 27 | 0 | 24 | 0 | ||||||||||||||||||||||||||||||
Total worldwide |
6,218 | 7,266 | 1,776 | 379 | 749 | 131 | ||||||||||||||||||||||||||||||
| (number of sites at year end) | 2011 | 2010 | 2009 | 2008 | 2007 | |||||||||||||||
Worldwide |
||||||||||||||||||||
Owned/leased |
7,753 | 8,710 | 9,965 | 10,516 | 11,446 | |||||||||||||||
Distributors/resellers |
17,267 | 17,568 | 17,755 | 18,158 | 20,940 | |||||||||||||||
Total worldwide |
25,020 | 26,278 | 27,720 | 28,674 | 32,386 | |||||||||||||||


| (thousands of barrels per day) | 2011 | 2010 | 2009 | 2008 | 2007 | |||||||||||||||
United States |
||||||||||||||||||||
Motor gasoline, naphthas |
1,372 | 1,445 | 1,425 | 1,449 | 1,601 | |||||||||||||||
Heating oils, kerosene, diesel oils |
564 | 480 | 517 | 501 | 470 | |||||||||||||||
Aviation fuels |
178 | 181 | 207 | 224 | 235 | |||||||||||||||
Heavy fuels |
129 | 122 | 106 | 108 | 121 | |||||||||||||||
Lubricants, specialty, and other petroleum products |
287 | 283 | 268 | 258 | 290 | |||||||||||||||
Total United States |
2,530 | 2,511 | 2,523 | 2,540 | 2,717 | |||||||||||||||
Canada |
||||||||||||||||||||
Motor gasoline, naphthas |
219 | 217 | 199 | 203 | 207 | |||||||||||||||
Heating oils, kerosene, diesel oils |
126 | 125 | 119 | 131 | 139 | |||||||||||||||
Aviation fuels |
31 | 27 | 23 | 25 | 25 | |||||||||||||||
Heavy fuels |
29 | 27 | 27 | 30 | 33 | |||||||||||||||
Lubricants, specialty, and other petroleum products |
50 | 54 | 45 | 55 | 57 | |||||||||||||||
Total Canada |
455 | 450 | 413 | 444 | 461 | |||||||||||||||
Europe |
||||||||||||||||||||
Motor gasoline, naphthas |
433 | 423 | 409 | 409 | 414 | |||||||||||||||
Heating oils, kerosene, diesel oils |
706 | 707 | 710 | 730 | 723 | |||||||||||||||
Aviation fuels |
116 | 116 | 127 | 149 | 177 | |||||||||||||||
Heavy fuels |
166 | 179 | 175 | 183 | 220 | |||||||||||||||
Lubricants, specialty, and other petroleum products |
175 | 186 | 204 | 241 | 239 | |||||||||||||||
Total Europe |
1,596 | 1,611 | 1,625 | 1,712 | 1,773 | |||||||||||||||
Asia Pacific |
||||||||||||||||||||
Motor gasoline, naphthas |
347 | 365 | 379 | 378 | 403 | |||||||||||||||
Heating oils, kerosene, diesel oils |
405 | 432 | 455 | 467 | 477 | |||||||||||||||
Aviation fuels |
102 | 95 | 116 | 123 | 111 | |||||||||||||||
Heavy fuels |
213 | 209 | 234 | 238 | 276 | |||||||||||||||
Lubricants, specialty, and other petroleum products |
137 | 140 | 145 | 153 | 152 | |||||||||||||||
Total Asia Pacific |
1,204 | 1,241 | 1,329 | 1,359 | 1,419 | |||||||||||||||
Latin America |
||||||||||||||||||||
Motor gasoline, naphthas |
79 | 80 | 83 | 139 | 151 | |||||||||||||||
Heating oils, kerosene, diesel oils |
111 | 113 | 113 | 161 | 173 | |||||||||||||||
Aviation fuels |
31 | 29 | 28 | 45 | 48 | |||||||||||||||
Heavy fuels |
31 | 34 | 33 | 47 | 48 | |||||||||||||||
Lubricants, specialty, and other petroleum products |
24 | 24 | 22 | 27 | 27 | |||||||||||||||
Total Latin America |
276 | 280 | 279 | 419 | 447 | |||||||||||||||
Middle East/Africa |
||||||||||||||||||||
Motor gasoline, naphthas |
91 | 81 | 78 | 76 | 74 | |||||||||||||||
Heating oils, kerosene, diesel oils |
107 | 94 | 99 | 106 | 112 | |||||||||||||||
Aviation fuels |
34 | 28 | 35 | 41 | 45 | |||||||||||||||
Heavy fuels |
20 | 32 | 23 | 30 | 17 | |||||||||||||||
Lubricants, specialty, and other petroleum products |
100 | 86 | 24 | 34 | 34 | |||||||||||||||
Total Middle East/Africa |
352 | 321 | 259 | 287 | 282 | |||||||||||||||
Worldwide |
||||||||||||||||||||
Motor gasoline, naphthas |
2,541 | 2,611 | 2,573 | 2,654 | 2,850 | |||||||||||||||
Heating oils, kerosene, diesel oils |
2,019 | 1,951 | 2,013 | 2,096 | 2,094 | |||||||||||||||
Aviation fuels |
492 | 476 | 536 | 607 | 641 | |||||||||||||||
Heavy fuels |
588 | 603 | 598 | 636 | 715 | |||||||||||||||
Lubricants, specialty, and other petroleum products |
773 | 773 | 708 | 768 | 799 | |||||||||||||||
Total worldwide |
6,413 | 6,414 | 6,428 | 6,761 | 7,099 | |||||||||||||||
| (1) | Petroleum product sales include 100 percent of the sales of ExxonMobil and majority-owned subsidiaries, and the ExxonMobil equity interest in sales by companies owned 50 percent or less. |
69
|
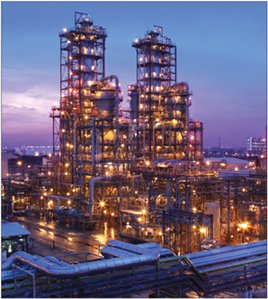
|
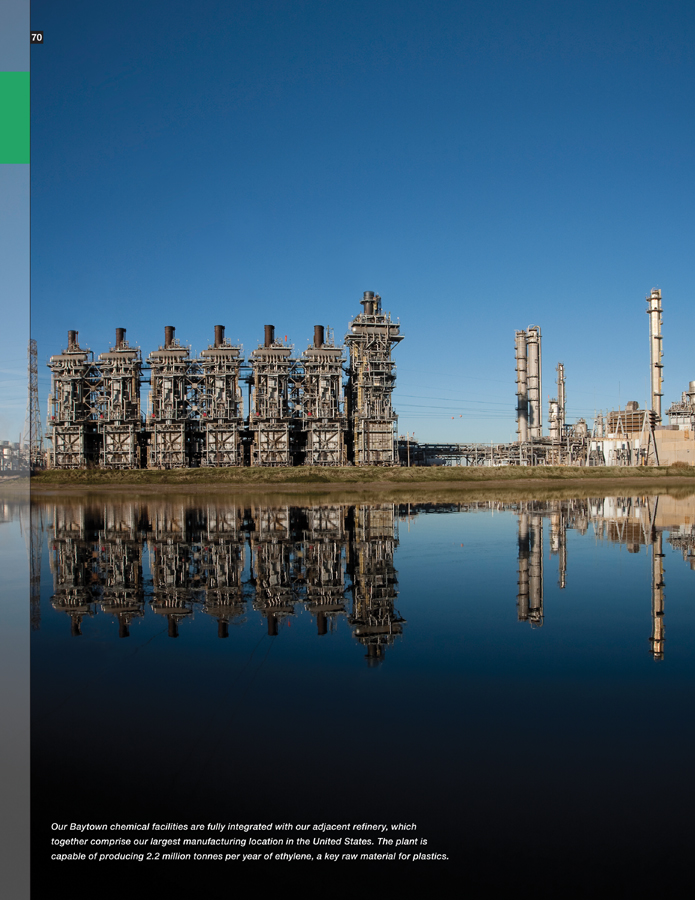
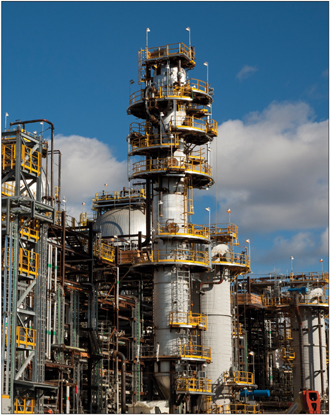
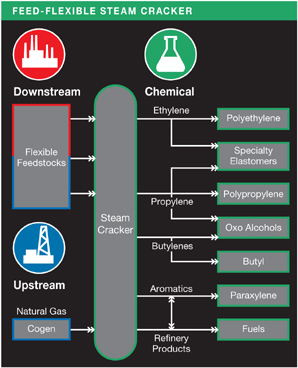
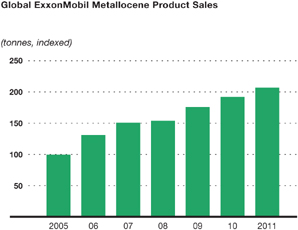
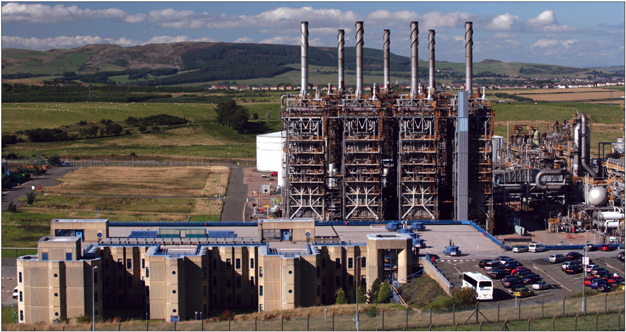
| Our Baytown chemical facilities are fully integrated with our adjacent refinery, which together comprise our largest manufacturing location in the United States. The plant is capable of producing 2.2 million tonnes per year of ethylene, a key raw material for plastics. |
 |
72
|

| CHEMICAL STATISTICAL RECAP | 2011 | 2010 | 2009 | 2008 | 2007 | |||||||||||||||
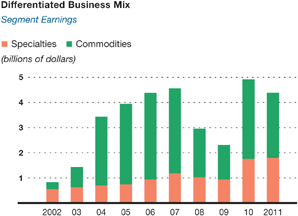
Earnings (millions of dollars) |
4,383 | 4,913 | 2,309 | 2,957 | 4,563 | |||||||||||||||
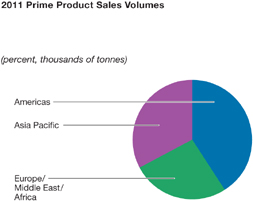
Prime product sales(1) (thousands of tonnes) |
25,006 | 25,891 | 24,825 | 24,982 | 27,480 | |||||||||||||||
Average capital employed(2) (millions of dollars) |
19,798 | 18,680 | 16,560 | 14,525 | 13,430 | |||||||||||||||
Return on average capital employed(2) (percent) |
22.1 | 26.3 | 13.9 | 20.4 | 34.0 | |||||||||||||||
Capital expenditures(2) (millions of dollars) |
1,450 | 2,215 | 3,148 | 2,819 | 1,782 | |||||||||||||||
| (1) | Prime product sales include ExxonMobil’s share of equity-company volumes and finished-product transfers to the Downstream. | |
| (2) | See Frequently Used Terms on pages 93 through 95. |

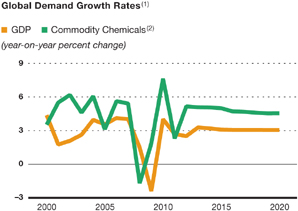
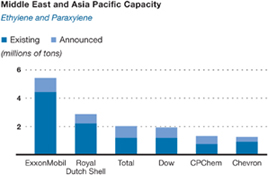
| (1) ExxonMobil estimates
for chemical growth and third-party consensus opinion for GDP. |
||
| (2) | Includes polyethylene, polypropylene, and paraxylene. | |
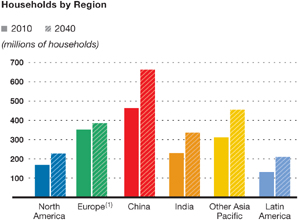
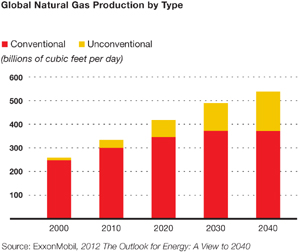
| (1) | Includes Russia/Caspian. | |
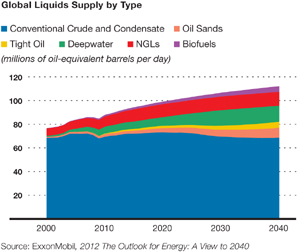
| Source: ExxonMobil, 2012 The Outlook for Energy: A View to 2040 | ||
73
|
 |
|
74
|
|
 |
75
|
|
|
76
|
Approved Chemical Capacity Additions |
||||
| Capacity | ||||
| (thousand tonnes per year) | Addition | |||
Singapore |
||||
Ethylene |
1000 | |||
Polyethylene |
1300 | |||
Polypropylene |
500 | |||
Specialty Elastomers |
300 | |||
Benzene |
340 | |||
Oxo Alcohol |
125 | |||
Baytown, United States |
||||
Synthetic lubricant basestock |
50 | |||
77
|
|
|
78
|
79
|
|
|
80
|

81
|
|
|
82
|
| (millions of tonnes per year) | Ethylene | Polyethylene | Polypropylene | Paraxylene | Additional Products | ||||||||||||||
North America |
|||||||||||||||||||
Baton Rouge, Louisiana |
1.0 | 1.3 | 0.4 | – | P B E A F O | ||||||||||||||
Baytown, Texas |
2.2 | – | 0.8 | 0.6 | P B F | ||||||||||||||
Beaumont, Texas |
0.8 | 1.0 | – | 0.3 | P S | ||||||||||||||
Mont Belvieu, Texas |
– | 1.0 | – | – | |||||||||||||||
Sarnia, Ontario |
0.3 | 0.5 | – | – | P F O | ||||||||||||||
Europe |
|||||||||||||||||||
Antwerp, Belgium |
0.5 | 0.4 | – | – | P F O | ||||||||||||||
Fawley, United Kingdom |
– | – | – | – | B F O | ||||||||||||||
Fife, United Kingdom |
0.4 | – | – | – | |||||||||||||||
Meerhout, Belgium |
– | 0.5 | – | – | |||||||||||||||
Notre-Dame-de- Gravenchon, France |
0.4 | 0.4 | 0.3 | – | P B E A O S Z | ||||||||||||||
Rotterdam, Netherlands |
– | – | – | 0.7 | O | ||||||||||||||
Middle East |
|||||||||||||||||||
Al Jubail, Saudi Arabia |
0.6 | 0.6 | – | – | |||||||||||||||
Yanbu, Saudi Arabia |
1.0 | 0.7 | 0.2 | – | P | ||||||||||||||
Asia Pacific |
|||||||||||||||||||
Fujian, China |
0.2 | 0.2 | 0.1 | 0.2 | P | ||||||||||||||
Kawasaki, Japan |
0.5 | 0.1 | – | – | P B A F | ||||||||||||||
Singapore |
0.9 | 0.6 | 0.4 | 0.9 | P F O Z | ||||||||||||||
Sriracha, Thailand |
– | – | – | 0.5 | F | ||||||||||||||
All other |
– | – | – | 0.6 | |||||||||||||||
Total worldwide |
8.8 | 7.3 | 2.2 | 3.8 | |||||||||||||||
| (1) | Based on size or breadth of product slate. | |
| (2) | Capacity reflects 100 percent for operations of ExxonMobil and majority-owned subsidiaries. For companies owned 50 percent or less, capacity is ExxonMobil’s interest. |
| Location | Product | ||
| North America | |||
| Bayway, New Jersey | ▲ | l | |
| Belleville, Ontario | u | ||
| Chalmette, Louisiana | n | ||
| Dartmouth, Nova Scotia | l | ||
| Edison, New Jersey | l | ||
| LaGrange, Georgia | u | ||
| Pensacola, Florida | ▲ | ||
| Shawnee, Oklahoma | u | ||
| (1) | Includes joint-venture plants. | |
| (2) | Facility mothballed. | |
| (3) | Announced divestment. |
| Location | Product | ||
| Europe | |||
| Augusta, Italy | n | ||
| Berre, France | l | ||
| Brindisi, Italy | u | ||
| Cologne, Germany | ▲ | l | |
| Fos-sur-Mer, France | n | ||
| Geleen, Netherlands | ▲ | ||
| Karlsruhe, Germany | n | ||
| Kerkrade, Netherlands | u | ||
| Newport, United Kingdom | ▲ | ||
| Trecate, Italy | l | ||
| Vado Ligure, Italy | l | ||
| Virton, Belgium | u | ||
| Location | Product | ||||
| Asia Pacific | |||||
| Adelaide, Australia(2) | l | ||||
| Altona, Australia | n | ||||
| Chiba, Japan | n | ||||
| Gumi, South Korea(3) | u | ||||
| Jinshan, China | ▲ | ||||
| Kashima, Japan | ▲ | ||||
| Nasu, Japan(3) | u | ||||
| Panyu, China | l | ||||
| Sakai, Japan | n | l | |||
| Wakayama, Japan | n | ||||
| Latin America | |||||
| Campana, Argentina(3) | n | l | |||
| Managua, Nicaragua(3) | l | ||||
| Paulinia, Brazil | l | ||||
| Rio de Janeiro, Brazil | l | ||||
| Includes ExxonMobil’s share of equity companies | 2011 | 2010 | 2009 | 2008 | 2007 | |||||||||||||||
| Worldwide Production Volumes (thousands of tonnes) | ||||||||||||||||||||
Ethylene
|
7,855 | 7,973 | 7,381 | 7,540 | 8,155 | |||||||||||||||
Polyethylene
|
6,482 | 6,506 | 6,120 | 6,088 | 6,693 | |||||||||||||||
Polypropylene
|
1,870 | 1,945 | 1,864 | 1,897 | 1,897 | |||||||||||||||
Paraxylene
|
2,935 | 2,973 | 2,758 | 2,472 | 2,995 | |||||||||||||||
| Prime Product Sales Volumes(1) by Region (thousands of tonnes) | ||||||||||||||||||||
Americas(2)
|
10,268 | 10,826 | 10,665 | 10,628 | 12,034 | |||||||||||||||
Europe/Middle East/Africa
|
6,555 | 6,654 | 6,433 | 6,635 | 7,463 | |||||||||||||||
Asia Pacific
|
8,183 | 8,411 | 7,727 | 7,719 | 7,983 | |||||||||||||||
Total worldwide
|
25,006 | 25,891 | 24,825 | 24,982 | 27,480 | |||||||||||||||
| Prime Product Sales Volumes(1) by Business (thousands of tonnes) | ||||||||||||||||||||
Specialties
|
5,471 | 5,586 | 5,183 | 5,618 | 6,237 | |||||||||||||||
Commodities
|
19,535 | 20,305 | 19,642 | 19,364 | 21,243 | |||||||||||||||
Total
|
25,006 | 25,891 | 24,825 | 24,982 | 27,480 | |||||||||||||||
| (1) | Prime product sales include ExxonMobil’s share of equity-company volumes and finished product transfers to the Downstream. | |
| (2) | Includes North America and Latin America. |
83
|
|
 |
84
|
| (millions of dollars, unless noted) | 2011 | 2010 | 2009 | 2008 | 2007 | |||||||||||||||
Net income attributable to ExxonMobil
|
41,060 | 30,460 | 19,280 | 45,220 | 40,610 | |||||||||||||||
Cash flow from operations and asset sales(1)
|
66,478 | 51,674 | 29,983 | 65,710 | 56,206 | |||||||||||||||
Capital and exploration expenditures(1)
|
36,766 | 32,226 | 27,092 | 26,143 | 20,853 | |||||||||||||||
Research and development costs
|
1,044 | 1,012 | 1,050 | 847 | 814 | |||||||||||||||
Total debt at year end
|
17,033 | 15,014 | 9,605 | 9,425 | 9,566 | |||||||||||||||
Average capital employed(1)
|
170,721 | 145,217 | 125,050 | 129,683 | 128,760 | |||||||||||||||
Market valuation at year end
|
401,249 | 364,035 | 322,329 | 397,239 | 504,220 | |||||||||||||||
Regular employees at year end (thousands)
|
82.1 | 83.6 | 80.7 | 79.9 | 80.8 | |||||||||||||||
| 2011 | 2010 | 2009 | 2008 | 2007 | ||||||||||||||||
Return on average capital employed(1) (percent)
|
24.2 | 21.7 | 16.3 | 34.2 | 31.8 | |||||||||||||||
Earnings to average ExxonMobil share of equity (percent)
|
27.3 | 23.7 | 17.3 | 38.5 | 34.5 | |||||||||||||||
Debt to capital(2) (percent)
|
9.6 | 9.0 | 7.7 | 7.4 | 7.1 | |||||||||||||||
Net debt to capital(3) (percent)
|
2.6 | 4.5 | (1.0 | ) | (23.0 | ) | (24.0 | ) | ||||||||||||
Current assets to current liabilities (times)
|
0.94 | 0.94 | 1.06 | 1.47 | 1.47 | |||||||||||||||
Fixed charge coverage (times)
|
53.2 | 42.2 | 25.8 | 54.6 | 51.6 | |||||||||||||||
| 2011 | 2010 | 2009 | 2008 | 2007 | ||||||||||||||||
Dividends per common share (dollars)
|
1.85 | 1.74 | 1.66 | 1.55 | 1.37 | |||||||||||||||
Dividends per share growth (annual percent)
|
6.3 | 4.8 | 7.1 | 13.1 | 7.0 | |||||||||||||||
Number of common shares outstanding (millions) |
||||||||||||||||||||
Average
|
4,870 | 4,885 | 4,832 | 5,194 | 5,557 | |||||||||||||||
Average – assuming dilution
|
4,875 | 4,897 | 4,848 | 5,221 | 5,594 | |||||||||||||||
Year end
|
4,734 | 4,979 | 4,727 | 4,976 | 5,382 | |||||||||||||||
Total shareholder return(1) (annual percent)
|
18.7 | 10.1 | (12.6 | ) | (13.2 | ) | 24.3 | |||||||||||||
Common stock purchases (millions of dollars)
|
22,055 | 13,093 | 19,703 | 35,734 | 31,822 | |||||||||||||||
Market quotations for common stock (dollars) |
||||||||||||||||||||
High
|
88.23 | 73.69 | 82.73 | 96.12 | 95.27 | |||||||||||||||
Low
|
67.03 | 55.94 | 61.86 | 56.51 | 69.02 | |||||||||||||||
Average daily close
|
79.71 | 64.99 | 70.95 | 82.68 | 83.23 | |||||||||||||||
Year-end close
|
84.76 | 73.12 | 68.19 | 79.83 | 93.69 | |||||||||||||||
| (1) | See Frequently Used Terms on pages 93 through 95. | |
| (2) | Debt includes short-term and long-term debt. Capital includes short-term and long-term debt and total equity. | |
| (3) | Debt net of cash and cash equivalents, excluding restricted cash. |
| 2011 Quarters | ||||||||||||||||||||||||||||||||||||
| (millions of dollars) | First | Second | Third | Fourth | 2011 | 2010 | 2009 | 2008 | 2007 | |||||||||||||||||||||||||||
Earnings (U.S. GAAP) |
||||||||||||||||||||||||||||||||||||
Upstream |
||||||||||||||||||||||||||||||||||||
United States |
1,279 | 1,449 | 1,184 | 1,184 | 5,096 | 4,272 | 2,893 | 6,243 | 4,870 | |||||||||||||||||||||||||||
Non-U.S. |
7,396 | 7,092 | 7,210 | 7,645 | 29,343 | 19,825 | 14,214 | 29,159 | 21,627 | |||||||||||||||||||||||||||
Total |
8,675 | 8,541 | 8,394 | 8,829 | 34,439 | 24,097 | 17,107 | 35,402 | 26,497 | |||||||||||||||||||||||||||
Downstream |
||||||||||||||||||||||||||||||||||||
United States |
694 | 734 | 810 | 30 | 2,268 | 770 | (153 | ) | 1,649 | 4,120 | ||||||||||||||||||||||||||
Non-U.S. |
405 | 622 | 769 | 395 | 2,191 | 2,797 | 1,934 | 6,502 | 5,453 | |||||||||||||||||||||||||||
Total |
1,099 | 1,356 | 1,579 | 425 | 4,459 | 3,567 | 1,781 | 8,151 | 9,573 | |||||||||||||||||||||||||||
Chemical |
||||||||||||||||||||||||||||||||||||
United States |
669 | 625 | 538 | 383 | 2,215 | 2,422 | 769 | 724 | 1,181 | |||||||||||||||||||||||||||
Non-U.S. |
847 | 696 | 465 | 160 | 2,168 | 2,491 | 1,540 | 2,233 | 3,382 | |||||||||||||||||||||||||||
Total |
1,516 | 1,321 | 1,003 | 543 | 4,383 | 4,913 | 2,309 | 2,957 | 4,563 | |||||||||||||||||||||||||||
Corporate and financing |
(640 | ) | (538 | ) | (646 | ) | (397 | ) | (2,221 | ) | (2,117 | ) | (1,917 | ) | (1,290 | ) | (23 | ) | ||||||||||||||||||
Net income attributable to ExxonMobil (U.S. GAAP) |
10,650 | 10,680 | 10,330 | 9,400 | 41,060 | 30,460 | 19,280 | 45,220 | 40,610 | |||||||||||||||||||||||||||
Special Items |
||||||||||||||||||||||||||||||||||||
Upstream |
||||||||||||||||||||||||||||||||||||
Non-U.S. |
– | – | – | – | – | – | – | 1,620 | – | |||||||||||||||||||||||||||
Corporate and financing |
– | – | – | – | – | – | (140 | ) | (460 | ) | – | |||||||||||||||||||||||||
Corporate total |
– | – | – | – | – | – | (140 | ) | 1,160 | – | ||||||||||||||||||||||||||
Earnings Excluding Special
Items(2) |
||||||||||||||||||||||||||||||||||||
Upstream |
||||||||||||||||||||||||||||||||||||
United States |
1,279 | 1,449 | 1,184 | 1,184 | 5,096 | 4,272 | 2,893 | 6,243 | 4,870 | |||||||||||||||||||||||||||
Non-U.S. |
7,396 | 7,092 | 7,210 | 7,645 | 29,343 | 19,825 | 14,214 | 27,539 | 21,627 | |||||||||||||||||||||||||||
Total |
8,675 | 8,541 | 8,394 | 8,829 | 34,439 | 24,097 | 17,107 | 33,782 | 26,497 | |||||||||||||||||||||||||||
Downstream |
||||||||||||||||||||||||||||||||||||
United States |
694 | 734 | 810 | 30 | 2,268 | 770 | (153 | ) | 1,649 | 4,120 | ||||||||||||||||||||||||||
Non-U.S. |
405 | 622 | 769 | 395 | 2,191 | 2,797 | 1,934 | 6,502 | 5,453 | |||||||||||||||||||||||||||
Total |
1,099 | 1,356 | 1,579 | 425 | 4,459 | 3,567 | 1,781 | 8,151 | 9,573 | |||||||||||||||||||||||||||
Chemical |
||||||||||||||||||||||||||||||||||||
United States |
669 | 625 | 538 | 383 | 2,215 | 2,422 | 769 | 724 | 1,181 | |||||||||||||||||||||||||||
Non-U.S. |
847 | 696 | 465 | 160 | 2,168 | 2,491 | 1,540 | 2,233 | 3,382 | |||||||||||||||||||||||||||
Total |
1,516 | 1,321 | 1,003 | 543 | 4,383 | 4,913 | 2,309 | 2,957 | 4,563 | |||||||||||||||||||||||||||
Corporate and financing |
(640 | ) | (538 | ) | (646 | ) | (397 | ) | (2,221 | ) | (2,117 | ) | (1,777 | ) | (830 | ) | (23 | ) | ||||||||||||||||||
Corporate total |
10,650 | 10,680 | 10,330 | 9,400 | 41,060 | 30,460 | 19,420 | 44,060 | 40,610 | |||||||||||||||||||||||||||
| (1) | Total corporate earnings means net income attributable to ExxonMobil (U.S. GAAP) from the consolidated income statement. Unless indicated, references to earnings, special items, Upstream, Downstream, Chemical, and Corporate and Financing segment earnings, and earnings per share are ExxonMobil’s share after excluding amounts attributable to noncontrolling interests. | |
| (2) | See Frequently Used Terms on pages 93 through 95. |
85
|
 |
|
86
|
| (percent) | 2011 | 2010 | 2009 | 2008 | 2007 | |||||||||||||||
Upstream |
||||||||||||||||||||
United States
|
9.3 | 12.2 | 18.2 | 42.6 | 34.7 | |||||||||||||||
Non-U.S.
|
39.2 | 29.0 | 24.8 | 56.7 | 43.7 | |||||||||||||||
Total
|
26.5 | 23.3 | 23.4 | 53.6 | 41.7 | |||||||||||||||
Downstream |
||||||||||||||||||||
United States
|
42.5 | 12.5 | (2.1 | ) | 23.7 | 65.1 | ||||||||||||||
Non-U.S.
|
12.1 | 15.6 | 10.9 | 34.8 | 28.7 | |||||||||||||||
Total
|
19.1 | 14.8 | 7.1 | 31.8 | 37.8 | |||||||||||||||
Chemical |
||||||||||||||||||||
United States
|
46.2 | 53.0 | 17.6 | 16.0 | 24.9 | |||||||||||||||
Non-U.S.
|
14.4 | 17.6 | 12.6 | 22.4 | 39.0 | |||||||||||||||
Total
|
22.1 | 26.3 | 13.9 | 20.4 | 34.0 | |||||||||||||||
Corporate and financing
|
N.A. | N.A. | N.A. | N.A. | N.A. | |||||||||||||||
Corporate total
|
24.2 | 21.7 | 16.3 | 34.2 | 31.8 | |||||||||||||||
| (1) | Capital employed consists of ExxonMobil’s share of equity and consolidated debt, including ExxonMobil’s share of amounts applicable to equity companies. See Frequently Used Terms on pages 93 through 95. |
| (millions of dollars) | 2011 | 2010 | 2009 | 2008 | 2007 | |||||||||||||||
Upstream |
||||||||||||||||||||
United States
|
54,994 | 34,969 | 15,865 | 14,651 | 14,026 | |||||||||||||||
Non-U.S.
|
74,813 | 68,318 | 57,336 | 51,413 | 49,539 | |||||||||||||||
Total
|
129,807 | 103,287 | 73,201 | 66,064 | 63,565 | |||||||||||||||
Downstream |
||||||||||||||||||||
United States
|
5,340 | 6,154 | 7,306 | 6,963 | 6,331 | |||||||||||||||
Non-U.S.
|
18,048 | 17,976 | 17,793 | 18,664 | 18,983 | |||||||||||||||
Total
|
23,388 | 24,130 | 25,099 | 25,627 | 25,314 | |||||||||||||||
Chemical |
||||||||||||||||||||
United States
|
4,791 | 4,566 | 4,370 | 4,535 | 4,748 | |||||||||||||||
Non-U.S.
|
15,007 | 14,114 | 12,190 | 9,990 | 8,682 | |||||||||||||||
Total
|
19,798 | 18,680 | 16,560 | 14,525 | 13,430 | |||||||||||||||
Corporate and financing
|
(2,272 | ) | (880 | ) | 10,190 | 23,467 | 26,451 | |||||||||||||
Corporate total
|
170,721 | 145,217 | 125,050 | 129,683 | 128,760 | |||||||||||||||
Average capital employed applicable to equity
companies included above
|
31,626 | 30,524 | 27,684 | 25,651 | 24,267 | |||||||||||||||
| (1) | Average capital employed is the average of beginning-of-year and end-of-year business segment capital employed, including ExxonMobil’s share of amounts applicable to equity companies. See Frequently Used Terms on pages 93 through 95. |
| (millions of dollars) | 2011 | 2010 | 2009 | 2008 | 2007 | |||||||||||||||
Upstream |
||||||||||||||||||||
United States |
75,140 | 69,003 | 19,601 | 17,920 | 16,714 | |||||||||||||||
Non-U.S. |
88,835 | 79,149 | 68,718 | 55,493 | 56,810 | |||||||||||||||
Total |
163,975 | 148,152 | 88,319 | 73,413 | 73,524 | |||||||||||||||
Downstream |
||||||||||||||||||||
United States |
9,516 | 10,585 | 11,013 | 10,492 | 9,705 | |||||||||||||||
Non-U.S. |
19,285 | 19,510 | 19,486 | 18,762 | 20,443 | |||||||||||||||
Total |
28,801 | 30,095 | 30,499 | 29,254 | 30,148 | |||||||||||||||
Chemical |
||||||||||||||||||||
United States |
3,928 | 4,068 | 4,274 | 4,396 | 4,448 | |||||||||||||||
Non-U.S. |
10,541 | 10,187 | 9,237 | 7,034 | 5,623 | |||||||||||||||
Total |
14,469 | 14,255 | 13,511 | 11,430 | 10,071 | |||||||||||||||
Other |
7,419 | 7,046 | 6,787 | 7,249 | 7,126 | |||||||||||||||
Total net investment |
214,664 | 199,548 | 139,116 | 121,346 | 120,869 | |||||||||||||||
| (millions of dollars) | 2011 | 2010 | 2009 | 2008 | 2007 | |||||||||||||||
Upstream |
||||||||||||||||||||
United States |
4,879 | 3,506 | 1,768 | 1,391 | 1,469 | |||||||||||||||
Non-U.S. |
7,021 | 7,574 | 6,376 | 7,266 | 7,126 | |||||||||||||||
Total |
11,900 | 11,080 | 8,144 | 8,657 | 8,595 | |||||||||||||||
Downstream |
||||||||||||||||||||
United States |
650 | 681 | 687 | 656 | 639 | |||||||||||||||
Non-U.S. |
1,560 | 1,565 | 1,665 | 1,672 | 1,662 | |||||||||||||||
Total |
2,210 | 2,246 | 2,352 | 2,328 | 2,301 | |||||||||||||||
Chemical |
||||||||||||||||||||
United States |
380 | 421 | 400 | 410 | 405 | |||||||||||||||
Non-U.S. |
458 | 432 | 457 | 422 | 418 | |||||||||||||||
Total |
838 | 853 | 857 | 832 | 823 | |||||||||||||||
Other |
635 | 581 | 564 | 562 | 531 | |||||||||||||||
Total depreciation and depletion expenses |
15,583 | 14,760 | 11,917 | 12,379 | 12,250 | |||||||||||||||
| (millions of dollars) | 2011 | 2010 | 2009 | 2008 | 2007 | |||||||||||||||
Production and manufacturing expenses |
40,268 | 35,792 | 33,027 | 37,905 | 31,885 | |||||||||||||||
Selling, general, and administrative |
14,983 | 14,683 | 14,735 | 15,873 | 14,890 | |||||||||||||||
Depreciation and depletion |
15,583 | 14,760 | 11,917 | 12,379 | 12,250 | |||||||||||||||
Exploration |
2,081 | 2,144 | 2,021 | 1,451 | 1,469 | |||||||||||||||
Subtotal |
72,915 | 67,379 | 61,700 | 67,608 | 60,494 | |||||||||||||||
ExxonMobil’s share of equity company expenses |
11,401 | 9,049 | 6,670 | 7,204 | 5,619 | |||||||||||||||
Total operating costs |
84,316 | 76,428 | 68,370 | 74,812 | 66,113 | |||||||||||||||
| (1) | See Frequently Used Terms on pages 93 through 95. |
87
|
|
|
88
|
| (millions of dollars) | 2011 | 2010 | 2009 | 2008 | 2007 | |||||||||||||||
Upstream |
||||||||||||||||||||
Exploration |
||||||||||||||||||||
United States |
2,720 | 1,607 | 735 | 734 | 415 | |||||||||||||||
Non-U.S. |
2,744 | 2,514 | 2,983 | 2,137 | 1,494 | |||||||||||||||
Total |
5,464 | 4,121 | 3,718 | 2,871 | 1,909 | |||||||||||||||
Production(2) |
||||||||||||||||||||
United States |
8,021 | 4,742 | 2,850 | 2,600 | 1,792 | |||||||||||||||
Non-U.S. |
19,387 | 18,214 | 13,877 | 14,011 | 11,913 | |||||||||||||||
Total |
27,408 | 22,956 | 16,727 | 16,611 | 13,705 | |||||||||||||||
Power and Coal |
||||||||||||||||||||
United States |
– | – | – | – | 5 | |||||||||||||||
Non-U.S. |
219 | 242 | 259 | 252 | 105 | |||||||||||||||
Total |
219 | 242 | 259 | 252 | 110 | |||||||||||||||
Total Upstream |
33,091 | 27,319 | 20,704 | 19,734 | 15,724 | |||||||||||||||
Downstream |
||||||||||||||||||||
Refining |
||||||||||||||||||||
United States |
370 | 833 | 1,300 | 1,430 | 906 | |||||||||||||||
Non-U.S. |
1,088 | 1,000 | 1,146 | 1,248 | 1,267 | |||||||||||||||
Total |
1,458 | 1,833 | 2,446 | 2,678 | 2,173 | |||||||||||||||
Marketing |
||||||||||||||||||||
United States |
117 | 98 | 171 | 176 | 201 | |||||||||||||||
Non-U.S. |
514 | 520 | 536 | 638 | 876 | |||||||||||||||
Total |
631 | 618 | 707 | 814 | 1,077 | |||||||||||||||
Pipeline/Marine |
||||||||||||||||||||
United States |
31 | 51 | 40 | 30 | 21 | |||||||||||||||
Non-U.S. |
– | 3 | 3 | 7 | 32 | |||||||||||||||
Total |
31 | 54 | 43 | 37 | 53 | |||||||||||||||
Total Downstream |
2,120 | 2,505 | 3,196 | 3,529 | 3,303 | |||||||||||||||
Chemical |
||||||||||||||||||||
United States |
290 | 279 | 319 | 441 | 360 | |||||||||||||||
Non-U.S. |
1,160 | 1,936 | 2,829 | 2,378 | 1,422 | |||||||||||||||
Total Chemical |
1,450 | 2,215 | 3,148 | 2,819 | 1,782 | |||||||||||||||
Other |
||||||||||||||||||||
United States |
105 | 187 | 44 | 61 | 44 | |||||||||||||||
Non-U.S. |
– | – | – | – | – | |||||||||||||||
Total other |
105 | 187 | 44 | 61 | 44 | |||||||||||||||
Total capital and exploration expenditures |
36,766 | 32,226 | 27,092 | 26,143 | 20,853 | |||||||||||||||
| (1) | See Frequently Used Terms on pages 93 through 95. | |
| (2) | Including related transportation. |
| (millions of dollars) | 2011 | 2010 | 2009 | 2008 | 2007 | |||||||||||||||
United States |
11,654 | 7,797 | 5,459 | 5,472 | 3,744 | |||||||||||||||
Canada/Latin America |
6,186 | 5,732 | 3,448 | 1,926 | 1,522 | |||||||||||||||
Europe |
2,914 | 3,901 | 3,251 | 3,727 | 4,042 | |||||||||||||||
Africa |
4,291 | 4,915 | 6,182 | 5,422 | 3,639 | |||||||||||||||
Asia |
7,066 | 6,693 | 7,535 | 8,845 | 7,479 | |||||||||||||||
Australia/Oceania |
4,655 | 3,188 | 1,217 | 751 | 427 | |||||||||||||||
Total worldwide |
36,766 | 32,226 | 27,092 | 26,143 | 20,853 | |||||||||||||||
| (millions of dollars) | 2011 | 2010 | 2009 | 2008 | 2007 | |||||||||||||||
Consolidated Companies’ Expenditures |
||||||||||||||||||||
Capital expenditures |
32,425 | 27,343 | 22,441 | 19,841 | 15,242 | |||||||||||||||
Exploration costs charged to expense |
||||||||||||||||||||
United States |
268 | 283 | 219 | 189 | 280 | |||||||||||||||
Non-U.S. |
1,802 | 1,855 | 1,795 | 1,252 | 1,177 | |||||||||||||||
Depreciation on support equipment(1) |
11 | 6 | 7 | 10 | 12 | |||||||||||||||
Total exploration expenses |
2,081 | 2,144 | 2,021 | 1,451 | 1,469 | |||||||||||||||
Total consolidated companies’ capital
and exploration expenditures (excluding depreciation on support equipment) |
34,495 | 29,481 | 24,455 | 21,282 | 16,699 | |||||||||||||||
ExxonMobil’s Share of Non-Consolidated |
||||||||||||||||||||
Companies’ Expenditures |
||||||||||||||||||||
Capital expenditures |
2,248 | 2,720 | 2,624 | 4,845 | 4,122 | |||||||||||||||
Exploration costs charged to expense |
23 | 25 | 13 | 16 | 32 | |||||||||||||||
Total non-consolidated companies’ capital
and exploration expenditures |
2,271 | 2,745 | 2,637 | 4,861 | 4,154 | |||||||||||||||
Total capital and exploration expenditures |
36,766 | 32,226 | 27,092 | 26,143 | 20,853 | |||||||||||||||
| (1) | Not included as part of total capital and exploration expenditures, but included as part of exploration expenses, including dry holes, in the Summary Statement of Income, page 90. |
89
|
|
|
90
|
| (millions of dollars) | 2011 | 2010 | 2009 | 2008 | 2007 | |||||||||||||||
Revenues and Other Income |
||||||||||||||||||||
Sales and other operating revenue (1) |
467,029 | 370,125 | 301,500 | 459,579 | 390,328 | |||||||||||||||
Income from equity affiliates |
15,289 | 10,677 | 7,143 | 11,081 | 8,901 | |||||||||||||||
Other income(2) |
4,111 | 2,419 | 1,943 | 6,699 | 5,323 | |||||||||||||||
Total revenues and other income |
486,429 | 383,221 | 310,586 | 477,359 | 404,552 | |||||||||||||||
Costs and Other Deductions |
||||||||||||||||||||
Crude oil and product purchases |
266,534 | 197,959 | 152,806 | 249,454 | 199,498 | |||||||||||||||
Production and manufacturing expenses |
40,268 | 35,792 | 33,027 | 37,905 | 31,885 | |||||||||||||||
Selling, general, and administrative expenses |
14,983 | 14,683 | 14,735 | 15,873 | 14,890 | |||||||||||||||
Depreciation and depletion |
15,583 | 14,760 | 11,917 | 12,379 | 12,250 | |||||||||||||||
Exploration expenses, including dry holes |
2,081 | 2,144 | 2,021 | 1,451 | 1,469 | |||||||||||||||
Interest expense |
247 | 259 | 548 | 673 | 400 | |||||||||||||||
Sales-based taxes(1) |
33,503 | 28,547 | 25,936 | 34,508 | 31,728 | |||||||||||||||
Other taxes and duties |
39,973 | 36,118 | 34,819 | 41,719 | 40,953 | |||||||||||||||
Total costs and other deductions |
413,172 | 330,262 | 275,809 | 393,962 | 333,073 | |||||||||||||||
Income before income taxes |
73,257 | 52,959 | 34,777 | 83,397 | 71,479 | |||||||||||||||
Income taxes |
31,051 | 21,561 | 15,119 | 36,530 | 29,864 | |||||||||||||||
Net income including noncontrolling interests |
42,206 | 31,398 | 19,658 | 46,867 | 41,615 | |||||||||||||||
Net income attributable to noncontrolling interests |
1,146 | 938 | 378 | 1,647 | 1,005 | |||||||||||||||
Net income attributable to ExxonMobil |
41,060 | 30,460 | 19,280 | 45,220 | 40,610 | |||||||||||||||
Earnings per common share (dollars) |
8.43 | 6.24 | 3.99 | 8.70 | 7.31 | |||||||||||||||
Earnings per common share – assuming dilution
(dollars) |
8.42 | 6.22 | 3.98 | 8.66 | 7.26 | |||||||||||||||
| (1) | Sales and other operating revenue includes sales-based taxes of $33,503 million for 2011, $28,547 million for 2010, $25,936 million for 2009, $34,508 million for 2008, and $31,728 million for 2007. | |
| (2) | Other income for 2008 includes a $62 million gain from the sale of a non-U.S. investment and a related $143 million foreign exchange loss. | |
| The information in the Summary Statement of Income (for 2009 to 2011), the Summary Balance Sheet (for 2010 and 2011), and the Summary Statement of Cash Flows (for 2009 to 2011), shown on pages 90 through 92, corresponds to the information in the Consolidated Statement of Income, Consolidated Balance Sheet, and the Consolidated Statement of Cash Flows in the financial statements of ExxonMobil’s 2011 Form 10-K. See also Management’s Discussion and Analysis of Financial Condition and Results of Operations and other information in the Financial Section of the 2011 Form 10-K. | ||
| (millions of dollars) | 2011 | 2010 | 2009 | 2008 | 2007 | |||||||||||||||
Assets |
||||||||||||||||||||
Current assets |
||||||||||||||||||||
Cash and cash equivalents |
12,664 | 7,825 | 10,693 | 31,437 | 33,981 | |||||||||||||||
Cash and cash equivalents – restricted |
404 | 628 | – | – | – | |||||||||||||||
Notes and accounts receivable, |
||||||||||||||||||||
less estimated doubtful amounts |
38,642 | 32,284 | 27,645 | 24,702 | 36,450 | |||||||||||||||
Inventories |
||||||||||||||||||||
Crude oil, products and merchandise |
11,665 | 9,852 | 8,718 | 9,331 | 8,863 | |||||||||||||||
Materials and supplies |
3,359 | 3,124 | 2,835 | 2,315 | 2,226 | |||||||||||||||
Other current assets |
6,229 | 5,271 | 5,344 | 4,481 | 4,443 | |||||||||||||||
Total current assets |
72,963 | 58,984 | 55,235 | 72,266 | 85,963 | |||||||||||||||
Investments, advances and long-term receivables |
34,333 | 35,338 | 31,665 | 28,556 | 28,194 | |||||||||||||||
Property, plant and equipment, at cost, |
||||||||||||||||||||
less accumulated depreciation and depletion |
214,664 | 199,548 | 139,116 | 121,346 | 120,869 | |||||||||||||||
Other assets, including intangibles, net |
9,092 | 8,640 | 7,307 | 5,884 | 7,056 | |||||||||||||||
Total assets |
331,052 | 302,510 | 233,323 | 228,052 | 242,082 | |||||||||||||||
Liabilities |
||||||||||||||||||||
Current liabilities |
||||||||||||||||||||
Notes and loans payable |
7,711 | 2,787 | 2,476 | 2,400 | 2,383 | |||||||||||||||
Accounts payable and accrued liabilities |
57,067 | 50,034 | 41,275 | 36,643 | 45,275 | |||||||||||||||
Income taxes payable |
12,727 | 9,812 | 8,310 | 10,057 | 10,654 | |||||||||||||||
Total current liabilities |
77,505 | 62,633 | 52,061 | 49,100 | 58,312 | |||||||||||||||
Long-term debt |
9,322 | 12,227 | 7,129 | 7,025 | 7,183 | |||||||||||||||
Postretirement benefits reserves |
24,994 | 19,367 | 17,942 | 20,729 | 13,278 | |||||||||||||||
Deferred income tax liabilities |
36,618 | 35,150 | 23,148 | 19,726 | 22,899 | |||||||||||||||
Other long-term obligations |
21,869 | 20,454 | 17,651 | 13,949 | 14,366 | |||||||||||||||
Total liabilities |
170,308 | 149,831 | 117,931 | 110,529 | 116,038 | |||||||||||||||
Commitments and contingencies |
See footnote 1 | |||||||||||||||||||
Equity |
||||||||||||||||||||
Common stock without par value |
9,512 | 9,371 | 5,503 | 5,314 | 4,933 | |||||||||||||||
Earnings reinvested |
330,939 | 298,899 | 276,937 | 265,680 | 228,518 | |||||||||||||||
Accumulated other comprehensive income |
||||||||||||||||||||
Cumulative foreign exchange translation adjustment |
4,168 | 5,011 | 4,402 | 1,146 | 7,972 | |||||||||||||||
Postretirement benefits reserves adjustment |
(13,291 | ) | (9,889 | ) | (9,863 | ) | (11,077 | ) | (5,983 | ) | ||||||||||
Unrealized gain on cash flow hedges |
– | 55 | – | – | – | |||||||||||||||
Common stock held in treasury |
(176,932 | ) | (156,608 | ) | (166,410 | ) | (148,098 | ) | (113,678 | ) | ||||||||||
ExxonMobil share of equity |
154,396 | 146,839 | 110,569 | 112,965 | 121,762 | |||||||||||||||
Noncontrolling interests |
6,348 | 5,840 | 4,823 | 4,558 | 4,282 | |||||||||||||||
Total equity |
160,744 | 152,679 | 115,392 | 117,523 | 126,044 | |||||||||||||||
Total liabilities and equity |
331,052 | 302,510 | 233,323 | 228,052 | 242,082 | |||||||||||||||
| (1) | For more information, please refer to Note 15 in the Financial Section of ExxonMobil’s 2011 Form 10-K. |
91
|
|
|
92
|
| (millions of dollars) | 2011 | 2010 | 2009 | 2008 | 2007 | |||||||||||||||
Cash Flows from Operating Activities |
||||||||||||||||||||
Net income including noncontrolling interests
|
42,206 | 31,398 | 19,658 | 46,867 | 41,615 | |||||||||||||||
Adjustments for noncash transactions |
||||||||||||||||||||
Depreciation and depletion
|
15,583 | 14,760 | 11,917 | 12,379 | 12,250 | |||||||||||||||
Deferred income tax charges/(credits)
|
142 | (1,135 | ) | – | 1,399 | 124 | ||||||||||||||
Postretirement benefits expense in excess of/
(less than) net payments
|
544 | 1,700 | (1,722 | ) | 57 | (1,314 | ) | |||||||||||||
Other long-term obligation provisions
in excess of/(less than) payments
|
(151 | ) | 160 | 731 | (63 | ) | 1,065 | |||||||||||||
Dividends received greater than/(less than) |
||||||||||||||||||||
equity in current earnings of equity companies
|
(273 | ) | (596 | ) | (483 | ) | 921 | (714 | ) | |||||||||||
Changes in operational working capital, excluding cash and debt |
||||||||||||||||||||
Reduction/(increase) – Notes and accounts receivable
|
(7,906 | ) | (5,863 | ) | (3,170 | ) | 8,641 | (5,441 | ) | |||||||||||
– Inventories
|
(2,208 | ) | (1,148 | ) | 459 | (1,285 | ) | 72 | ||||||||||||
– Other current assets
|
222 | 913 | 132 | (509 | ) | 280 | ||||||||||||||
Increase/(reduction) – Accounts and other payables
|
8,880 | 9,943 | 1,420 | (5,415 | ) | 6,228 | ||||||||||||||
Net (gain) on asset sales
|
(2,842 | ) | (1,401 | ) | (488 | ) | (3,757 | ) | (2,217 | ) | ||||||||||
All other items – net
|
1,148 | (318 | ) | (16 | ) | 490 | 54 | |||||||||||||
Net cash provided by operating activities
|
55,345 | 48,413 | 28,438 | 59,725 | 52,002 | |||||||||||||||
Cash Flows from Investing Activities |
||||||||||||||||||||
Additions to property, plant and equipment
|
(30,975 | ) | (26,871 | ) | (22,491 | ) | (19,318 | ) | (15,387 | ) | ||||||||||
Proceeds associated with sales of subsidiaries, property, plant and equipment, and sales and returns of investments
|
11,133 | 3,261 | 1,545 | 5,985 | 4,204 | |||||||||||||||
Decrease/(increase) in restricted cash and cash equivalents
|
224 | (628 | ) | – | – | 4,604 | ||||||||||||||
Additional investments and advances
|
(3,586 | ) | (1,239 | ) | (2,752 | ) | (2,495 | ) | (3,038 | ) | ||||||||||
Collection of advances
|
1,119 | 1,133 | 724 | 574 | 391 | |||||||||||||||
Additions to marketable securities
|
(1,754 | ) | (15 | ) | (16 | ) | (2,113 | ) | (646 | ) | ||||||||||
Sales of marketable securities
|
1,674 | 155 | 571 | 1,868 | 144 | |||||||||||||||
Net cash used in investing activities
|
(22,165 | ) | (24,204 | ) | (22,419 | ) | (15,499 | ) | (9,728 | ) | ||||||||||
Cash Flows from Financing Activities |
||||||||||||||||||||
Additions to long-term debt
|
702 | 1,143 | 225 | 79 | 592 | |||||||||||||||
Reductions in long-term debt
|
(266 | ) | (6,224 | ) | (68 | ) | (192 | ) | (209 | ) | ||||||||||
Additions to short-term debt
|
1,063 | 598 | 1,336 | 1,067 | 1,211 | |||||||||||||||
Reductions in short-term debt
|
(1,103 | ) | (2,436 | ) | (1,575 | ) | (1,624 | ) | (809 | ) | ||||||||||
Additions/(reductions) in debt with three months or less maturity
|
1,561 | 709 | (71 | ) | 143 | (187 | ) | |||||||||||||
Cash dividends to ExxonMobil shareholders
|
(9,020 | ) | (8,498 | ) | (8,023 | ) | (8,058 | ) | (7,621 | ) | ||||||||||
Cash dividends to noncontrolling interests
|
(306 | ) | (281 | ) | (280 | ) | (375 | ) | (289 | ) | ||||||||||
Changes in noncontrolling interests
|
(16 | ) | (7 | ) | (113 | ) | (419 | ) | (659 | ) | ||||||||||
Tax benefits related to stock-based awards
|
260 | 122 | 237 | 333 | 369 | |||||||||||||||
Common stock acquired
|
(22,055 | ) | (13,093 | ) | (19,703 | ) | (35,734 | ) | (31,822 | ) | ||||||||||
Common stock sold
|
924 | 1,043 | 752 | 753 | 1,079 | |||||||||||||||
Net cash used in financing activities
|
(28,256 | ) | (26,924 | ) | (27,283 | ) | (44,027 | ) | (38,345 | ) | ||||||||||
Effects of exchange rate changes on cash
|
(85 | ) | (153 | ) | 520 | (2,743 | ) | 1,808 | ||||||||||||
Increase/(decrease) in cash and cash equivalents
|
4,839 | (2,868 | ) | (20,744 | ) | (2,544 | ) | 5,737 | ||||||||||||
Cash and cash equivalents at beginning of year
|
7,825 | 10,693 | 31,437 | 33,981 | 28,244 | |||||||||||||||
Cash and cash equivalents at end of year
|
12,664 | 7,825 | 10,693 | 31,437 | 33,981 | |||||||||||||||
| CASH FLOW FROM OPERATIONS AND ASSET SALES | 2011 | 2010 | 2009 | 2008 | 2007 | |||||||||||||||
(millions of dollars) |
||||||||||||||||||||
Net cash provided by operating activities |
55,345 | 48,413 | 28,438 | 59,725 | 52,002 | |||||||||||||||
Proceeds associated with sales of subsidiaries, property,
plant and equipment, and sales and returns of investments |
11,133 | 3,261 | 1,545 | 5,985 | 4,204 | |||||||||||||||
Cash flow from operations and asset sales |
66,478 | 51,674 | 29,983 | 65,710 | 56,206 | |||||||||||||||
93
|
|
|
94
|
| PROVED RESERVES REPLACEMENT COSTS | 2011 | 2010 | 2009 | 2008 | 2007 | |||||||||||||||
Costs incurred (millions of dollars) |
||||||||||||||||||||
Property acquisition costs |
3,787 | 45,461 | 1,285 | 663 | 194 | |||||||||||||||
Exploration costs |
2,503 | 3,055 | 3,111 | 2,272 | 1,762 | |||||||||||||||
Development costs |
25,690 | 23,210 | 17,130 | 14,633 | 11,570 | |||||||||||||||
Total costs incurred |
31,980 | 71,726 | 21,526 | 17,568 | 13,526 | |||||||||||||||
Proved oil-equivalent reserves additions (millions of barrels) |
||||||||||||||||||||
Revisions |
281 | 505 | 383 | 690 | 1,405 | |||||||||||||||
Improved recovery |
– | 5 | 15 | 7 | 36 | |||||||||||||||
Extensions/discoveries |
1,613 | 516 | 1,091 | 1,423 | 248 | |||||||||||||||
Purchases |
67 | 2,510 | 1 | – | 2 | |||||||||||||||
Total oil-equivalent reserves additions |
1,961 | 3,536 | 1,490 | 2,120 | 1,691 | |||||||||||||||
Proved reserves replacement costs (dollars per barrel) |
16.31 | 20.28 | 14.45 | 8.29 | 8.00 | |||||||||||||||
| EXPLORATION RESOURCE ADDITION COST | 2011 | 2010 | 2009 | 2008 | 2007 | |||||||||||||||
Exploration portion of Upstream Capex (millions of dollars) |
5,464 | 4,121 | 3,718 | 2,871 | 1,909 | |||||||||||||||
Exploration resource additions (millions of oil-equivalent barrels) |
3,906 | 4,725 | 2,860 | 2,230 | 1,995 | |||||||||||||||
Exploration resource addition cost per OEB (dollars) |
1.40 | 0.87 | 1.30 | 1.29 | 0.96 | |||||||||||||||
| OPERATING COSTS | 2011 | 2010 | 2009 | 2008 | 2007 | |||||||||||||||
(millions of dollars) |
||||||||||||||||||||
Reconciliation of Operating Costs |
||||||||||||||||||||
From ExxonMobil’s Consolidated Statement of Income |
||||||||||||||||||||
Total costs and other deductions |
413,172 | 330,262 | 275,809 | 393,962 | 333,073 | |||||||||||||||
Less: |
||||||||||||||||||||
Crude oil and product purchases |
266,534 | 197,959 | 152,806 | 249,454 | 199,498 | |||||||||||||||
Interest expense |
247 | 259 | 548 | 673 | 400 | |||||||||||||||
Sales-based taxes |
33,503 | 28,547 | 25,936 | 34,508 | 31,728 | |||||||||||||||
Other taxes and duties |
39,973 | 36,118 | 34,819 | 41,719 | 40,953 | |||||||||||||||
Subtotal |
72,915 | 67,379 | 61,700 | 67,608 | 60,494 | |||||||||||||||
ExxonMobil’s share of equity-company expenses |
11,401 | 9,049 | 6,670 | 7,204 | 5,619 | |||||||||||||||
Total operating costs |
84,316 | 76,428 | 68,370 | 74,812 | 66,113 | |||||||||||||||
Components of Operating Costs |
||||||||||||||||||||
From ExxonMobil’s Consolidated Statement of Income |
||||||||||||||||||||
Production and manufacturing expenses |
40,268 | 35,792 | 33,027 | 37,905 | 31,885 | |||||||||||||||
Selling, general, and administrative expenses |
14,983 | 14,683 | 14,735 | 15,873 | 14,890 | |||||||||||||||
Depreciation and depletion |
15,583 | 14,760 | 11,917 | 12,379 | 12,250 | |||||||||||||||
Exploration expenses, including dry holes |
2,081 | 2,144 | 2,021 | 1,451 | 1,469 | |||||||||||||||
Subtotal |
72,915 | 67,379 | 61,700 | 67,608 | 60,494 | |||||||||||||||
ExxonMobil’s share of equity-company expenses |
11,401 | 9,049 | 6,670 | 7,204 | 5,619 | |||||||||||||||
Total operating costs |
84,316 | 76,428 | 68,370 | 74,812 | 66,113 | |||||||||||||||
| CAPITAL EMPLOYED | 2011 | 2010 | 2009 | 2008 | 2007 | |||||||||||||||
(millions of dollars) |
||||||||||||||||||||
Business Uses: Asset and Liability Perspective |
||||||||||||||||||||
Total assets |
331,052 | 302,510 | 233,323 | 228,052 | 242,082 | |||||||||||||||
Less liabilities and noncontrolling interests
share of assets and liabilities |
||||||||||||||||||||
Total current liabilities excluding notes and loans payable |
(69,794 | ) | (59,846 | ) | (49,585 | ) | (46,700 | ) | (55,929 | ) | ||||||||||
Total long-term liabilities excluding long-term debt |
(83,481 | ) | (74,971 | ) | (58,741 | ) | (54,404 | ) | (50,543 | ) | ||||||||||
Noncontrolling interests share of assets and liabilities |
(7,314 | ) | (6,532 | ) | (5,642 | ) | (6,044 | ) | (5,332 | ) | ||||||||||
Add ExxonMobil share of debt-financed equity-company net assets |
4,943 | 4,875 | 5,043 | 4,798 | 3,386 | |||||||||||||||
Total capital employed |
175,406 | 166,036 | 124,398 | 125,702 | 133,664 | |||||||||||||||
Total Corporate Sources: Debt and Equity Perspective |
||||||||||||||||||||
Notes and loans payable |
7,711 | 2,787 | 2,476 | 2,400 | 2,383 | |||||||||||||||
Long-term debt |
9,322 | 12,227 | 7,129 | 7,025 | 7,183 | |||||||||||||||
ExxonMobil share of equity |
154,396 | 146,839 | 110,569 | 112,965 | 121,762 | |||||||||||||||
Less noncontrolling interests share of total debt |
(966 | ) | (692 | ) | (819 | ) | (1,486 | ) | (1,050 | ) | ||||||||||
Add ExxonMobil share of equity-company debt |
4,943 | 4,875 | 5,043 | 4,798 | 3,386 | |||||||||||||||
Total capital employed |
175,406 | 166,036 | 124,398 | 125,702 | 133,664 | |||||||||||||||
| RETURN ON AVERAGE CAPITAL EMPLOYED (ROCE) | 2011 | 2010 | 2009 | 2008 | 2007 | |||||||||||||||
(millions of dollars) |
||||||||||||||||||||
Net income attributable to ExxonMobil |
41,060 | 30,460 | 19,280 | 45,220 | 40,610 | |||||||||||||||
Financing costs (after tax) |
||||||||||||||||||||
Gross third-party debt |
(153 | ) | (803 | ) | (303 | ) | (343 | ) | (339 | ) | ||||||||||
ExxonMobil share of equity companies |
(219 | ) | (333 | ) | (285 | ) | (325 | ) | (204 | ) | ||||||||||
All other financing costs – net |
116 | 35 | (483 | ) | 1,485 | 268 | ||||||||||||||
Total financing costs |
(256 | ) | (1,101 | ) | (1,071 | ) | 817 | (275 | ) | |||||||||||
Earnings excluding financing costs |
41,316 | 31,561 | 20,351 | 44,403 | 40,885 | |||||||||||||||
Average capital employed |
170,721 | 145,217 | 125,050 | 129,683 | 128,760 | |||||||||||||||
Return on average capital employed – corporate total |
24.2 | % | 21.7 | % | 16.3 | % | 34.2 | % | 31.8 | % | ||||||||||
| DISTRIBUTIONS TO SHAREHOLDERS | 2011 | 2010 | 2009 | 2008 | 2007 | |||||||||||||||
(millions of dollars) |
||||||||||||||||||||
Dividends paid to ExxonMobil shareholders |
9,020 | 8,498 | 8,023 | 8,058 | 7,621 | |||||||||||||||
Cost of shares purchased to reduce shares outstanding |
20,000 | 11,200 | 18,000 | 32,000 | 28,000 | |||||||||||||||
Distributions to ExxonMobil shareholders |
29,020 | 19,698 | 26,023 | 40,058 | 35,621 | |||||||||||||||
Memo: Gross cost of shares purchased to offset shares
issued under benefit plans and programs |
2,055 | 1,893 | 1,703 | 3,734 | 3,822 | |||||||||||||||
95
|
|
|
96
|
| Acreage | 10-11, 22, 24, 26-27, 29, 32 | |
| Africa | 31-34 | |
| Asia Pacific | 35-39, 55, 59, 73, 76-77 | |
| Australia/Oceania | 9-10, 12, 19, 40-41 | |
| Balance Sheet | 91 | |
| Business strategies | 2-3 | |
| Canada | 9-14, 19-21, 25-27, 58, 65, 75 | |
| Capital and exploration expenditures | 1, 8, 54, 72, 84, 88-89, 93 | |
| Capital employed | 1, 8, 54, 60, 72, 77, 84, 86, 95 | |
| Cash flow | 84, 92-93 | |
| Cash Flow Statement | 92 | |
| Chemical capacity | 77, 82 | |
| Chemical products | 79 | |
| Chemical results | 72 | |
| Chemical volumes | 83 | |
| Depreciation and depletion | 50-51, 87, 89 | |
| Dividend and shareholder distributions | 1, 84, 95 | |
| Downstream results | 54 | |
| Earnings | 1, 8, 50-51, 54, 72, 85, 90 | |
| Earnings per barrel | 50-51 | |
| Energy Outlook | 9, 55, 73 | |
| Entitlement volumes | 19, 93 | |
| Europe | 28-30, 58, 76 | |
| Exploration resource addition cost | 8, 13, 94 | |
| Financial highlights | 84 | |
| Frequently Used Terms | 93-95 | |
| Fuels Marketing | 56-59, 63, 76 | |
| Heavy oil and oil sands | 9, 13, 17, 22, 26-27, 65, 93 | |
| Income Statement | 90 | |
| Integration | 3, 20, 64-65, 81 | |
| Key financial ratios | 84 | |
| LNG | 10, 22-23, 28-31, 35, 38, 40-41, 65 | |
| Lubricants and Specialties | 56-59 | |
| Marine well containment | 19 | |
| Middle East | 35-36, 76 | |
| Molecule Management | 61, 81 | |
| Natural gas and power marketing | 9 | |
| Operating costs | 63, 77-78, 87, 94 | |
| Operations Integrity Management System | 18, 62, 80 | |
| Opportunity captures | 10-11 | |
| Petroleum product sales | 69 | |
| Price and spend impacts | 93 | |
| Project execution | 14 | |
| Production sharing contract | 11, 19, 36, 38-39, 93 | |
| Production volumes | 19, 42-43, 93 | |
| Property, plant and equipment | 87, 91 | |
| Qatar | 10, 19-20, 35, 36 | |
| Refinery utilization | 62, 66 | |
| Refining and Supply | 64 | |
| Refining capacity | 55-60, 62, 66-68 | |
| Reserves and resources | 12-13, 46-49, 93 | |
| Reserves replacement costs | 94 | |
| Reserves replacement ratio | 13, 47-49, 93 | |
| Retail sites | 60, 68 | |
| Return on average capital employed | 1, 8, 54, 60, 72, 77, 86, 95 | |
| Russia/Caspian | 11, 37-38, 65 | |
| Safety, Security, Health & Environment | 2, 62 | |
| Share purchases | 95 | |
| Shareholder return | 1, 84, 93 | |
| South America | 27 | |
| Technology | 3, 16-17, 61, 78-79 | |
| Unconventional | 9-11, 13, 19-20, 22-24, 27-29 | |
| United States | 22-25, 56-57, 74-75 | |
| Upstream development project summary | 14-15 | |
| Upstream production outlook | 19 | |
| Wells, net drilled | 44 | |
| XTO Energy Inc. | 12, 14, 22 | |
| Data Tables | ||
| Corporate Financial Tables | ||
| Capital and Exploration Expenditures | 88-89 | |
| Capital Employed/ROCE | 86 | |
| Financial Statements | 90-92 | |
| Functional Earnings | 85 | |
| Business Tables | ||
| Upstream | 42-51 | |
| Downstream | 66-69 | |
| Chemical | 82-83 | |


| • | Publications | |
| • | Stock Quote | |
| • | Dividend Information | |
| • | Contact Information | |
| • | Speeches | |
| • | News Releases | |
| • | Investor Presentations | |
| • | Corporate Governance |
97
|
|

| Corporate Headquarters 5959 Las Colinas Blvd. Irving, Texas 75039-2298 exxonmobil.com |