Introduction |
1 | |||
| 2 | ||||
| 4 | ||||
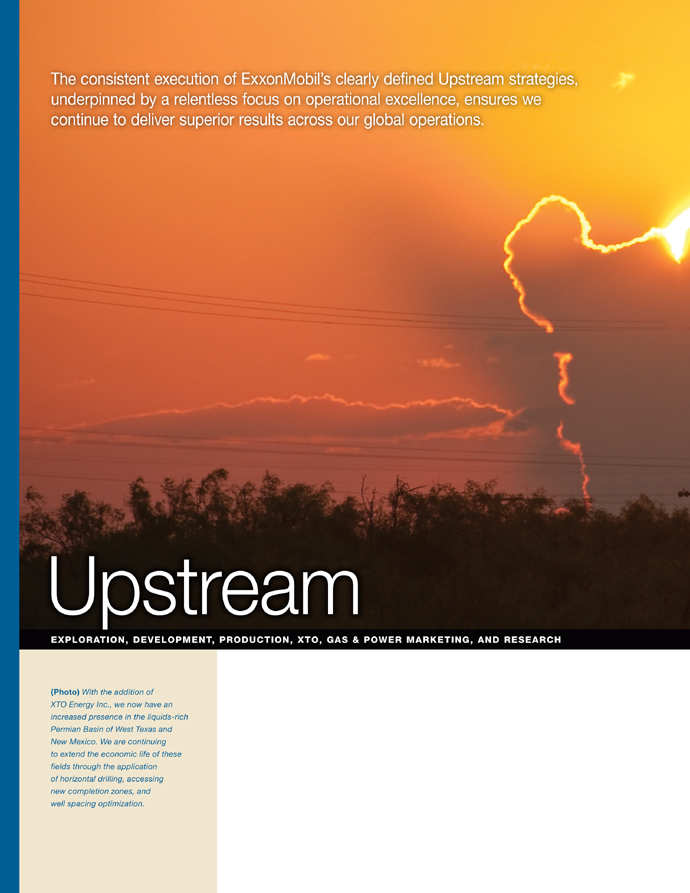
The Outlook for Energy |
6 | |||
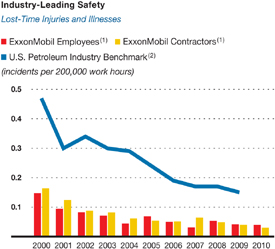
Safety, Security, Health & Environment |
10 | |||
People and Technology |
12 | |||
Financial Highlights |
14 | |||
| 24 | ||||
| 72 | ||||
| 88 | ||||
| 98 | ||||
| 102 | ||||
| 103 |

|
| ExxonMobil’s business model and fundamental strategies are key to achieving sustained, outstanding performance in all aspects of our business. Through the superior execution of these strategies and a foundation based on integrity, ExxonMobil is able to meet the challenge of providing reliable, affordable energy in a responsible manner while delivering long-term value for our shareholders. Corporate |
|


|
| FINANCIAL HIGHLIGHTS | 2010 | 2009 | 2008 | 2007 | 2006 | ||||||||||||||||
| (millions of dollars, unless noted) | |||||||||||||||||||||
Sales and other operating revenue(1) |
370,125 | 301,500 | 459,579 | 390,328 | 365,467 | ||||||||||||||||
Net income attributable to ExxonMobil |
30,460 | 19,280 | 45,220 | 40,610 | 39,500 | ||||||||||||||||
Cash flow from operations and asset sales(2) |
51,674 | 29,983 | 65,710 | 56,206 | 52,366 | ||||||||||||||||
Capital and exploration expenditures(2) |
32,226 | 27,092 | 26,143 | 20,853 | 19,855 | ||||||||||||||||
Cash dividends to ExxonMobil shareholders |
8,498 | 8,023 | 8,058 | 7,621 | 7,628 | ||||||||||||||||
Common stock purchases (gross) |
13,093 | 19,703 | 35,734 | 31,822 | 29,558 | ||||||||||||||||
Research and development costs |
1,012 | 1,050 | 847 | 814 | 733 | ||||||||||||||||
Cash and cash equivalents at year end(3) |
7,825 | 10,693 | 31,437 | 33,981 | 28,244 | ||||||||||||||||
Total assets at year end |
302,510 | 233,323 | 228,052 | 242,082 | 219,015 | ||||||||||||||||
Total debt at year end |
15,014 | 9,605 | 9,425 | 9,566 | 8,347 | ||||||||||||||||
ExxonMobil share of equity at year end |
146,839 | 110,569 | 112,965 | 121,762 | 113,844 | ||||||||||||||||
Average capital employed(2) |
145,217 | 125,050 | 129,683 | 128,760 | 122,573 | ||||||||||||||||
Share price at year end (dollars) |
73.12 | 68.19 | 79.83 | 93.69 | 76.63 | ||||||||||||||||
Market valuation at year end |
364,035 | 322,329 | 397,239 | 504,220 | 438,990 | ||||||||||||||||
Regular employees at year end (thousands) |
83.6 | 80.7 | 79.9 | 80.8 | 82.1 | ||||||||||||||||
| KEY FINANCIAL RATIOS | 2010 | 2009 | 2008 | 2007 | 2006 | ||||||||||||||||
Earnings per common share (dollars) |
6.24 | 3.99 | 8.70 | 7.31 | 6.64 | ||||||||||||||||
Earnings per common share – assuming dilution (dollars) |
6.22 | 3.98 | 8.66 | 7.26 | 6.60 | ||||||||||||||||
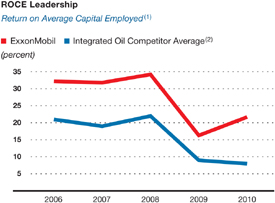
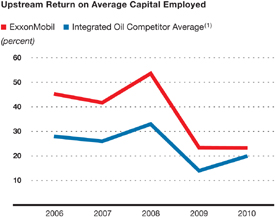
Return on average capital employed(2) (percent) |
21.7 | 16.3 | 34.2 | 31.8 | 32.2 | ||||||||||||||||
Earnings to average ExxonMobil share of equity (percent) |
23.7 | 17.3 | 38.5 | 34.5 | 35.1 | ||||||||||||||||
Debt to capital(4) (percent) |
9.0 | 7.7 | 7.4 | 7.1 | 6.6 | ||||||||||||||||
Net debt to capital(5) (percent) |
4.5 | (1.0 | ) | (23.0 | ) | (24.0 | ) | (20.4 | ) | ||||||||||||
Current assets to current liabilities (times) |
0.94 | 1.06 | 1.47 | 1.47 | 1.55 | ||||||||||||||||
Fixed charge coverage (times) |
42.2 | 25.8 | 54.6 | 51.6 | 47.8 | ||||||||||||||||
| (1) | Sales and other operating revenue includes sales-based taxes of $28,547 million for 2010, $25,936 million for 2009, $34,508 million for 2008, $31,728 million for 2007, and $30,381 million for 2006. | |
| (2) | See Frequently Used Terms on pages 98 through 101. | |
| (3) | Excluding restricted cash of $628 million in 2010, and $4,604 million in 2006. | |
| (4) | Debt includes short- and long-term debt. Capital includes short- and long-term debt and total equity. | |
| (5) | Debt net of cash and cash equivalents, excluding restricted cash. |
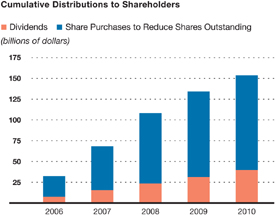
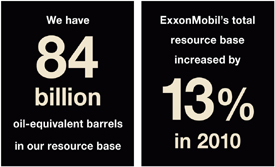
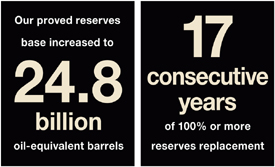
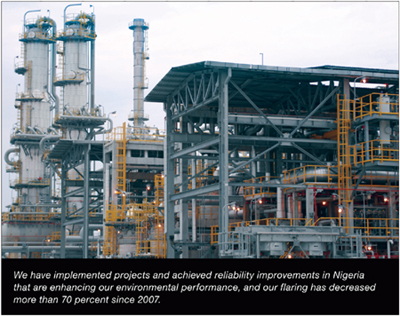
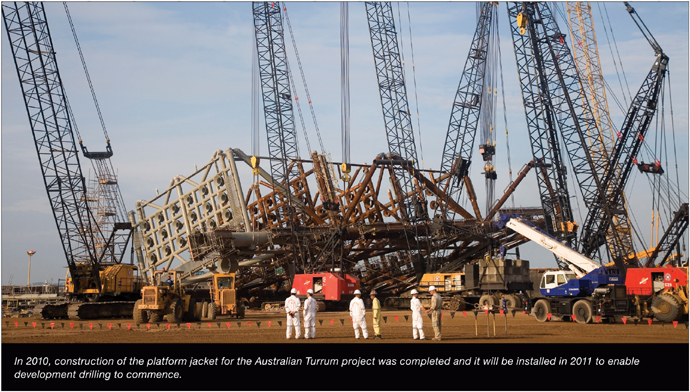
 Best-ever performance in workforce safety. Strong earnings of $30.5 billion, including record Chemical earnings. Annual dividend per share growth of 5 percent versus 2009, the 28th consecutive
year of dividend per share increases. Total shareholder distributions of $19.7 billion. Industry-leading return on average capital employed of 22 percent. Completion of XTO Energy Inc. transaction. Total net production of liquids and natural gas available for sale of 4.4 million
oil-equivalent barrels per day. Proved oil and gas reserve additions of 3.5 billion oil-equivalent barrels, replacing 211 percent
of production, excluding asset sales. Completed new ultra-low sulfur diesel facilities at three refineries. Major expansion under way at the Singapore petrochemical plant. Best-ever performance in workforce safety. Strong earnings of $30.5 billion, including record Chemical earnings. Annual dividend per share growth of 5 percent versus 2009, the 28th consecutive
year of dividend per share increases. Total shareholder distributions of $19.7 billion. Industry-leading return on average capital employed of 22 percent. Completion of XTO Energy Inc. transaction. Total net production of liquids and natural gas available for sale of 4.4 million
oil-equivalent barrels per day. Proved oil and gas reserve additions of 3.5 billion oil-equivalent barrels, replacing 211 percent
of production, excluding asset sales. Completed new ultra-low sulfur diesel facilities at three refineries. Major expansion under way at the Singapore petrochemical plant. |

|
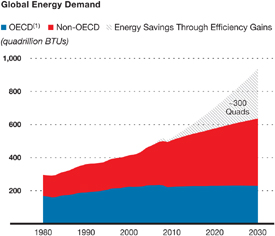
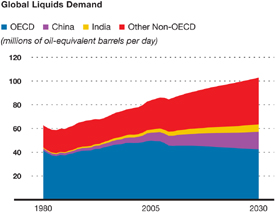
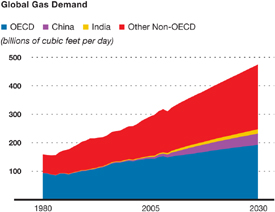
The fastest growing major energy source will be natural gas, reflecting strong demand for clean-burning fuels to meet expanding electricity demand. By 2030, natural gas will displace coal as the second most prominent source of energy |
By 2030, natural gas is projected to be the second largest energy source globally. |
|
worldwide. Oil will remain the largest source of
energy, with demand increasing approximately 20 percent, driven by rising transportation needs.
Energy demand for transportation of all types will be up nearly 40 percent from 2005 to 2030, the
result of growing commercial activity and personal vehicle use.
|
||
(1) OECD = Organization for Economic Cooperation and Development
|
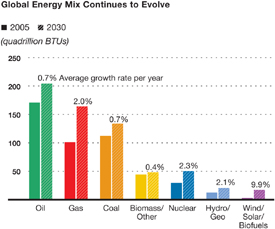
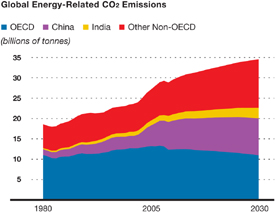
Oil, natural gas, and coal will continue to meet most of the world’s needs, accounting for
approximately 80 percent of demand. No other energy sources can match their availability,
versatility, affordability, and scale. Oil will still account for the largest
share, but natural gas will move into second place on very strong growth. From 2005 to 2030, global
demand for natural gas will increase about 60 percent. Nuclear power will also grow significantly
in many countries to help meet rising electricity demand. Wind, solar, and biofuels will grow most
rapidly through 2030, at nearly 10 percent a year on average. However, starting from a small base,
their contribution by 2030 will remain relatively small at about 2.5 percent of total energy. Global energy demand will grow by about 35 percent from 2005 to 2030, primarily in developing countries. |
 |
 |
|
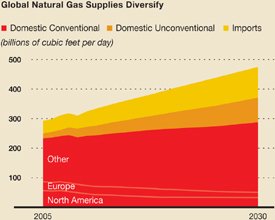
Natural gas will become increasingly prominent while other energy sources also grow. |
Trends for energy-related CO2 emissions through 2030 vary greatly between OECD and non-OECD
countries. |
 |
 |

| 2010 | 2009 | 2008 | 2007 | 2006 | ||||||||||||||||
Earnings per common share (dollars) |
6.24 | 3.99 | 8.70 | 7.31 | 6.64 | |||||||||||||||
Earnings per common share – assuming
dilution (dollars) |
6.22 | 3.98 | 8.66 | 7.26 | 6.60 | |||||||||||||||
Dividends per common share (dollars) |
||||||||||||||||||||
First quarter |
0.42 | 0.40 | 0.35 | 0.32 | 0.32 | |||||||||||||||
Second quarter |
0.44 | 0.42 | 0.40 | 0.35 | 0.32 | |||||||||||||||
Third quarter |
0.44 | 0.42 | 0.40 | 0.35 | 0.32 | |||||||||||||||
Fourth quarter |
0.44 | 0.42 | 0.40 | 0.35 | 0.32 | |||||||||||||||
Total |
1.74 | 1.66 | 1.55 | 1.37 | 1.28 | |||||||||||||||
Dividends per share growth (annual percent) |
4.8 | 7.1 | 13.1 | 7.0 | 12.3 | |||||||||||||||
Number of common shares outstanding (millions) |
||||||||||||||||||||
Average |
4,885 | 4,832 | 5,194 | 5,557 | 5,948 | |||||||||||||||
Average – assuming dilution |
4,897 | 4,848 | 5,221 | 5,594 | 5,987 | |||||||||||||||
Year end |
4,979 | 4,727 | 4,976 | 5,382 | 5,729 | |||||||||||||||
Cash dividends paid on common
stock (millions of dollars) |
8,498 | 8,023 | 8,058 | 7,621 | 7,628 | |||||||||||||||
Cash dividends paid to earnings (percent) |
28 | 42 | 18 | 19 | 19 | |||||||||||||||
Cash dividends paid to
cash flow(1) (percent) |
18 | 28 | 13 | 15 | 15 | |||||||||||||||
Total return to shareholders (annual percent) |
10.1 | (12.6 | ) | (13.2 | ) | 24.3 | 39.2 | |||||||||||||
Market quotations for common stock (dollars) |
||||||||||||||||||||
High |
73.69 | 82.73 | 96.12 | 95.27 | 79.00 | |||||||||||||||
Low |
55.94 | 61.86 | 56.51 | 69.02 | 56.42 | |||||||||||||||
Average daily close |
64.99 | 70.95 | 82.68 | 83.23 | 65.35 | |||||||||||||||
Year-end close |
73.12 | 68.19 | 79.83 | 93.69 | 76.63 | |||||||||||||||
| (1) | Net cash provided by operating activities. |
 |
 |
|||
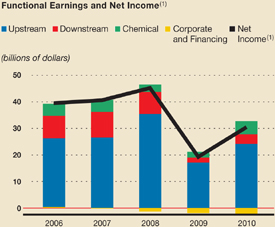
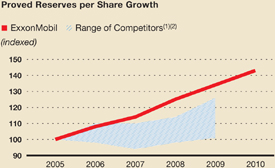
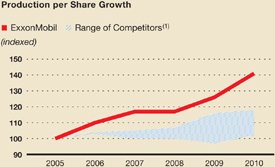
| (1) Net income attributable to ExxonMobil. | (1) Net cash from operating and investing activities, excluding changes in restricted cash and cash equivalents, and marketable securities (see page 23). | |||
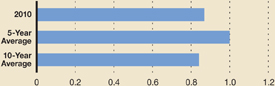
| ExxonMobil delivered earnings of $30.5 billion in 2010, which
included record results in our Chemical business. We continue
to leverage our strong integrated business model for earnings
and efficiency advantages. |
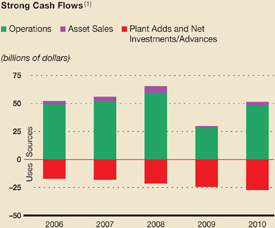
Strong cash flow from operations and asset sales is more than
sufficient to fund a growing level of investments in the business.
We continue to generate strong operating cash flows from our
highly efficient capital base. |
 |
 |
|||
| (1) See Frequently Used Terms on pages 98 through 101. | ||||
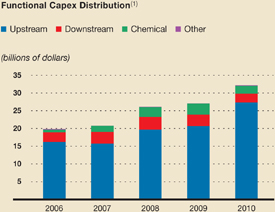
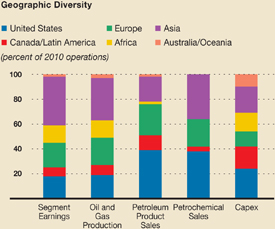
| ExxonMobil’s capital and exploration expenditures support a diverse mix of projects. Our financial strength allows us to continue investing in new technology and attractive projects to bring affordable energy to the world. | ExxonMobil’s business portfolio provides advantages in scale, geographic diversity, and business mix. The strategic diversity of our assets, combined with our unique level of global integration, differentiates us and allows us to maximize shareholder value. | |||
| 2010 Quarters | ||||||||||||||||||||||||||||||||||||
| (millions of dollars) | First | Second | Third | Fourth | 2010 | 2009 | 2008 | 2007 | 2006 | |||||||||||||||||||||||||||
Earnings (U.S. GAAP) |
||||||||||||||||||||||||||||||||||||
Upstream |
||||||||||||||||||||||||||||||||||||
United States |
1,091 | 865 | 999 | 1,317 | 4,272 | 2,893 | 6,243 | 4,870 | 5,168 | |||||||||||||||||||||||||||
Non-U.S. |
4,723 | 4,471 | 4,468 | 6,163 | 19,825 | 14,214 | 29,159 | 21,627 | 21,062 | |||||||||||||||||||||||||||
Total |
5,814 | 5,336 | 5,467 | 7,480 | 24,097 | 17,107 | 35,402 | 26,497 | 26,230 | |||||||||||||||||||||||||||
Downstream |
||||||||||||||||||||||||||||||||||||
United States |
(60 | ) | 440 | 164 | 226 | 770 | (153 | ) | 1,649 | 4,120 | 4,250 | |||||||||||||||||||||||||
Non-U.S. |
97 | 780 | 996 | 924 | 2,797 | 1,934 | 6,502 | 5,453 | 4,204 | |||||||||||||||||||||||||||
Total |
37 | 1,220 | 1,160 | 1,150 | 3,567 | 1,781 | 8,151 | 9,573 | 8,454 | |||||||||||||||||||||||||||
Chemical |
||||||||||||||||||||||||||||||||||||
United States |
539 | 685 | 676 | 522 | 2,422 | 769 | 724 | 1,181 | 1,360 | |||||||||||||||||||||||||||
Non-U.S. |
710 | 683 | 553 | 545 | 2,491 | 1,540 | 2,233 | 3,382 | 3,022 | |||||||||||||||||||||||||||
Total |
1,249 | 1,368 | 1,229 | 1,067 | 4,913 | 2,309 | 2,957 | 4,563 | 4,382 | |||||||||||||||||||||||||||
Corporate and financing |
(800 | ) | (364 | ) | (506 | ) | (447 | ) | (2,117 | ) | (1,917 | ) | (1,290 | ) | (23 | ) | 434 | |||||||||||||||||||
Net income attributable to
ExxonMobil (U.S. GAAP) |
6,300 | 7,560 | 7,350 | 9,250 | 30,460 | 19,280 | 45,220 | 40,610 | 39,500 | |||||||||||||||||||||||||||
Earnings per common share(2) (dollars) |
1.33 | 1.61 | 1.44 | 1.86 | 6.24 | 3.99 | 8.70 | 7.31 | 6.64 | |||||||||||||||||||||||||||
Earnings per common share –
assuming dilution(2) (dollars) |
1.33 | 1.60 | 1.44 | 1.85 | 6.22 | 3.98 | 8.66 | 7.26 | 6.60 | |||||||||||||||||||||||||||
Special Items |
||||||||||||||||||||||||||||||||||||
Upstream |
||||||||||||||||||||||||||||||||||||
United States |
– | – | – | – | – | – | – | – | – | |||||||||||||||||||||||||||
Non-U.S. |
– | – | – | – | – | – | 1,620 | – | – | |||||||||||||||||||||||||||
Total |
– | – | – | – | – | – | 1,620 | – | – | |||||||||||||||||||||||||||
Downstream |
||||||||||||||||||||||||||||||||||||
United States |
– | – | – | – | – | – | – | – | – | |||||||||||||||||||||||||||
Non-U.S. |
– | – | – | – | – | – | – | – | – | |||||||||||||||||||||||||||
Total |
– | – | – | – | – | – | – | – | – | |||||||||||||||||||||||||||
Chemical |
||||||||||||||||||||||||||||||||||||
United States |
– | – | – | – | – | – | – | – | – | |||||||||||||||||||||||||||
Non-U.S. |
– | – | – | – | – | – | – | – | – | |||||||||||||||||||||||||||
Total |
– | – | – | – | – | – | – | – | – | |||||||||||||||||||||||||||
Corporate and financing |
– | – | – | – | – | (140 | ) | (460 | ) | – | 410 | |||||||||||||||||||||||||
Corporate total |
– | – | – | – | – | (140 | ) | 1,160 | – | 410 | ||||||||||||||||||||||||||
Earnings Excluding Special Items(3) |
||||||||||||||||||||||||||||||||||||
Upstream |
||||||||||||||||||||||||||||||||||||
United States |
1,091 | 865 | 999 | 1,317 | 4,272 | 2,893 | 6,243 | 4,870 | 5,168 | |||||||||||||||||||||||||||
Non-U.S. |
4,723 | 4,471 | 4,468 | 6,163 | 19,825 | 14,214 | 27,539 | 21,627 | 21,062 | |||||||||||||||||||||||||||
Total |
5,814 | 5,336 | 5,467 | 7,480 | 24,097 | 17,107 | 33,782 | 26,497 | 26,230 | |||||||||||||||||||||||||||
Downstream |
||||||||||||||||||||||||||||||||||||
United States |
(60 | ) | 440 | 164 | 226 | 770 | (153 | ) | 1,649 | 4,120 | 4,250 | |||||||||||||||||||||||||
Non-U.S. |
97 | 780 | 996 | 924 | 2,797 | 1,934 | 6,502 | 5,453 | 4,204 | |||||||||||||||||||||||||||
Total |
37 | 1,220 | 1,160 | 1,150 | 3,567 | 1,781 | 8,151 | 9,573 | 8,454 | |||||||||||||||||||||||||||
Chemical |
||||||||||||||||||||||||||||||||||||
United States |
539 | 685 | 676 | 522 | 2,422 | 769 | 724 | 1,181 | 1,360 | |||||||||||||||||||||||||||
Non-U.S. |
710 | 683 | 553 | 545 | 2,491 | 1,540 | 2,233 | 3,382 | 3,022 | |||||||||||||||||||||||||||
Total |
1,249 | 1,368 | 1,229 | 1,067 | 4,913 | 2,309 | 2,957 | 4,563 | 4,382 | |||||||||||||||||||||||||||
Corporate and financing |
(800 | ) | (364 | ) | (506 | ) | (447 | ) | (2,117 | ) | (1,777 | ) | (830 | ) | (23 | ) | 24 | |||||||||||||||||||
Corporate total |
6,300 | 7,560 | 7,350 | 9,250 | 30,460 | 19,420 | 44,060 | 40,610 | 39,090 | |||||||||||||||||||||||||||
Earnings per common share(2) (dollars) |
1.33 | 1.61 | 1.44 | 1.86 | 6.24 | 4.02 | 8.48 | 7.31 | 6.57 | |||||||||||||||||||||||||||
Earnings per common share –
assuming dilution(2) (dollars) |
1.33 | 1.60 | 1.44 | 1.85 | 6.22 | 4.01 | 8.44 | 7.26 | 6.53 | |||||||||||||||||||||||||||
| (1) | Total corporate earnings means net income attributable to ExxonMobil (U.S. GAAP) from the consolidated income statement. Unless indicated, references to earnings, special items, Upstream, Downstream, Chemical, and Corporate and Financing segment earnings, and earnings per share are ExxonMobil’s share after excluding amounts attributable to noncontrolling interests. | |
| (2) | Computed using the average number of shares outstanding during each period. The sum of the four quarters may not add to the full year. | |
| (3) | See Frequently Used Terms on pages 98 through 101. |
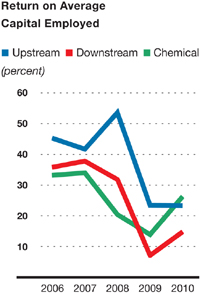
| (percent) | 2010 | 2009 | 2008 | 2007 | 2006 | |||||||||||||||
Upstream |
||||||||||||||||||||
United States |
12.2 | 18.2 | 42.6 | 34.7 | 37.1 | |||||||||||||||
Non-U.S. |
29.0 | 24.8 | 56.7 | 43.7 | 47.9 | |||||||||||||||
Total |
23.3 | 23.4 | 53.6 | 41.7 | 45.3 | |||||||||||||||
Downstream |
||||||||||||||||||||
United States |
12.5 | (2.1 | ) | 23.7 | 65.1 | 65.8 | ||||||||||||||
Non-U.S. |
15.6 | 10.9 | 34.8 | 28.7 | 24.5 | |||||||||||||||
Total |
14.8 | 7.1 | 31.8 | 37.8 | 35.8 | |||||||||||||||
Chemical |
||||||||||||||||||||
United States |
53.0 | 17.6 | 16.0 | 24.9 | 27.7 | |||||||||||||||
Non-U.S. |
17.6 | 12.6 | 22.4 | 39.0 | 36.5 | |||||||||||||||
Total |
26.3 | 13.9 | 20.4 | 34.0 | 33.2 | |||||||||||||||
Corporate and financing |
N.A. | N.A. | N.A. | N.A. | N.A. | |||||||||||||||
Corporate total |
21.7 | 16.3 | 34.2 | 31.8 | 32.2 | |||||||||||||||
| (1) | Capital employed consists of ExxonMobil’s share of equity and consolidated debt, including ExxonMobil’s share of amounts applicable to equity companies. See Frequently Used Terms on pages 98 through 101. |
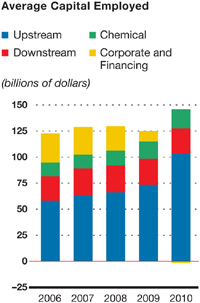
| (millions of dollars) | 2010 | 2009 | 2008 | 2007 | 2006 | |||||||||||||||
Upstream |
||||||||||||||||||||
United States |
34,969 | 15,865 | 14,651 | 14,026 | 13,940 | |||||||||||||||
Non-U.S. |
68,318 | 57,336 | 51,413 | 49,539 | 43,931 | |||||||||||||||
Total |
103,287 | 73,201 | 66,064 | 63,565 | 57,871 | |||||||||||||||
Downstream |
||||||||||||||||||||
United States |
6,154 | 7,306 | 6,963 | 6,331 | 6,456 | |||||||||||||||
Non-U.S. |
17,976 | 17,793 | 18,664 | 18,983 | 17,172 | |||||||||||||||
Total |
24,130 | 25,099 | 25,627 | 25,314 | 23,628 | |||||||||||||||
Chemical |
||||||||||||||||||||
United States |
4,566 | 4,370 | 4,535 | 4,748 | 4,911 | |||||||||||||||
Non-U.S. |
14,114 | 12,190 | 9,990 | 8,682 | 8,272 | |||||||||||||||
Total |
18,680 | 16,560 | 14,525 | 13,430 | 13,183 | |||||||||||||||
Corporate and financing |
(880 | ) | 10,190 | 23,467 | 26,451 | 27,891 | ||||||||||||||
Corporate total |
145,217 | 125,050 | 129,683 | 128,760 | 122,573 | |||||||||||||||
Average capital
employed applicable
to equity companies
included above |
30,524 | 27,684 | 25,651 | 24,267 | 22,106 | |||||||||||||||
| (1) | Average capital employed is the average of beginning- and end-of-year business segment capital employed, including ExxonMobil’s share of amounts applicable to equity companies. See Frequently Used Terms on pages 98 through 101. |
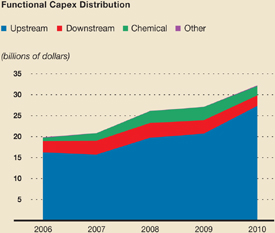
| (millions of dollars) | 2010 | 2009 | 2008 | 2007 | 2006 | |||||||||||||||
Upstream |
||||||||||||||||||||
Exploration |
||||||||||||||||||||
United States |
1,607 | 735 | 734 | 415 | 425 | |||||||||||||||
Non-U.S. |
2,514 | 2,983 | 2,137 | 1,494 | 1,619 | |||||||||||||||
Total |
4,121 | 3,718 | 2,871 | 1,909 | 2,044 | |||||||||||||||
Production(2) |
||||||||||||||||||||
United States |
4,742 | 2,850 | 2,600 | 1,792 | 2,058 | |||||||||||||||
Non-U.S. |
18,214 | 13,877 | 14,011 | 11,913 | 12,059 | |||||||||||||||
Total |
22,956 | 16,727 | 16,611 | 13,705 | 14,117 | |||||||||||||||
Power and Coal |
||||||||||||||||||||
United States |
– | – | – | 5 | 3 | |||||||||||||||
Non-U.S. |
242 | 259 | 252 | 105 | 67 | |||||||||||||||
Total |
242 | 259 | 252 | 110 | 70 | |||||||||||||||
Total Upstream |
27,319 | 20,704 | 19,734 | 15,724 | 16,231 | |||||||||||||||
Downstream |
||||||||||||||||||||
Refining |
||||||||||||||||||||
United States |
833 | 1,300 | 1,430 | 906 | 559 | |||||||||||||||
Non-U.S. |
1,000 | 1,146 | 1,248 | 1,267 | 1,051 | |||||||||||||||
Total |
1,833 | 2,446 | 2,678 | 2,173 | 1,610 | |||||||||||||||
Marketing |
||||||||||||||||||||
United States |
98 | 171 | 176 | 201 | 233 | |||||||||||||||
Non-U.S. |
520 | 536 | 638 | 876 | 852 | |||||||||||||||
Total |
618 | 707 | 814 | 1,077 | 1,085 | |||||||||||||||
Pipeline/Marine |
||||||||||||||||||||
United States |
51 | 40 | 30 | 21 | 32 | |||||||||||||||
Non-U.S. |
3 | 3 | 7 | 32 | 2 | |||||||||||||||
Total |
54 | 43 | 37 | 53 | 34 | |||||||||||||||
Total Downstream |
2,505 | 3,196 | 3,529 | 3,303 | 2,729 | |||||||||||||||
Chemical |
||||||||||||||||||||
United States |
279 | 319 | 441 | 360 | 280 | |||||||||||||||
Non-U.S. |
1,936 | 2,829 | 2,378 | 1,422 | 476 | |||||||||||||||
Total Chemical |
2,215 | 3,148 | 2,819 | 1,782 | 756 | |||||||||||||||
Other |
||||||||||||||||||||
United States |
187 | 44 | 61 | 44 | 130 | |||||||||||||||
Non-U.S. |
– | – | – | – | 9 | |||||||||||||||
Total other |
187 | 44 | 61 | 44 | 139 | |||||||||||||||
Total capital and exploration expenditures |
32,226 | 27,092 | 26,143 | 20,853 | 19,855 | |||||||||||||||
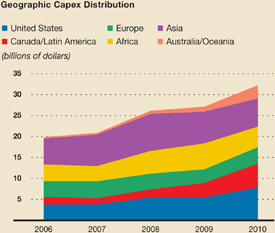
| (millions of dollars) | 2010 | 2009 | 2008 | 2007 | 2006 | |||||||||||||||
United States |
7,797 | 5,459 | 5,472 | 3,744 | 3,720 | |||||||||||||||
Canada/Latin America |
5,732 | 3,448 | 1,926 | 1,522 | 1,862 | |||||||||||||||
Europe |
3,901 | 3,251 | 3,727 | 4,042 | 3,721 | |||||||||||||||
Africa |
4,915 | 6,182 | 5,422 | 3,639 | 4,019 | |||||||||||||||
Asia |
6,693 | 7,535 | 8,845 | 7,479 | 6,168 | |||||||||||||||
Australia/Oceania |
3,188 | 1,217 | 751 | 427 | 365 | |||||||||||||||
Total worldwide |
32,226 | 27,092 | 26,143 | 20,853 | 19,855 | |||||||||||||||
| (millions of dollars) | 2010 | 2009 | 2008 | 2007 | 2006 | |||||||||||||||
Consolidated Companies’ Expenditures |
||||||||||||||||||||
Capital expenditures |
27,343 | 22,441 | 19,841 | 15,242 | 15,361 | |||||||||||||||
Exploration costs charged to expense |
||||||||||||||||||||
United States |
283 | 219 | 189 | 280 | 243 | |||||||||||||||
Non-U.S. |
1,855 | 1,795 | 1,252 | 1,177 | 925 | |||||||||||||||
Depreciation on support equipment(1) |
6 | 7 | 10 | 12 | 13 | |||||||||||||||
Total exploration expenses |
2,144 | 2,021 | 1,451 | 1,469 | 1,181 | |||||||||||||||
Total consolidated companies’ capital
and exploration expenditures (excluding depreciation on support equipment) |
29,481 | 24,455 | 21,282 | 16,699 | 16,529 | |||||||||||||||
ExxonMobil’s Share of Non-Consolidated
Companies’ Expenditures |
||||||||||||||||||||
Capital expenditures |
2,720 | 2,624 | 4,845 | 4,122 | 3,315 | |||||||||||||||
Exploration costs charged to expense |
25 | 13 | 16 | 32 | 11 | |||||||||||||||
Total non-consolidated companies’ capital
and exploration expenditures |
2,745 | 2,637 | 4,861 | 4,154 | 3,326 | |||||||||||||||
Total capital and exploration expenditures |
32,226 | 27,092 | 26,143 | 20,853 | 19,855 | |||||||||||||||
 |
 |
| (millions of dollars) | 2010 | 2009 | 2008 | 2007 | 2006 | |||||||||||||||
Upstream |
||||||||||||||||||||
United States |
69,003 | 19,601 | 17,920 | 16,714 | 16,467 | |||||||||||||||
Non-U.S. |
79,149 | 68,718 | 55,493 | 56,810 | 51,943 | |||||||||||||||
Total |
148,152 | 88,319 | 73,413 | 73,524 | 68,410 | |||||||||||||||
Downstream |
||||||||||||||||||||
United States |
10,585 | 11,013 | 10,492 | 9,705 | 9,320 | |||||||||||||||
Non-U.S. |
19,510 | 19,486 | 18,762 | 20,443 | 19,598 | |||||||||||||||
Total |
30,095 | 30,499 | 29,254 | 30,148 | 28,918 | |||||||||||||||
Chemical |
||||||||||||||||||||
United States |
4,068 | 4,274 | 4,396 | 4,448 | 4,553 | |||||||||||||||
Non-U.S. |
10,187 | 9,237 | 7,034 | 5,623 | 4,766 | |||||||||||||||
Total |
14,255 | 13,511 | 11,430 | 10,071 | 9,319 | |||||||||||||||
Other |
7,046 | 6,787 | 7,249 | 7,126 | 7,040 | |||||||||||||||
Total net investment |
199,548 | 139,116 | 121,346 | 120,869 | 113,687 | |||||||||||||||
| (millions of dollars) | 2010 | 2009 | 2008 | 2007 | 2006 | |||||||||||||||
Upstream |
||||||||||||||||||||
United States |
3,506 | 1,768 | 1,391 | 1,469 | 1,263 | |||||||||||||||
Non-U.S. |
7,574 | 6,376 | 7,266 | 7,126 | 6,482 | |||||||||||||||
Total |
11,080 | 8,144 | 8,657 | 8,595 | 7,745 | |||||||||||||||
Downstream |
||||||||||||||||||||
United States |
681 | 687 | 656 | 639 | 632 | |||||||||||||||
Non-U.S. |
1,565 | 1,665 | 1,672 | 1,662 | 1,605 | |||||||||||||||
Total |
2,246 | 2,352 | 2,328 | 2,301 | 2,237 | |||||||||||||||
Chemical |
||||||||||||||||||||
United States |
421 | 400 | 410 | 405 | 427 | |||||||||||||||
Non-U.S. |
432 | 457 | 422 | 418 | 473 | |||||||||||||||
Total |
853 | 857 | 832 | 823 | 900 | |||||||||||||||
Other |
581 | 564 | 562 | 531 | 534 | |||||||||||||||
Total depreciation and depletion expenses |
14,760 | 11,917 | 12,379 | 12,250 | 11,416 | |||||||||||||||
| (millions of dollars) | 2010 | 2009 | 2008 | 2007 | 2006 | |||||||||||||||
Production and manufacturing expenses |
35,792 | 33,027 | 37,905 | 31,885 | 29,528 | |||||||||||||||
Selling, general, and administrative |
14,683 | 14,735 | 15,873 | 14,890 | 14,273 | |||||||||||||||
Depreciation and depletion |
14,760 | 11,917 | 12,379 | 12,250 | 11,416 | |||||||||||||||
Exploration |
2,144 | 2,021 | 1,451 | 1,469 | 1,181 | |||||||||||||||
Subtotal |
67,379 | 61,700 | 67,608 | 60,494 | 56,398 | |||||||||||||||
ExxonMobil’s share of equity company expenses |
9,049 | 6,670 | 7,204 | 5,619 | 4,947 | |||||||||||||||
Total operating costs |
76,428 | 68,370 | 74,812 | 66,113 | 61,345 | |||||||||||||||
| (millions of dollars) | 2010 | 2009 | 2008 | 2007 | 2006 | |||||||||||||||
Assets |
||||||||||||||||||||
Current assets |
||||||||||||||||||||
Cash and cash equivalents |
7,825 | 10,693 | 31,437 | 33,981 | 28,244 | |||||||||||||||
Cash and cash equivalents – restricted |
628 | – | – | – | 4,604 | |||||||||||||||
Marketable securities |
2 | 169 | 570 | 519 | – | |||||||||||||||
Notes and accounts receivable,
less estimated doubtful amounts |
32,284 | 27,645 | 24,702 | 36,450 | 28,942 | |||||||||||||||
Inventories |
||||||||||||||||||||
Crude oil, products and merchandise |
9,852 | 8,718 | 9,331 | 8,863 | 8,979 | |||||||||||||||
Materials and supplies |
3,124 | 2,835 | 2,315 | 2,226 | 1,735 | |||||||||||||||
Other current assets |
5,269 | 5,175 | 3,911 | 3,924 | 3,273 | |||||||||||||||
Total current assets |
58,984 | 55,235 | 72,266 | 85,963 | 75,777 | |||||||||||||||
Investments, advances and long-term receivables |
35,338 | 31,665 | 28,556 | 28,194 | 23,237 | |||||||||||||||
Property, plant and equipment, at cost,
less accumulated depreciation and depletion |
199,548 | 139,116 | 121,346 | 120,869 | 113,687 | |||||||||||||||
Other assets, including intangibles, net |
8,640 | 7,307 | 5,884 | 7,056 | 6,314 | |||||||||||||||
Total assets |
302,510 | 233,323 | 228,052 | 242,082 | 219,015 | |||||||||||||||
Liabilities |
||||||||||||||||||||
Current liabilities |
||||||||||||||||||||
Notes and loans payable |
2,787 | 2,476 | 2,400 | 2,383 | 1,702 | |||||||||||||||
Accounts payable and accrued liabilities |
50,034 | 41,275 | 36,643 | 45,275 | 39,082 | |||||||||||||||
Income taxes payable |
9,812 | 8,310 | 10,057 | 10,654 | 8,033 | |||||||||||||||
Total current liabilities |
62,633 | 52,061 | 49,100 | 58,312 | 48,817 | |||||||||||||||
Long-term debt |
12,227 | 7,129 | 7,025 | 7,183 | 6,645 | |||||||||||||||
Postretirement benefits reserves |
19,367 | 17,942 | 20,729 | 13,278 | 13,931 | |||||||||||||||
Deferred income tax liabilities |
35,150 | 23,148 | 19,726 | 22,899 | 20,851 | |||||||||||||||
Other long-term obligations |
20,454 | 17,651 | 13,949 | 14,366 | 11,123 | |||||||||||||||
Total liabilities |
149,831 | 117,931 | 110,529 | 116,038 | 101,367 | |||||||||||||||
| Commitments and contingencies | See footnote 1 |
|||||||||||||||||||
Equity |
||||||||||||||||||||
Common stock without par value |
9,371 | 5,503 | 5,314 | 4,933 | 4,786 | |||||||||||||||
Earnings reinvested |
298,899 | 276,937 | 265,680 | 228,518 | 195,207 | |||||||||||||||
Accumulated other comprehensive income |
||||||||||||||||||||
Cumulative foreign exchange translation adjustment |
5,011 | 4,402 | 1,146 | 7,972 | 3,733 | |||||||||||||||
Postretirement benefits reserves adjustment |
(9,889 | ) | (9,863 | ) | (11,077 | ) | (5,983 | ) | (6,495 | ) | ||||||||||
Unrealized gain/(loss) on cash flow hedges |
55 | – | – | – | – | |||||||||||||||
Common stock held in treasury |
(156,608 | ) | (166,410 | ) | (148,098 | ) | (113,678 | ) | (83,387 | ) | ||||||||||
ExxonMobil share of equity |
146,839 | 110,569 | 112,965 | 121,762 | 113,844 | |||||||||||||||
Noncontrolling interests |
5,840 | 4,823 | 4,558 | 4,282 | 3,804 | |||||||||||||||
Total equity |
152,679 | 115,392 | 117,523 | 126,044 | 117,648 | |||||||||||||||
Total liabilities and equity |
302,510 | 233,323 | 228,052 | 242,082 | 219,015 | |||||||||||||||
| (millions of dollars) | 2010 | 2009 | 2008 | 2007 | 2006 | |||||||||||||||
Revenues and Other Income |
||||||||||||||||||||
Sales and other operating revenue(1) |
370,125 | 301,500 | 459,579 | 390,328 | 365,467 | |||||||||||||||
Income from equity affiliates |
10,677 | 7,143 | 11,081 | 8,901 | 6,985 | |||||||||||||||
Other income(2) |
2,419 | 1,943 | 6,699 | 5,323 | 5,183 | |||||||||||||||
Total revenues and other income |
383,221 | 310,586 | 477,359 | 404,552 | 377,635 | |||||||||||||||
Costs and Other Deductions |
||||||||||||||||||||
Crude oil and product purchases |
197,959 | 152,806 | 249,454 | 199,498 | 182,546 | |||||||||||||||
Production and manufacturing expenses |
35,792 | 33,027 | 37,905 | 31,885 | 29,528 | |||||||||||||||
Selling, general, and administrative expenses |
14,683 | 14,735 | 15,873 | 14,890 | 14,273 | |||||||||||||||
Depreciation and depletion |
14,760 | 11,917 | 12,379 | 12,250 | 11,416 | |||||||||||||||
Exploration expenses, including dry holes |
2,144 | 2,021 | 1,451 | 1,469 | 1,181 | |||||||||||||||
Interest expense |
259 | 548 | 673 | 400 | 654 | |||||||||||||||
Sales-based taxes(1) |
28,547 | 25,936 | 34,508 | 31,728 | 30,381 | |||||||||||||||
Other taxes and duties |
36,118 | 34,819 | 41,719 | 40,953 | 39,203 | |||||||||||||||
Total costs and other deductions |
330,262 | 275,809 | 393,962 | 333,073 | 309,182 | |||||||||||||||
Income before income taxes |
52,959 | 34,777 | 83,397 | 71,479 | 68,453 | |||||||||||||||
Income taxes |
21,561 | 15,119 | 36,530 | 29,864 | 27,902 | |||||||||||||||
Net income including noncontrolling interests |
31,398 | 19,658 | 46,867 | 41,615 | 40,551 | |||||||||||||||
Net income attributable to noncontrolling interests |
938 | 378 | 1,647 | 1,005 | 1,051 | |||||||||||||||
Net income attributable to ExxonMobil |
30,460 | 19,280 | 45,220 | 40,610 | 39,500 | |||||||||||||||
Earnings
per Common Share (dollars) |
6.24 | 3.99 | 8.70 | 7.31 | 6.64 | |||||||||||||||
Earnings per Common Share –
Assuming Dilution (dollars) |
6.22 | 3.98 | 8.66 | 7.26 | 6.60 | |||||||||||||||
| (1) | Sales and other operating revenue includes sales-based taxes of $28,547 million for 2010, $25,936 million for 2009, $34,508 million for 2008, $31,728 million for 2007, and $30,381 million for 2006. | |
| (2) | Other income for 2008 includes a $62 million gain from the sale of a non-U.S. investment and a related $143 million foreign exchange loss. |
| (millions of dollars) | 2010 | 2009 | 2008 | 2007 | 2006 | |||||||||||||||
Cash Flows from Operating Activities |
||||||||||||||||||||
Net income including noncontrolling interests |
31,398 | 19,658 | 46,867 | 41,615 | 40,551 | |||||||||||||||
Adjustments for noncash transactions |
||||||||||||||||||||
Depreciation and depletion |
14,760 | 11,917 | 12,379 | 12,250 | 11,416 | |||||||||||||||
Deferred income tax charges/(credits) |
(1,135 | ) | – | 1,399 | 124 | 1,717 | ||||||||||||||
Postretirement benefits expense in excess of/(less than) net payments |
1,700 | (1,722 | ) | 57 | (1,314 | ) | (1,787 | ) | ||||||||||||
Other long-term obligation provisions
in excess of/(less than) payments |
160 | 731 | (63 | ) | 1,065 | (666 | ) | |||||||||||||
Dividends received greater than/(less than)
equity in current earnings of equity companies |
(596 | ) | (483 | ) | 921 | (714 | ) | (579 | ) | |||||||||||
Changes in operational working capital, excluding cash and debt |
||||||||||||||||||||
Reduction/(increase) – Notes and accounts receivable |
(5,863 | ) | (3,170 | ) | 8,641 | (5,441 | ) | (181 | ) | |||||||||||
– Inventories |
(1,148 | ) | 459 | (1,285 | ) | 72 | (1,057 | ) | ||||||||||||
– Other current assets |
913 | 132 | (509 | ) | 280 | (385 | ) | |||||||||||||
Increase/(reduction) – Accounts and other payables |
9,943 | 1,420 | (5,415 | ) | 6,228 | 1,160 | ||||||||||||||
Net (gain) on asset sales |
(1,401 | ) | (488 | ) | (3,757 | ) | (2,217 | ) | (1,531 | ) | ||||||||||
All other items – net |
(318 | ) | (16 | ) | 490 | 54 | 628 | |||||||||||||
Net cash provided by operating activities |
48,413 | 28,438 | 59,725 | 52,002 | 49,286 | |||||||||||||||
Cash Flows from Investing Activities |
||||||||||||||||||||
Additions to property, plant and equipment |
(26,871 | ) | (22,491 | ) | (19,318 | ) | (15,387 | ) | (15,462 | ) | ||||||||||
Sales of subsidiaries, investments, and property,
plant and equipment |
3,261 | 1,545 | 5,985 | 4,204 | 3,080 | |||||||||||||||
Decrease/(increase) in restricted cash and cash equivalents |
(628 | ) | – | – | 4,604 | – | ||||||||||||||
Additional investments and advances |
(1,239 | ) | (2,752 | ) | (2,495 | ) | (3,038 | ) | (2,604 | ) | ||||||||||
Collection of advances |
1,133 | 724 | 574 | 391 | 756 | |||||||||||||||
Additions to marketable securities |
(15 | ) | (16 | ) | (2,113 | ) | (646 | ) | – | |||||||||||
Sales of marketable securities |
155 | 571 | 1,868 | 144 | – | |||||||||||||||
Net cash used in investing activities |
(24,204 | ) | (22,419 | ) | (15,499 | ) | (9,728 | ) | (14,230 | ) | ||||||||||
Cash Flows from Financing Activities |
||||||||||||||||||||
Additions to long-term debt |
1,143 | 225 | 79 | 592 | 318 | |||||||||||||||
Reductions in long-term debt |
(6,224 | ) | (68 | ) | (192 | ) | (209 | ) | (33 | ) | ||||||||||
Additions to short-term debt |
598 | 1,336 | 1,067 | 1,211 | 334 | |||||||||||||||
Reductions in short-term debt |
(2,436 | ) | (1,575 | ) | (1,624 | ) | (809 | ) | (451 | ) | ||||||||||
Additions/(reductions) in debt with three months
or less maturity |
709 | (71 | ) | 143 | (187 | ) | (95 | ) | ||||||||||||
Cash dividends to ExxonMobil shareholders |
(8,498 | ) | (8,023 | ) | (8,058 | ) | (7,621 | ) | (7,628 | ) | ||||||||||
Cash dividends to noncontrolling interests |
(281 | ) | (280 | ) | (375 | ) | (289 | ) | (239 | ) | ||||||||||
Changes in noncontrolling interests |
(7 | ) | (113 | ) | (419 | ) | (659 | ) | (493 | ) | ||||||||||
Tax benefits related to stock-based awards |
122 | 237 | 333 | 369 | 462 | |||||||||||||||
Common stock acquired |
(13,093 | ) | (19,703 | ) | (35,734 | ) | (31,822 | ) | (29,558 | ) | ||||||||||
Common stock sold |
1,043 | 752 | 753 | 1,079 | 1,173 | |||||||||||||||
Net cash used in financing activities |
(26,924 | ) | (27,283 | ) | (44,027 | ) | (38,345 | ) | (36,210 | ) | ||||||||||
Effects of exchange rate changes on cash |
(153 | ) | 520 | (2,743 | ) | 1,808 | 727 | |||||||||||||
Increase/(decrease) in cash and cash equivalents |
(2,868 | ) | (20,744 | ) | (2,544 | ) | 5,737 | (427 | ) | |||||||||||
Cash and cash equivalents at beginning of year |
10,693 | 31,437 | 33,981 | 28,244 | 28,671 | |||||||||||||||
Cash and cash equivalents at end of year |
7,825 | 10,693 | 31,437 | 33,981 | 28,244 | |||||||||||||||
|
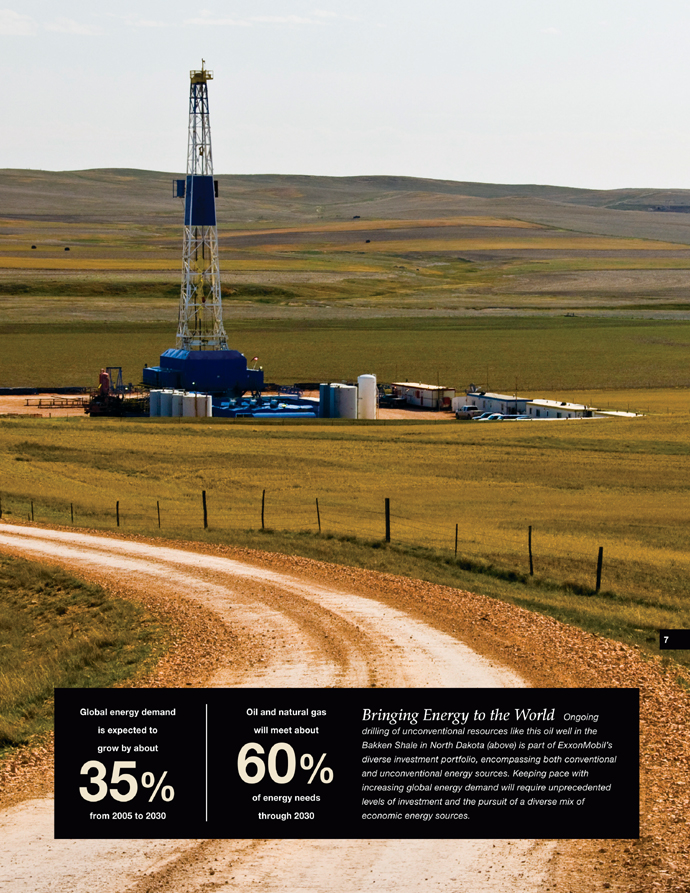
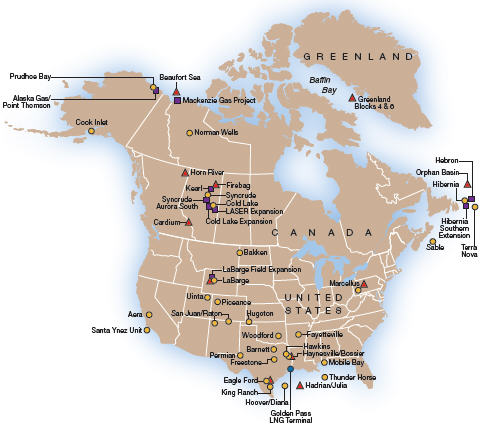
Identify and selectively capture the highest-quality exploration opportunities | ||
|
Maximize profitability of existing oil and gas production | ||
|
Invest in projects that deliver superior returns | ||
|
Capitalize on growing natural gas and power markets | ||
|
|
Maximize resource value through high-impact
technologies and integrated solutions |


| UPSTREAM STATISTICAL RECAP | 2010 | 2009 | 2008 | 2007 | 2006 | |||||||||||||||
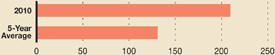
Earnings (millions of dollars) |
24,097 | 17,107 | 35,402 | 26,497 | 26,230 | |||||||||||||||
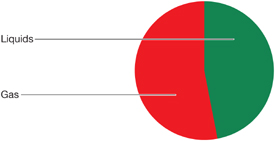
Liquids production (net, thousands of barrels per day) |
2,422 | 2,387 | 2,405 | 2,616 | 2,681 | |||||||||||||||
Natural gas production available for sale (net, millions of cubic feet per day) |
12,148 | 9,273 | 9,095 | 9,384 | 9,334 | |||||||||||||||
Oil-equivalent production (net, thousands of barrels per day) |
4,447 | 3,932 | 3,921 | 4,180 | 4,237 | |||||||||||||||
Proved reserves replacement(1)(2) (percent) |
211 | 100 | 143 | 107 | 135 | |||||||||||||||
Resource additions(2) (millions of oil-equivalent barrels) |
14,580 | 2,860 | 2,230 | 2,010 | 4,270 | |||||||||||||||
Average capital employed(2) (millions of dollars) |
103,287 | 73,201 | 66,064 | 63,565 | 57,871 | |||||||||||||||
Return on average capital employed(2) (percent) |
23.3 | 23.4 | 53.6 | 41.7 | 45.3 | |||||||||||||||
Capital and exploration expenditures(2) (millions of dollars) |
27,319 | 20,704 | 19,734 | 15,724 | 16,231 | |||||||||||||||
| (1) | Proved reserves exclude asset sales and the 2007 Venezuela expropriation. Includes non-consolidated interests and Canadian oil sands. | |
| (2) | See Frequently Used Terms on pages 98 through 101. | |
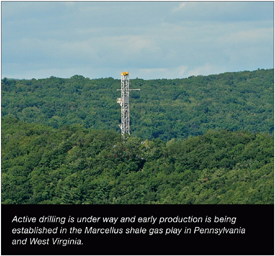
| Note: Unless otherwise stated, production rates, project capacities, and acreage values referred to on pages 24 through 61 are gross. | ||
| References to U.S. unconventional activities on pages 43 through 44 reflect the full year of 2010 activity for well count and gross-operated production. | ||
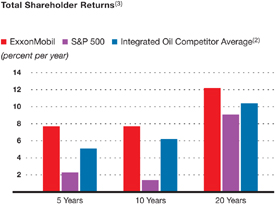
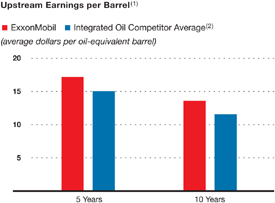
(1) Royal Dutch Shell, BP, and Chevron values are estimated on a consistent basis with ExxonMobil, based on public information.
|
 |
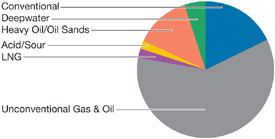
| • | New exploration plays and basins that typically have high uncertainty but large resource potential to provide significant long-term resource growth; | |
| • | Unconventional resources such as shale gas, tight gas, tight oil, coal bed methane, heavy oil, and oil sands that can provide profitable, long-plateau production volumes; | |
| • | Further exploration of established hydrocarbon provinces and mature plays that provide near-term resource additions and production; and, | |
| • | Discovered fields that are undeveloped or partially developed. |

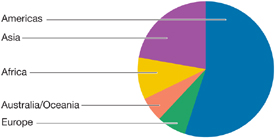
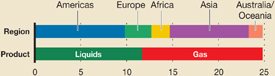
Resource Additions/Acquisitions by Geographic Region
|
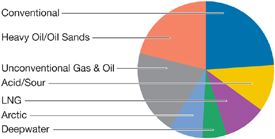
Resource Additions/Acquisitions by Resource Type | |
(percent, oil-equivalent barrels added, 2006-2010)
|
(percent, oil-equivalent barrels added, 2006-2010) | |

|
 |
| 5-Year | ||||||||
| (billions of oil-equivalent barrels) | 2010 | Average | ||||||
Resource additions/acquisitions |
14.6 | 5.2 | ||||||
Revisions to existing fields |
(3.1 | ) | (0.6 | ) | ||||
Production |
(1.7 | ) | (1.6 | ) | ||||
Sales |
(0.1 | ) | (0.7 | )(2) | ||||
Net change versus year-end 2009 |
9.7 | 2.3 | ||||||
| (1) | See Frequently Used Terms on pages 98 through 101. | |
| (2) | Includes impact of the Venezuela expropriation in 2007. |
| (1) | See Frequently Used Terms on pages 98 through 101. | |
| (2) | Includes asset sales and the 2007 Venezuela expropriation. |
| (1) | Reflects data through December 31, 2010. | |
| (2) Royal Dutch Shell, BP and Chevron values calculated on a consistent basis with ExxonMobil, based on public information. | ||
| (Percent, 2006–2010 Average) | Cost | Schedule | ||||||
ExxonMobil Operated |
101 | 109 | ||||||
Operated by Others |
114 | 119 | ||||||
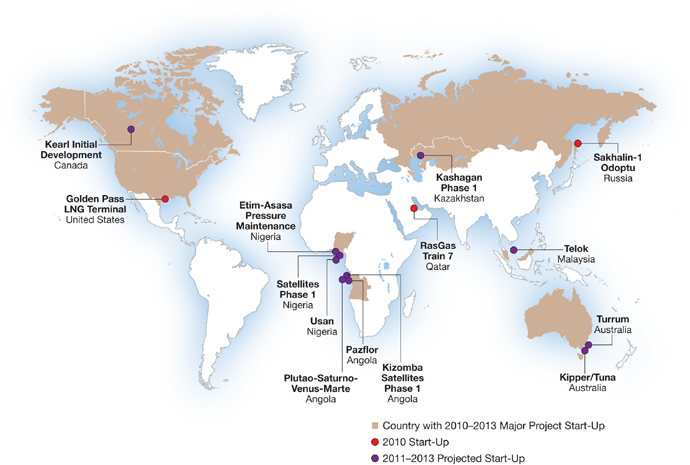
| Target Peak | ||||||||||||||||
| Production (Gross) | ExxonMobil | |||||||||||||||
| Liquids | Gas | Working | ||||||||||||||
| (KBD) | (MCFD) | Interest (%) | ||||||||||||||
| 2010 (Actual) | ||||||||||||||||
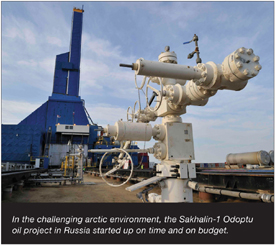
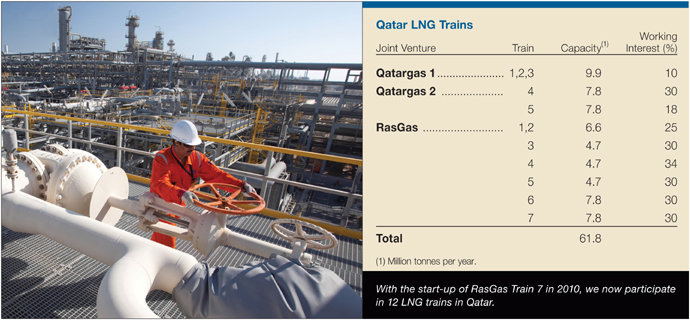
| Qatar | RasGas Train 7 |
75 | 1250 | 30 | 5 | |||||||||||
| Russia | Sakhalin-1 Odoptu |
50 | – | 30 | n | |||||||||||
| U.S. | Golden Pass LNG Terminal |
– | – | 18 | 5 | |||||||||||
| 2011-2013 (Projected) | ||||||||||||||||
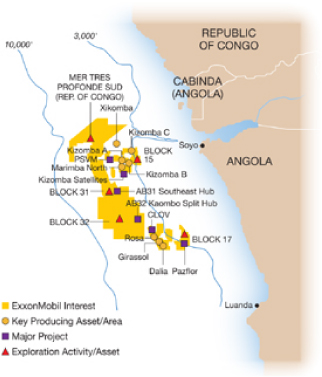
| Angola | Kizomba Satellites Phase 1 |
100 | – | 40 | n | |||||||||||
Pazflor |
200 | – | 20 | l | ||||||||||||
Plutao-Saturno-Venus-Marte |
150 | – | 25 | l | ||||||||||||
| Australia | Kipper/Tuna |
15 | 175 | 40 | n | |||||||||||
Turrum |
20 | 200 | 50 | n | ||||||||||||
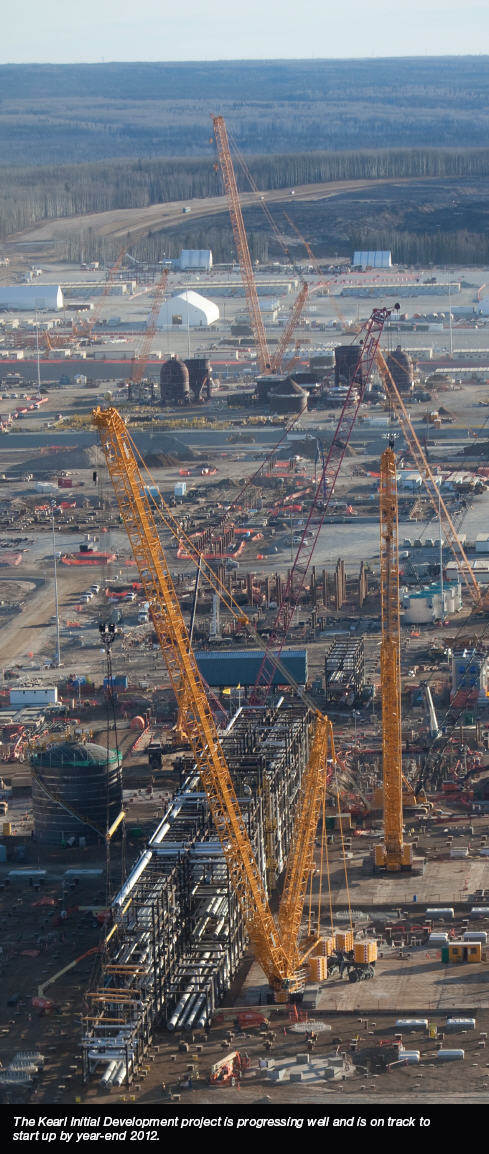
| Canada | Kearl Initial Development |
170 | – | 100 | n | |||||||||||
| Kazakhstan | Kashagan Phase 1 |
360 | – | 17 | l | |||||||||||
| Malaysia | Telok |
– | 350 | 50 | n | |||||||||||
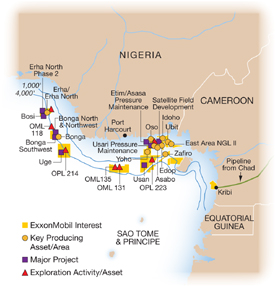
| Nigeria | Usan |
180 | – | 30 | l | |||||||||||
Etim/Asasa Pressure |
50 | – | 40 | n | ||||||||||||
Maintenance |
||||||||||||||||
Satellite Field Development Phase 1 |
70 | – | 40 | n | ||||||||||||
| 2014+ (Projected) | ||||||||||||||||
| Angola | AB31 Southeast Hub |
220 | – | 25 | l | |||||||||||
AB32 Kaombo Split Hub |
210 | – | 15 | l | ||||||||||||
Cravo-Lirio-Orquidea-Violeta |
160 | – | 20 | l | ||||||||||||
Kizomba Satellites Phase 2 |
65 | – | 40 | n | ||||||||||||
| Australia | Gorgon Jansz |
20 | 2545 | 25 | l | |||||||||||
Gorgon Area Expansion |
10 | 850 | 25 | l | ||||||||||||
Gippsland Satellites |
25 | – | 50 | n | ||||||||||||
Scarborough |
– | 1190 | 50 | n | ||||||||||||
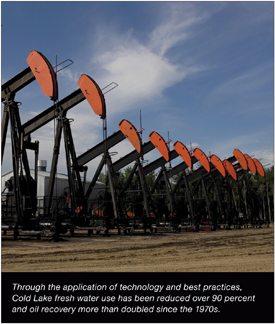
| Canada | Cold Lake Nabiye Expansion |
35 | – | 100 | n | |||||||||||
Cold Lake LASER Expansion |
20 | – | 100 | n | ||||||||||||
Firebag |
280 | – | 40 | n | ||||||||||||
Hebron |
130 | – | 34 | n | ||||||||||||
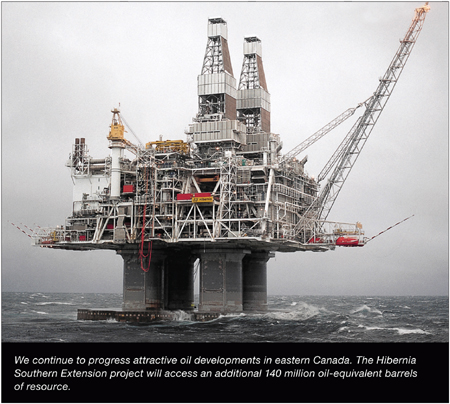
Hibernia Southern Extension |
50 | – | 27 | n | ||||||||||||
Kearl Expansion |
170 | – | 100 | n | ||||||||||||
Mackenzie Gas Project |
10 | 830 | 56 | n | ||||||||||||
Syncrude Aurora South Phases 1 and 2 |
200 | – | 25 | 5 | ||||||||||||
| Target Peak | ||||||||||||||||
| Production (Gross) | ExxonMobil | |||||||||||||||
| Liquids | Gas | Working | ||||||||||||||
| (KBD) | (MCFD) | Interest (%) | ||||||||||||||
| 2014+ (Projected, continued) | ||||||||||||||||
Indonesia |
Banyu Urip | 165 | 15 | 45 | n | |||||||||||
| Natuna | – | 1100 | ** | n | ||||||||||||
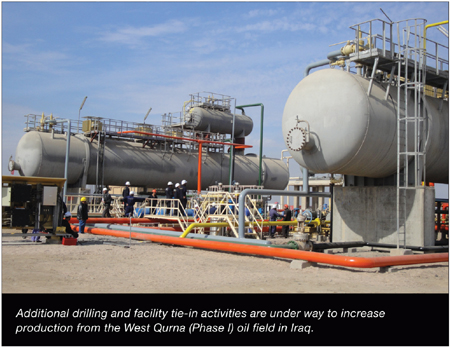
Iraq |
West Qurna (Phase I)* | 2825 | – | 60 | 5 | |||||||||||
Italy |
Tempa Rossa | 50 | 15 | 25 | l | |||||||||||
Kazakhstan |
Aktote | 50 | 850 | 17 | l | |||||||||||
| Kashagan Future Phases | 1190 | – | 17 | l | ||||||||||||
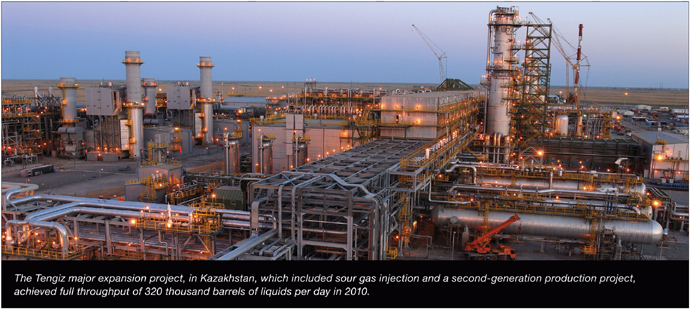
| Tengiz Expansion | 250 | – | 25 | l | ||||||||||||
Malaysia |
Damar Gas | 5 | 260 | 50 | n | |||||||||||
Nigeria |
Bonga North | 100 | 60 | 20 | l | |||||||||||
| Bonga Southwest | 200 | 15 | 16 | l | ||||||||||||
| Bosi | 135 | – | 56 | n | ||||||||||||
| Erha North Phase 2 | 50 | – | 56 | n | ||||||||||||
| QGFE DomGas | 15 | 300 | 40 | n | ||||||||||||
| Satellite Field Development Phase 2 | 80 | – | 40 | n | ||||||||||||
| Uge | 110 | 20 | 20 | n | ||||||||||||
| Usan Future Phases | 50 | – | 30 | l | ||||||||||||
| Usari Pressure Maintenance | 50 | – | 40 | n | ||||||||||||
Norway |
Dagny | 65 | 185 | 33 | l | |||||||||||
| Luva | – | 600 | 15 | l | ||||||||||||
Papua New Guinea |
PNG LNG | 40 | 940 | 33 | n | |||||||||||
Qatar |
Barzan | 55 | 1400 | 7 | 5 | |||||||||||
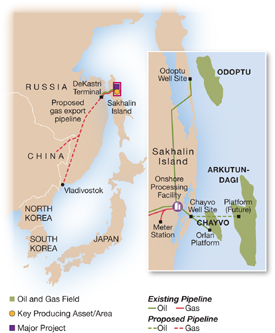
Russia |
Sakhalin-1 Arkutun-Dagi | 90 | – | 30 | n | |||||||||||
| Sakhalin-1 Future Phases | 30 | 800 | 30 | n | ||||||||||||
United Arab Emirates |
Upper Zakum 750 | 750 | – | 28 | 5 | |||||||||||
U.K. |
Fram | 20 | 140 | 72 | l | |||||||||||
U.S. |
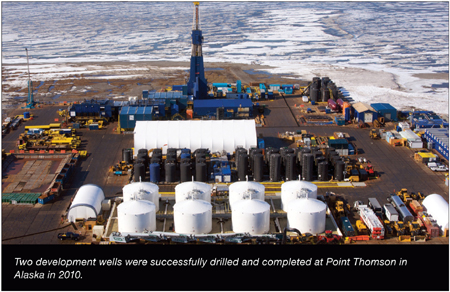
Alaska Gas/Point Thomson | 70 | 4500 | 36 | ** | |||||||||||
| Hadrian | 100 | 375 | 50 | n | ||||||||||||
| Julia | 30 | – | 50 | n | ||||||||||||
| LaBarge Field Expansion | – | 200 | 100 | n | ||||||||||||
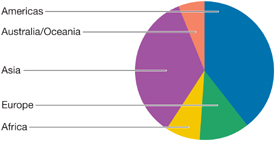
| Americas Highlights | 2010 | 2009 | 2008 | |||||||||
Earnings
(billions
of dollars) |
5.9 | 3.8 | 9.8 | |||||||||
Proved Reserves
(BOEB) |
9.8 | 7.1 | 6.9 | |||||||||
Acreage (gross
acres, million) |
51.4 | 49.5 | 56.4 | |||||||||
Net Liquids
Production (MBD) |
0.7 | 0.7 | 0.7 | |||||||||
Net Gas Available for
Sale (BCFD) |
3.2 | 1.9 | 1.9 | |||||||||
| Europe Highlights | 2010 | 2009 | 2008 | |||||||||
Earnings
(billions of dollars) |
3.8 | 3.6 | 9.9 | |||||||||
Proved
Reserves (BOEB) |
2.9 | 3.2 | 3.4 | |||||||||
Acreage
(gross acres, million) |
43.1 | 35.2 | 27.0 | |||||||||
Net Liquids
Production (MBD) |
0.3 | 0.4 | 0.4 | |||||||||
Net Gas
Available for Sale (BCFD) |
3.8 | 3.7 | 4.0 | |||||||||
| 22% | of Upstream production |
| Africa Highlights | 2010 | 2009 | 2008 | |||||||||
Earnings
(billions of dollars) |
4.4 | 3.9 | 6.4 | |||||||||
Proved
Reserves (BOEB) |
2.0 | 2.1 | 2.3 | |||||||||
Acreage
(gross acres, million) |
16.5 | 17.7 | 42.4 | |||||||||
Net Liquids
Production (MBD) |
0.6 | 0.7 | 0.6 | |||||||||
Net Gas
Available for Sale (BCFD) |
– | – | – | |||||||||

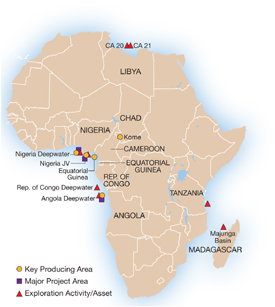
| 18% | of Upstream earnings |
| Asia Highlights | 2010 | 2009 | 2008 | |||||||||
Earnings
(billions of dollars) |
9.4 | 5.2 | 8.5 | |||||||||
Proved Reserves (BOEB) |
8.6 | 9.1 | 9.8 | |||||||||
Acreage
(gross acres, million) |
31.4 | 32.9 | 16.8 | |||||||||
Net Liquids
Production (MBD) |
0.7 | 0.6 | 0.6 | |||||||||
Net Gas
Available for Sale (BCFD) |
4.8 | 3.3 | 2.9 | |||||||||
| 39% | of Upstream earnings |
| Australia/Oceania Highlights | 2010 | 2009 | 2008 | |||||||||
Earnings (billions of dollars) |
0.6 | 0.6 | 0.8 | |||||||||
Proved Reserves (BOEB) |
1.5 | 1.5 | 0.6 | |||||||||
Acreage (gross acres, million) |
7.1 | 11.7 | 12.6 | |||||||||
Net Liquids Production (MBD) |
0.1 | 0.1 | 0.1 | |||||||||
Net Gas Available for Sale (BCFD) |
0.3 | 0.3 | 0.3 | |||||||||
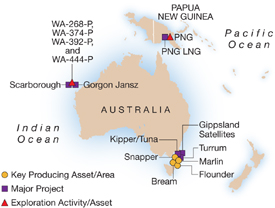 as well as process gas from the existing Kutubai, Gobe, and Moran oil
fields. The development includes a 6.6-million-tonne-per-year LNG facility located near Port
Moresby, conditioning facilities in the PNG Southern Highlands, and approximately 450 miles of
onshore and offshore pipelines. In 2010, the national trainee program commenced at the new
Production Operations Training Center to build the future workforce for the development.
as well as process gas from the existing Kutubai, Gobe, and Moran oil
fields. The development includes a 6.6-million-tonne-per-year LNG facility located near Port
Moresby, conditioning facilities in the PNG Southern Highlands, and approximately 450 miles of
onshore and offshore pipelines. In 2010, the national trainee program commenced at the new
Production Operations Training Center to build the future workforce for the development.
| (thousands of barrels per day) | 2010 | 2009 | 2008 | 2007 | 2006 | |||||||||||||||
United States |
||||||||||||||||||||
Alaska |
117 | 123 | 130 | 132 | 127 | |||||||||||||||
Lower 48 |
291 | 261 | 237 | 260 | 287 | |||||||||||||||
Total United States |
408 | 384 | 367 | 392 | 414 | |||||||||||||||
Canada/South America |
263 | 267 | 292 | 324 | 354 | |||||||||||||||
Total Americas |
671 | 651 | 659 | 716 | 768 | |||||||||||||||
Europe |
||||||||||||||||||||
United Kingdom |
80 | 90 | 123 | 150 | 186 | |||||||||||||||
Norway |
246 | 280 | 295 | 319 | 320 | |||||||||||||||
Other |
9 | 9 | 10 | 11 | 14 | |||||||||||||||
Total Europe |
335 | 379 | 428 | 480 | 520 | |||||||||||||||
Africa |
||||||||||||||||||||
Nigeria |
391 | 391 | 364 | 415 | 427 | |||||||||||||||
Angola |
141 | 194 | 181 | 173 | 193 | |||||||||||||||
Equatorial Guinea |
53 | 55 | 60 | 76 | 103 | |||||||||||||||
Other |
43 | 45 | 47 | 53 | 58 | |||||||||||||||
Total Africa |
628 | 685 | 652 | 717 | 781 | |||||||||||||||
Asia |
||||||||||||||||||||
Malaysia |
48 | 52 | 56 | 67 | 64 | |||||||||||||||
Middle East |
478 | 368 | 381 | 374 | 340 | |||||||||||||||
Russia/Caspian |
191 | 182 | 160 | 185 | 127 | |||||||||||||||
Other |
13 | 5 | 2 | 3 | 4 | |||||||||||||||
Total Asia |
730 | 607 | 599 | 629 | 535 | |||||||||||||||
Australia/Oceania |
58 | 65 | 67 | 74 | 77 | |||||||||||||||
Total worldwide |
2,422 | 2,387 | 2,405 | 2,616 | 2,681 | |||||||||||||||
Gas Plant Liquids Included Above |
||||||||||||||||||||
United States |
59 | 50 | 49 | 57 | 61 | |||||||||||||||
Non-U.S. |
207 | 173 | 164 | 166 | 175 | |||||||||||||||
Total worldwide |
266 | 223 | 213 | 223 | 236 | |||||||||||||||
Oil Sands and Non-Consolidated Volumes Included Above |
||||||||||||||||||||
United States |
69 | 73 | 78 | 82 | 87 | |||||||||||||||
Canada/South America – Bitumen |
115 | 120 | 124 | 130 | 127 | |||||||||||||||
Canada/South America – Synthetic Oil |
67 | 65 | 62 | 65 | 58 | |||||||||||||||
Europe |
5 | 5 | 5 | 6 | 6 | |||||||||||||||
Asia |
404 | 320 | 280 | 265 | 243 | |||||||||||||||
Total worldwide |
660 | 583 | 549 | 548 | 521 | |||||||||||||||
| (1) | Net liquids production quantities are the volumes of crude oil and natural gas liquids withdrawn from ExxonMobil’s oil and gas reserves, excluding royalties and quantities due to others when produced, and are based on the volumes delivered from the lease or at the point measured for royalty and/or severance tax purposes. Volumes include 100 percent of the production of majority-owned affiliates, including liquids production from oil sands operations in Canada, and ExxonMobil’s ownership of the production by companies owned 50 percent or less. |
|
 |
|
| (1) Royal Dutch Shell, BP, and Chevron values are calculated on a consistent basis with ExxonMobil, based on public information. | ||
| (2) 2010 competitor data not available. | ||
| (millions of cubic feet per day) | 2010 | 2009 | 2008 | 2007 | 2006 | |||||||||||||||
United States |
2,596 | 1,275 | 1,246 | 1,468 | 1,625 | |||||||||||||||
Canada/South America |
569 | 643 | 640 | 808 | 935 | |||||||||||||||
Total Americas |
3,165 | 1,918 | 1,886 | 2,276 | 2,560 | |||||||||||||||
Europe |
||||||||||||||||||||
The Netherlands |
2,041 | 1,676 | 1,748 | 1,551 | 1,536 | |||||||||||||||
United Kingdom |
550 | 594 | 750 | 779 | 990 | |||||||||||||||
Norway |
700 | 786 | 764 | 705 | 686 | |||||||||||||||
Germany |
545 | 633 | 687 | 775 | 874 | |||||||||||||||
Total Europe |
3,836 | 3,689 | 3,949 | 3,810 | 4,086 | |||||||||||||||
Africa |
14 | 19 | 32 | 26 | – | |||||||||||||||
Asia |
||||||||||||||||||||
Indonesia |
215 | 245 | 239 | 286 | 365 | |||||||||||||||
Malaysia |
513 | 545 | 582 | 583 | 519 | |||||||||||||||
Middle East |
3,865 | 2,367 | 1,911 | 1,875 | 1,353 | |||||||||||||||
Russia/Caspian |
187 | 153 | 114 | 110 | 92 | |||||||||||||||
Other |
21 | 22 | 24 | 29 | 29 | |||||||||||||||
Total Asia |
4,801 | 3,332 | 2,870 | 2,883 | 2,358 | |||||||||||||||
Australia/Oceania |
332 | 315 | 358 | 389 | 330 | |||||||||||||||
Total worldwide |
12,148 | 9,273 | 9,095 | 9,384 | 9,334 | |||||||||||||||
Non-Consolidated Natural Gas Volumes Included Above |
||||||||||||||||||||
United States |
1 | 1 | 1 | 1 | 1 | |||||||||||||||
Europe |
1,977 | 1,618 | 1,696 | 1,503 | 1,500 | |||||||||||||||
Asia |
2,954 | 1,918 | 1,433 | 1,351 | 1,075 | |||||||||||||||
Total worldwide |
4,932 | 3,537 | 3,130 | 2,855 | 2,576 | |||||||||||||||
| (1) | Net natural gas available for sale quantities are the volumes withdrawn from ExxonMobil’s natural gas reserves, excluding royalties and volumes due to others when produced, and excluding gas purchased from others, gas consumed in producing operations, field processing plant losses, volumes used for gas lift, gas injection and cycling operations, quantities flared, and volume shrinkage due to the removal of condensate or natural gas liquids fractions. | |
| (millions of cubic feet per day) | 2010 | 2009 | 2008 | 2007 | 2006 | |||||||||||||||
United States |
3,166 | 1,321 | 1,292 | 1,560 | 1,686 | |||||||||||||||
Canada/South America |
696 | 739 | 845 | 968 | 1,120 | |||||||||||||||
Europe |
6,401 | 5,854 | 5,665 | 5,396 | 5,728 | |||||||||||||||
Africa |
14 | 19 | 32 | 26 | – | |||||||||||||||
Asia |
4,102 | 2,760 | 2,612 | 2,631 | 2,153 | |||||||||||||||
Australia/Oceania |
339 | 322 | 366 | 398 | 338 | |||||||||||||||
Total worldwide |
14,718 | 11,015 | 10,812 | 10,979 | 11,025 | |||||||||||||||
| (1) | Natural gas sales include 100 percent of the sales of ExxonMobil- and majority-owned affiliates and ExxonMobil’s ownership of sales by companies owned 50 percent or less. Numbers include sales of gas purchased from third parties. |
| (net wells drilled) | 2010 | 2009 | 2008 | 2007 | 2006 | |||||||||||||||
Productive |
||||||||||||||||||||
Exploratory(2) |
37 | 20 | 19 | 19 | 21 | |||||||||||||||
Development |
1,200 | 829 | 731 | 917 | 1,041 | |||||||||||||||
Total |
1,237 | 849 | 750 | 936 | 1,062 | |||||||||||||||
Dry |
||||||||||||||||||||
Exploratory(2) |
7 | 9 | 9 | 16 | 12 | |||||||||||||||
Development |
5 | 5 | 4 | 19 | 11 | |||||||||||||||
Total |
12 | 14 | 13 | 35 | 23 | |||||||||||||||
Net Wells Drilled |
||||||||||||||||||||
Exploratory(2) |
44 | 29 | 28 | 35 | 33 | |||||||||||||||
Development |
1,205 | 834 | 735 | 936 | 1,052 | |||||||||||||||
Total |
1,249 | 863 | 763 | 971 | 1,085 | |||||||||||||||
| (thousands of net acres) | 2010 | 2009 | 2008 | 2007 | 2006 | |||||||||||||||
Undeveloped |
||||||||||||||||||||
United States |
4,914 | 5,111 | 5,691 | 5,539 | 6,062 | |||||||||||||||
Canada/South America |
11,977 | 17,107 | 19,953 | 22,563 | 22,224 | |||||||||||||||
Europe |
16,118 | 13,470 | 7,913 | 6,002 | 2,727 | |||||||||||||||
Africa |
8,612 | 10,555 | 26,439 | 24,835 | 24,075 | |||||||||||||||
Asia |
19,086 | 20,457 | 6,824 | 7,715 | 6,739 | |||||||||||||||
Australia/Oceania |
1,352 | 5,216 | 5,738 | 5,844 | 1,172 | |||||||||||||||
Total worldwide |
62,059 | 71,916 | 72,558 | 72,498 | 62,999 | |||||||||||||||
Developed |
||||||||||||||||||||
United States |
9,919 | 5,120 | 5,148 | 5,174 | 5,178 | |||||||||||||||
Canada/South America |
2,439 | 2,460 | 2,488 | 2,366 | 2,360 | |||||||||||||||
Europe |
2,986 | 3,806 | 4,026 | 4,194 | 4,418 | |||||||||||||||
Africa |
684 | 758 | 756 | 729 | 717 | |||||||||||||||
Asia |
1,271 | 1,160 | 1,048 | 1,037 | 1,033 | |||||||||||||||
Australia/Oceania |
719 | 719 | 719 | 728 | 738 | |||||||||||||||
Total worldwide |
18,018 | 14,023 | 14,185 | 14,228 | 14,444 | |||||||||||||||
| (millions of dollars) | 2010 | 2009 | 2008 | 2007 | 2006 | |||||||||||||||
United States |
70,011 | 20,363 | 18,542 | 16,948 | 16,530 | |||||||||||||||
Canada/South America |
18,089 | 13,408 | 9,967 | 11,338 | 10,076 | |||||||||||||||
Europe |
12,845 | 14,357 | 11,477 | 15,426 | 15,182 | |||||||||||||||
Africa |
22,563 | 20,917 | 17,797 | 15,149 | 14,280 | |||||||||||||||
Asia |
23,765 | 21,859 | 19,191 | 17,186 | 14,759 | |||||||||||||||
Australia/Oceania |
5,284 | 3,725 | 2,407 | 2,630 | 2,300 | |||||||||||||||
Total worldwide |
152,557 | 94,629 | 79,381 | 78,677 | 73,127 | |||||||||||||||
| (1) | A regional breakout of this data is included on pages 13 and 14 of ExxonMobil’s 2010 Form 10-K. | |
| (2) | These include near-field and appraisal wells classified as exploratory for SEC reporting. | |
| (3) | Includes non-consolidated interests and Canadian oil sands operations. |
| Property | ||||||||||||||||
| Acquisition | Exploration | Development | Total | |||||||||||||
| (millions of dollars) | Costs | Costs | Costs | Costs | ||||||||||||
During 2010 |
||||||||||||||||
United States |
45,143 | 694 | 8,270 | 54,107 | ||||||||||||
Canada/South America |
136 | 527 | 4,757 | 5,420 | ||||||||||||
Europe |
64 | 606 | 1,452 | 2,122 | ||||||||||||
Africa |
3 | 453 | 4,390 | 4,846 | ||||||||||||
Asia |
115 | 547 | 3,195 | 3,857 | ||||||||||||
Australia/Oceania |
– | 228 | 1,146 | 1,374 | ||||||||||||
Total worldwide |
45,461 | 3,055 | 23,210 | 71,726 | ||||||||||||
During 2009 |
||||||||||||||||
United States |
205 | 549 | 2,787 | 3,541 | ||||||||||||
Canada/South America |
353 | 498 | 2,394 | 3,245 | ||||||||||||
Europe |
1 | 525 | 3,639 | 4,165 | ||||||||||||
Africa |
605 | 880 | 4,596 | 6,081 | ||||||||||||
Asia |
121 | 529 | 2,946 | 3,596 | ||||||||||||
Australia/Oceania |
– | 130 | 768 | 898 | ||||||||||||
Total worldwide |
1,285 | 3,111 | 17,130 | 21,526 | ||||||||||||
During 2008 |
||||||||||||||||
United States |
281 | 453 | 2,739 | 3,473 | ||||||||||||
Canada/South America |
126 | 325 | 1,421 | 1,872 | ||||||||||||
Europe |
25 | 401 | 1,863 | 2,289 | ||||||||||||
Africa |
82 | 686 | 4,783 | 5,551 | ||||||||||||
Asia |
73 | 307 | 3,384 | 3,764 | ||||||||||||
Australia/Oceania |
76 | 100 | 443 | 619 | ||||||||||||
Total worldwide |
663 | 2,272 | 14,633 | 17,568 | ||||||||||||
During 2007 |
||||||||||||||||
United States |
63 | 377 | 1,859 | 2,299 | ||||||||||||
Canada/South America |
93 | 231 | 902 | 1,226 | ||||||||||||
Europe |
– | 229 | 2,016 | 2,245 | ||||||||||||
Africa |
13 | 584 | 2,847 | 3,444 | ||||||||||||
Asia |
21 | 210 | 3,721 | 3,952 | ||||||||||||
Australia/Oceania |
4 | 131 | 225 | 360 | ||||||||||||
Total worldwide |
194 | 1,762 | 11,570 | 13,526 | ||||||||||||
During 2006 |
||||||||||||||||
United States |
54 | 382 | 1,838 | 2,274 | ||||||||||||
Canada/South America |
100 | 225 | 1,002 | 1,327 | ||||||||||||
Europe |
11 | 202 | 2,660 | 2,873 | ||||||||||||
Africa |
16 | 518 | 3,433 | 3,967 | ||||||||||||
Asia |
416 | 295 | 2,942 | 3,653 | ||||||||||||
Australia/Oceania |
– | 63 | 228 | 291 | ||||||||||||
Total worldwide |
597 | 1,685 | 12,103 | 14,385 | ||||||||||||
| (1) | Includes non-consolidated interests and Canadian oil sands operations. |
| 2010 | 2009 | 2008 | 2007 | 2006 | ||||||||||||||||
Liquids, Including Oil Sands and
Non-Consolidated Reserves
(millions of barrels at year end) |
||||||||||||||||||||
Net proved developed and undeveloped reserves |
||||||||||||||||||||
United States |
2,303 | 1,972 | 1,971 | 2,225 | 2,275 | |||||||||||||||
Canada/South America |
2,946 | 2,918 | 2,683 | 1,633 | 2,113 | |||||||||||||||
Europe |
454 | 517 | 560 | 699 | 760 | |||||||||||||||
Africa |
1,799 | 1,907 | 2,137 | 2,058 | 2,089 | |||||||||||||||
Asia |
3,896 | 4,049 | 4,424 | 4,246 | 4,112 | |||||||||||||||
Australia/Oceania |
275 | 288 | 231 | 213 | 219 | |||||||||||||||
Total worldwide |
11,673 | 11,651 | 12,006 | 11,074 | 11,568 | |||||||||||||||
Proportional interest in oil sands and
non-consolidated reserves included above |
||||||||||||||||||||
United States |
351 | 356 | 327 | 374 | 391 | |||||||||||||||
Canada/South America (bitumen)(2) |
2,102 | 2,055 | 1,767 | 717 | 741 | |||||||||||||||
Canada/South America (synthetic oil)(2) |
681 | 691 | 734 | 694 | 718 | |||||||||||||||
Europe |
31 | 30 | 27 | 26 | 12 | |||||||||||||||
Asia |
1,873 | 2,050 | 2,205 | 2,236 | 2,253 | |||||||||||||||
Net proved developed reserves included above |
||||||||||||||||||||
United States |
1,749 | 1,490 | 1,521 | 1,626 | 1,777 | |||||||||||||||
Canada/South America |
1,333 | 1,311 | 1,315 | 1,376 | 1,620 | |||||||||||||||
Europe |
382 | 386 | 419 | 526 | 568 | |||||||||||||||
Africa |
1,055 | 1,122 | 1,284 | 1,202 | 1,279 | |||||||||||||||
Asia |
2,929 | 2,876 | 2,514 | 2,214 | 2,172 | |||||||||||||||
Australia/Oceania |
139 | 153 | 165 | 185 | 200 | |||||||||||||||
Total worldwide |
7,587 | 7,338 | 7,218 | 7,129 | 7,616 | |||||||||||||||
Natural Gas, Including Non-Consolidated Reserves
(billions of cubic feet at year end) |
||||||||||||||||||||
Net proved developed and undeveloped reserves |
||||||||||||||||||||
United States |
26,111 | 11,802 | 11,890 | 13,297 | 12,180 | |||||||||||||||
Canada/South America |
1,258 | 1,368 | 1,383 | 1,559 | 1,984 | |||||||||||||||
Europe |
14,788 | 16,173 | 17,284 | 18,853 | 19,640 | |||||||||||||||
Africa |
908 | 920 | 918 | 1,006 | 986 | |||||||||||||||
Asia |
28,399 | 30,304 | 32,383 | 31,790 | 31,059 | |||||||||||||||
Australia/Oceania |
7,351 | 7,440 | 2,021 | 1,757 | 1,711 | |||||||||||||||
Total worldwide |
78,815 | 68,007 | 65,879 | 68,262 | 67,560 | |||||||||||||||
Proportional interest in non-consolidated
reserves included above |
||||||||||||||||||||
United States |
117 | 114 | 112 | 125 | 131 | |||||||||||||||
Europe |
10,746 | 11,450 | 11,839 | 12,341 | 12,551 | |||||||||||||||
Asia |
21,139 | 22,001 | 22,526 | 23,186 | 22,398 | |||||||||||||||
Net proved developed reserves included above |
||||||||||||||||||||
United States |
15,441 | 7,582 | 7,931 | 8,477 | 9,389 | |||||||||||||||
Canada/South America |
1,077 | 1,200 | 1,148 | 1,303 | 1,628 | |||||||||||||||
Europe |
11,683 | 12,782 | 13,710 | 14,743 | 15,331 | |||||||||||||||
Africa |
711 | 739 | 738 | 773 | 823 | |||||||||||||||
Asia |
27,087 | 25,206 | 17,876 | 14,021 | 13,542 | |||||||||||||||
Australia/Oceania |
1,174 | 1,262 | 1,346 | 1,403 | 1,504 | |||||||||||||||
Total worldwide |
57,173 | 48,771 | 42,749 | 40,720 | 42,217 | |||||||||||||||
| (1) | ExxonMobil reserves using SEC historical price bases; proved reserves as defined by the SEC are based on historical market prices: prior to 2009, the SEC defined price as the market price on December 31; beginning in 2009, the SEC changed the definition to the average of the market prices on the first day of each calendar month during the year. Mining and equity company reserves are included for all periods. See Frequently Used Terms on pages 98 through 101. | |
| (2) | Proved reserves classified as bitumen are associated with the Cold Lake and Kearl projects in Canada. Proved reserves classified as synthetic oil are associated with the Syncrude project in Canada. Cold Lake uses in situ methods, and hydrocarbons are produced from wells drilled into the subsurface. Syncrude is an oil sands mining project which includes an upgrader that converts the mined hydrocarbons into a higher gravity crude oil. Kearl is an oil sands mining project that does not incorporate an upgrader. |
| 2010 | 2009 | 2008 | 2007 | 2006 | ||||||||||||||||
Oil-Equivalent, Including Oil Sands
and Non-Consolidated Reserves
(millions of barrels at year end) |
||||||||||||||||||||
Net proved developed and
undeveloped reserves |
||||||||||||||||||||
United States |
6,654 | 3,939 | 3,953 | 4,441 | 4,305 | |||||||||||||||
Canada/South America |
3,155 | 3,146 | 2,914 | 1,893 | 2,444 | |||||||||||||||
Europe |
2,919 | 3,212 | 3,441 | 3,841 | 4,034 | |||||||||||||||
Africa |
1,951 | 2,060 | 2,290 | 2,226 | 2,253 | |||||||||||||||
Asia |
8,630 | 9,100 | 9,820 | 9,544 | 9,288 | |||||||||||||||
Australia/Oceania |
1,500 | 1,528 | 568 | 506 | 504 | |||||||||||||||
Total worldwide |
24,809 | 22,985 | 22,986 | 22,451 | 22,828 | |||||||||||||||
| (million barrels of oil or billion cubic feet of gas | Average | |||||||||||||||||||||||
| unless specified otherwise) | 2010 | 2009 | 2008 | 2007 | 2006 | 2006-2010 | ||||||||||||||||||
Liquids (millions of barrels) |
||||||||||||||||||||||||
Revisions |
358 | 361 | 583 | 666 | 442 | 482 | ||||||||||||||||||
Improved recovery |
5 | 15 | 6 | 35 | 27 | 17 | ||||||||||||||||||
Extensions/discoveries |
185 | 142 | 1,308 | 194 | 186 | 403 | ||||||||||||||||||
Purchases |
378 | – | – | – | 746 | 225 | ||||||||||||||||||
Sales |
(21 | ) | (3 | ) | (86 | ) | (436 | ) | (86 | ) | (126 | ) | ||||||||||||
Total additions |
905 | 515 | 1,811 | 459 | 1,315 | 1,001 | ||||||||||||||||||
Production |
883 | 870 | 879 | 953 | 976 | 912 | ||||||||||||||||||
Reserves replacement ratio,
excluding sales (percent) |
105 | 60 | 216 | 94 | 144 | 124 | ||||||||||||||||||
Reserves replacement ratio,
including sales (percent) |
102 | 59 | 206 | 48 | 135 | 110 | ||||||||||||||||||
Natural Gas (billions of cubic feet) |
||||||||||||||||||||||||
Revisions |
879 | 135 | 643 | 4,435 | 1,466 | 1,512 | ||||||||||||||||||
Improved recovery |
– | – | 1 | 4 | 13 | 3 | ||||||||||||||||||
Extensions/discoveries |
1,988 | 5,694 | 692 | 324 | 2,957 | 2,331 | ||||||||||||||||||
Purchases |
12,789 | 8 | – | 9 | 57 | 2,572 | ||||||||||||||||||
Sales |
(106 | ) | (13 | ) | (82 | ) | (320 | ) | (104 | ) | (125 | ) | ||||||||||||
Total additions |
15,550 | 5,824 | 1,254 | 4,452 | 4,389 | 6,293 | ||||||||||||||||||
Production |
4,742 | 3,696 | 3,637 | 3,750 | 3,736 | 3,912 | ||||||||||||||||||
Reserves replacement ratio,
excluding sales (percent) |
330 | 158 | 37 | 127 | 120 | 164 | ||||||||||||||||||
Reserves replacement ratio,
including sales (percent) |
328 | 158 | 34 | 119 | 117 | 161 | ||||||||||||||||||
Oil-Equivalent (millions of barrels) |
||||||||||||||||||||||||
Revisions |
505 | 383 | 690 | 1,405 | 687 | 734 | ||||||||||||||||||
Improved recovery |
5 | 15 | 7 | 36 | 29 | 18 | ||||||||||||||||||
Extensions/discoveries |
516 | 1,091 | 1,423 | 248 | 679 | 791 | ||||||||||||||||||
Purchases |
2,510 | 1 | – | 2 | 755 | 654 | ||||||||||||||||||
Sales |
(38 | ) | (5 | ) | (100 | ) | (490 | ) | (104 | ) | (147 | ) | ||||||||||||
Total additions |
3,498 | 1,485 | 2,020 | 1,201 | 2,046 | 2,050 | ||||||||||||||||||
Production |
1,674 | 1,486 | 1,485 | 1,578 | 1,598 | 1,564 | ||||||||||||||||||
Reserves replacement ratio,
excluding sales (percent) |
211 | 100 | 143 | 107 | 135 | 140 | ||||||||||||||||||
Reserves replacement ratio,
including sales (percent) |
209 | 100 | 136 | 76 | 128 | 131 | ||||||||||||||||||
| (1) | ExxonMobil reserves using SEC historical price bases; proved reserves as defined by the SEC are based on historical market prices: prior to 2009, the SEC defined price as the market price on December 31; beginning in 2009, the SEC changed the definition to the average of the market prices on the first day of each calendar month during the year. Mining and equity company reserves and production are included for all periods. See Frequently Used Terms on pages 98 through 101. | |
| (2) | The term “sales” includes the impact of expropriation of proved reserves in Venezuela (462 million oil-equivalent barrels) in 2007. |
|
2010 RESERVES CHANGES BY REGION(1)
|
||||||||||||||||||||||||||||||||||||||||
| Crude Oil and Natural Gas Liquids | Bitumen | Synthetic Oil | ||||||||||||||||||||||||||||||||||||||
| Canada/ | Canada/ | Canada/ | ||||||||||||||||||||||||||||||||||||||
| (million barrels of oil or billion cubic feet of gas | United | South | Australia/ | South | South | Liquids | ||||||||||||||||||||||||||||||||||
| unless specified otherwise) | States | America | Europe | Africa | Asia | Oceania | Total | America | America | Total | ||||||||||||||||||||||||||||||
Liquids (millions of barrels) |
||||||||||||||||||||||||||||||||||||||||
Revisions |
74 | 10 | 56 | 89 | 19 | 7 | 255 | 89 | 14 | 358 | ||||||||||||||||||||||||||||||
Improved recovery |
4 | – | – | – | – | 1 | 5 | – | – | 5 | ||||||||||||||||||||||||||||||
Extensions/discoveries |
46 | 11 | 4 | 34 | 90 | – | 185 | – | – | 185 | ||||||||||||||||||||||||||||||
Purchases |
374 | – | – | – | 4 | – | 378 | – | – | 378 | ||||||||||||||||||||||||||||||
Sales |
(19 | ) | – | – | (2 | ) | – | – | (21 | ) | – | – | (21 | ) | ||||||||||||||||||||||||||
Total additions |
479 | 21 | 60 | 121 | 113 | 8 | 802 | 89 | 14 | 905 | ||||||||||||||||||||||||||||||
Production |
148 | 30 | 123 | 229 | 266 | 21 | 817 | 42 | 24 | 883 | ||||||||||||||||||||||||||||||
Net change |
331 | (9 | ) | (63 | ) | (108 | ) | (153 | ) | (13 | ) | (15 | ) | 47 | (10 | ) | 22 | |||||||||||||||||||||||
Reserves replacement ratio, excluding sales (percent) |
336 | 70 | 49 | 54 | 42 | 38 | 101 | 212 | 58 | 105 | ||||||||||||||||||||||||||||||
Reserves replacement ratio, including sales (percent) |
324 | 70 | 49 | 53 | 42 | 38 | 98 | 212 | 58 | 102 | ||||||||||||||||||||||||||||||
Natural Gas (billions of cubic feet) |
||||||||||||||||||||||||||||||||||||||||
Revisions |
840 | 123 | (30 | ) | 6 | (102 | ) | 42 | 879 | |||||||||||||||||||||||||||||||
Improved recovery |
– | – | – | – | – | – | – | |||||||||||||||||||||||||||||||||
Extensions/discoveries |
1,861 | 3 | 73 | 25 | 25 | 1 | 1,988 | |||||||||||||||||||||||||||||||||
Purchases |
12,774 | – | 15 | – | – | – | 12,789 | |||||||||||||||||||||||||||||||||
Sales |
(104 | ) | (2 | ) | – | – | – | – | (106 | ) | ||||||||||||||||||||||||||||||
Total additions |
15,371 | 124 | 58 | 31 | (77 | ) | 43 | 15,550 | ||||||||||||||||||||||||||||||||
Production |
1,062 | 234 | 1,443 | 43 | 1,828 | 132 | 4,742 | |||||||||||||||||||||||||||||||||
Net change |
14,309 | (110 | ) | (1,385 | ) | (12 | ) | (1,905 | ) | (89 | ) | 10,808 | ||||||||||||||||||||||||||||
Reserves replacement ratio, excluding sales (percent) |
1,457 | 54 | 4 | 72 | – | 33 | 330 | |||||||||||||||||||||||||||||||||
Reserves replacement ratio, including sales (percent) |
1,447 | 53 | 4 | 72 | – | 33 | 328 | |||||||||||||||||||||||||||||||||
| (1) | See Frequently Used Terms on pages 98 through 101. | |
| (million barrels of oil or billion cubic feet of gas | Average | |||||||||||||||||||||||
| unless specified otherwise) | 2010 | 2009 | 2008 | 2007 | 2006 | 2006–2010 | ||||||||||||||||||
Non-U.S. |
||||||||||||||||||||||||
E&P costs (millions of dollars) |
17,619 | 17,985 | 14,095 | 11,227 | 12,111 | 14,607 | ||||||||||||||||||
Liquids reserves additions |
426 | 375 | 1,933 | 368 | 1,417 | 904 | ||||||||||||||||||
Liquids production |
735 | 731 | 747 | 812 | 827 | 770 | ||||||||||||||||||
Gas reserves additions |
179 | 5,340 | 2,099 | 2,685 | 5,319 | 3,124 | ||||||||||||||||||
Gas production |
3,680 | 3,124 | 3,075 | 3,101 | 3,018 | 3,200 | ||||||||||||||||||
Oil-equivalent reserves additions, excluding sales |
459 | 1,266 | 2,377 | 1,293 | 2,357 | 1,550 | ||||||||||||||||||
Oil-equivalent reserves additions, including sales |
456 | 1,264 | 2,283 | 815 | 2,303 | 1,424 | ||||||||||||||||||
Oil-equivalent production |
1,348 | 1,252 | 1,259 | 1,329 | 1,330 | 1,304 | ||||||||||||||||||
Reserves replacement ratio, excluding sales (percent) |
34 | 101 | 189 | 97 | 177 | 119 | ||||||||||||||||||
Reserves replacement ratio, including sales (percent) |
34 | 101 | 181 | 61 | 173 | 109 | ||||||||||||||||||
Reserves replacement costs(2) (dollars per barrel) |
38.39 | 14.21 | 5.93 | 8.68 | 5.14 | 9.42 | ||||||||||||||||||
United States |
||||||||||||||||||||||||
E&P costs (millions of dollars) |
54,107 | 3,541 | 3,473 | 2,299 | 2,274 | 13,139 | ||||||||||||||||||
Liquids reserves additions |
479 | 140 | (122 | ) | 91 | (102 | ) | 97 | ||||||||||||||||
Liquids production |
148 | 139 | 132 | 141 | 149 | 142 | ||||||||||||||||||
Gas reserves additions |
15,371 | 484 | (845 | ) | 1,767 | (930 | ) | 3,169 | ||||||||||||||||
Gas production |
1,062 | 572 | 562 | 649 | 718 | 713 | ||||||||||||||||||
Oil-equivalent reserves additions, excluding sales |
3,077 | 224 | (257 | ) | 398 | (207 | ) | 647 | ||||||||||||||||
Oil-equivalent reserves additions, including sales |
3,041 | 221 | (263 | ) | 386 | (257 | ) | 626 | ||||||||||||||||
Oil-equivalent production |
325 | 234 | 226 | 249 | 268 | 260 | ||||||||||||||||||
Reserves replacement ratio, excluding sales (percent) |
947 | 96 | – | 160 | – | 248 | ||||||||||||||||||
Reserves replacement ratio, including sales (percent) |
936 | 94 | – | 155 | – | 240 | ||||||||||||||||||
Reserves replacement costs(2) (dollars per barrel) |
17.58 | 15.81 | – | 5.78 | – | 20.31 | ||||||||||||||||||
Worldwide |
||||||||||||||||||||||||
E&P costs (millions of dollars) |
71,726 | 21,526 | 17,568 | 13,526 | 14,385 | 27,746 | ||||||||||||||||||
Liquids reserves additions |
905 | 515 | 1,811 | 459 | 1,315 | 1,001 | ||||||||||||||||||
Liquids production |
883 | 870 | 879 | 953 | 976 | 912 | ||||||||||||||||||
Gas reserves additions |
15,550 | 5,824 | 1,254 | 4,452 | 4,389 | 6,293 | ||||||||||||||||||
Gas production |
4,742 | 3,696 | 3,637 | 3,750 | 3,736 | 3,912 | ||||||||||||||||||
Oil-equivalent reserves additions, excluding sales |
3,536 | 1,490 | 2,120 | 1,691 | 2,150 | 2,197 | ||||||||||||||||||
Oil-equivalent reserves additions, including sales |
3,497 | 1,485 | 2,020 | 1,201 | 2,046 | 2,050 | ||||||||||||||||||
Oil-equivalent production |
1,673 | 1,486 | 1,485 | 1,578 | 1,598 | 1,564 | ||||||||||||||||||
Reserves replacement ratio, excluding sales (percent) |
211 | 100 | 143 | 107 | 135 | 140 | ||||||||||||||||||
Reserves replacement ratio, including sales (percent) |
209 | 100 | 136 | 76 | 128 | 131 | ||||||||||||||||||
Reserves replacement costs(2) (dollars per barrel) |
20.28 | 14.45 | 8.29 | 8.00 | 6.69 | 12.63 | ||||||||||||||||||
| (1) | ExxonMobil reserves using SEC historical price bases; proved reserves as defined by the SEC are based on historical market prices: prior to 2009, the SEC defined price as the market price on December 31; beginning in 2009, the SEC changed the definition to the average of the market prices on the first day of each calendar month during the year. Mining and equity company reserves, production, and costs are included for all periods. See Frequently Used Terms on pages 98 through 101. | |
| (2) | Calculation based on exploration and production costs divided by oil-equivalent reserves additions. All values exclude the impact of asset sales; i.e., reserves sold and proceeds received. |
| Total Revenues and Costs, Including Non-Consolidated Interests and Oil Sands | Revenues and Costs per Unit of Sales or Production(1) | |||||||||||||||||||||||||||||||||||||||||||
| Canada/ | Canada/ | |||||||||||||||||||||||||||||||||||||||||||
| United | South | Australia/ | United | South | Outside | |||||||||||||||||||||||||||||||||||||||
| States | America | Europe | Africa | Asia | Oceania | Total | States | America | Americas | Worldwide | ||||||||||||||||||||||||||||||||||
| 2010 | (millions of dollars) |
(dollars per unit of sales) |
||||||||||||||||||||||||||||||||||||||||||
Revenue |
||||||||||||||||||||||||||||||||||||||||||||
Liquids |
10,567 | 6,343 | 8,935 | 17,511 | 19,118 | 1,418 | 63,892 | 70.98 | 66.27 | 74.67 | 73.12 | |||||||||||||||||||||||||||||||||
Natural gas |
3,716 | 707 | 9,358 | 11 | 7,990 | 401 | 22,183 | 3.92 | 3.41 | 5.42 | 5.00 | |||||||||||||||||||||||||||||||||
| (dollars per barrel of net oil-equivalent production) |
||||||||||||||||||||||||||||||||||||||||||||
Total revenue |
14,283 | 7,050 | 18,293 | 17,522 | 27,108 | 1,819 | 86,075 | 46.53 | 54.18 | 54.59 | 53.04 | |||||||||||||||||||||||||||||||||
Less costs: |
||||||||||||||||||||||||||||||||||||||||||||
Production costs
excluding taxes |
3,275 | 2,612 | 3,011 | 2,215 | 1,628 | 462 | 13,203 | 10.67 | 20.07 | 6.17 | 8.14 | |||||||||||||||||||||||||||||||||
Depreciation and depletion |
3,507 | 1,015 | 2,719 | 2,580 | 1,596 | 219 | 11,636 | 11.43 | 7.80 | 6.00 | 7.17 | |||||||||||||||||||||||||||||||||
Exploration expenses |
287 | 464 | 413 | 587 | 362 | 56 | 2,169 | 0.94 | 3.57 | 1.20 | 1.34 | |||||||||||||||||||||||||||||||||
Taxes other than income |
1,220 | 86 | 2,997 | 1,742 | 5,142 | 204 | 11,391 | 3.96 | 0.67 | 8.49 | 7.02 | |||||||||||||||||||||||||||||||||
Related income tax |
2,093 | 715 | 5,543 | 6,068 | 9,147 | 262 | 23,828 | 6.82 | 5.49 | 17.73 | 14.68 | |||||||||||||||||||||||||||||||||
Results of producing activities |
3,901 | 2,158 | 3,610 | 4,330 | 9,233 | 616 | 23,848 | 12.71 | 16.58 | 15.00 | 14.69 | |||||||||||||||||||||||||||||||||
Other earnings(2) |
379 | (538 | ) | 216 | 96 | (120 | ) | (15 | ) | 18 | 1.23 | (4.13 | ) | 0.15 | 0.02 | |||||||||||||||||||||||||||||
Total
earnings, excluding power and coal |
4,280 | 1,620 | 3,826 | 4,426 | 9,113 | 601 | 23,866 | 13.94 | 12.45 | 15.15 | 14.71 | |||||||||||||||||||||||||||||||||
Power and coal |
(8 | ) | – | – | – | 239 | – | 231 | ||||||||||||||||||||||||||||||||||||
Total earnings |
4,272 | 1,620 | 3,826 | 4,426 | 9,352 | 601 | 24,097 | |||||||||||||||||||||||||||||||||||||
| 2009 | (millions of dollars) |
(dollars per unit of sales) |
||||||||||||||||||||||||||||||||||||||||||
Revenue |
||||||||||||||||||||||||||||||||||||||||||||
Liquids |
7,573 | 5,135 | 7,739 | 14,868 | 12,941 | 1,311 | 49,567 | 54.02 | 51.88 | 58.53 | 57.04 | |||||||||||||||||||||||||||||||||
Natural gas |
1,442 | 748 | 9,080 | 12 | 4,237 | 341 | 15,860 | 3.10 | 3.19 | 5.09 | 4.69 | |||||||||||||||||||||||||||||||||
| (dollars per barrel of net oil-equivalent production) |
||||||||||||||||||||||||||||||||||||||||||||
Total revenue |
9,015 | 5,883 | 16,819 | 14,880 | 17,178 | 1,652 | 65,427 | 41.41 | 43.02 | 46.74 | 45.58 | |||||||||||||||||||||||||||||||||
Less costs: |
||||||||||||||||||||||||||||||||||||||||||||
Production costs
excluding taxes |
2,736 | 2,428 | 2,923 | 2,027 | 1,498 | 386 | 11,998 | 12.57 | 17.75 | 6.32 | 8.36 | |||||||||||||||||||||||||||||||||
Depreciation and depletion |
1,833 | 948 | 2,246 | 2,293 | 1,182 | 195 | 8,697 | 8.42 | 6.93 | 5.47 | 6.06 | |||||||||||||||||||||||||||||||||
Exploration expenses |
220 | 339 | 387 | 662 | 393 | 33 | 2,034 | 1.01 | 2.48 | 1.36 | 1.42 | |||||||||||||||||||||||||||||||||
Taxes other than income |
767 | 78 | 2,826 | 1,343 | 3,111 | 252 | 8,377 | 3.52 | 0.57 | 6.97 | 5.83 | |||||||||||||||||||||||||||||||||
Related income tax |
1,127 | 597 | 5,179 | 4,667 | 5,943 | 237 | 17,750 | 5.18 | 4.37 | 14.83 | 12.37 | |||||||||||||||||||||||||||||||||
Results of producing activities |
2,332 | 1,493 | 3,258 | 3,888 | 5,051 | 549 | 16,571 | 10.71 | 10.92 | 11.79 | 11.54 | |||||||||||||||||||||||||||||||||
Other earnings(2) |
565 | (605 | ) | 325 | 81 | (86 | ) | 36 | 316 | 2.60 | (4.43 | ) | 0.33 | 0.22 | ||||||||||||||||||||||||||||||
Total earnings, excluding
power and coal |
2,897 | 888 | 3,583 | 3,969 | 4,965 | 585 | 16,887 | 13.31 | 6.49 | 12.12 | 11.76 | |||||||||||||||||||||||||||||||||
Power and coal |
(4 | ) | – | – | – | 224 | – | 220 | ||||||||||||||||||||||||||||||||||||
Total earnings |
2,893 | 888 | 3,583 | 3,969 | 5,189 | 585 | 17,107 | |||||||||||||||||||||||||||||||||||||
| (1) | The per-unit data are divided into two sections: (a) revenue per unit of sales from ExxonMobil’s own production; and, (b) operating costs and earnings per unit of net oil-equivalent production. Units for crude oil and natural gas liquids are barrels, while units for natural gas are thousands of cubic feet. The volumes of crude oil and natural gas liquids production and net natural gas production available for sale used in this calculation are shown on pages 62 and 63. The volumes of natural gas were converted to oil-equivalent barrels based on a conversion factor of 6 thousand cubic feet per barrel. | |
| (2) | Includes earnings related to transportation operations, LNG liquefaction and transportation operations, sale of third-party purchases, technical services agreements, other nonoperating activities, and adjustments for minority interests. |
| Total Revenues and Costs, Including Non-Consolidated Interests and Oil Sands | Revenues and Costs per Unit of Sales or Production(1) | |||||||||||||||||||||||||||||||||||||||||||
| Canada/ | Canada/ | |||||||||||||||||||||||||||||||||||||||||||
| United | South | Australia/ | United | South | Outside | |||||||||||||||||||||||||||||||||||||||
| States | America | Europe | Africa | Asia | Oceania | Total | States | America | Americas | Worldwide | ||||||||||||||||||||||||||||||||||
| 2008 | (millions of dollars) |
(dollars per unit of sales) |
||||||||||||||||||||||||||||||||||||||||||
Revenue |
||||||||||||||||||||||||||||||||||||||||||||
Liquids |
11,788 | 8,540 | 13,910 | 20,606 | 20,288 | 2,111 | 77,243 | 87.95 | 81.43 | 91.66 | 89.84 | |||||||||||||||||||||||||||||||||
Natural gas |
3,296 | 1,834 | 15,230 | 39 | 7,005 | 389 | 27,793 | 7.23 | 7.82 | 8.59 | 8.35 | |||||||||||||||||||||||||||||||||
| (dollars per barrel of net oil-equivalent production) |
||||||||||||||||||||||||||||||||||||||||||||
Total revenue |
15,084 | 10,374 | 29,140 | 20,645 | 27,293 | 2,500 | 105,036 | 71.73 | 71.23 | 73.74 | 73.19 | |||||||||||||||||||||||||||||||||
Less costs: |
||||||||||||||||||||||||||||||||||||||||||||
Production costs
excluding taxes |
2,675 | 2,625 | 3,051 | 1,603 | 1,392 | 332 | 11,678 | 12.72 | 18.03 | 5.91 | 8.14 | |||||||||||||||||||||||||||||||||
Depreciation and depletion |
1,427 | 1,043 | 2,662 | 2,471 | 1,231 | 179 | 9,013 | 6.79 | 7.16 | 6.06 | 6.28 | |||||||||||||||||||||||||||||||||
Exploration expenses |
189 | 251 | 183 | 439 | 292 | 109 | 1,463 | 0.90 | 1.72 | 0.95 | 1.02 | |||||||||||||||||||||||||||||||||
Taxes other than income |
2,021 | 81 | 4,248 | 1,815 | 5,457 | 665 | 14,287 | 9.61 | 0.55 | 11.29 | 9.95 | |||||||||||||||||||||||||||||||||
Related income tax |
3,191 | 1,813 | 11,979 | 8,119 | 10,691 | 399 | 36,192 | 15.17 | 12.45 | 28.90 | 25.22 | |||||||||||||||||||||||||||||||||
Results of producing activities |
5,581 | 4,561 | 7,017 | 6,198 | 8,230 | 816 | 32,403 | 26.54 | 31.32 | 20.63 | 22.58 | |||||||||||||||||||||||||||||||||
Other earnings(2) |
687 | (997 | ) | 2,860 | 212 | (45 | ) | 29 | 2,746 | 3.27 | (6.85 | ) | 2.83 | 1.91 | ||||||||||||||||||||||||||||||
Total earnings, excluding
power and coal |
6,268 | 3,564 | 9,877 | 6,410 | 8,185 | 845 | 35,149 | 29.81 | 24.47 | 23.46 | 24.49 | |||||||||||||||||||||||||||||||||
Power and coal |
(25 | ) | – | – | – | 278 | – | 253 | ||||||||||||||||||||||||||||||||||||
Total earnings |
6,243 | 3,564 | 9,877 | 6,410 | 8,463 | 845 | 35,402 | |||||||||||||||||||||||||||||||||||||
| 2007 | (millions of dollars) |
(dollars per unit of sales) |
||||||||||||||||||||||||||||||||||||||||||
Revenue |
||||||||||||||||||||||||||||||||||||||||||||
Liquids |
8,997 | 6,569 | 11,986 | 17,834 | 15,878 | 1,752 | 63,016 | 62.86 | 55.27 | 69.32 | 66.58 | |||||||||||||||||||||||||||||||||
Natural gas |
3,176 | 1,704 | 9,911 | 21 | 4,763 | 400 | 19,975 | 5.93 | 5.77 | 5.82 | 5.83 | |||||||||||||||||||||||||||||||||
| (dollars per barrel of net oil-equivalent production) |
||||||||||||||||||||||||||||||||||||||||||||
Total revenue |
12,173 | 8,273 | 21,897 | 17,855 | 20,641 | 2,152 | 82,991 | 52.42 | 49.40 | 55.55 | 54.40 | |||||||||||||||||||||||||||||||||
Less costs: |
||||||||||||||||||||||||||||||||||||||||||||
Production costs
excluding taxes |
2,275 | 2,206 | 3,243 | 1,180 | 1,163 | 266 | 10,333 | 9.80 | 13.17 | 5.20 | 6.77 | |||||||||||||||||||||||||||||||||
Depreciation and depletion |
1,493 | 1,256 | 2,657 | 2,101 | 1,229 | 172 | 8,908 | 6.43 | 7.50 | 5.47 | 5.85 | |||||||||||||||||||||||||||||||||
Exploration expenses |
282 | 273 | 170 | 470 | 205 | 102 | 1,502 | 1.21 | 1.63 | 0.84 | 0.98 | |||||||||||||||||||||||||||||||||
Taxes other than income |
1,347 | 126 | 2,528 | 1,599 | 3,561 | 570 | 9,731 | 5.80 | 0.75 | 7.33 | 6.38 | |||||||||||||||||||||||||||||||||
Related income tax |
2,429 | 1,190 | 8,190 | 7,263 | 8,140 | 331 | 27,543 | 10.46 | 7.11 | 21.25 | 18.05 | |||||||||||||||||||||||||||||||||
Results of producing activities |
4,347 | 3,222 | 5,109 | 5,242 | 6,343 | 711 | 24,974 | 18.72 | 19.24 | 15.46 | 16.37 | |||||||||||||||||||||||||||||||||
Other earnings(2) |
609 | (504 | ) | 944 | 277 | (13 | ) | (1 | ) | 1,312 | 2.62 | (3.01 | ) | 1.07 | 0.86 | |||||||||||||||||||||||||||||
Total earnings, excluding
power and coal |
4,956 | 2,718 | 6,053 | 5,519 | 6,330 | 710 | 26,286 | 21.34 | 16.23 | 16.53 | 17.23 | |||||||||||||||||||||||||||||||||
Power and coal |
(86 | ) | – | – | – | 297 | – | 211 | ||||||||||||||||||||||||||||||||||||
Total earnings |
4,870 | 2,718 | 6,053 | 5,519 | 6,627 | 710 | 26,497 | |||||||||||||||||||||||||||||||||||||
| 2006 | (millions of dollars) |
(dollars per unit of sales) |
||||||||||||||||||||||||||||||||||||||||||
Revenue |
||||||||||||||||||||||||||||||||||||||||||||
Liquids |
8,417 | 6,405 | 11,069 | 17,253 | 11,965 | 1,631 | 56,740 | 55.63 | 50.42 | 60.90 | 58.70 | |||||||||||||||||||||||||||||||||
Natural gas |
3,689 | 1,984 | 11,333 | – | 3,983 | 280 | 21,269 | 6.22 | 5.81 | 6.31 | 6.24 | |||||||||||||||||||||||||||||||||
| (dollars per barrel of net oil-equivalent production) |
||||||||||||||||||||||||||||||||||||||||||||
Total revenue |
12,106 | 8,389 | 22,402 | 17,253 | 15,948 | 1,911 | 78,009 | 48.41 | 45.07 | 51.80 | 50.44 | |||||||||||||||||||||||||||||||||
Less costs: |
||||||||||||||||||||||||||||||||||||||||||||
Production costs
excluding taxes |
2,367 | 2,075 | 2,669 | 965 | 881 | 244 | 9,201 | 9.46 | 11.15 | 4.29 | 5.95 | |||||||||||||||||||||||||||||||||
Depreciation and depletion |
1,264 | 1,123 | 2,354 | 2,096 | 976 | 144 | 7,957 | 5.06 | 6.03 | 5.02 | 5.14 | |||||||||||||||||||||||||||||||||
Exploration expenses |
247 | 172 | 169 | 330 | 243 | 30 | 1,191 | 0.99 | 0.92 | 0.70 | 0.77 | |||||||||||||||||||||||||||||||||
Taxes other than income |
833 | 146 | 2,885 | 1,612 | 4,688 | 426 | 10,590 | 3.33 | 0.79 | 8.66 | 6.85 | |||||||||||||||||||||||||||||||||
Related income tax |
2,711 | 1,258 | 8,667 | 6,878 | 4,919 | 364 | 24,797 | 10.84 | 6.76 | 18.76 | 16.03 | |||||||||||||||||||||||||||||||||
Results of producing activities |
4,684 | 3,615 | 5,658 | 5,372 | 4,241 | 703 | 24,273 | 18.73 | 19.42 | 14.37 | 15.70 | |||||||||||||||||||||||||||||||||
Other earnings(2) |
503 | 112 | 891 | 122 | 37 | 5 | 1,670 | 2.01 | 0.60 | 0.95 | 1.08 | |||||||||||||||||||||||||||||||||
Total earnings, excluding
power and coal |
5,187 | 3,727 | 6,549 | 5,494 | 4,278 | 708 | 25,943 | 20.74 | 20.02 | 15.32 | 16.78 | |||||||||||||||||||||||||||||||||
Power and coal |
(19 | ) | – | – | – | 306 | – | 287 | ||||||||||||||||||||||||||||||||||||
Total earnings |
5,168 | 3,727 | 6,549 | 5,494 | 4,584 | 708 | 26,230 | |||||||||||||||||||||||||||||||||||||
 |
| Downstream |
|
Maintain best-in-class operations | ||
|
Provide quality, valued products and services to our customers | ||
|
Lead industry in efficiency and effectiveness | ||
|
Capitalize on integration across ExxonMobil businesses | ||
|
Selectively invest for resilient, advantaged returns | ||
|
Maximize value from leading-edge technologies |


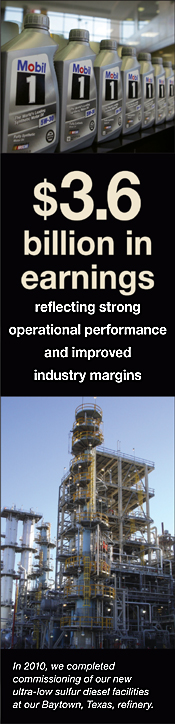
| DOWNSTREAM STATISTICAL RECAP | 2010 | 2009 | 2008 | 2007 | 2006 | |||||||||||||||
Earnings (millions of dollars) |
3,567 | 1,781 | 8,151 | 9,573 | 8,454 | |||||||||||||||
Refinery throughput (thousands of barrels per day) |
5,253 | 5,350 | 5,416 | 5,571 | 5,603 | |||||||||||||||
Petroleum product sales (thousands of barrels per day) |
6,414 | 6,428 | 6,761 | 7,099 | 7,247 | |||||||||||||||
Average capital employed(1) (millions of dollars) |
24,130 | 25,099 | 25,627 | 25,314 | 23,628 | |||||||||||||||
Return on average capital employed(1) (percent) |
14.8 | 7.1 | 31.8 | 37.8 | 35.8 | |||||||||||||||
Capital expenditures (millions of dollars) |
2,505 | 3,196 | 3,529 | 3,303 | 2,729 | |||||||||||||||
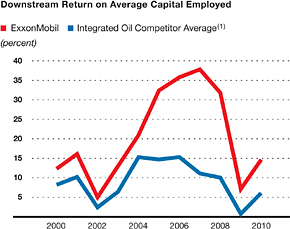
|
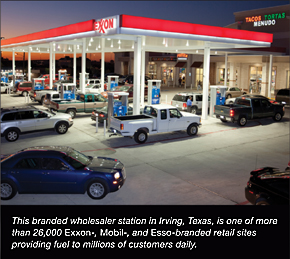 |
|
| (1) Royal Dutch Shell, BP, and Chevron values are estimated on a consistent basis with ExxonMobil, based on public information. |
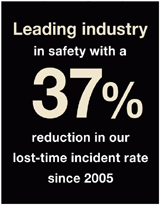
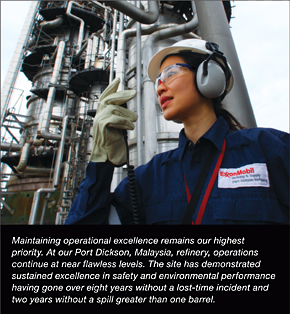 sites. To manage
business risk, our marketing businesses have
robust processes in place to effectively
administer credit exposure. Disciplined
credit practices and sound receivables
management continue to reduce overall
working capital employed, improving
financial returns.
sites. To manage
business risk, our marketing businesses have
robust processes in place to effectively
administer credit exposure. Disciplined
credit practices and sound receivables
management continue to reduce overall
working capital employed, improving
financial returns.
| Refinery interests | 36 | |
| Distillation capacity (barrels per day) | 6.3 million | |
| Lube basestock capacity (barrels per day) | 131 thousand | |
| Branded service stations | ~26,000 | |
| Commercial customers | ~600,000 | |
| Market position | No. 1 supplier of lube basestocks | |
| and synthetic lubricants |

UpClose:
Products with Unique Applications
|
 |
|
|
ExxonMobil
lubricants are used around the world in the most challenging applications
and environments. For example, in 2010, 33 miners in Chile were rescued after being
trapped more than 2000 feet underground for 69 days. The rescue had special

|
||
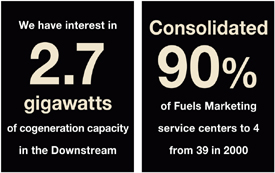
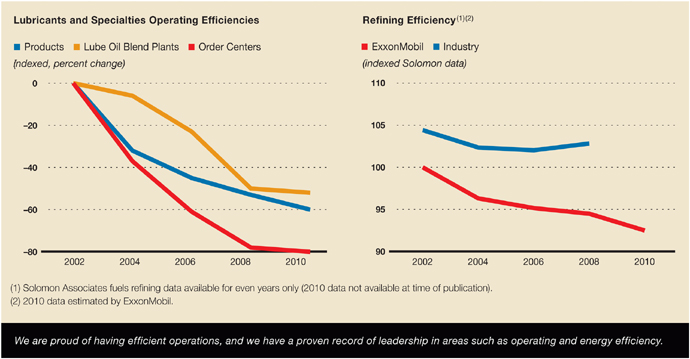
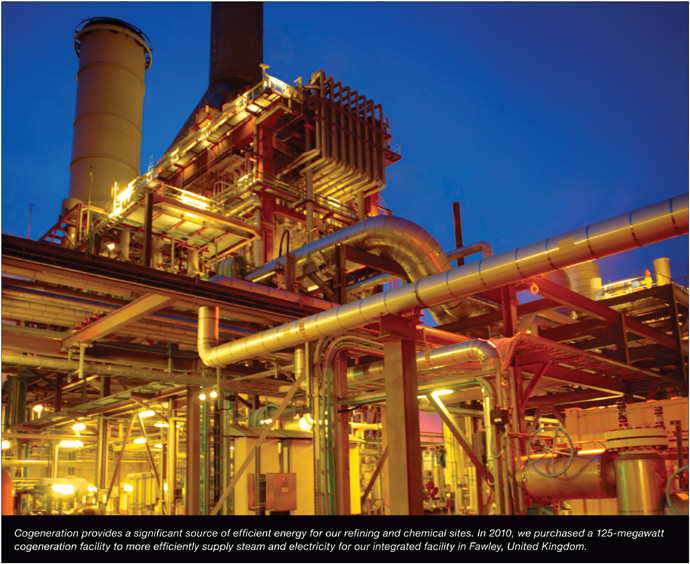
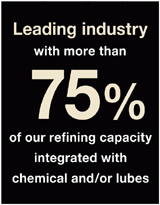
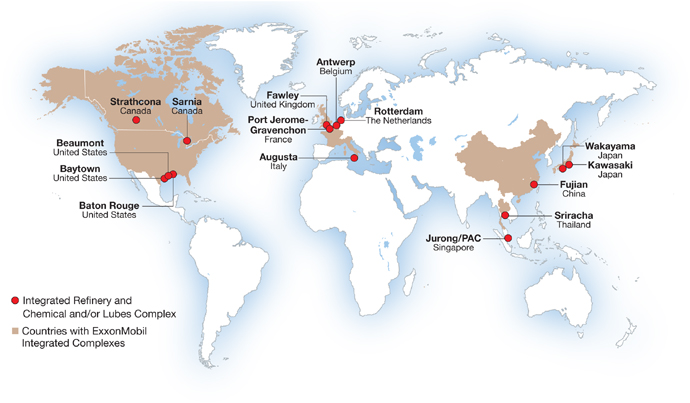
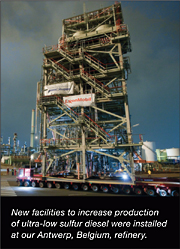
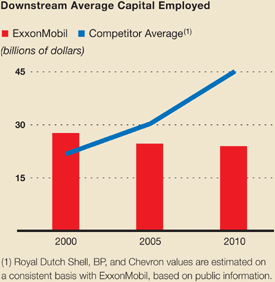
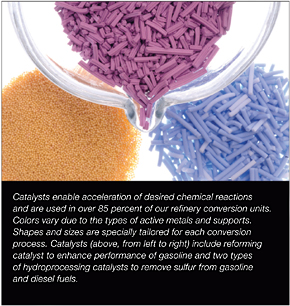
|
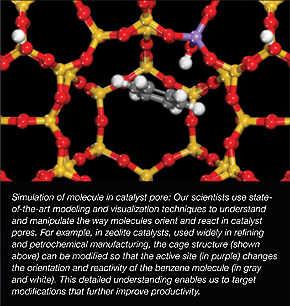 |
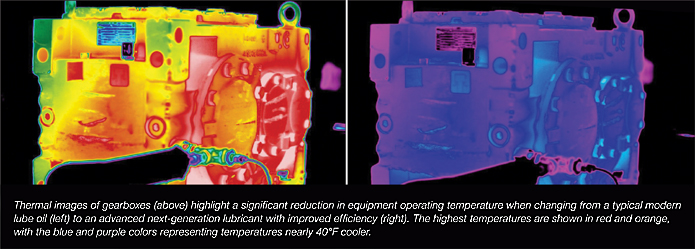
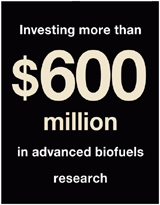
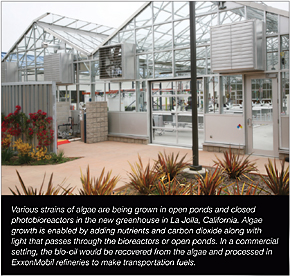
| 2010 | 2009 | 2008 | 2007 | 2006 | |||||||||||||||
Refinery Throughput(2)
(thousands of barrels per day) |
|||||||||||||||||||
United States |
1,753 | 1,767 | 1,702 | 1,746 | 1,760 | ||||||||||||||
Canada |
444 | 413 | 446 | 442 | 442 | ||||||||||||||
Europe |
1,538 | 1,548 | 1,601 | 1,642 | 1,672 | ||||||||||||||
Japan |
536 | 556 | 563 | 618 | 649 | ||||||||||||||
Asia Pacific excluding Japan |
713 | 772 | 789 | 798 | 785 | ||||||||||||||
Middle East/Latin America/Other |
269 | 294 | 315 | 325 | 295 | ||||||||||||||
Total worldwide |
5,253 | 5,350 | 5,416 | 5,571 | 5,603 | ||||||||||||||
Average Refinery Capacity(3)
(thousands of barrels per day) |
|||||||||||||||||||
United States |
1,962 | 1,970 | 1,967 | 1,963 | 1,957 | ||||||||||||||
Canada |
505 | 502 | 502 | 502 | 502 | ||||||||||||||
Europe |
1,744 | 1,742 | 1,740 | 1,759 | 1,817 | ||||||||||||||
Japan |
681 | 680 | 702 | 769 | 769 | ||||||||||||||
Asia Pacific excluding Japan |
1,030 | 1,006 | 992 | 983 | 971 | ||||||||||||||
Middle East/Latin America/Other |
331 | 331 | 330 | 330 | 329 | ||||||||||||||
Total worldwide |
6,253 | 6,231 | 6,233 | 6,306 | 6,345 | ||||||||||||||
Utilization of Refining Capacity
(percent) |
|||||||||||||||||||
United States |
89 | 90 | 87 | 89 | 90 | ||||||||||||||
Canada |
88 | 82 | 89 | 88 | 88 | ||||||||||||||
Europe |
88 | 89 | 92 | 93 | 92 | ||||||||||||||
Japan |
79 | 82 | 80 | 80 | 84 | ||||||||||||||
Asia Pacific excluding Japan |
69 | 77 | 80 | 81 | 81 | ||||||||||||||
Middle East/Latin America/Other |
81 | 89 | 95 | 98 | 90 | ||||||||||||||
Total worldwide |
84 | 86 | 87 | 88 | 88 | ||||||||||||||
| (1) | Excludes ExxonMobil’s interest in the Laffan Refinery in Qatar and ExxonMobil’s minor interests in certain small refineries. | |
| (2) | Refinery throughput includes 100 percent of crude oil and feedstocks sent directly to atmospheric distillation units in operations of ExxonMobil and majority-owned subsidiaries. For companies owned 50 percent or less, throughput includes the greater of either crude and feedstocks processed for ExxonMobil or ExxonMobil’s equity interest in raw material inputs. | |
| (3) | Refinery capacity is the stream-day capability to process inputs to atmospheric distillation units under normal operating conditions, less the impact of shutdowns for regular repair and maintenance activities, averaged over an extended period of time. These annual averages include partial-year impacts for capacity additions or deletions during the year. Any idle capacity that cannot be made operable in a month or less has been excluded. Capacity volumes include 100 percent of the capacity of refinery facilities managed by ExxonMobil or majority-owned subsidiaries. At facilities of companies owned 50 percent or less, the greater of either that portion of capacity normally available to ExxonMobil or ExxonMobil’s equity interest is included. |
| Capacity at 100% | |||||||||||||||||||||||||||||||||||
| ExxonMobil | ExxonMobil | ||||||||||||||||||||||||||||||||||
| Share | Atmospheric | Catalytic | Residuum | Interest | |||||||||||||||||||||||||||||||
| (thousands of barrels per day) | KBD(2) | Distillation | Cracking | Hydrocracking | Conversion(3) | Lubricants(4) | % | ||||||||||||||||||||||||||||
United States |
|||||||||||||||||||||||||||||||||||
Torrance |
California | l | 150 | 150 | 83 | 21 | 50 | 0 | 100 | ||||||||||||||||||||||||||
Joliet |
Illinois | l | 238 | 238 | 94 | 0 | 56 | 0 | 100 | ||||||||||||||||||||||||||
Baton Rouge |
Louisiana | n | l | 504 | 504 | 231 | 25 | 116 | 16 | 100 | |||||||||||||||||||||||||
Chalmette |
Louisiana | l | 5 | 95 | 189 | 72 | 0 | 29 | 0 | 50 | |||||||||||||||||||||||||
Billings |
Montana | l | 60 | 60 | 19 | 6 | 10 | 0 | 100 | ||||||||||||||||||||||||||
Baytown |
Texas | n | l | 561 | 561 | 205 | 26 | 90 | 22 | 100 | |||||||||||||||||||||||||
Beaumont |
Texas | n | l | 345 | 345 | 113 | 60 | 46 | 10 | 100 | |||||||||||||||||||||||||
| Total United States | 1,953 | 2,047 | 817 | 138 | 397 | 48 | |||||||||||||||||||||||||||||
| Capacity at 100% | |||||||||||||||||||||||||||||||||
| ExxonMobil | ExxonMobil | ||||||||||||||||||||||||||||||||
| Share | Atmospheric | Catalytic | Residuum | Interest | |||||||||||||||||||||||||||||
| (thousands of barrels per day) | KBD(2) | Distillation | Cracking | Hydrocracking | Conversion(3) | Lubricants(4) | % | ||||||||||||||||||||||||||
| Canada | |||||||||||||||||||||||||||||||||
Strathcona |
Alberta | 189 | 189 | 63 | 0 | 0 | 2 | 69.6 | |||||||||||||||||||||||||
Dartmouth |
Nova Scotia | 5 | 83 | 83 | 31 | 0 | 0 | 0 | 69.6 | ||||||||||||||||||||||||
Nanticoke |
Ontario | 5 | 113 | 113 | 48 | 0 | 0 | 0 | 69.6 | ||||||||||||||||||||||||
Sarnia |
Ontario | n | l | 121 | 121 | 30 | 18 | 26 | 0 | 69.6 | |||||||||||||||||||||||
| Total Canada | 506 | 506 | 172 | 18 | 26 | 2 | |||||||||||||||||||||||||||
Europe |
|||||||||||||||||||||||||||||||||
Antwerp |
Belgium | n | l | 307 | 307 | 35 | 0 | 0 | 0 | 100 | |||||||||||||||||||||||
Fos-sur-Mer |
France | l | 5 | 119 | 119 | 31 | 0 | 0 | 0 | 82.9 | |||||||||||||||||||||||
Port Jerome-Gravenchon |
France | n | l | 233 | 233 | 39 | 0 | 0 | 13 | 82.9 | |||||||||||||||||||||||
Karlsruhe |
Germany | l | 5 | 78 | 310 | 86 | 0 | 29 | 0 | 25 | |||||||||||||||||||||||
Augusta |
Italy | l | 5 | 198 | 198 | 50 | 0 | 0 | 14 | 100 | |||||||||||||||||||||||
Trecate |
Italy | l | 5 | 174 | 174 | 35 | 0 | 0 | 0 | 74.1 | |||||||||||||||||||||||
Rotterdam |
The Netherlands | n | l | 191 | 191 | 0 | 52 | 41 | 0 | 100 | |||||||||||||||||||||||
Slagen |
Norway | 116 | 116 | 0 | 0 | 32 | 0 | 100 | |||||||||||||||||||||||||
Fawley |
United Kingdom | n | l | 329 | 329 | 89 | 0 | 37 | 9 | 100 | |||||||||||||||||||||||
| Total Europe | 1,745 | 1,977 | 365 | 52 | 139 | 36 | |||||||||||||||||||||||||||
| Japan | |||||||||||||||||||||||||||||||||
Chiba |
Japan | l | 5 | 86 | 172 | 33 | 39 | 0 | 0 | 50 | |||||||||||||||||||||||
Kawasaki |
Japan | n | l | 296 | 296 | 87 | 23 | 0 | 0 | 50.1 | |||||||||||||||||||||||
Sakai |
Japan | l | 5 | 139 | 139 | 40 | 0 | 0 | 0 | 50.1 | |||||||||||||||||||||||
Wakayama |
Japan | l | 5 | 160 | 160 | 37 | 0 | 0 | 7 | 50.1 | |||||||||||||||||||||||
| Total Japan | 681 | 767 | 197 | 62 | 0 | 7 | |||||||||||||||||||||||||||
| Asia Pacific excluding Japan | |||||||||||||||||||||||||||||||||
Altona |
Australia | 5 | 78 | 78 | 28 | 0 | 0 | 0 | 100 | ||||||||||||||||||||||||
Fujian |
China | n | l | 60 | 240 | 38 | 46 | 10 | 0 | 25 | |||||||||||||||||||||||
Port Dickson |
Malaysia | 86 | 86 | 0 | 0 | 0 | 0 | 65 | |||||||||||||||||||||||||
Whangarei |
New Zealand | 27 | 134 | 0 | 31 | 0 | 0 | 19.2 | |||||||||||||||||||||||||
Jurong/PAC |
Singapore | n | l | 605 | 605 | 0 | 36 | 106 | 38 | 100 | |||||||||||||||||||||||
Sriracha |
Thailand | n | l | 174 | 174 | 42 | 0 | 0 | 0 | 66 | |||||||||||||||||||||||
|
Total Asia Pacific
excluding Japan |
1,030 | 1,317 | 108 | 113 | 116 | 38 | |||||||||||||||||||||||||||
| Middle East | |||||||||||||||||||||||||||||||||
Laffan(5) |
Qatar | 14 | 139 | 0 | 0 | 0 | 0 | 10 | |||||||||||||||||||||||||
Yanbu |
Saudi Arabia | 200 | 400 | 91 | 0 | 46 | 0 | 50 | |||||||||||||||||||||||||
| Total Middle East | 214 | 539 | 91 | 0 | 46 | 0 | |||||||||||||||||||||||||||
| Latin America/Other | |||||||||||||||||||||||||||||||||
Campana |
Argentina | l | 5 | 87 | 87 | 27 | 0 | 24 | 0 | 100 | |||||||||||||||||||||||
Acajutla |
El Salvador | 22 | 22 | 0 | 0 | 0 | 0 | 65 | |||||||||||||||||||||||||
Martinique |
Martinique | 2 | 17 | 0 | 0 | 0 | 0 | 14.5 | |||||||||||||||||||||||||
Managua |
Nicaragua | 5 | 20 | 20 | 0 | 0 | 0 | 0 | 100 | ||||||||||||||||||||||||
| Total Latin America/Other | 131 | 146 | 27 | 0 | 24 | 0 | |||||||||||||||||||||||||||
| Total worldwide | 6,260 | 7,299 | 1,777 | 383 | 748 | 131 | |||||||||||||||||||||||||||
| n | Integrated refinery and chemical complex |
| l | Cogeneration capacity |
| 5 | Refineries with some chemical production |
| (1) | Capacity data is based on 100 percent of rated refinery process unit stream-day capacities under normal operating conditions, less the impact of shutdowns for regular repair and maintenance activities, averaged over an extended period of time. |
| (2) | ExxonMobil share reflects 100 percent of atmospheric distillation capacity in operations of ExxonMobil and majority-owned subsidiaries. For companies owned 50 percent or less, ExxonMobil share is the greater of ExxonMobil’s equity interest or that portion of distillation capacity normally available to ExxonMobil. |
| (3) | Includes thermal cracking, visbreaking, coking, and hydrorefining processes. |
| (4) | Lubes capacity based on dewaxed oil production. |
| (5) | Financial results incorporated into Upstream Qatar business. |
| (thousands of barrels per day) | 2010 | 2009 | 2008 | 2007 | 2006 | |||||||||||||||
United States |
||||||||||||||||||||
Motor gasoline, naphthas |
1,445 | 1,425 | 1,449 | 1,601 | 1,598 | |||||||||||||||
Heating oils, kerosene, diesel oils |
480 | 517 | 501 | 470 | 520 | |||||||||||||||
Aviation fuels |
181 | 207 | 224 | 235 | 236 | |||||||||||||||
Heavy fuels |
122 | 106 | 108 | 121 | 81 | |||||||||||||||
Lubricants, specialty, and other petroleum products |
283 | 268 | 258 | 290 | 294 | |||||||||||||||
Total United States |
2,511 | 2,523 | 2,540 | 2,717 | 2,729 | |||||||||||||||
Canada |
||||||||||||||||||||
Motor gasoline, naphthas |
217 | 199 | 203 | 207 | 204 | |||||||||||||||
Heating oils, kerosene, diesel oils |
125 | 119 | 131 | 139 | 143 | |||||||||||||||
Aviation fuels |
27 | 23 | 25 | 25 | 24 | |||||||||||||||
Heavy fuels |
27 | 27 | 30 | 33 | 32 | |||||||||||||||
Lubricants, specialty, and other petroleum products |
54 | 45 | 55 | 57 | 70 | |||||||||||||||
Total Canada |
450 | 413 | 444 | 461 | 473 | |||||||||||||||
Europe |
||||||||||||||||||||
Motor gasoline, naphthas |
423 | 409 | 409 | 414 | 427 | |||||||||||||||
Heating oils, kerosene, diesel oils |
707 | 710 | 730 | 723 | 738 | |||||||||||||||
Aviation fuels |
116 | 127 | 149 | 177 | 188 | |||||||||||||||
Heavy fuels |
179 | 175 | 183 | 220 | 202 | |||||||||||||||
Lubricants, specialty, and other petroleum products |
186 | 204 | 241 | 239 | 258 | |||||||||||||||
Total Europe |
1,611 | 1,625 | 1,712 | 1,773 | 1,813 | |||||||||||||||
Asia Pacific |
||||||||||||||||||||
Motor gasoline, naphthas |
365 | 379 | 378 | 403 | 409 | |||||||||||||||
Heating oils, kerosene, diesel oils |
432 | 455 | 467 | 477 | 493 | |||||||||||||||
Aviation fuels |
95 | 116 | 123 | 111 | 106 | |||||||||||||||
Heavy fuels |
209 | 234 | 238 | 276 | 288 | |||||||||||||||
Lubricants, specialty, and other petroleum products |
140 | 145 | 153 | 152 | 165 | |||||||||||||||
Total Asia Pacific |
1,241 | 1,329 | 1,359 | 1,419 | 1,461 | |||||||||||||||
Latin America |
||||||||||||||||||||
Motor gasoline, naphthas |
80 | 83 | 139 | 151 | 160 | |||||||||||||||
Heating oils, kerosene, diesel oils |
113 | 113 | 161 | 173 | 180 | |||||||||||||||
Aviation fuels |
29 | 28 | 45 | 48 | 48 | |||||||||||||||
Heavy fuels |
34 | 33 | 47 | 48 | 55 | |||||||||||||||
Lubricants, specialty, and other petroleum products |
24 | 22 | 27 | 27 | 26 | |||||||||||||||
Total Latin America |
280 | 279 | 419 | 447 | 469 | |||||||||||||||
Middle East/Africa |
||||||||||||||||||||
Motor gasoline, naphthas |
81 | 78 | 76 | 74 | 68 | |||||||||||||||
Heating oils, kerosene, diesel oils |
94 | 99 | 106 | 112 | 117 | |||||||||||||||
Aviation fuels |
28 | 35 | 41 | 45 | 49 | |||||||||||||||
Heavy fuels |
32 | 23 | 30 | 17 | 24 | |||||||||||||||
Lubricants, specialty, and other petroleum products |
86 | 24 | 34 | 34 | 44 | |||||||||||||||
Total Middle East/Africa |
321 | 259 | 287 | 282 | 302 | |||||||||||||||
Worldwide |
||||||||||||||||||||
Motor gasoline, naphthas |
2,611 | 2,573 | 2,654 | 2,850 | 2,866 | |||||||||||||||
Heating oils, kerosene, diesel oils |
1,951 | 2,013 | 2,096 | 2,094 | 2,191 | |||||||||||||||
Aviation fuels |
476 | 536 | 607 | 641 | 651 | |||||||||||||||
Heavy fuels |
603 | 598 | 636 | 715 | 682 | |||||||||||||||
Lubricants, specialty, and other petroleum products |
773 | 708 | 768 | 799 | 857 | |||||||||||||||
Total worldwide |
6,414 | 6,428 | 6,761 | 7,099 | 7,247 | |||||||||||||||
| (1) | Petroleum product sales include 100 percent of the sales of ExxonMobil and majority-owned subsidiaries, and the ExxonMobil equity interest in sales by companies owned 50 percent or less. |
| (thousands of barrels per day) | 2010 | 2009 | 2008 | 2007 | 2006 | |||||||||||||||
Market and Supply Sales(1) |
||||||||||||||||||||
Market sales |
||||||||||||||||||||
Motor gasoline, naphthas |
1,774 | 1,795 | 1,926 | 2,077 | 2,133 | |||||||||||||||
Heating oils, kerosene, diesel oils |
1,252 | 1,255 | 1,372 | 1,448 | 1,544 | |||||||||||||||
Aviation fuels |
273 | 290 | 365 | 408 | 440 | |||||||||||||||
Heavy fuels |
280 | 289 | 329 | 383 | 396 | |||||||||||||||
Lubricants, specialty, and other petroleum products |
253 | 257 | 283 | 297 | 323 | |||||||||||||||
Total market sales |
3,832 | 3,886 | 4,275 | 4,613 | 4,836 | |||||||||||||||
Total supply sales |
2,582 | 2,542 | 2,486 | 2,486 | 2,411 | |||||||||||||||
Total market and supply sales |
6,414 | 6,428 | 6,761 | 7,099 | 7,247 | |||||||||||||||
| (1) | Market sales are to retail site dealers, consumers (including government and military), jobbers, and small resellers. Supply sales are to large oil marketers, large unbranded resellers, and other oil companies. |
| (number of sites at year end) | 2010 | 2009 | 2008 | 2007 | 2006 | |||||||||||||||
United States |
||||||||||||||||||||
Owned/leased |
1,243 | 1,921 | 2,155 | 2,225 | 2,375 | |||||||||||||||
Distributors/resellers |
8,520 | 8,295 | 8,296 | 8,679 | 8,742 | |||||||||||||||
Total United States |
9,763 | 10,216 | 10,451 | 10,904 | 11,117 | |||||||||||||||
Canada |
||||||||||||||||||||
Owned/leased |
500 | 518 | 557 | 583 | 613 | |||||||||||||||
Distributors/resellers |
1,349 | 1,326 | 1,314 | 1,327 | 1,327 | |||||||||||||||
Total Canada |
1,849 | 1,844 | 1,871 | 1,910 | 1,940 | |||||||||||||||
Europe |
||||||||||||||||||||
Owned/leased |
3,965 | 4,153 | 4,131 | 4,249 | 4,508 | |||||||||||||||
Distributors/resellers |
2,584 | 2,674 | 2,796 | 2,843 | 2,886 | |||||||||||||||
Total Europe |
6,549 | 6,827 | 6,927 | 7,092 | 7,394 | |||||||||||||||
Asia Pacific |
||||||||||||||||||||
Owned/leased |
1,963 | 2,305 | 2,416 | 2,568 | 2,696 | |||||||||||||||
Distributors/resellers |
3,631 | 3,960 | 4,253 | 4,844 | 5,368 | |||||||||||||||
Total Asia Pacific |
5,594 | 6,265 | 6,669 | 7,412 | 8,064 | |||||||||||||||
Latin America |
||||||||||||||||||||
Owned/leased |
567 | 587 | 776 | 1,196 | 1,246 | |||||||||||||||
Distributors/resellers |
1,329 | 1,350 | 1,372 | 2,885 | 3,008 | |||||||||||||||
Total Latin America |
1,896 | 1,937 | 2,148 | 4,081 | 4,254 | |||||||||||||||
Middle East/Africa |
||||||||||||||||||||
Owned/leased |
472 | 481 | 481 | 625 | 713 | |||||||||||||||
Distributors/resellers |
155 | 150 | 127 | 362 | 366 | |||||||||||||||
Total Middle East/Africa |
627 | 631 | 608 | 987 | 1,079 | |||||||||||||||
Worldwide |
||||||||||||||||||||
Owned/leased |
8,710 | 9,965 | 10,516 | 11,446 | 12,151 | |||||||||||||||
Distributors/resellers |
17,568 | 17,755 | 18,158 | 20,940 | 21,697 | |||||||||||||||
Total worldwide |
26,278 | 27,720 | 28,674 | 32,386 | 33,848 | |||||||||||||||
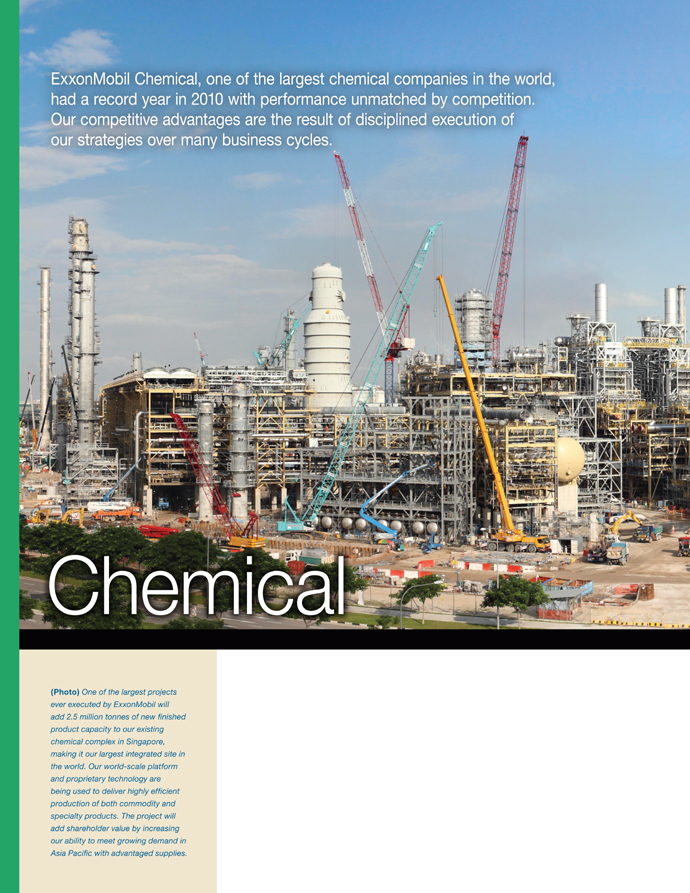 |
| ExxonMobil Chemical, one of the largest chemical companies in the world, had a record year in 2010 with performance unmatched by competition, Our competitive advantages are the result of disciplined execution of our strategies over many business cycles. |
| (Photo) One of the largest projects ever executed by ExxonMobil will add 2.5 million tonnes of new finished product capacity to our existing chemical complex in Singapore, making it our largest integrated site in the world. Our world-scale platform and proprietary technology are being used to deliver highly efficient production of both commodity and specialty products. The project will add shareholder value by increasing our ability to meet growing demand in Asia Pacific with advantaged supplies. |
|
Focus on businesses that capitalize on core competencies | ||
|
Build proprietary technology positions | ||
|
Capture full benefits of integration across ExxonMobil operations | ||
|
Consistently deliver best-in-class performance | ||
|
Selectively invest in advantaged projects |
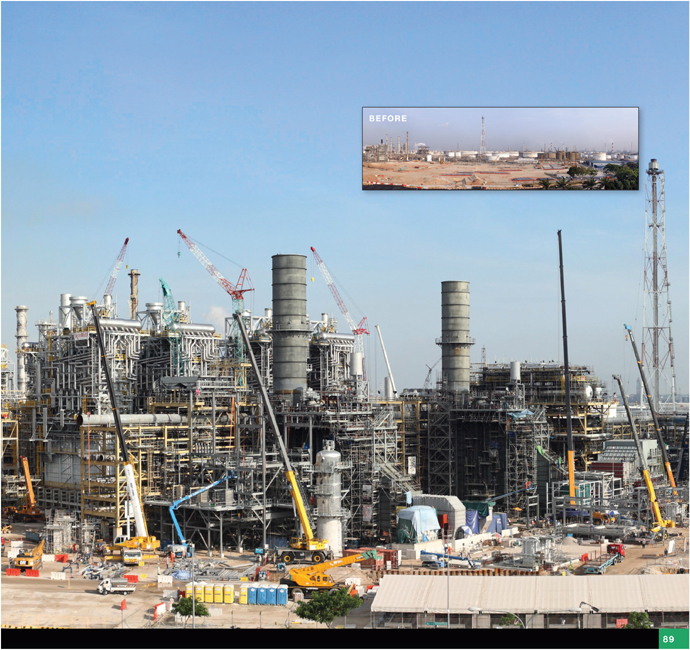


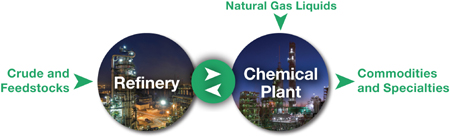
| CHEMICAL STATISTICAL RECAP | 2010 | 2009 | 2008 | 2007 | 2006 | |||||||||||||||
Earnings (millions of dollars) |
4,913 | 2,309 | 2,957 | 4,563 | 4,382 | |||||||||||||||
Prime product sales(1) (thousands of tonnes) |
25,891 | 24,825 | 24,982 | 27,480 | 27,350 | |||||||||||||||
Average capital employed(2) (millions of dollars) |
18,680 | 16,560 | 14,525 | 13,430 | 13,183 | |||||||||||||||
Return on average capital employed(2) (percent) |
26.3 | 13.9 | 20.4 | 34.0 | 33.2 | |||||||||||||||
Capital expenditures (millions of dollars) |
2,215 | 3,148 | 2,819 | 1,782 | 756 | |||||||||||||||
| (1) | Prime product sales include ExxonMobil’s share of equity-company volumes and finished-product transfers to the Downstream. | |
| (2) | See Frequently Used Terms on pages 98 through 101. |
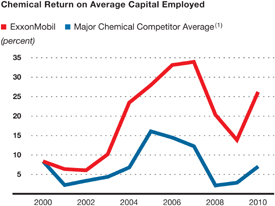
| (1) Competitor values are estimated on a consistent basis with ExxonMobil and based on public information. Chemical segments only: Dow Chemical, Chevron (through 2009), BP (through 2004), Royal Dutch Shell. | ||
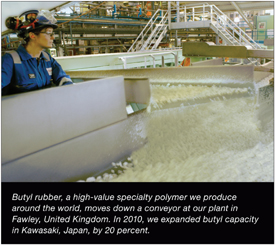
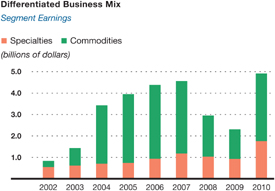
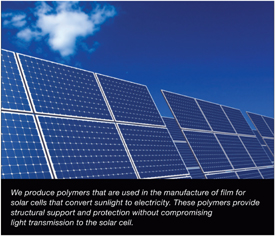

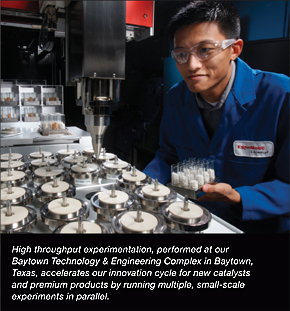

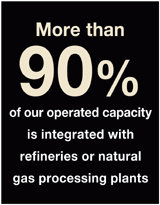
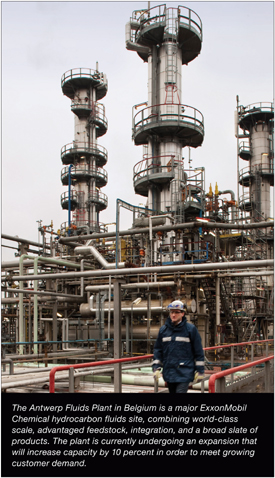
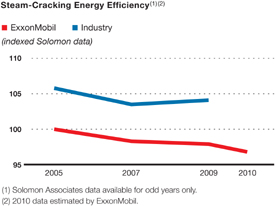
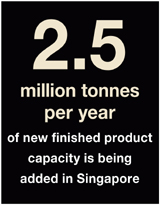
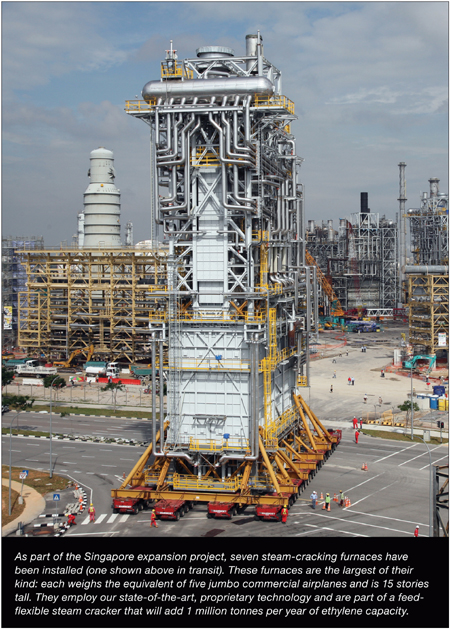
| (millions of tonnes per year) | Ethylene | Polyethylene | Polypropylene | Paraxylene | Additional Products | ||||||||||||||
North America |
|||||||||||||||||||
Baton Rouge, Louisiana |
1.0 | 1.3 | 0.4 | – | P B E A F O | ||||||||||||||
Baytown, Texas |
2.2 | – | 0.8 | 0.6 | P B F | ||||||||||||||
Beaumont, Texas |
0.8 | 1.0 | – | 0.3 | P S | ||||||||||||||
Mont Belvieu, Texas |
– | 1.0 | – | – | |||||||||||||||
Sarnia, Ontario |
0.3 | 0.5 | – | – | P F O | ||||||||||||||
Europe |
|||||||||||||||||||
Antwerp, Belgium |
0.5 | 0.4 | – | – | P F O | ||||||||||||||
Fawley, United Kingdom |
– | – | – | – | B F O | ||||||||||||||
Fife, United Kingdom |
0.4 | – | – | – | |||||||||||||||
Meerhout, Belgium |
– | 0.5 | – | – | |||||||||||||||
Notre-Dame-de- Gravenchon, France |
0.4 | 0.4 | 0.3 | – | P B E A O S Z | ||||||||||||||
Rotterdam, the Netherlands |
– | – | – | 0.7 | O | ||||||||||||||
Middle East |
|||||||||||||||||||
Al Jubail, Saudi Arabia |
0.6 | 0.6 | – | – | |||||||||||||||
Yanbu, Saudi Arabia |
1.0 | 0.7 | 0.2 | – | P | ||||||||||||||
Asia Pacific |
|||||||||||||||||||
Fujian, China |
0.2 | 0.2 | 0.1 | 0.2 | P | ||||||||||||||
Kawasaki, Japan |
0.5 | 0.1 | – | – | P B A F | ||||||||||||||
Singapore |
0.9 | 0.6 | 0.4 | 0.9 | P F O Z | ||||||||||||||
Sriracha, Thailand |
– | – | – | 0.5 | F | ||||||||||||||
All other |
– | – | – | 0.6 | |||||||||||||||
Total worldwide |
8.8 | 7.3 | 2.2 | 3.8 | |||||||||||||||
| (1) | Based on size or breadth of product slate. | |
| (2) | Capacity reflects 100 percent for operations of ExxonMobil and majority-owned subsidiaries. For companies owned 50 percent or less, capacity is ExxonMobil’s interest. |
| Location | Product | ||
| North America | |||
| Bayway, New Jersey | 5 | l | |
| Belleville, Ontario | u | ||
| Chalmette, Louisiana | n | ||
| Dartmouth, Nova Scotia | l | ||
| Edison, New Jersey | l | ||
| LaGrange, Georgia | u | ||
| Pensacola, Florida | 5 | ||
| Plaquemine, Louisiana | 5 | ||
| Shawnee, Oklahoma | u | ||
| Latin America | |||
| Campana, Argentina | n | l | |
| Managua, Nicaragua | l | ||
| Paulinia, Brazil | l | ||
| Rio de Janeiro, Brazil | l | ||
| Location | Product | ||
| Europe | |||
| Augusta, Italy | n | ||
| Berre, France | l | ||
| Brindisi, Italy | u | ||
| Cologne, Germany | 5 | l | |
| Fos-sur-Mer, France | n | ||
| Geleen, the Netherlands | 5 | ||
| Karlsruhe, Germany | n | ||
| Kerkrade, the Netherlands | u | ||
| Newport, United Kingdom | 5 | ||
| Trecate, Italy | l | ||
| Vado Ligure, Italy | l | ||
| Virton, Belgium | u | ||
| Location | Product | ||||
| Asia Pacific | |||||
| Adelaide, Australia(2) | l | ||||
| Altona, Australia | n | ||||
| Gumi, South Korea | u | ||||
| Jinshan, China | 5 | ||||
| Chiba, Japan | n | ||||
| Kashima, Japan | 5 | ||||
| Nasu, Japan | u | ||||
| Panyu, China | l | ||||
| Sakai, Japan | n | l | |||
| Wakayama, Japan | n | ||||
| (1) | Includes joint-venture plants. | |
| (2) | Facility mothballed. |
| Includes ExxonMobil’s share of equity companies | 2010 | 2009 | 2008 | 2007 | 2006 | |||||||||||||||
| Worldwide Production Volumes (thousands of tonnes) | ||||||||||||||||||||
Ethylene |
7,973 | 7,381 | 7,540 | 8,155 | 7,878 | |||||||||||||||
Polyethylene |
6,506 | 6,120 | 6,088 | 6,693 | 6,275 | |||||||||||||||
Polypropylene |
1,945 | 1,864 | 1,897 | 1,897 | 1,815 | |||||||||||||||
Paraxylene |
2,808 | 2,758 | 2,472 | 2,995 | 3,038 | |||||||||||||||
| Prime Product Sales Volumes(1) by Region (thousands of tonnes) | ||||||||||||||||||||
Americas(2) |
10,826 | 10,665 | 10,628 | 12,034 | 11,907 | |||||||||||||||
Europe/Middle East/Africa |
6,654 | 6,433 | 6,635 | 7,463 | 7,497 | |||||||||||||||
Asia Pacific |
8,411 | 7,727 | 7,719 | 7,983 | 7,946 | |||||||||||||||
Total worldwide |
25,891 | 24,825 | 24,982 | 27,480 | 27,350 | |||||||||||||||
| Prime Product Sales Volumes(1) by Business (thousands of tonnes) | ||||||||||||||||||||
Less-cyclical specialty businesses |
5,586 | 5,183 | 5,618 | 6,237 | 6,228 | |||||||||||||||
Olefins/polyolefins/aromatics/other |
20,305 | 19,642 | 19,364 | 21,243 | 21,122 | |||||||||||||||
Total |
25,891 | 24,825 | 24,982 | 27,480 | 27,350 | |||||||||||||||
| (1) | Prime product sales include ExxonMobil’s share of equity-company volumes and finished product transfers to the Downstream. | |
| (2) | Includes North America and Latin America. |
2010 Prime Product Sales Volumes
|
2010 Average Capital Employed | |
(percent, thousands of tonnes)
|
(percent, millions of dollars) | |
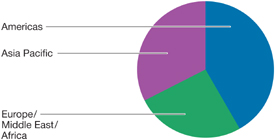
|
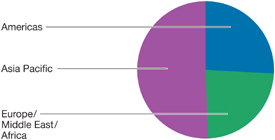 |
| Worldwide Rank | Worldwide Rank | |||||
| Businesses | Based on Market Position | Based on Market Position | ||||
Commodities
|
Specialties | |||||
Benzene
|
#2 | Butyl Polymers | #1 | |||
Paraxylene
|
#2 | Fluids | #1 | |||
Olefins
|
#2 | Plasticizers/Oxo Alcohols | #1 | |||
Polyethylene
|
#2 | Synthetics | #1 | |||
Polypropylene
|
#4 | Oriented Polypropylene Films | #1 | |||
| Adhesive Polymers | #1 | |||||
| Specialty Elastomers | #1 | |||||
| Petroleum Additives | #2 | |||||
| (millions of dollars) | 2010 | 2009 | 2008 | 2007 | 2006 | |||||||||||||||
Reconciliation of Operating Costs |
||||||||||||||||||||
From ExxonMobil’s Consolidated Statement of Income |
||||||||||||||||||||
Total costs and other deductions |
330,262 | 275,809 | 393,962 | 333,073 | 309,182 | |||||||||||||||
Less: |
||||||||||||||||||||
Crude oil and product purchases |
197,959 | 152,806 | 249,454 | 199,498 | 182,546 | |||||||||||||||
Interest expense |
259 | 548 | 673 | 400 | 654 | |||||||||||||||
Sales-based taxes |
28,547 | 25,936 | 34,508 | 31,728 | 30,381 | |||||||||||||||
Other taxes and duties |
36,118 | 34,819 | 41,719 | 40,953 | 39,203 | |||||||||||||||
Subtotal |
67,379 | 61,700 | 67,608 | 60,494 | 56,398 | |||||||||||||||
ExxonMobil’s share of equity-company expenses |
9,049 | 6,670 | 7,204 | 5,619 | 4,947 | |||||||||||||||
Total operating costs |
76,428 | 68,370 | 74,812 | 66,113 | 61,345 | |||||||||||||||
| (millions of dollars) | 2010 | 2009 | 2008 | 2007 | 2006 | |||||||||||||||
Components of Operating Costs |
||||||||||||||||||||
From ExxonMobil’s Consolidated Statement of Income |
||||||||||||||||||||
Production and manufacturing expenses |
35,792 | 33,027 | 37,905 | 31,885 | 29,528 | |||||||||||||||
Selling, general, and administrative expenses |
14,683 | 14,735 | 15,873 | 14,890 | 14,273 | |||||||||||||||
Depreciation and depletion |
14,760 | 11,917 | 12,379 | 12,250 | 11,416 | |||||||||||||||
Exploration expenses, including dry holes |
2,144 | 2,021 | 1,451 | 1,469 | 1,181 | |||||||||||||||
Subtotal |
67,379 | 61,700 | 67,608 | 60,494 | 56,398 | |||||||||||||||
ExxonMobil’s share of equity-company expenses |
9,049 | 6,670 | 7,204 | 5,619 | 4,947 | |||||||||||||||
Total operating costs |
76,428 | 68,370 | 74,812 | 66,113 | 61,345 | |||||||||||||||
| (millions of dollars) | 2010 | 2009 | 2008 | 2007 | 2006 | |||||||||||||||
Business Uses: Asset and Liability Perspective |
||||||||||||||||||||
Total assets |
302,510 | 233,323 | 228,052 | 242,082 | 219,015 | |||||||||||||||
Less liabilities and noncontrolling interests
share of assets and liabilities |
||||||||||||||||||||
Total current liabilities excluding notes and loans payable |
(59,846 | ) | (49,585 | ) | (46,700 | ) | (55,929 | ) | (47,115 | ) | ||||||||||
Total long-term liabilities excluding long-term debt |
(74,971 | ) | (58,741 | ) | (54,404 | ) | (50,543 | ) | (45,905 | ) | ||||||||||
Noncontrolling interests share of assets and liabilities |
(6,532 | ) | (5,642 | ) | (6,044 | ) | (5,332 | ) | (4,948 | ) | ||||||||||
Add ExxonMobil share of debt-financed equity-company net assets |
4,875 | 5,043 | 4,798 | 3,386 | 2,808 | |||||||||||||||
Total capital employed |
166,036 | 124,398 | 125,702 | 133,664 | 123,855 | |||||||||||||||
Total Corporate Sources: Debt and Equity Perspective |
||||||||||||||||||||
Notes and loans payable |
2,787 | 2,476 | 2,400 | 2,383 | 1,702 | |||||||||||||||
Long-term debt |
12,227 | 7,129 | 7,025 | 7,183 | 6,645 | |||||||||||||||
ExxonMobil share of equity |
146,839 | 110,569 | 112,965 | 121,762 | 113,844 | |||||||||||||||
Less noncontrolling interests share of total debt |
(692 | ) | (819 | ) | (1,486 | ) | (1,050 | ) | (1,144 | ) | ||||||||||
Add ExxonMobil share of equity-company debt |
4,875 | 5,043 | 4,798 | 3,386 | 2,808 | |||||||||||||||
Total capital employed |
166,036 | 124,398 | 125,702 | 133,664 | 123,855 | |||||||||||||||
| (millions of dollars) | 2010 | 2009 | 2008 | 2007 | 2006 | |||||||||||||||
Return on Average Capital Employed |
||||||||||||||||||||
Net income attributable to ExxonMobil |
30,460 | 19,280 | 45,220 | 40,610 | 39,500 | |||||||||||||||
Financing costs (after tax) |
||||||||||||||||||||
Gross third-party debt |
(803 | ) | (303 | ) | (343 | ) | (339 | ) | (264 | ) | ||||||||||
ExxonMobil share of equity companies |
(333 | ) | (285 | ) | (325 | ) | (204 | ) | (156 | ) | ||||||||||
All other financing costs – net |
35 | (483 | ) | 1,485 | 268 | 499 | ||||||||||||||
Total financing costs |
(1,101 | ) | (1,071 | ) | 817 | (275 | ) | 79 | ||||||||||||
Earnings excluding financing costs |
31,561 | 20,351 | 44,403 | 40,885 | 39,421 | |||||||||||||||
Average capital employed |
145,217 | 125,050 | 129,683 | 128,760 | 122,573 | |||||||||||||||
Return on average capital employed – corporate total
|
21.7% | 16.3% | 34.2% | 31.8% | 32.2% | |||||||||||||||
| 2010 | 2009 | 2008 | 2007 | 2006 | ||||||||||||||||
Exploration portion of Upstream capital and exploration expenditures
(millions of dollars) |
4,121 | 3,718 | 2,871 | 1,909 | 2,044 | |||||||||||||||
Exploration resource additions
(millions of oil-equivalent barrels) |
4,725 | 2,860 | 2,230 | 1,995 | 2,855 | |||||||||||||||
Exploration
resource addition cost per oil-equivalent barrel (dollars) |
0.87 | 1.30 | 1.29 | 0.96 | 0.72 | |||||||||||||||
| (millions of dollars) | 2010 | 2009 | 2008 | 2007 | 2006 | |||||||||||||||
Costs incurred |
||||||||||||||||||||
Property acquisition costs |
45,461 | 1,285 | 663 | 194 | 597 | |||||||||||||||
Exploration costs |
3,055 | 3,111 | 2,272 | 1,762 | 1,685 | |||||||||||||||
Development costs |
23,210 | 17,130 | 14,633 | 11,570 | 12,103 | |||||||||||||||
Total costs incurred |
71,726 | 21,526 | 17,568 | 13,526 | 14,385 | |||||||||||||||
| (millions of barrels) | 2010 | 2009 | 2008 | 2007 | 2006 | |||||||||||||||
Proved oil-equivalent reserves additions |
||||||||||||||||||||
Revisions |
505 | 383 | 690 | 1,405 | 687 | |||||||||||||||
Improved recovery |
5 | 15 | 7 | 36 | 29 | |||||||||||||||
Extensions/discoveries |
516 | 1,091 | 1,423 | 248 | 679 | |||||||||||||||
Purchases |
2,510 | 1 | – | 2 | 755 | |||||||||||||||
Total oil-equivalent reserves additions |
3,536 | 1,490 | 2,120 | 1,691 | 2,150 | |||||||||||||||
Proved reserves replacement costs (dollars per barrel) |
20.28 | 14.45 | 8.29 | 8.00 | 6.69 | |||||||||||||||
| (millions of dollars) | 2010 | 2009 | 2008 | 2007 | 2006 | |||||||||||||||
Net cash provided by operating activities |
48,413 | 28,438 | 59,725 | 52,002 | 49,286 | |||||||||||||||
Sales of subsidiaries, investments and
property, plant and equipment |
3,261 | 1,545 | 5,985 | 4,204 | 3,080 | |||||||||||||||
Cash flow from operations and asset sales |
51,674 | 29,983 | 65,710 | 56,206 | 52,366 | |||||||||||||||
| (millions of dollars) | 2010 | 2009 | 2008 | 2007 | 2006 | |||||||||||||||
Dividends paid to ExxonMobil shareholders |
8,498 | 8,023 | 8,058 | 7,621 | 7,628 | |||||||||||||||
Cost of shares purchased to reduce
shares outstanding |
11,200 | 18,000 | 32,000 | 28,000 | 25,000 | |||||||||||||||
Distributions to ExxonMobil shareholders |
19,698 | 26,023 | 40,058 | 35,621 | 32,628 | |||||||||||||||
Memo: Gross cost of shares purchased to
offset shares issued under benefit plans and programs |
1,893 | 1,703 | 3,734 | 3,822 | 4,558 | |||||||||||||||
Acreage |
28, 29, 64 | |||
Africa |
29, 33, 37, 52-55 | |||
| Asia Pacific 29, 35, 36, 37, 56-60, 88, 90, 95 | ||||
Australia/Oceania |
29, 33, 35, 37, 60-61 | |||
Balance Sheet |
21 | |||
Business strategies |
2-3, 24, 72, 88 | |||
| Canada 29, 30, 31, 33, 35, 37, 45-47 | ||||
Capital and exploration expenditures |
18-19, 99 | |||
Capital employed |
17, 81, 99 | |||
Cash flow |
15, 23, 101 | |||
Cash Flow Statement |
23 | |||
Chemical capacity |
96 | |||
Chemical products |
93, 97 | |||
Chemical projects |
95 | |||
Chemical results |
90-91 | |||
Chemical volumes |
97 | |||
Depreciation and depletion |
20, 70-71 | |||
Dividend and shareholder distributions |
14 | |||
Downstream results |
74-75 | |||
Earnings |
5, 15, 16, 70-71 | |||
Earnings, oil and gas |
70-71 | |||
Earnings per barrel |
27, 32 | |||
Energy management |
11, 32, 79 | |||
Energy Outlook |
6-9 | |||
Entitlement volumes |
33, 100 | |||
| Europe 29, 35, 37, 48-51, 81 | ||||
Exploration captures |
29 | |||
Exploration resource addition cost |
27, 30, 31, 100 | |||
Financial highlights |
4, 5 | |||
Frequently Used Terms |
98-101 | |||
| Fuels Marketing 74, 76, 77, 78, 80, 81 | ||||
Heavy oil and oil sands |
31, 39, 46, 100 | |||
Income Statement |
22 | |||
| Integration 3, 25, 73, 80, 89, 90, 94 | ||||
Key financial ratios |
4 | |||
| LNG 9, 26, 35, 36, 43, 48, 49, 50, 52, 56-57, 59, 60-61 | ||||
| Lubricants and Specialties 74, 76, 77, 78, 79, 81 | ||||
Marine well containment |
43 | |||
| Middle East 35, 36, 37, 56-57, 58-59, 90 | ||||
Molecule Management |
12, 73, 77 | |||
Natural gas and power markets |
35 | |||
| Operating costs 20, 22, 78, 94, 98 | ||||
| Operations Integrity Management System 10, 32, 76, 94 | ||||
Petroleum product sales |
15, 74, 86 | |||
Price and spend impacts |
100 | |||
Project execution |
3, 34 | |||
| Production sharing contract 33, 54, 59, 60, 100 | ||||
| Production volumes 26, 33, 62, 63, 100 | ||||
Property, plant and equipment |
20, 99, 101 | |||
| Qatar 26, 33, 35, 36, 37, 43, 56-57 | ||||
Refinery utilization |
84 | |||
Refining and Supply |
74, 75, 76-83 | |||
Refining capacity |
84-85 | |||
| Reserves and resources 26, 27, 28, 30, 31, 66-69 | ||||
Reserves replacement costs |
69, 101 | |||
| Reserves replacement ratio 26, 31, 67, 68, 69, 100 | ||||
Retail sites |
76, 81, 87 | |||
| Return on average capital employed 5, 17, 27, 75, 91, 99 | ||||
| Russia/Caspian 31, 35, 36, 37, 58-59 | ||||
Safety, Security, Health & Environment |
10-11 | |||
Share purchases |
14, 101 | |||
Shareholder return |
5, 14, 98 | |||
South America |
47 | |||
| Technology 12, 38-41, 82-83, 93 | ||||
| Unconventional gas 35, 43, 44, 48, 50 | ||||
| United States 9, 26, 29, 33, 35, 36, 37, 42-45, 81, 83 | ||||
Upstream development project summary |
36-37 | |||
Upstream production profile |
33, 37 | |||
Upstream results |
26-27 | |||
Wells, net drilled |
64 | |||
| XTO Energy Inc. 5, 26, 29, 30, 31, 33, 35, 42, 100 | ||||
Data Tables |
||||
Corporate Financial Tables |
||||
Capital and Exploration Expenditures |
18-19 | |||
Capital Employed/ROCE |
17 | |||
Financial Statements |
21-23 | |||
Functional Earnings |
16 | |||
Business Tables |
||||
Upstream |
62-71 | |||
Downstream |
84-87 | |||
Chemical |
96-97 | |||


 |