
CONTENTS |
||||
| 2 | ||||
| 6 | ||||
| 10 | ||||
| 14 | ||||
| 30 | ||||
| 76 | ||||
| 92 | ||||
| 100 | ||||
| 104 | ||||
| 105 |
EXXON MOBIL CORPORATION • 2009 FINANCIAL & OPERATING REVIEW 1
 |
This evolution of energy and technology is not new.
Our energy landscape has
transformed repeatedly over the past 150 years, as new technologies change not just how
consumers use energy, but also the types of energy they use. It is important to remember, however,
that these shifts happen gradually, over the course of decades.
|
|
|
Looking forward we see a dual challenge.
Providing energy to meet growing needs while protecting the environment requires an integrated set of solutions. |
||
|
We believe the most effective way to address these intertwined challenges over the long term is to
seek integrated solutions focused on expanding supplies, increasing efficiency, and mitigating
emissions. Looking to the future, ExxonMobil realizes the scale of this global challenge is
enormous, but so, too, is our commitment to succeed and our capacity to innovate. We are confident
that by pursuing these integrated solutions, the world can achieve greater energy security,
environmental progress, and economic prosperity.
|
||
 Rex W. Tillerson, Chairman and CEO
|
||

|
2
| FINANCIAL HIGHLIGHTS | 2009 | 2008 | 2007 | 2006 | 2005 | |||||||||||||||
(millions of dollars, unless noted) |
||||||||||||||||||||
Sales and other operating revenue(1)(2) |
301,500 | 459,579 | 390,328 | 365,467 | 358,955 | |||||||||||||||
Net income attributable to ExxonMobil |
19,280 | 45,220 | 40,610 | 39,500 | 36,130 | |||||||||||||||
Cash flow from operations and asset sales(3) |
29,983 | 65,710 | 56,206 | 52,366 | 54,174 | |||||||||||||||
Capital and exploration expenditures(3) |
27,092 | 26,143 | 20,853 | 19,855 | 17,699 | |||||||||||||||
Cash dividends to ExxonMobil shareholders |
8,023 | 8,058 | 7,621 | 7,628 | 7,185 | |||||||||||||||
Common stock purchases (gross) |
19,703 | 35,734 | 31,822 | 29,558 | 18,221 | |||||||||||||||
Research and development costs |
1,050 | 847 | 814 | 733 | 712 | |||||||||||||||
Cash and cash equivalents at year end(4) |
10,693 | 31,437 | 33,981 | 28,244 | 28,671 | |||||||||||||||
Total assets at year end |
233,323 | 228,052 | 242,082 | 219,015 | 208,335 | |||||||||||||||
Total debt at year end |
9,605 | 9,425 | 9,566 | 8,347 | 7,991 | |||||||||||||||
ExxonMobil share of equity at year end |
110,569 | 112,965 | 121,762 | 113,844 | 111,186 | |||||||||||||||
Average capital employed(3) |
125,050 | 129,683 | 128,760 | 122,573 | 116,961 | |||||||||||||||
Share price at year end (dollars) |
68.19 | 79.83 | 93.69 | 76.63 | 56.17 | |||||||||||||||
Market valuation at year end |
322,329 | 397,239 | 504,220 | 438,990 | 344,491 | |||||||||||||||
Regular employees at year end (thousands) |
80.7 | 79.9 | 80.8 | 82.1 | 83.7 | |||||||||||||||
| KEY FINANCIAL RATIOS | 2009 | 2008 | 2007 | 2006 | 2005 | |||||||||||||||
Earnings per common share(5) (dollars) |
3.99 | 8.70 | 7.31 | 6.64 | 5.74 | |||||||||||||||
Earnings per common share – assuming dilution(5) (dollars) |
3.98 | 8.66 | 7.26 | 6.60 | 5.70 | |||||||||||||||
Return on average capital employed(3) (percent) |
16.3 | 34.2 | 31.8 | 32.2 | 31.3 | |||||||||||||||
Earnings to average ExxonMobil share of equity (percent) |
17.3 | 38.5 | 34.5 | 35.1 | 33.9 | |||||||||||||||
Debt to capital(6) (percent) |
7.7 | 7.4 | 7.1 | 6.6 | 6.5 | |||||||||||||||
Net debt to capital(7) (percent) |
(1.0 | ) | (23.0 | ) | (24.0 | ) | (20.4 | ) | (22.0 | ) | ||||||||||
Ratio of current assets to current liabilities (times) |
1.06 | 1.47 | 1.47 | 1.55 | 1.58 | |||||||||||||||
Fixed charge coverage (times) |
26.1 | 52.2 | 49.9 | 46.3 | 50.2 | |||||||||||||||
| (1) | Sales and other operating revenue includes sales-based taxes of $25,936 million for 2009, $34,508 million for 2008, $31,728 million for 2007, $30,381 million for 2006, and $30,742 million for 2005. | |
| (2) | Sales and other operating revenue includes $30,810 million for 2005 for purchases/sales contracts with the same counterparty. Associated costs were included in crude oil and product purchases. Effective January 1, 2006, these purchases/sales were recorded on a net basis with no resulting impact on net income. | |
| (3) | See Frequently Used Terms on pages 100 through 103. | |
| (4) | Excluding restricted cash of $4,604 million in 2006 and 2005. | |
| (5) | Consistent with 2009 reporting, the calculation of prior period earnings per share has been updated to include unvested share-based payment awards that contain nonforfeitable dividend rights. | |
| (6) | Debt includes short- and long-term debt. Capital includes short- and long-term debt and total equity. | |
| (7) | Debt net of cash and cash equivalents, excluding restricted cash. |

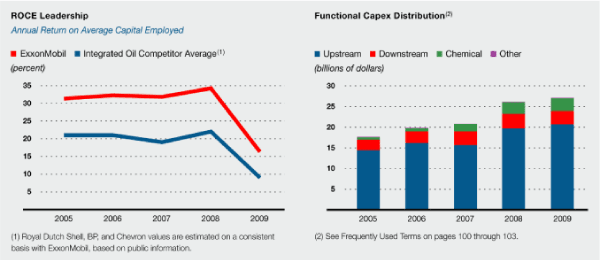
| (1) | Net income attributable to ExxonMobil. | |
| (2) | Reflects data through December 31, 2009. | |
| (3) | Royal Dutch Shell, BP, and Chevron values are calculated on a consistent basis with ExxonMobil, based on public information. |
 |
EXXON MOBIL CORPORATION • 2009 FINANCIAL & OPERATING REVIEW 3
| • | Record performance in workforce safety that continues to lead industry. | |
| • | Strong earnings of $19.3 billion in a challenging business environment. | |
| • | Annual dividend per share growth of 7 percent versus 2008, the 27th consecutive year of dividend per share increases. | |
| • | Total shareholder distributions of $26 billion. | |
| • | Industry-leading return on average capital employed of 16 percent. | |
| • | Start-up of eight major Upstream projects. | |
| • | Total net production of liquids and natural gas available for sale of 3.9 million oil-equivalent barrels per day. | |
| • | Proved oil and gas reserve additions of 2.0 billion oil-equivalent barrels, replacing 134 percent of production excluding asset sales and determined on ExxonMobil’s basis. | |
| • | Start-up of a world-scale, fully integrated refining and petrochemical complex in Fujian Province, China. |
 |
4 EXXON MOBIL CORPORATION • 2009 FINANCIAL & OPERATING REVIEW
 |
EXXON MOBIL CORPORATION • 2009 FINANCIAL & OPERATING REVIEW 5
 |
6 EXXON MOBIL CORPORATION • 2009 FINANCIAL & OPERATING REVIEW
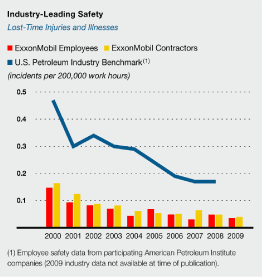
| • | Record performance in workforce safety | |
| • | Reduced Upstream hydrocarbon flaring by more than 20 percent |
|
| • | Zero spills greater than a barrel from company-operated marine vessels |
|
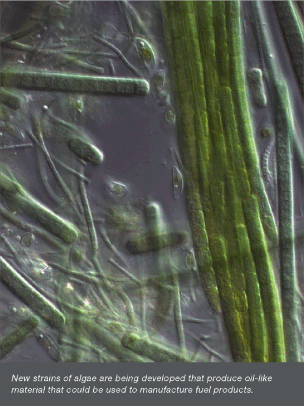
| • | Expanded research in advanced biofuels |
| • | Reinforce our belief that all safety, health, and environmental incidents are preventable; and, | |
| • | Promote and maintain a work environment in which each of us accepts personal responsibility for our own safety and that of our colleagues, and in which everyone actively intervenes to ensure the safety, security, and wellness of others. |
 |
EXXON MOBIL CORPORATION • 2009 FINANCIAL & OPERATING REVIEW 7
 |
8 EXXON MOBIL CORPORATION • 2009 FINANCIAL & OPERATING REVIEW


 |
 |
 |
 |

 |
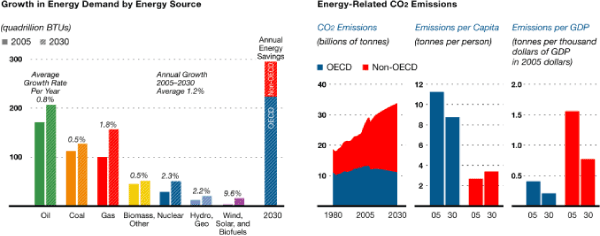
| • | Moderating energy demand through efficiency; | |
| • | Expanding all commercially viable energy sources; and, | |
| • | Mitigating emissions. |
 |
 |


 |
 |
 |
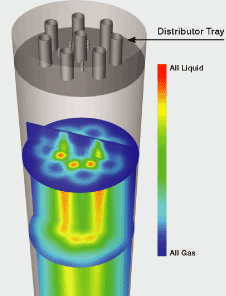
 |
EXXON MOBIL CORPORATION • 2009 FINANCIAL & OPERATING REVIEW 19
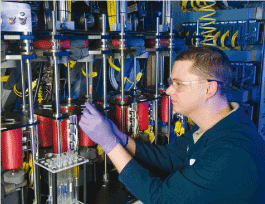
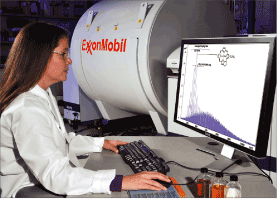
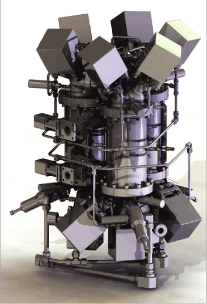
 |
20 EXXON MOBIL CORPORATION • 2009 FINANCIAL & OPERATING REVIEW
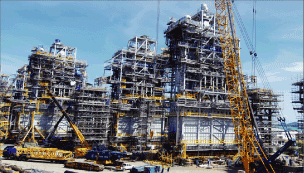

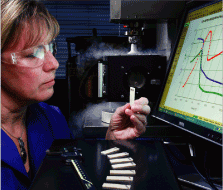
 |
EXXON MOBIL CORPORATION • 2009 FINANCIAL & OPERATING REVIEW 21
| 2009 | 2008 | 2007 | 2006 | 2005 | ||||||||||||||||
Earnings per common share(1) (dollars) |
3.99 | 8.70 | 7.31 | 6.64 | 5.74 | |||||||||||||||
Earnings per common share – assuming dilution(1) (dollars) |
3.98 | 8.66 | 7.26 | 6.60 | 5.70 | |||||||||||||||
Dividends per common share (dollars) |
||||||||||||||||||||
First quarter |
0.40 | 0.35 | 0.32 | 0.32 | 0.27 | |||||||||||||||
Second quarter |
0.42 | 0.40 | 0.35 | 0.32 | 0.29 | |||||||||||||||
Third quarter |
0.42 | 0.40 | 0.35 | 0.32 | 0.29 | |||||||||||||||
Fourth quarter |
0.42 | 0.40 | 0.35 | 0.32 | 0.29 | |||||||||||||||
Total |
1.66 | 1.55 | 1.37 | 1.28 | 1.14 | |||||||||||||||
Dividends per share growth (annual percent) |
7.1 | 13.1 | 7.0 | 12.3 | 7.5 | |||||||||||||||
Number of common shares outstanding (millions) |
||||||||||||||||||||
Average |
4,832 | 5,194 | 5,557 | 5,948 | 6,295 | |||||||||||||||
Average – assuming dilution |
4,848 | 5,221 | 5,594 | 5,987 | 6,338 | |||||||||||||||
Year end |
4,727 | 4,976 | 5,382 | 5,729 | 6,133 | |||||||||||||||
Cash dividends paid on common stock (millions of dollars) |
8,023 | 8,058 | 7,621 | 7,628 | 7,185 | |||||||||||||||
Cash dividends paid to earnings (percent) |
42 | 18 | 19 | 19 | 20 | |||||||||||||||
Cash dividends paid to cash flow(2) (percent) |
28 | 13 | 15 | 15 | 15 | |||||||||||||||
Total return to shareholders (annual percent) |
(12.6 | ) | (13.2 | ) | 24.3 | 39.2 | 11.7 | |||||||||||||
Market quotations for common stock (dollars) |
||||||||||||||||||||
High |
82.73 | 96.12 | 95.27 | 79.00 | 65.96 | |||||||||||||||
Low |
61.86 | 56.51 | 69.02 | 56.42 | 49.25 | |||||||||||||||
Average daily close |
70.95 | 82.68 | 83.23 | 65.35 | 58.24 | |||||||||||||||
Year-end close |
68.19 | 79.83 | 93.69 | 76.63 | 56.17 | |||||||||||||||
| (1) | Consistent with 2009 reporting, the calculation of prior period earnings per share has been updated to include unvested share-based payment awards that contain nonforfeitable dividend rights. | |
| (2) | Net cash provided by operating activities. |
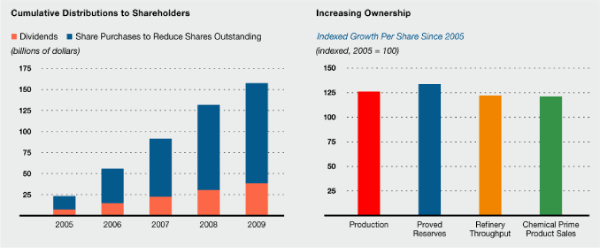
 |
22 EXXON MOBIL CORPORATION • 2009 FINANCIAL & OPERATING REVIEW
| 2009 Quarters | ||||||||||||||||||||||||||||||||||||
| (millions of dollars) | First | Second | Third | Fourth | 2009 | 2008 | 2007 | 2006 | 2005 | |||||||||||||||||||||||||||
Earnings (U.S. GAAP) |
||||||||||||||||||||||||||||||||||||
Upstream |
||||||||||||||||||||||||||||||||||||
United States |
360 | 813 | 709 | 1,011 | 2,893 | 6,243 | 4,870 | 5,168 | 6,200 | |||||||||||||||||||||||||||
Non-U.S. |
3,143 | 2,999 | 3,303 | 4,769 | 14,214 | 29,159 | 21,627 | 21,062 | 18,149 | |||||||||||||||||||||||||||
Total |
3,503 | 3,812 | 4,012 | 5,780 | 17,107 | 35,402 | 26,497 | 26,230 | 24,349 | |||||||||||||||||||||||||||
Downstream |
||||||||||||||||||||||||||||||||||||
United States |
352 | (15 | ) | (203 | ) | (287 | ) | (153 | ) | 1,649 | 4,120 | 4,250 | 3,911 | |||||||||||||||||||||||
Non-U.S. |
781 | 527 | 528 | 98 | 1,934 | 6,502 | 5,453 | 4,204 | 4,081 | |||||||||||||||||||||||||||
Total |
1,133 | 512 | 325 | (189 | ) | 1,781 | 8,151 | 9,573 | 8,454 | 7,992 | ||||||||||||||||||||||||||
Chemical |
||||||||||||||||||||||||||||||||||||
United States |
83 | 79 | 315 | 292 | 769 | 724 | 1,181 | 1,360 | 1,186 | |||||||||||||||||||||||||||
Non-U.S. |
267 | 288 | 561 | 424 | 1,540 | 2,233 | 3,382 | 3,022 | 2,757 | |||||||||||||||||||||||||||
Total |
350 | 367 | 876 | 716 | 2,309 | 2,957 | 4,563 | 4,382 | 3,943 | |||||||||||||||||||||||||||
Corporate and financing |
(436 | ) | (741 | ) | (483 | ) | (257 | ) | (1,917 | ) | (1,290 | ) | (23 | ) | 434 | (154 | ) | |||||||||||||||||||
Net income attributable to ExxonMobil (U.S. GAAP) |
4,550 | 3,950 | 4,730 | 6,050 | 19,280 | 45,220 | 40,610 | 39,500 | 36,130 | |||||||||||||||||||||||||||
Earnings per common share(2) (dollars) |
0.92 | 0.82 | 0.98 | 1.27 | 3.99 | 8.70 | 7.31 | 6.64 | 5.74 | |||||||||||||||||||||||||||
Earnings per common share – assuming
dilution(2) (dollars) |
0.92 | 0.81 | 0.98 | 1.27 | 3.98 | 8.66 | 7.26 | 6.60 | 5.70 | |||||||||||||||||||||||||||
Special Items |
||||||||||||||||||||||||||||||||||||
Upstream |
||||||||||||||||||||||||||||||||||||
United States |
– | – | – | – | – | – | – | – | – | |||||||||||||||||||||||||||
Non-U.S. |
– | – | – | – | – | 1,620 | – | – | 1,620 | |||||||||||||||||||||||||||
Total |
– | – | – | – | – | 1,620 | – | – | 1,620 | |||||||||||||||||||||||||||
Downstream |
||||||||||||||||||||||||||||||||||||
United States |
– | – | – | – | – | – | – | – | (200 | ) | ||||||||||||||||||||||||||
Non-U.S. |
– | – | – | – | – | – | – | – | 310 | |||||||||||||||||||||||||||
Total |
– | – | – | – | – | – | – | – | 110 | |||||||||||||||||||||||||||
Chemical |
||||||||||||||||||||||||||||||||||||
United States |
– | – | – | – | – | – | – | – | – | |||||||||||||||||||||||||||
Non-U.S. |
– | – | – | – | – | – | – | – | 540 | |||||||||||||||||||||||||||
Total |
– | – | – | – | – | – | – | – | 540 | |||||||||||||||||||||||||||
Corporate and financing |
– | (140 | ) | – | – | (140 | ) | (460 | ) | – | 410 | – | ||||||||||||||||||||||||
Corporate total |
– | (140 | ) | – | – | (140 | ) | 1,160 | – | 410 | 2,270 | |||||||||||||||||||||||||
Earnings
Excluding Special
Items(3) |
||||||||||||||||||||||||||||||||||||
Upstream |
||||||||||||||||||||||||||||||||||||
United States |
360 | 813 | 709 | 1,011 | 2,893 | 6,243 | 4,870 | 5,168 | 6,200 | |||||||||||||||||||||||||||
Non-U.S. |
3,143 | 2,999 | 3,303 | 4,769 | 14,214 | 27,539 | 21,627 | 21,062 | 16,529 | |||||||||||||||||||||||||||
Total |
3,503 | 3,812 | 4,012 | 5,780 | 17,107 | 33,782 | 26,497 | 26,230 | 22,729 | |||||||||||||||||||||||||||
Downstream |
||||||||||||||||||||||||||||||||||||
United States |
352 | (15 | ) | (203 | ) | (287 | ) | (153 | ) | 1,649 | 4,120 | 4,250 | 4,111 | |||||||||||||||||||||||
Non-U.S. |
781 | 527 | 528 | 98 | 1,934 | 6,502 | 5,453 | 4,204 | 3,771 | |||||||||||||||||||||||||||
Total |
1,133 | 512 | 325 | (189 | ) | 1,781 | 8,151 | 9,573 | 8,454 | 7,882 | ||||||||||||||||||||||||||
Chemical |
||||||||||||||||||||||||||||||||||||
United States |
83 | 79 | 315 | 292 | 769 | 724 | 1,181 | 1,360 | 1,186 | |||||||||||||||||||||||||||
Non-U.S. |
267 | 288 | 561 | 424 | 1,540 | 2,233 | 3,382 | 3,022 | 2,217 | |||||||||||||||||||||||||||
Total |
350 | 367 | 876 | 716 | 2,309 | 2,957 | 4,563 | 4,382 | 3,403 | |||||||||||||||||||||||||||
Corporate and financing |
(436 | ) | (601 | ) | (483 | ) | (257 | ) | (1,777 | ) | (830 | ) | (23 | ) | 24 | (154 | ) | |||||||||||||||||||
Corporate total |
4,550 | 4,090 | 4,730 | 6,050 | 19,420 | 44,060 | 40,610 | 39,090 | 33,860 | |||||||||||||||||||||||||||
Earnings per common share(2) (dollars) |
0.92 | 0.85 | 0.98 | 1.27 | 4.02 | 8.48 | 7.31 | 6.57 | 5.38 | |||||||||||||||||||||||||||
Earnings per common share – assuming
dilution(2) (dollars) |
0.92 | 0.84 | 0.98 | 1.27 | 4.01 | 8.44 | 7.26 | 6.53 | 5.34 | |||||||||||||||||||||||||||
| (1) | Total corporate earnings means net income attributable to ExxonMobil (U.S. GAAP) from the consolidated income statement. Unless indicated, references to earnings, special items, Upstream, Downstream, Chemical, and Corporate and Financing segment earnings, and earnings per share are ExxonMobil’s share after excluding amounts attributable to noncontrolling interests. | |
| (2) | Computed using the average number of shares outstanding during each period. The sum of the four quarters may not add to the full year. Consistent with 2009 reporting, the calculation of prior period earnings per share has been updated to include unvested share-based payment awards that contain nonforfeitable dividend rights. | |
| (3) | See Frequently Used Terms on pages 100 through 103. |
 |
EXXON MOBIL CORPORATION • 2009 FINANCIAL & OPERATING REVIEW 23
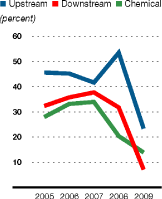
| (percent) | 2009 | 2008 | 2007 | 2006 | 2005 | |||||||||||||||
Upstream |
||||||||||||||||||||
United States |
18.2 | 42.6 | 34.7 | 37.1 | 46.0 | |||||||||||||||
Non-U.S. |
24.8 | 56.7 | 43.7 | 47.9 | 45.6 | |||||||||||||||
Total |
23.4 | 53.6 | 41.7 | 45.3 | 45.7 | |||||||||||||||
Downstream |
||||||||||||||||||||
United States |
(2.1 | ) | 23.7 | 65.1 | 65.8 | 58.8 | ||||||||||||||
Non-U.S. |
10.9 | 34.8 | 28.7 | 24.5 | 22.6 | |||||||||||||||
Total |
7.1 | 31.8 | 37.8 | 35.8 | 32.4 | |||||||||||||||
Chemical |
||||||||||||||||||||
United States |
17.6 | 16.0 | 24.9 | 27.7 | 23.1 | |||||||||||||||
Non-U.S. |
12.6 | 22.4 | 39.0 | 36.5 | 30.9 | |||||||||||||||
Total |
13.9 | 20.4 | 34.0 | 33.2 | 28.0 | |||||||||||||||
Corporate and financing |
N.A. | N.A. | N.A. | N.A. | N.A. | |||||||||||||||
Corporate total |
16.3 | 34.2 | 31.8 | 32.2 | 31.3 | |||||||||||||||
| (1) | Capital employed consists of ExxonMobil’s share of equity and consolidated debt, including ExxonMobil’s share of amounts applicable to equity companies. See Frequently Used Terms on pages 100 through 103. |
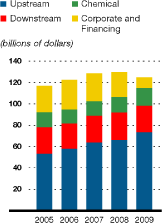
| (millions of dollars) | 2009 | 2008 | 2007 | 2006 | 2005 | |||||||||||||||
Upstream |
||||||||||||||||||||
United States |
15,865 | 14,651 | 14,026 | 13,940 | 13,491 | |||||||||||||||
Non-U.S. |
57,336 | 51,413 | 49,539 | 43,931 | 39,770 | |||||||||||||||
Total |
73,201 | 66,064 | 63,565 | 57,871 | 53,261 | |||||||||||||||
Downstream |
||||||||||||||||||||
United States |
7,306 | 6,963 | 6,331 | 6,456 | 6,650 | |||||||||||||||
Non-U.S. |
17,793 | 18,664 | 18,983 | 17,172 | 18,030 | |||||||||||||||
Total |
25,099 | 25,627 | 25,314 | 23,628 | 24,680 | |||||||||||||||
Chemical |
||||||||||||||||||||
United States |
4,370 | 4,535 | 4,748 | 4,911 | 5,145 | |||||||||||||||
Non-U.S. |
12,190 | 9,990 | 8,682 | 8,272 | 8,919 | |||||||||||||||
Total |
16,560 | 14,525 | 13,430 | 13,183 | 14,064 | |||||||||||||||
Corporate and financing |
10,190 | 23,467 | 26,451 | 27,891 | 24,956 | |||||||||||||||
Corporate total |
125,050 | 129,683 | 128,760 | 122,573 | 116,961 | |||||||||||||||
Average capital employed
applicable to equity companies
included above |
27,684 | 25,651 | 24,267 | 22,106 | 20,256 | |||||||||||||||
| (1) | Average capital employed is the average of beginning- and end-of-year business segment capital employed, including ExxonMobil’s share of amounts applicable to equity companies. See Frequently Used Terms on pages 100 through 103. |
 |
24 EXXON MOBIL CORPORATION • 2009 FINANCIAL & OPERATING REVIEW
| (millions of dollars) | 2009 | 2008 | 2007 | 2006 | 2005 | |||||||||||||||
Upstream |
||||||||||||||||||||
Exploration |
||||||||||||||||||||
United States |
735 | 734 | 415 | 425 | 297 | |||||||||||||||
Non-U.S. |
2,983 | 2,137 | 1,494 | 1,619 | 1,396 | |||||||||||||||
Total |
3,718 | 2,871 | 1,909 | 2,044 | 1,693 | |||||||||||||||
Production(2) |
||||||||||||||||||||
United States |
2,850 | 2,600 | 1,792 | 2,058 | 1,841 | |||||||||||||||
Non-U.S. |
13,877 | 14,011 | 11,913 | 12,059 | 10,844 | |||||||||||||||
Total |
16,727 | 16,611 | 13,705 | 14,117 | 12,685 | |||||||||||||||
Power and Coal |
||||||||||||||||||||
United States |
– | – | 5 | 3 | 4 | |||||||||||||||
Non-U.S. |
259 | 252 | 105 | 67 | 88 | |||||||||||||||
Total |
259 | 252 | 110 | 70 | 92 | |||||||||||||||
Total Upstream |
20,704 | 19,734 | 15,724 | 16,231 | 14,470 | |||||||||||||||
Downstream |
||||||||||||||||||||
Refining |
||||||||||||||||||||
United States |
1,300 | 1,430 | 906 | 559 | 497 | |||||||||||||||
Non-U.S. |
1,146 | 1,248 | 1,267 | 1,051 | 871 | |||||||||||||||
Total |
2,446 | 2,678 | 2,173 | 1,610 | 1,368 | |||||||||||||||
Marketing |
||||||||||||||||||||
United States |
171 | 176 | 201 | 233 | 217 | |||||||||||||||
Non-U.S. |
536 | 638 | 876 | 852 | 859 | |||||||||||||||
Total |
707 | 814 | 1,077 | 1,085 | 1,076 | |||||||||||||||
Pipeline/Marine |
||||||||||||||||||||
United States |
40 | 30 | 21 | 32 | 39 | |||||||||||||||
Non-U.S. |
3 | 7 | 32 | 2 | 12 | |||||||||||||||
Total |
43 | 37 | 53 | 34 | 51 | |||||||||||||||
Total Downstream |
3,196 | 3,529 | 3,303 | 2,729 | 2,495 | |||||||||||||||
Chemical |
||||||||||||||||||||
United States |
319 | 441 | 360 | 280 | 243 | |||||||||||||||
Non-U.S. |
2,829 | 2,378 | 1,422 | 476 | 411 | |||||||||||||||
Total Chemical |
3,148 | 2,819 | 1,782 | 756 | 654 | |||||||||||||||
Other |
||||||||||||||||||||
United States |
44 | 61 | 44 | 130 | 80 | |||||||||||||||
Non-U.S. |
– | – | – | 9 | – | |||||||||||||||
Total other |
44 | 61 | 44 | 139 | 80 | |||||||||||||||
Total capital and exploration expenditures |
27,092 | 26,143 | 20,853 | 19,855 | 17,699 | |||||||||||||||
| (1) | See Frequently Used Terms on pages 100 through 103. | |
| (2) | Including related transportation. |
 |
EXXON MOBIL CORPORATION • 2009 FINANCIAL & OPERATING REVIEW 25
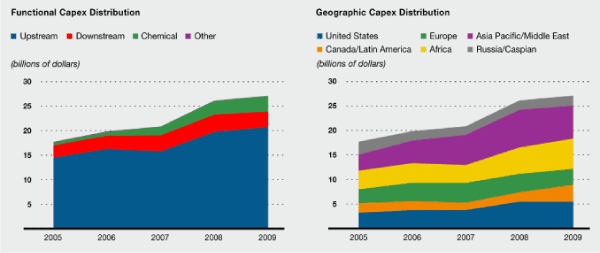
| (millions of dollars) | 2009 | 2008 | 2007 | 2006 | 2005 | |||||||||||||||
United States |
5,459 | 5,472 | 3,744 | 3,720 | 3,218 | |||||||||||||||
Canada/Latin America |
3,448 | 1,926 | 1,522 | 1,862 | 1,940 | |||||||||||||||
Europe |
3,251 | 3,727 | 4,042 | 3,721 | 2,829 | |||||||||||||||
Africa |
6,182 | 5,422 | 3,639 | 4,019 | 3,815 | |||||||||||||||
Asia Pacific/Middle East |
6,722 | 7,669 | 6,156 | 4,601 | 3,241 | |||||||||||||||
Russia/Caspian |
2,030 | 1,927 | 1,750 | 1,932 | 2,656 | |||||||||||||||
Total worldwide |
27,092 | 26,143 | 20,853 | 19,855 | 17,699 | |||||||||||||||
| (millions of dollars) | 2009 | 2008 | 2007 | 2006 | 2005 | |||||||||||||||
Consolidated Companies’ Expenditures |
||||||||||||||||||||
Capital expenditures |
22,441 | 19,841 | 15,242 | 15,361 | 13,792 | |||||||||||||||
Exploration costs charged to expense |
||||||||||||||||||||
United States |
219 | 189 | 280 | 243 | 157 | |||||||||||||||
Non-U.S. |
1,795 | 1,252 | 1,177 | 925 | 795 | |||||||||||||||
Depreciation on support equipment(1) |
7 | 10 | 12 | 13 | 12 | |||||||||||||||
Total exploration expenses |
2,021 | 1,451 | 1,469 | 1,181 | 964 | |||||||||||||||
Total consolidated companies’ capital and exploration
expenditures (excluding depreciation on support equipment) |
24,455 | 21,282 | 16,699 | 16,529 | 14,744 | |||||||||||||||
ExxonMobil’s Share of Non-Consolidated Companies’ Expenditures |
||||||||||||||||||||
Capital expenditures |
2,624 | 4,845 | 4,122 | 3,315 | 2,938 | |||||||||||||||
Exploration costs charged to expense |
13 | 16 | 32 | 11 | 17 | |||||||||||||||
Total non-consolidated companies’ capital and exploration
expenditures |
2,637 | 4,861 | 4,154 | 3,326 | 2,955 | |||||||||||||||
Total capital and exploration expenditures |
27,092 | 26,143 | 20,853 | 19,855 | 17,699 | |||||||||||||||
| (1) | Not included as part of total capital and exploration expenditures, but included as part of exploration expenses, including dry holes, in the Summary Statement of Income, page 28. |
 |
26 EXXON MOBIL CORPORATION • 2009 FINANCIAL & OPERATING REVIEW
| (millions of dollars) | 2009 | 2008 | 2007 | 2006 | 2005 | |||||||||||||||
Upstream |
||||||||||||||||||||
United States |
19,601 | 17,920 | 16,714 | 16,467 | 16,222 | |||||||||||||||
Non-U.S. |
68,718 | 55,493 | 56,810 | 51,943 | 46,595 | |||||||||||||||
Total |
88,319 | 73,413 | 73,524 | 68,410 | 62,817 | |||||||||||||||
Downstream |
||||||||||||||||||||
United States |
11,013 | 10,492 | 9,705 | 9,320 | 9,334 | |||||||||||||||
Non-U.S. |
19,486 | 18,762 | 20,443 | 19,598 | 18,695 | |||||||||||||||
Total |
30,499 | 29,254 | 30,148 | 28,918 | 28,029 | |||||||||||||||
Chemical |
||||||||||||||||||||
United States |
4,274 | 4,396 | 4,448 | 4,553 | 4,685 | |||||||||||||||
Non-U.S. |
9,237 | 7,034 | 5,623 | 4,766 | 4,619 | |||||||||||||||
Total |
13,511 | 11,430 | 10,071 | 9,319 | 9,304 | |||||||||||||||
Other |
6,787 | 7,249 | 7,126 | 7,040 | 6,860 | |||||||||||||||
Total net investment |
139,116 | 121,346 | 120,869 | 113,687 | 107,010 | |||||||||||||||
| (millions of dollars) | 2009 | 2008 | 2007 | 2006 | 2005 | |||||||||||||||
Upstream |
||||||||||||||||||||
United States |
1,768 | 1,391 | 1,469 | 1,263 | 1,293 | |||||||||||||||
Non-U.S. |
6,376 | 7,266 | 7,126 | 6,482 | 5,407 | |||||||||||||||
Total |
8,144 | 8,657 | 8,595 | 7,745 | 6,700 | |||||||||||||||
Downstream |
||||||||||||||||||||
United States |
687 | 656 | 639 | 632 | 615 | |||||||||||||||
Non-U.S. |
1,665 | 1,672 | 1,662 | 1,605 | 1,611 | |||||||||||||||
Total |
2,352 | 2,328 | 2,301 | 2,237 | 2,226 | |||||||||||||||
Chemical |
||||||||||||||||||||
United States |
400 | 410 | 405 | 427 | 416 | |||||||||||||||
Non-U.S. |
457 | 422 | 418 | 473 | 410 | |||||||||||||||
Total |
857 | 832 | 823 | 900 | 826 | |||||||||||||||
Other |
564 | 562 | 531 | 534 | 501 | |||||||||||||||
Total depreciation and depletion expenses |
11,917 | 12,379 | 12,250 | 11,416 | 10,253 | |||||||||||||||
| (millions of dollars) | 2009 | 2008 | 2007 | 2006 | 2005 | |||||||||||||||
Production and manufacturing expenses |
33,027 | 37,905 | 31,885 | 29,528 | 26,819 | |||||||||||||||
Selling, general, and administrative |
14,735 | 15,873 | 14,890 | 14,273 | 14,402 | |||||||||||||||
Depreciation and depletion |
11,917 | 12,379 | 12,250 | 11,416 | 10,253 | |||||||||||||||
Exploration |
2,021 | 1,451 | 1,469 | 1,181 | 964 | |||||||||||||||
Subtotal |
61,700 | 67,608 | 60,494 | 56,398 | 52,438 | |||||||||||||||
ExxonMobil’s share of equity company expenses |
6,670 | 7,204 | 5,619 | 4,947 | 4,520 | |||||||||||||||
Total operating costs |
68,370 | 74,812 | 66,113 | 61,345 | 56,958 | |||||||||||||||
| (1) | See Frequently Used Terms on pages 100 through 103. |
 |
EXXON MOBIL CORPORATION • 2009 FINANCIAL & OPERATING REVIEW 27
| (millions of dollars) | 2009 | 2008 | 2007 | 2006 | 2005 | |||||||||||||||
Assets |
||||||||||||||||||||
Current assets |
||||||||||||||||||||
Cash and cash equivalents |
10,693 | 31,437 | 33,981 | 28,244 | 28,671 | |||||||||||||||
Cash and cash equivalents – restricted |
– | – | – | 4,604 | 4,604 | |||||||||||||||
Marketable securities |
169 | 570 | 519 | – | – | |||||||||||||||
Notes and accounts receivable,
less estimated doubtful amounts |
27,645 | 24,702 | 36,450 | 28,942 | 27,484 | |||||||||||||||
Inventories |
||||||||||||||||||||
Crude oil, products and merchandise |
8,718 | 9,331 | 8,863 | 8,979 | 7,852 | |||||||||||||||
Materials and supplies |
2,835 | 2,315 | 2,226 | 1,735 | 1,469 | |||||||||||||||
Other current assets |
5,175 | 3,911 | 3,924 | 3,273 | 3,262 | |||||||||||||||
Total current assets |
55,235 | 72,266 | 85,963 | 75,777 | 73,342 | |||||||||||||||
Investments, advances and long-term receivables |
31,665 | 28,556 | 28,194 | 23,237 | 20,592 | |||||||||||||||
Property, plant and equipment, at cost, |
||||||||||||||||||||
less accumulated depreciation and depletion |
139,116 | 121,346 | 120,869 | 113,687 | 107,010 | |||||||||||||||
Other assets, including intangibles, net |
7,307 | 5,884 | 7,056 | 6,314 | 7,391 | |||||||||||||||
Total assets |
233,323 | 228,052 | 242,082 | 219,015 | 208,335 | |||||||||||||||
Liabilities |
||||||||||||||||||||
Current liabilities |
||||||||||||||||||||
Notes and loans payable |
2,476 | 2,400 | 2,383 | 1,702 | 1,771 | |||||||||||||||
Accounts payable and accrued liabilities |
41,275 | 36,643 | 45,275 | 39,082 | 36,120 | |||||||||||||||
Income taxes payable |
8,310 | 10,057 | 10,654 | 8,033 | 8,416 | |||||||||||||||
Total current liabilities |
52,061 | 49,100 | 58,312 | 48,817 | 46,307 | |||||||||||||||
Long-term debt |
7,129 | 7,025 | 7,183 | 6,645 | 6,220 | |||||||||||||||
Postretirement benefits reserves |
17,942 | 20,729 | 13,278 | 13,931 | 10,220 | |||||||||||||||
Deferred income tax liabilities |
23,148 | 19,726 | 22,899 | 20,851 | 20,878 | |||||||||||||||
Other long-term obligations |
17,651 | 13,949 | 14,366 | 11,123 | 9,997 | |||||||||||||||
Total liabilities |
117,931 | 110,529 | 116,038 | 101,367 | 93,622 | |||||||||||||||
Commitments and contingencies(1) |
||||||||||||||||||||
Equity |
||||||||||||||||||||
Common stock without par value |
5,503 | 5,314 | 4,933 | 4,786 | 4,477 | |||||||||||||||
Earnings reinvested |
276,937 | 265,680 | 228,518 | 195,207 | 163,335 | |||||||||||||||
Accumulated other comprehensive income |
||||||||||||||||||||
Cumulative foreign exchange translation adjustment |
4,402 | 1,146 | 7,972 | 3,733 | 979 | |||||||||||||||
Postretirement benefits reserves adjustment |
(9,863 | ) | (11,077 | ) | (5,983 | ) | (6,495 | ) | – | |||||||||||
Minimum pension liability adjustment |
– | – | – | – | (2,258 | ) | ||||||||||||||
Common stock held in treasury |
(166,410 | ) | (148,098 | ) | (113,678 | ) | (83,387 | ) | (55,347 | ) | ||||||||||
ExxonMobil share of equity |
110,569 | 112,965 | 121,762 | 113,844 | 111,186 | |||||||||||||||
Noncontrolling interests |
4,823 | 4,558 | 4,282 | 3,804 | 3,527 | |||||||||||||||
Total equity |
115,392 | 117,523 | 126,044 | 117,648 | 114,713 | |||||||||||||||
Total liabilities and equity |
233,323 | 228,052 | 242,082 | 219,015 | 208,335 | |||||||||||||||
| (1) | For more information, please refer to Appendix A, Note 15 of ExxonMobil’s 2010 Proxy Statement. | |
| The information in the Summary Statement of Income (for 2007 to 2009), the Summary Balance Sheet (for 2008 and 2009), and the Summary Statement of Cash Flows (for 2007 to 2009), shown on pages 27 through 29, corresponds to the information in the Consolidated Statement of Income, Consolidated Balance Sheet, and the Consolidated Statement of Cash Flows in the financial statements of ExxonMobil’s 2010 Proxy Statement. For complete consolidated financial statements, including notes, please refer to Appendix A of ExxonMobil’s 2010 Proxy Statement. See also Management’s Discussion and Analysis of Financial Condition and Results of Operations and other information in Appendix A of the 2010 Proxy Statement. | ||
 |
28 EXXON MOBIL CORPORATION • 2009 FINANCIAL & OPERATING REVIEW
| (millions of dollars) | 2009 | 2008 | 2007 | 2006 | 2005 | |||||||||||||||
Revenues and Other Income |
||||||||||||||||||||
Sales and other operating revenue(1)(2) |
301,500 | 459,579 | 390,328 | 365,467 | 358,955 | |||||||||||||||
Income from equity affiliates |
7,143 | 11,081 | 8,901 | 6,985 | 7,583 | |||||||||||||||
Other income(3) |
1,943 | 6,699 | 5,323 | 5,183 | 4,142 | |||||||||||||||
Total revenues and other income |
310,586 | 477,359 | 404,552 | 377,635 | 370,680 | |||||||||||||||
Costs and Other Deductions |
||||||||||||||||||||
Crude oil and product purchases |
152,806 | 249,454 | 199,498 | 182,546 | 185,219 | |||||||||||||||
Production and manufacturing expenses |
33,027 | 37,905 | 31,885 | 29,528 | 26,819 | |||||||||||||||
Selling, general, and administrative expenses |
14,735 | 15,873 | 14,890 | 14,273 | 14,402 | |||||||||||||||
Depreciation and depletion |
11,917 | 12,379 | 12,250 | 11,416 | 10,253 | |||||||||||||||
Exploration expenses, including dry holes |
2,021 | 1,451 | 1,469 | 1,181 | 964 | |||||||||||||||
Interest expense |
548 | 673 | 400 | 654 | 496 | |||||||||||||||
Sales-based taxes(1) |
25,936 | 34,508 | 31,728 | 30,381 | 30,742 | |||||||||||||||
Other taxes and duties |
34,819 | 41,719 | 40,953 | 39,203 | 41,554 | |||||||||||||||
Total costs and other deductions |
275,809 | 393,962 | 333,073 | 309,182 | 310,449 | |||||||||||||||
Income before income taxes |
34,777 | 83,397 | 71,479 | 68,453 | 60,231 | |||||||||||||||
Income taxes |
15,119 | 36,530 | 29,864 | 27,902 | 23,302 | |||||||||||||||
Net income including noncontrolling interests |
19,658 | 46,867 | 41,615 | 40,551 | 36,929 | |||||||||||||||
Net income attributable to noncontrolling interests |
378 | 1,647 | 1,005 | 1,051 | 799 | |||||||||||||||
Net income attributable to ExxonMobil |
19,280 | 45,220 | 40,610 | 39,500 | 36,130 | |||||||||||||||
Earnings per Common Share(4) (dollars) |
3.99 | 8.70 | 7.31 | 6.64 | 5.74 | |||||||||||||||
Earnings per Common Share – Assuming Dilution(4) (dollars) |
3.98 | 8.66 | 7.26 | 6.60 | 5.70 | |||||||||||||||
| (1) | Sales and other operating revenue includes sales-based taxes of $25,936 million for 2009, $34,508 million for 2008, $31,728 million for 2007, $30,381 million for 2006, and $30,742 million for 2005. | |
| (2) | Sales and other operating revenue includes $30,810 million for 2005 for purchases/sales contracts with the same counterparty. Associated costs were included in Crude oil and product purchases. Effective January 1, 2006, these purchases/sales were recorded on a net basis with no resulting impact on net income. | |
| (3) | Other income for 2008 includes a $62 million gain from the sale of a non-U.S. investment and a related $143 million foreign exchange loss. | |
| (4) | Consistent with 2009 reporting, the calculation of prior period earnings per share has been updated to include unvested share-based payment awards that contain nonforfeitable dividend rights. | |
| The information in the Summary Statement of Income (for 2007 to 2009), the Summary Balance Sheet (for 2008 and 2009), and the Summary Statement of Cash Flows (for 2007 to 2009), shown on pages 27 through 29, corresponds to the information in the Consolidated Statement of Income, Consolidated Balance Sheet, and the Consolidated Statement of Cash Flows in the financial statements of ExxonMobil’s 2010 Proxy Statement. For complete consolidated financial statements, including notes, please refer to Appendix A of ExxonMobil’s 2010 Proxy Statement. See also Management’s Discussion and Analysis of Financial Condition and Results of Operations and other information in Appendix A of the 2010 Proxy Statement. | ||
 |
EXXON MOBIL CORPORATION • 2009 FINANCIAL & OPERATING REVIEW 29
| (millions of dollars) | 2009 | 2008 | 2007 | 2006 | 2005 | |||||||||||||||
Cash Flows from Operating Activities |
||||||||||||||||||||
Net income including noncontrolling interests |
19,658 | 46,867 | 41,615 | 40,551 | 36,929 | |||||||||||||||
Adjustments for noncash transactions |
||||||||||||||||||||
Depreciation and depletion |
11,917 | 12,379 | 12,250 | 11,416 | 10,253 | |||||||||||||||
Deferred income tax charges/(credits) |
– | 1,399 | 124 | 1,717 | (429 | ) | ||||||||||||||
Postretirement benefits expense in excess
of/(less than) payments |
(1,722 | ) | 57 | (1,314 | ) | (1,787 | ) | 254 | ||||||||||||
Other long-term obligation provisions in excess of/(less than) payments |
731 | (63 | ) | 1,065 | (666 | ) | 398 | |||||||||||||
Dividends received greater than/(less than) equity in current earnings of equity companies |
(483 | ) | 921 | (714 | ) | (579 | ) | (734 | ) | |||||||||||
Changes in operational working capital, excluding cash and
debt |
||||||||||||||||||||
Reduction/(increase) – Notes and accounts receivable |
(3,170 | ) | 8,641 | (5,441 | ) | (181 | ) | (3,700 | ) | |||||||||||
– Inventories |
459 | (1,285 | ) | 72 | (1,057 | ) | (434 | ) | ||||||||||||
– Other current assets |
132 | (509 | ) | 280 | (385 | ) | (7 | ) | ||||||||||||
Increase/(reduction) – Accounts and other payables |
1,420 | (5,415 | ) | 6,228 | 1,160 | 7,806 | ||||||||||||||
Net (gain) on asset sales |
(488 | ) | (3,757 | ) | (2,217 | ) | (1,531 | ) | (1,980 | ) | ||||||||||
All other items – net |
(16 | ) | 490 | 54 | 628 | (218 | ) | |||||||||||||
Net cash provided by operating activities |
28,438 | 59,725 | 52,002 | 49,286 | 48,138 | |||||||||||||||
Cash Flows from Investing Activities |
||||||||||||||||||||
Additions to property, plant and equipment |
(22,491 | ) | (19,318 | ) | (15,387 | ) | (15,462 | ) | (13,839 | ) | ||||||||||
Sales of
subsidiaries, investments, and property,
plant and equipment |
1,545 | 5,985 | 4,204 | 3,080 | 6,036 | |||||||||||||||
Decrease/(increase) in restricted cash and cash equivalents |
– | – | 4,604 | – | – | |||||||||||||||
Additional investments and advances |
(2,752 | ) | (2,495 | ) | (3,038 | ) | (2,604 | ) | (2,810 | ) | ||||||||||
Collection of advances |
724 | 574 | 391 | 756 | 343 | |||||||||||||||
Additions to marketable securities |
(16 | ) | (2,113 | ) | (646 | ) | – | – | ||||||||||||
Sales of marketable securities |
571 | 1,868 | 144 | – | – | |||||||||||||||
Net cash used in investing activities |
(22,419 | ) | (15,499 | ) | (9,728 | ) | (14,230 | ) | (10,270 | ) | ||||||||||
Cash Flows from Financing Activities |
||||||||||||||||||||
Additions to long-term debt |
225 | 79 | 592 | 318 | 195 | |||||||||||||||
Reductions in long-term debt |
(68 | ) | (192 | ) | (209 | ) | (33 | ) | (81 | ) | ||||||||||
Additions to short-term debt |
1,336 | 1,067 | 1,211 | 334 | 377 | |||||||||||||||
Reductions in short-term debt |
(1,575 | ) | (1,624 | ) | (809 | ) | (451 | ) | (687 | ) | ||||||||||
Additions/(reductions) in debt with three months
or less maturity |
(71 | ) | 143 | (187 | ) | (95 | ) | (1,306 | ) | |||||||||||
Cash dividends to ExxonMobil shareholders |
(8,023 | ) | (8,058 | ) | (7,621 | ) | (7,628 | ) | (7,185 | ) | ||||||||||
Cash dividends to noncontrolling interests |
(280 | ) | (375 | ) | (289 | ) | (239 | ) | (293 | ) | ||||||||||
Changes in noncontrolling interests |
(113 | ) | (419 | ) | (659 | ) | (493 | ) | (681 | ) | ||||||||||
Tax benefits related to stock-based awards |
237 | 333 | 369 | 462 | – | |||||||||||||||
Common stock acquired |
(19,703 | ) | (35,734 | ) | (31,822 | ) | (29,558 | ) | (18,221 | ) | ||||||||||
Common stock sold |
752 | 753 | 1,079 | 1,173 | 941 | |||||||||||||||
Net cash used in financing activities |
(27,283 | ) | (44,027 | ) | (38,345 | ) | (36,210 | ) | (26,941 | ) | ||||||||||
Effects of exchange rate changes on cash |
520 | (2,743 | ) | 1,808 | 727 | (787 | ) | |||||||||||||
Increase/(decrease) in cash and cash equivalents |
(20,744 | ) | (2,544 | ) | 5,737 | (427 | ) | 10,140 | ||||||||||||
Cash and cash equivalents at beginning of year |
31,437 | 33,981 | 28,244 | 28,671 | 18,531 | |||||||||||||||
Cash and cash equivalents at end of year |
10,693 | 31,437 | 33,981 | 28,244 | 28,671 | |||||||||||||||
| The information in the Summary Statement of Income (for 2007 to 2009), the Summary Balance Sheet (for 2008 and 2009), and the Summary Statement of Cash Flows (for 2007 to 2009), shown on pages 27 through 29, corresponds to the information in the Consolidated Statement of Income, Consolidated Balance Sheet, and the Consolidated Statement of Cash Flows in the financial statements of ExxonMobil’s 2010 Proxy Statement. For complete consolidated financial statements, including notes, please refer to Appendix A of ExxonMobil’s 2010 Proxy Statement. See also Management’s Discussion and Analysis of Financial Condition and Results of Operations and other information in Appendix A of the 2010 Proxy Statement. | ||
 |
30
| • | Identify and selectively pursue the highest-quality exploration opportunities |
| • | Invest in projects that deliver superior returns |
| • | Maximize profitability of existing oil and gas production |
| • | Capitalize on growing natural gas and power markets |
 |
EXXON MOBIL CORPORATION • 2009 FINANCIAL & OPERATING REVIEW 31
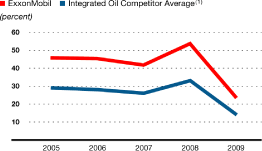
| UPSTREAM STATISTICAL RECAP | 2009 | 2008 | 2007 | 2006 | 2005 | |||||||||||||||
Earnings (millions of dollars) |
17,107 | 35,402 | 26,497 | 26,230 | 24,349 | |||||||||||||||
Liquids production (net, thousands of barrels per day) |
2,387 | 2,405 | 2,616 | 2,681 | 2,523 | |||||||||||||||
Natural gas production available for sale (net, millions of cubic feet per day) |
9,273 | 9,095 | 9,384 | 9,334 | 9,251 | |||||||||||||||
Oil-equivalent production (net, thousands of barrels per day) |
3,932 | 3,921 | 4,180 | 4,237 | 4,065 | |||||||||||||||
Proved
reserves
replacement(1)(2) (percent) |
134 | 110 | 132 | 129 | 129 | |||||||||||||||
Resource
additions(3) (millions of oil-equivalent barrels) |
2,860 | 2,230 | 2,010 | 4,270 | 4,365 | |||||||||||||||
Average
capital
employed(3) (millions of dollars) |
73,201 | 66,064 | 63,565 | 57,871 | 53,261 | |||||||||||||||
Return on
average capital
employed(3) (percent) |
23.4 | 53.6 | 41.7 | 45.3 | 45.7 | |||||||||||||||
Capital and
exploration
expenditures(3) (millions of dollars) |
20,704 | 19,734 | 15,724 | 16,231 | 14,470 | |||||||||||||||
| (1) | Reserves determined on ExxonMobil’s basis; see Frequently Used Terms on pages 100 through 103. |
| (2) | Excluding asset sales and the 2007 Venezuela expropriation. |
| (3) | See Frequently Used Terms on pages 100 through 103. |
 |
32 EXXON MOBIL CORPORATION • 2009 FINANCIAL & OPERATING REVIEW
| • | New exploration plays and concepts that typically have high uncertainty but large potential to provide significant long-term resource growth; | |
| • | Unconventional resources such as shale gas, tight gas, coal bed methane, heavy oil, and oil sands that can provide profitable, long-plateau production volumes; | |
| • | Further exploration of established hydrocarbon provinces and mature plays that provide near-term resource additions and production; and, | |
| • | Discovered fields that are undeveloped or partially developed. |
 |
EXXON MOBIL CORPORATION • 2009 FINANCIAL & OPERATING REVIEW 33
 |
34 EXXON MOBIL CORPORATION • 2009 FINANCIAL & OPERATING
REVIEW
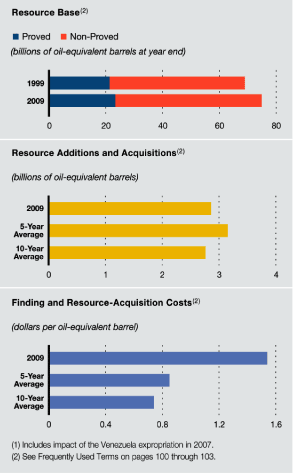
| 5-Year | ||||||||
| (billions of oil-equivalent barrels) | 2009 | Average | ||||||
Resource additions/acquisitions |
2.9 | 3.1 | ||||||
Revisions to existing fields |
1.0 | (0.2 | ) | |||||
Production |
(1.5 | ) | (1.5 | ) | ||||
Sales |
– | (0.9 | )(1) | |||||
Net change versus year-end 2008 |
2.4 | 0.5 | ||||||
 |
EXXON MOBIL CORPORATION • 2009 FINANCIAL & OPERATING
REVIEW 35
 |
36 EXXON MOBIL CORPORATION • 2009 FINANCIAL & OPERATING REVIEW
 |
EXXON MOBIL CORPORATION • 2009 FINANCIAL & OPERATING REVIEW 37
 |
38 EXXON MOBIL CORPORATION • 2009 FINANCIAL & OPERATING REVIEW
 |
EXXON MOBIL CORPORATION • 2009 FINANCIAL & OPERATING REVIEW 39
 |
40 EXXON MOBIL CORPORATION • 2009 FINANCIAL & OPERATING REVIEW
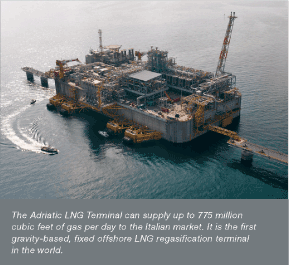
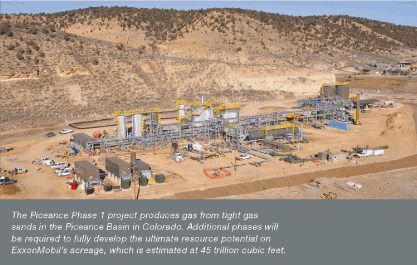
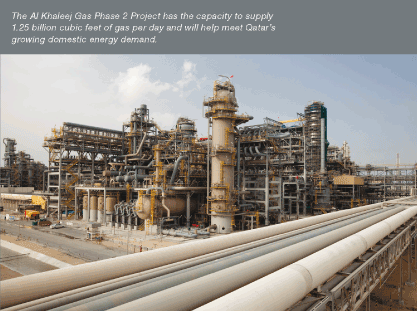
 |
EXXON MOBIL CORPORATION • 2009 FINANCIAL & OPERATING REVIEW 41
| Target Peak | ||||||||||||||
| Production (Gross) |
ExxonMobil | |||||||||||||
| Liquids | Gas | Working | ||||||||||||
| (KBD) | (MCFD) | Interest (%) | ||||||||||||
| 2009 (Actual) | ||||||||||||||
Italy |
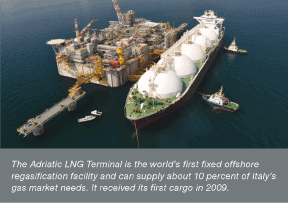
Adriatic LNG Terminal | – | – | 45 | ▲ | |||||||||
Norway |
Tyrihans | 80 | 335 | 12 | l | |||||||||
Qatar |
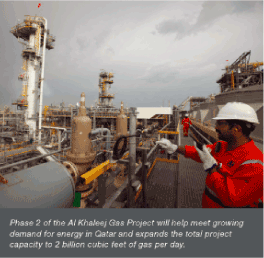
Al Khaleej Gas Phase 2 | 100 | 1250 | 80 | *n | |||||||||
| Qatargas 2 Train 4** | 80 | 1250 | 30 | ▲ | ||||||||||
| Qatargas 2 Train 5 | 80 | 1250 | 18 | ▲ | ||||||||||
| RasGas Train 6 | 75 | 1250 | 30 | ▲ | ||||||||||
U.K. |
South Hook LNG Terminal | – | – | 24 | ▲ | |||||||||
U.S. |
Piceance Phase 1 | 2 | 200 | 100 | n | |||||||||
| 2010 (Projected) | ||||||||||||||
Qatar |
RasGas Train 7 | 75 | 1250 | 30 | ▲ | |||||||||
Russia |
Sakhalin-1 Odoptu | 35 | – | 30 | n | |||||||||
U.S. |
Golden Pass LNG Terminal | – | – | 18 | ▲ | |||||||||
| 2011-2012 (Projected) | ||||||||||||||
Angola |
Kizomba Satellites | 100 | – | 40 | n | |||||||||
| Pazflor | 200 | – | 20 | l | ||||||||||
| Plutao-Saturno-Venus-Marte | 150 | – | 25 | l | ||||||||||
Australia |
Kipper/Tuna | 15 | 175 | 40 | n | |||||||||
| Turrum | 20 | 200 | 50 | n | ||||||||||
Canada |
Kearl Phase 1 | 140 | – | 100 | n | |||||||||
Nigeria |
Satellite Field Development Phase 1 |
70 | – | 40 | n | |||||||||
| Usan | 180 | – | 30 | l | ||||||||||
U.K. |
Fram | 20 | 140 | 72 | l | |||||||||
| 2013+ (Projected) | ||||||||||||||
Angola |
AB31 Southeast Hub | 150 | – | 25 | l | |||||||||
| AB32 Southeast Hub | 210 | – | 15 | l | ||||||||||
| Cravo-Lirio-Orquidea-Violeta | 160 | – | 20 | l | ||||||||||
| Kizomba C - Mondo South | 40 | – | 40 | n | ||||||||||
Australia |
Gorgon Jansz | 20 | 2545 | 25 | l | |||||||||
| Scarborough | – | 1190 | 50 | n | ||||||||||
Canada |
Cold Lake Nabiye Expansion | 35 | – | 100 | n | |||||||||
| Cold Lake LASER Expansion | 20 | – | 100 | n | ||||||||||
| Hebron | 115 | – | 34 | n | ||||||||||
| Hibernia Southern Extension | 40 | – | 28 | n | ||||||||||
| Kearl Future Phases | 200 | – | 100 | n | ||||||||||
| Target Peak | ||||||||||||||
| Production (Gross) |
ExxonMobil | |||||||||||||
| Liquids | Gas | Working | ||||||||||||
| (KBD) | (MCFD) | Interest (%) | ||||||||||||
| 2013+ (Projected, continued) | ||||||||||||||
Canada (cont’d) |
Mackenzie Gas Project | 10 | 830 | 56 | n | |||||||||
| Sable Satellites | 5 | 190 | 66 | n | ||||||||||
| Syncrude Aurora South Phases 1 and 2 | 200 | – | 25 | ▲ | ||||||||||
Indonesia |
Banyu Urip | 165 | 15 | 45 | n | |||||||||
| Natuna | – | 1100 | 76 | n | ||||||||||
Italy |
Tempa Rossa | 50 | 15 | 25 | l | |||||||||
Kazakhstan |
Aktote | 50 | 850 | 17 | l | |||||||||
| Kashagan Phase 1 | 360 | – | 17 | l | ||||||||||
| Kashagan Future Phases | 1190 | – | 17 | l | ||||||||||
| Tengiz Expansion | 250 | – | 25 | l | ||||||||||
Nigeria |
Bonga North | 100 | 60 | 20 | l | |||||||||
| Bonga Southwest | 140 | 105 | 16 | l | ||||||||||
| Bosi | 135 | – | 56 | n | ||||||||||
| Erha North Phase 2 | 50 | – | 56 | n | ||||||||||
| Etim/Asasa Pressure Maintenance | 50 | – | 40 | n | ||||||||||
| LNG IPP Upstream | – | 700 | 40 | n | ||||||||||
| QGFE DomGas | 15 | 300 | 40 | n | ||||||||||
| Satellite Field Development Phases 2-4 |
300 | – | 40 | n | ||||||||||
| Uge | 110 | 20 | 20 | n | ||||||||||
| Usari Pressure Maintenance | 50 | – | 40 | n | ||||||||||
Norway |
Luva | – | 600 | 15 | l | |||||||||
| Trestakk | 40 | 120 | 33 | l | ||||||||||
Papua New Guinea |
PNG LNG | 40 | 940 | 33 | n | |||||||||
Qatar |
Barzan | 100 | 1500 | 10 | *▲ | |||||||||
Russia |
Sakhalin-1 Arkutun-Dagi | 90 | – | 30 | n | |||||||||
| Sakhalin-1 Gas | – | 800 | 30 | n | ||||||||||
United Arab Emirates |
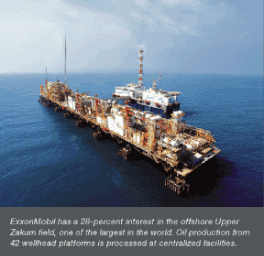
Upper Zakum 750 | 750 | 150 | 28 | ▲ | |||||||||
U.S. |
Alaska Gas/Point Thomson | 70 | 4500 | 36 | * | |||||||||
| Julia | 30 | – | 50 | n | ||||||||||
| LaBarge Field Expansion | – | 2060 | 100 | n | ||||||||||
| Piceance Future Phases | 5 | 780 | 100 | n | ||||||||||
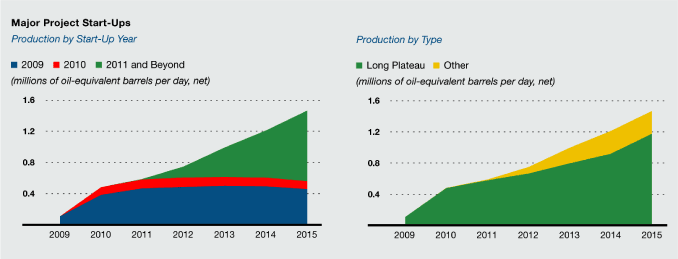
|
 |
42 EXXON MOBIL CORPORATION • 2009 FINANCIAL & OPERATING REVIEW
 |
EXXON MOBIL CORPORATION • 2009 FINANCIAL & OPERATING REVIEW 43
 |
44 EXXON MOBIL CORPORATION • 2009 FINANCIAL & OPERATING REVIEW
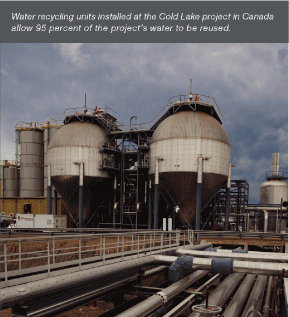
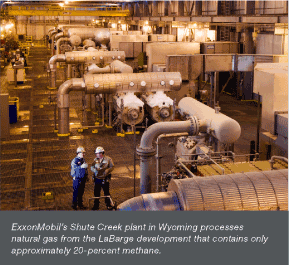
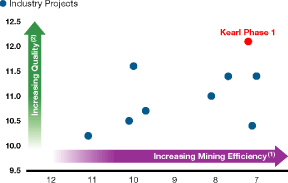
| (1) | Ratio of Total Volume to Bitumen in Place, or TV:BIP | |
| (2) | Ore grade percentage |
 |
EXXON MOBIL CORPORATION • 2009 FINANCIAL & OPERATING REVIEW 45
 |
46 EXXON MOBIL CORPORATION • 2009 FINANCIAL & OPERATING REVIEW
| 2009 | 2008 | 2007 | ||||||||||
Earnings (billions of dollars) |
3.8 | 9.8 | 7.6 | |||||||||
Proved
Reserves(1) (BOEB) |
7.2 | 7.2 | 6.2 | |||||||||
Acreage (gross acres, million) |
49.5 | 56.4 | 56.3 | |||||||||
Net Liquids Production (MBD) |
0.7 | 0.7 | 0.7 | |||||||||
Net Gas Available for Sale (BCFD) |
1.9 | 1.9 | 2.3 | |||||||||
| (1) | See Frequently Used Terms on pages 100 through 103. | |

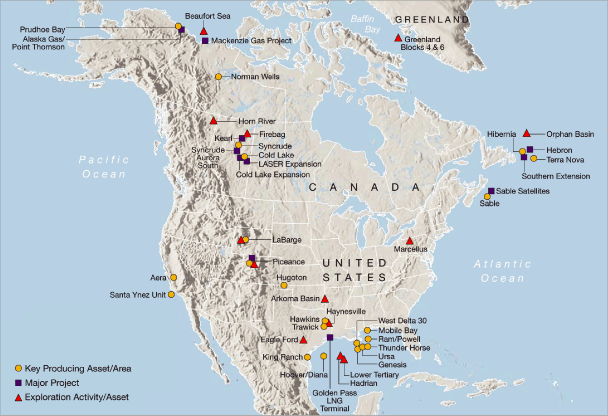
 |
EXXON MOBIL CORPORATION • 2009 FINANCIAL & OPERATING REVIEW 47
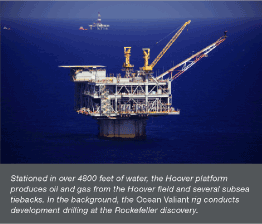
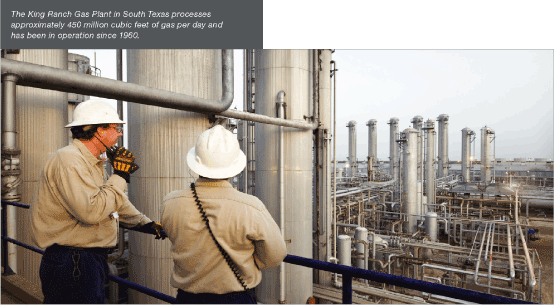
 |
48 EXXON MOBIL CORPORATION • 2009 FINANCIAL & OPERATING REVIEW
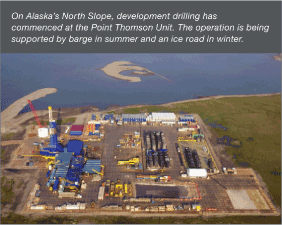
 |
EXXON MOBIL CORPORATION • 2009 FINANCIAL & OPERATING REVIEW 49
 |
50 EXXON MOBIL CORPORATION • 2009 FINANCIAL & OPERATING REVIEW
 |
EXXON MOBIL CORPORATION • 2009 FINANCIAL & OPERATING REVIEW 51
 |
52 EXXON MOBIL CORPORATION • 2009 FINANCIAL & OPERATING REVIEW
| 2009 | 2008 | 2007 | ||||||||||
Earnings (billions of dollars) |
3.6 | 9.9 | 6.1 | |||||||||
Proved
Reserves(1) (BOEB) |
3.2 | 3.4 | 3.8 | |||||||||
Acreage (gross acres, million) |
35.2 | 27.0 | 24.3 | |||||||||
Net Liquids Production (MBD) |
0.4 | 0.4 | 0.5 | |||||||||
Net Gas Available for Sale (BCFD) |
3.7 | 4.0 | 3.8 | |||||||||
| (1) | See Frequently Used Terms on pages 100 through 103. |

 |
EXXON MOBIL CORPORATION • 2009 FINANCIAL & OPERATING REVIEW 53

 |
54 EXXON MOBIL CORPORATION • 2009 FINANCIAL & OPERATING REVIEW
 |
EXXON MOBIL CORPORATION • 2009 FINANCIAL & OPERATING REVIEW 55
 |
56 EXXON MOBIL CORPORATION • 2009 FINANCIAL & OPERATING REVIEW
| 2009 | 2008 | 2007 | ||||||||||
Earnings (billions of dollars) |
3.9 | 6.4 | 5.5 | |||||||||
Proved
Reserves(1) (BOEB) |
2.1 | 2.1 | 2.4 | |||||||||
Acreage (gross acres, million) |
17.7 | 42.4 | 41.8 | |||||||||
Net Liquids Production (MBD) |
0.7 | 0.6 | 0.7 | |||||||||
Net Gas Available for Sale (BCFD) |
– | – | – | |||||||||

 |
EXXON MOBIL CORPORATION • 2009 FINANCIAL & OPERATING REVIEW 57

 |
58 EXXON MOBIL CORPORATION • 2009 FINANCIAL & OPERATING REVIEW
 |
EXXON MOBIL CORPORATION • 2009 FINANCIAL & OPERATING REVIEW 59
 |
60 EXXON MOBIL CORPORATION • 2009 FINANCIAL & OPERATING REVIEW
| 2009 | 2008 | 2007 | ||||||||||
Earnings (billions of dollars) |
4.2 | 6.2 | 4.9 | |||||||||
Proved Reserves(1) (BOEB) |
9.0 | 8.2 | 8.3 | |||||||||
Acreage (gross acres, million) |
41.9 | 26.9 | 29.0 | |||||||||
Net Liquids Production (MBD) |
0.5 | 0.5 | 0.5 | |||||||||
Net Gas Available for Sale (BCFD) |
3.5 | 3.1 | 3.2 | |||||||||

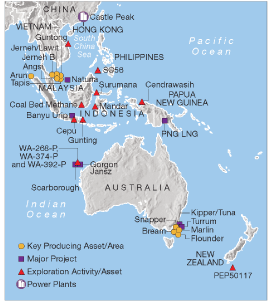
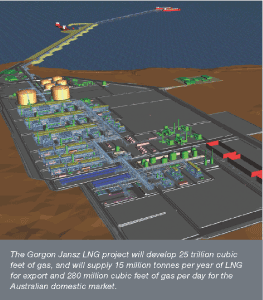
 |
EXXON MOBIL CORPORATION • 2009 FINANCIAL & OPERATING REVIEW 61
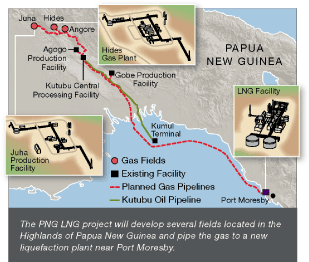
 |
62 EXXON MOBIL CORPORATION • 2009 FINANCIAL & OPERATING REVIEW
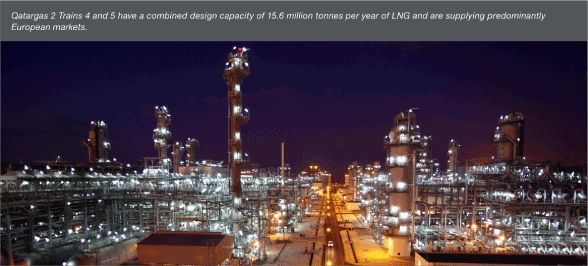
| Working | ||||||||||||
| Joint Venture | Train | Capacity(1) | Interest (%) | |||||||||
Qatargas |
1,2,3 | 9.9 | 10 | |||||||||
Qatargas 2 |
4 | 7.8 | 30 | |||||||||
| 5 | 7.8 | 18 | ||||||||||
RasGas |
1,2 | 6.6 | 25 | |||||||||
| 3 | 4.7 | 30 | ||||||||||
| 4 | 4.7 | 34 | ||||||||||
| 5 | 4.7 | 30 | ||||||||||
| 6 | 7.8 | 30 | ||||||||||
| 7 | 7.8 | 30 | ||||||||||
Total |
61.8 | |||||||||||
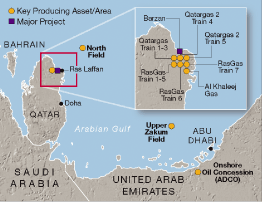
 |
EXXON MOBIL CORPORATION • 2009 FINANCIAL & OPERATING REVIEW 63
 |
64 EXXON MOBIL CORPORATION • 2009 FINANCIAL & OPERATING REVIEW
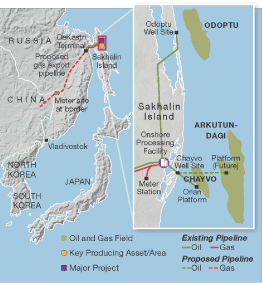

| 2009 | 2008 | 2007 | ||||||||||
Earnings (billions of dollars) |
1.6 | 3.1 | 2.4 | |||||||||
Proved
Reserves(1) (BOEB) |
1.8 | 1.9 | 2.0 | |||||||||
Acreage (gross acres, million) |
2.7 | 2.5 | 2.5 | |||||||||
Net Liquids Production (MBD) |
0.2 | 0.2 | 0.2 | |||||||||
Net Gas Available for Sale (BCFD) |
0.2 | 0.1 | 0.1 | |||||||||
| (1) | See Frequently Used Terms on pages 100 through 103. |

 |
EXXON MOBIL CORPORATION • 2009 FINANCIAL & OPERATING REVIEW 65
 |
66 EXXON MOBIL CORPORATION • 2009 FINANCIAL & OPERATING REVIEW
| (thousands of barrels per day) | 2009 | 2008 | 2007 | 2006 | 2005 | |||||||||||||||
United States |
||||||||||||||||||||
Alaska |
123 | 130 | 132 | 127 | 159 | |||||||||||||||
Lower 48 |
261 | 237 | 260 | 287 | 318 | |||||||||||||||
Total United States |
384 | 367 | 392 | 414 | 477 | |||||||||||||||
Canada/South America |
267 | 292 | 324 | 354 | 395 | |||||||||||||||
Total Americas |
651 | 659 | 716 | 768 | 872 | |||||||||||||||
Europe |
||||||||||||||||||||
United Kingdom |
90 | 123 | 150 | 186 | 202 | |||||||||||||||
Norway |
280 | 295 | 319 | 320 | 327 | |||||||||||||||
Other |
9 | 10 | 11 | 14 | 17 | |||||||||||||||
Total Europe |
379 | 428 | 480 | 520 | 546 | |||||||||||||||
Africa |
||||||||||||||||||||
Nigeria |
391 | 364 | 415 | 427 | 299 | |||||||||||||||
Angola |
194 | 181 | 173 | 193 | 181 | |||||||||||||||
Equatorial Guinea |
55 | 60 | 76 | 103 | 122 | |||||||||||||||
Other |
45 | 47 | 53 | 58 | 64 | |||||||||||||||
Total Africa |
685 | 652 | 717 | 781 | 666 | |||||||||||||||
Asia Pacific/Middle East |
||||||||||||||||||||
Australia |
59 | 59 | 66 | 69 | 73 | |||||||||||||||
Malaysia |
52 | 56 | 67 | 64 | 82 | |||||||||||||||
Middle East |
368 | 381 | 374 | 340 | 163 | |||||||||||||||
Other |
11 | 10 | 11 | 12 | 14 | |||||||||||||||
Total Asia Pacific/Middle East |
490 | 506 | 518 | 485 | 332 | |||||||||||||||
Russia/Caspian |
182 | 160 | 185 | 127 | 107 | |||||||||||||||
Total worldwide |
2,387 | 2,405 | 2,616 | 2,681 | 2,523 | |||||||||||||||
Gas Plant Liquids Included Above |
||||||||||||||||||||
United States |
50 | 49 | 57 | 61 | 68 | |||||||||||||||
Non-U.S. |
173 | 164 | 166 | 175 | 172 | |||||||||||||||
Total worldwide |
223 | 213 | 223 | 236 | 240 | |||||||||||||||
Oil Sands and Non-Consolidated Volumes Included Above |
||||||||||||||||||||
United States |
73 | 78 | 82 | 87 | 93 | |||||||||||||||
Canada/South America – Bitumen |
120 | 124 | 130 | 127 | 123 | |||||||||||||||
Canada/South America – Synthetic Oil |
65 | 62 | 65 | 58 | 53 | |||||||||||||||
Europe |
5 | 5 | 6 | 6 | 7 | |||||||||||||||
Asia Pacific/Middle East |
204 | 193 | 190 | 172 | 146 | |||||||||||||||
Russia/Caspian |
116 | 87 | 75 | 71 | 72 | |||||||||||||||
Total worldwide |
583 | 549 | 548 | 521 | 494 | |||||||||||||||
| (1) | Net liquids production quantities are the volumes of crude oil and natural gas liquids withdrawn from ExxonMobil’s oil and gas reserves, excluding royalties and quantities due to others when produced, and are based on the volumes delivered from the lease or at the point measured for royalty and/or severance tax purposes. Volumes include 100 percent of the production of majority-owned affiliates, including liquids production from oil sands operations in Canada, and ExxonMobil’s ownership of the production by companies owned 50 percent or less. |
 |
EXXON MOBIL CORPORATION • 2009 FINANCIAL & OPERATING REVIEW 67
| (millions of cubic feet per day) | 2009 | 2008 | 2007 | 2006 | 2005 | |||||||||||||||
United States |
1,275 | 1,246 | 1,468 | 1,625 | 1,739 | |||||||||||||||
Canada/South America |
643 | 640 | 808 | 935 | 1,006 | |||||||||||||||
Total Americas |
1,918 | 1,886 | 2,276 | 2,560 | 2,745 | |||||||||||||||
Europe |
||||||||||||||||||||
The Netherlands |
1,676 | 1,748 | 1,551 | 1,536 | 1,595 | |||||||||||||||
United Kingdom |
594 | 750 | 779 | 990 | 1,126 | |||||||||||||||
Norway |
786 | 764 | 705 | 686 | 709 | |||||||||||||||
Germany |
633 | 687 | 775 | 874 | 885 | |||||||||||||||
Total Europe |
3,689 | 3,949 | 3,810 | 4,086 | 4,315 | |||||||||||||||
Africa |
19 | 32 | 26 | – | – | |||||||||||||||
Asia Pacific/Middle East |
||||||||||||||||||||
Australia |
315 | 358 | 389 | 330 | 338 | |||||||||||||||
Malaysia |
545 | 582 | 583 | 519 | 488 | |||||||||||||||
Middle East |
2,367 | 1,911 | 1,875 | 1,353 | 846 | |||||||||||||||
Indonesia |
245 | 239 | 286 | 365 | 410 | |||||||||||||||
Other |
22 | 24 | 29 | 29 | 32 | |||||||||||||||
Total Asia Pacific/Middle East |
3,494 | 3,114 | 3,162 | 2,596 | 2,114 | |||||||||||||||
Russia/Caspian |
153 | 114 | 110 | 92 | 77 | |||||||||||||||
Total worldwide |
9,273 | 9,095 | 9,384 | 9,334 | 9,251 | |||||||||||||||
Non-Consolidated Natural Gas Volumes Included Above |
||||||||||||||||||||
United States |
1 | 1 | 1 | 1 | 2 | |||||||||||||||
Europe |
1,618 | 1,696 | 1,503 | 1,500 | 1,548 | |||||||||||||||
Asia Pacific/Middle East |
1,803 | 1,356 | 1,272 | 1,000 | 807 | |||||||||||||||
Russia/Caspian |
115 | 77 | 79 | 75 | 73 | |||||||||||||||
Total worldwide |
3,537 | 3,130 | 2,855 | 2,576 | 2,430 | |||||||||||||||
| (1) | Net natural gas available for sale quantities are the volumes withdrawn from ExxonMobil’s natural gas reserves, excluding royalties and volumes due to others when produced, and excluding gas purchased from others, gas consumed in producing operations, field processing plant losses, volumes used for gas lift, gas injection and cycling operations, quantities flared, and volume shrinkage due to the removal of condensate or natural gas liquids fractions. |
| (millions of cubic feet per day) | 2009 | 2008 | 2007 | 2006 | 2005 | |||||||||||||||
United States |
1,321 | 1,292 | 1,560 | 1,686 | 1,833 | |||||||||||||||
Canada/South America |
739 | 845 | 968 | 1,120 | 1,186 | |||||||||||||||
Europe |
5,854 | 5,665 | 5,396 | 5,728 | 6,015 | |||||||||||||||
Africa |
19 | 32 | 26 | – | – | |||||||||||||||
Asia Pacific/Middle East |
2,906 | 2,841 | 2,900 | 2,379 | 1,901 | |||||||||||||||
Russia/Caspian |
176 | 137 | 129 | 112 | 86 | |||||||||||||||
Total worldwide |
11,015 | 10,812 | 10,979 | 11,025 | 11,021 | |||||||||||||||
| (1) | Natural gas sales include 100 percent of the sales of ExxonMobil- and majority-owned affiliates and ExxonMobil’s ownership of sales by companies owned 50 percent or less. Numbers include sales of gas purchased from third parties. |
 |
68 EXXON MOBIL CORPORATION • 2009 FINANCIAL & OPERATING REVIEW
| Productive | Dry | Total | ||||||||||||||||||||||||||||||||||||||||||||||||||||||||||
| (net wells drilled) | 2009 | 2008 | 2007 | 2006 | 2005 | 2009 | 2008 | 2007 | 2006 | 2005 | 2009 | 2008 | 2007 | 2006 | 2005 | |||||||||||||||||||||||||||||||||||||||||||||
Exploratory(2) |
20 | 19 | 19 | 21 | 24 | 9 | 9 | 16 | 12 | 13 | 29 | 28 | 35 | 33 | 37 | |||||||||||||||||||||||||||||||||||||||||||||
Development |
829 | 731 | 917 | 1,041 | 946 | 5 | 4 | 19 | 11 | 14 | 834 | 735 | 936 | 1,052 | 960 | |||||||||||||||||||||||||||||||||||||||||||||
Total |
849 | 750 | 936 | 1,062 | 970 | 14 | 13 | 35 | 23 | 27 | 863 | 763 | 971 | 1,085 | 997 | |||||||||||||||||||||||||||||||||||||||||||||
| Undeveloped | Developed | |||||||||||||||||||||||||||||||||||||||
| (thousands of net acres) | 2009 | 2008 | 2007 | 2006 | 2005 | 2009 | 2008 | 2007 | 2006 | 2005 | ||||||||||||||||||||||||||||||
United States |
5,111 | 5,691 | 5,539 | 6,062 | 6,413 | 5,120 | 5,148 | 5,174 | 5,178 | 5,260 | ||||||||||||||||||||||||||||||
Canada/South America |
17,107 | 19,953 | 22,563 | 22,224 | 24,484 | 2,460 | 2,488 | 2,366 | 2,360 | 2,498 | ||||||||||||||||||||||||||||||
Europe |
13,470 | 7,913 | 6,002 | 2,727 | 2,778 | 3,806 | 4,026 | 4,194 | 4,418 | 4,687 | ||||||||||||||||||||||||||||||
Africa |
10,555 | 26,439 | 24,835 | 24,075 | 29,048 | 758 | 756 | 729 | 717 | 545 | ||||||||||||||||||||||||||||||
Asia Pacific/Middle East |
25,260 | 12,190 | 13,167 | 7,462 | 3,797 | 1,763 | 1,651 | 1,649 | 1,655 | 1,570 | ||||||||||||||||||||||||||||||
Russia/Caspian |
413 | 372 | 392 | 449 | 569 | 116 | 116 | 116 | 116 | 116 | ||||||||||||||||||||||||||||||
Total worldwide |
71,916 | 72,558 | 72,498 | 62,999 | 67,089 | 14,023 | 14,185 | 14,228 | 14,444 | 14,676 | ||||||||||||||||||||||||||||||
| NET CAPITALIZED COSTS AT YEAR END(3) | ||||||||||||||||||||||||||||||||||||||||
| (millions of dollars) | 2009 | 2008 | 2007 | 2006 | 2005 | |||||||||||||||||||||||||||||||||||
United States |
20,363 | 18,542 | 16,948 | 16,530 | 16,097 | |||||||||||||||||||||||||||||||||||
Canada/South America |
13,408 | 9,967 | 11,338 | 10,076 | 10,306 | |||||||||||||||||||||||||||||||||||
Europe |
14,357 | 11,477 | 15,426 | 15,182 | 13,556 | |||||||||||||||||||||||||||||||||||
Africa |
20,917 | 17,797 | 15,149 | 14,280 | 12,744 | |||||||||||||||||||||||||||||||||||
Asia Pacific/Middle East |
14,028 | 11,379 | 10,674 | 8,813 | 6,718 | |||||||||||||||||||||||||||||||||||
Russia/Caspian |
11,556 | 10,219 | 9,142 | 8,246 | 7,158 | |||||||||||||||||||||||||||||||||||
Total worldwide |
94,629 | 79,381 | 78,677 | 73,127 | 66,579 | |||||||||||||||||||||||||||||||||||
| Canada/ | Asia Pacific/ | Russia/ | ||||||||||||||||||||||||||
| (millions of dollars) | United States | South America | Europe | Africa | Middle East | Caspian | Worldwide | |||||||||||||||||||||
During 2009 |
||||||||||||||||||||||||||||
Property acquisition costs |
205 | 353 | 1 | 605 | 62 | 59 | 1,285 | |||||||||||||||||||||
Exploration costs |
549 | 498 | 525 | 880 | 601 | 58 | 3,111 | |||||||||||||||||||||
Development costs |
2,787 | 2,394 | 3,639 | 4,596 | 1,835 | 1,879 | 17,130 | |||||||||||||||||||||
Total |
3,541 | 3,245 | 4,165 | 6,081 | 2,498 | 1,996 | 21,526 | |||||||||||||||||||||
During 2008 |
||||||||||||||||||||||||||||
Property acquisition costs |
281 | 126 | 25 | 82 | 86 | 63 | 663 | |||||||||||||||||||||
Exploration costs |
453 | 325 | 401 | 686 | 346 | 61 | 2,272 | |||||||||||||||||||||
Development costs |
2,739 | 1,421 | 1,863 | 4,783 | 2,063 | 1,764 | 14,633 | |||||||||||||||||||||
Total |
3,473 | 1,872 | 2,289 | 5,551 | 2,495 | 1,888 | 17,568 | |||||||||||||||||||||
During 2007 |
||||||||||||||||||||||||||||
Property acquisition costs |
63 | 93 | – | 13 | 15 | 10 | 194 | |||||||||||||||||||||
Exploration costs |
377 | 231 | 229 | 584 | 261 | 80 | 1,762 | |||||||||||||||||||||
Development costs |
1,859 | 902 | 2,016 | 2,847 | 2,405 | 1,541 | 11,570 | |||||||||||||||||||||
Total |
2,299 | 1,226 | 2,245 | 3,444 | 2,681 | 1,631 | 13,526 | |||||||||||||||||||||
During 2006 |
||||||||||||||||||||||||||||
Property acquisition costs |
54 | 100 | 11 | 16 | 405 | 11 | 597 | |||||||||||||||||||||
Exploration costs |
382 | 225 | 202 | 518 | 219 | 139 | 1,685 | |||||||||||||||||||||
Development costs |
1,838 | 1,002 | 2,660 | 3,433 | 1,718 | 1,452 | 12,103 | |||||||||||||||||||||
Total |
2,274 | 1,327 | 2,873 | 3,967 | 2,342 | 1,602 | 14,385 | |||||||||||||||||||||
| (1) | A regional breakout of this data is included on pages 13 and 14 of ExxonMobil’s 2009 Form 10-K. | |
| (2) | These include near-field and appraisal wells classified as exploratory for SEC reporting. | |
| (3) | Includes non-consolidated interests and Canadian oil sands operations. |
 |
EXXON MOBIL CORPORATION • 2009 FINANCIAL & OPERATING REVIEW 69
| 2009 | 2008 | 2007 | 2006 | 2005 | ||||||||||||||||
| Liquids, Including Oil Sands and Non-Consolidated Reserves (millions of barrels at year end) | ||||||||||||||||||||
Net proved developed and undeveloped reserves |
||||||||||||||||||||
United States |
1,983 | 2,076 | 2,212 | 2,177 | 2,424 | |||||||||||||||
Canada/South America |
2,897 | 2,717 | 1,564 | 1,985 | 2,152 | |||||||||||||||
Europe |
519 | 566 | 696 | 750 | 886 | |||||||||||||||
Africa |
1,970 | 2,004 | 2,180 | 2,266 | 2,527 | |||||||||||||||
Asia Pacific/Middle East |
2,934 | 2,967 | 2,976 | 2,765 | 1,908 | |||||||||||||||
Russia/Caspian |
1,457 | 1,502 | 1,632 | 1,766 | 1,798 | |||||||||||||||
Total worldwide excluding price/cost effects(1) |
11,760 | 11,832 | 11,260 | 11,709 | 11,695 | |||||||||||||||
Price/cost effects |
(109 | ) | 174 | (186 | ) | (141 | ) | (466 | ) | |||||||||||
Total worldwide(2) |
11,651 | 12,006 | 11,074 | 11,568 | 11,229 | |||||||||||||||
Proportional interest in oil sands and non-consolidated reserves included above, excluding price/cost effects |
||||||||||||||||||||
United States |
360 | 368 | 374 | 369 | 391 | |||||||||||||||
Canada/South America (bitumen)(3) |
2,012 | 1,809 | 649 | 616 | 683 | |||||||||||||||
Canada/South America (synthetic oil)(3) |
710 | 734 | 694 | 718 | 738 | |||||||||||||||
Europe |
30 | 27 | 25 | 12 | 11 | |||||||||||||||
Asia Pacific/Middle East |
1,251 | 1,350 | 1,420 | 1,399 | 1,353 | |||||||||||||||
Russia/Caspian |
804 | 806 | 850 | 909 | 923 | |||||||||||||||
Net proved developed reserves included above |
||||||||||||||||||||
United States |
1,490 | 1,521 | 1,626 | 1,777 | 2,006 | |||||||||||||||
Canada/South America |
1,311 | 1,315 | 1,376 | 1,620 | 1,344 | |||||||||||||||
Europe |
386 | 419 | 526 | 568 | 665 | |||||||||||||||
Africa |
1,122 | 1,284 | 1,202 | 1,279 | 1,218 | |||||||||||||||
Asia Pacific/Middle East |
2,388 | 1,964 | 1,797 | 1,720 | 1,189 | |||||||||||||||
Russia/Caspian |
641 | 715 | 602 | 652 | 629 | |||||||||||||||
Total worldwide |
7,338 | 7,218 | 7,129 | 7,616 | 7,051 | |||||||||||||||
| Natural Gas, Including Non-Consolidated Reserves (billions of cubic feet at year end) | ||||||||||||||||||||
Net proved developed and undeveloped reserves |
||||||||||||||||||||
United States |
12,538 | 12,847 | 13,255 | 10,231 | 11,362 | |||||||||||||||
Canada/South America |
1,274 | 1,376 | 1,547 | 1,952 | 2,354 | |||||||||||||||
Europe |
15,984 | 17,097 | 18,539 | 18,847 | 20,575 | |||||||||||||||
Africa |
920 | 918 | 1,006 | 986 | 841 | |||||||||||||||
Asia Pacific/Middle East |
36,136 | 31,149 | 32,143 | 31,878 | 26,662 | |||||||||||||||
Russia/Caspian |
2,178 | 2,233 | 2,282 | 2,103 | 2,173 | |||||||||||||||
Total worldwide excluding price/cost effects(1) |
69,030 | 65,620 | 68,772 | 65,997 | 63,967 | |||||||||||||||
Price/cost effects |
(1,023 | ) | 259 | (510 | ) | 1,563 | 2,940 | |||||||||||||
Total worldwide(2) |
68,007 | 65,879 | 68,262 | 67,560 | 66,907 | |||||||||||||||
Proportional interest in non-consolidated reserves included above, excluding price/cost effects |
||||||||||||||||||||
United States |
116 | 118 | 125 | 131 | 136 | |||||||||||||||
Europe |
11,254 | 11,644 | 12,189 | 11,867 | 12,340 | |||||||||||||||
Asia Pacific/Middle East |
20,614 | 21,199 | 21,596 | 20,800 | 18,697 | |||||||||||||||
Russia/Caspian |
1,423 | 1,446 | 1,504 | 1,290 | 1,326 | |||||||||||||||
Net proved developed reserves included above |
||||||||||||||||||||
United States |
7,582 | 7,931 | 8,477 | 9,389 | 10,499 | |||||||||||||||
Canada/South America |
1,200 | 1,148 | 1,303 | 1,628 | 1,840 | |||||||||||||||
Europe |
12,782 | 13,710 | 14,743 | 15,331 | 16,558 | |||||||||||||||
Africa |
739 | 738 | 773 | 823 | 376 | |||||||||||||||
Asia Pacific/Middle East |
25,329 | 17,996 | 14,272 | 13,788 | 13,343 | |||||||||||||||
Russia/Caspian |
1,139 | 1,226 | 1,152 | 1,258 | 1,062 | |||||||||||||||
Total worldwide |
48,771 | 42,749 | 40,720 | 42,217 | 43,678 | |||||||||||||||
| (1) | ExxonMobil’s basis; see Frequently Used Terms on pages 100 through 103. |
| (2) | ExxonMobil reserves using SEC historical price bases; mining and equity company reserves are included for all periods. |
| (3) | Proved reserves classified as bitumen are associated with the Cold Lake and Kearl projects in Canada. Proved reserves classified as synthetic oil are associated with the Syncrude project in Canada. Cold Lake uses in situ methods, and hydrocarbons are produced from wells drilled into the subsurface. Syncrude is an oil sands mining project which includes an upgrader that converts the mined hydrocarbons into a higher gravity crude oil. Kearl is an oil sands mining project that does not incorporate an upgrader. |
 |
70 EXXON MOBIL CORPORATION • 2009 FINANCIAL & OPERATING REVIEW
| Crude Oil and | ||||||||||||
| Natural Gas Liquids | Bitumen | Synthetic Oil | ||||||||||
2009 Liquids (millions of barrels) |
||||||||||||
Revisions |
393 | 247 | – | |||||||||
Improved recovery |
15 | – | – | |||||||||
Extensions/discoveries |
146 | – | – | |||||||||
Purchases |
– | – | – | |||||||||
Sales |
(3 | ) | – | – | ||||||||
Total additions before price/cost effects |
551 | 247 | – | |||||||||
Remove prior year-end price/cost effects |
(216 | ) | 42 | – | ||||||||
Average price/year-end cost effects |
(133 | ) | 43 | (19 | ) | |||||||
Total additions |
202 | 332 | (19 | ) | ||||||||
Production |
802 | 44 | 24 | |||||||||
Reserves replacement ratio, excluding sales (percent) |
69 | 561 | – | |||||||||
Reserves replacement ratio, including sales (percent) |
69 | 561 | – | |||||||||
Reserves replacement ratio, including sales
and average price/year-end cost effects (percent) |
25 | 755 | – | |||||||||
| Average | ||||||||||||||||||||||||
| 2009 | 2008 | 2007 | 2006 | 2005 | 2005-2009 | |||||||||||||||||||
Liquids (millions of barrels) |
||||||||||||||||||||||||
Revisions |
640 | 232 | 708 | 57 | (333 | ) | 261 | |||||||||||||||||
Improved recovery |
15 | 8 | 35 | 27 | 30 | 23 | ||||||||||||||||||
Extensions/discoveries |
146 | 1,297 | 197 | 246 | 516 | 480 | ||||||||||||||||||
Purchases |
– | – | – | 746 | 113 | 172 | ||||||||||||||||||
Sales |
(3 | ) | (86 | ) | (436 | ) | (86 | ) | (227 | ) | (168 | ) | ||||||||||||
Total additions before price/cost effects |
798 | 1,451 | 504 | 990 | 99 | 768 | ||||||||||||||||||
Remove prior year price/cost effects |
(174 | ) | 186 | 141 | 466 | 862 | 296 | |||||||||||||||||
Year-end price/cost effects |
N.A. | 174 | (186 | ) | (141 | ) | (466 | ) | N.A. | |||||||||||||||
Average price/year-end cost effects |
(109 | ) | N.A. | N.A. | N.A. | N.A. | N.A. | |||||||||||||||||
Total additions |
515 | 1,811 | 459 | 1,315 | 495 | N.A. | ||||||||||||||||||
Production |
870 | 879 | 953 | 976 | 917 | 919 | ||||||||||||||||||
Reserves replacement ratio, excluding sales (percent) |
92 | 175 | 99 | 110 | 36 | 102 | ||||||||||||||||||
Reserves replacement ratio, including sales (percent) |
92 | 165 | 53 | 101 | 11 | 84 | ||||||||||||||||||
Reserves replacement ratio, including sales and year-end price/cost effects (percent) |
N.A. | 206 | 48 | 135 | 54 | N.A. | ||||||||||||||||||
Reserves replacement ratio, including sales and average price/year-end cost effects (percent) |
59 | N.A. | N.A. | N.A. | N.A. | N.A. | ||||||||||||||||||
| See footnotes on page 72. | ||
 |
EXXON MOBIL CORPORATION • 2009 FINANCIAL & OPERATING REVIEW 71
| Average | ||||||||||||||||||||||||
| 2009 | 2008 | 2007 | 2006 | 2005 | 2005-2009 | |||||||||||||||||||
Natural Gas (billions of cubic feet) |
||||||||||||||||||||||||
Revisions |
1,281 | (127 | ) | 6,509 | 1,993 | 4,261 | 2,784 | |||||||||||||||||
Improved recovery |
– | 1 | 4 | 12 | 9 | 5 | ||||||||||||||||||
Extensions/discoveries |
5,830 | 693 | 323 | 3,808 | 5,667 | 3,264 | ||||||||||||||||||
Purchases |
8 | – | 9 | 57 | 53 | 25 | ||||||||||||||||||
Sales |
(13 | ) | (82 | ) | (320 | ) | (104 | ) | (229 | ) | (149 | ) | ||||||||||||
Total additions before price/cost effects |
7,106 | 485 | 6,525 | 5,766 | 9,761 | 5,929 | ||||||||||||||||||
Remove prior year price/cost effects |
(259 | ) | 510 | (1,563 | ) | (2,940 | ) | (2,422 | ) | (1,335 | ) | |||||||||||||
Year-end price/cost effects |
N.A. | 259 | (510 | ) | 1,563 | 2,940 | N.A. | |||||||||||||||||
Average price/year-end cost effects |
(1,023 | ) | N.A. | N.A. | N.A. | N.A. | N.A. | |||||||||||||||||
Total additions |
5,824 | 1,254 | 4,452 | 4,389 | 10,279 | N.A. | ||||||||||||||||||
Production |
3,696 | 3,637 | 3,750 | 3,736 | 3,734 | 3,711 | ||||||||||||||||||
Reserves replacement ratio, excluding sales (percent) |
193 | 16 | 183 | 157 | 268 | 164 | ||||||||||||||||||
Reserves replacement ratio, including sales (percent) |
192 | 13 | 174 | 154 | 261 | 160 | ||||||||||||||||||
Reserves replacement ratio, including sales and year-end price/cost effects (percent) |
N.A. | 34 | 119 | 117 | 275 | N.A. | ||||||||||||||||||
Reserves replacement ratio, including sales and average price/year-end cost effects (percent) |
158 | N.A. | N.A. | N.A. | N.A. | N.A. | ||||||||||||||||||
Oil-Equivalent (millions of barrels) |
||||||||||||||||||||||||
Revisions |
853 | 211 | 1,793 | 390 | 377 | 725 | ||||||||||||||||||
Improved recovery |
15 | 8 | 35 | 29 | 31 | 23 | ||||||||||||||||||
Extensions/discoveries |
1,118 | 1,413 | 251 | 881 | 1,461 | 1,025 | ||||||||||||||||||
Purchases |
1 | – | 2 | 755 | 122 | 176 | ||||||||||||||||||
Sales |
(5 | ) | (100 | ) | (490 | ) | (104 | ) | (265 | ) | (193 | ) | ||||||||||||
Total additions before price/cost effects |
1,982 | 1,532 | 1,591 | 1,951 | 1,726 | 1,756 | ||||||||||||||||||
Remove prior year price/cost effects |
(217 | ) | 271 | (119 | ) | (24 | ) | 458 | 74 | |||||||||||||||
Year-end price/cost effects |
N.A. | 217 | (271 | ) | 119 | 24 | N.A. | |||||||||||||||||
Average price/year-end cost effects |
(280 | ) | N.A. | N.A. | N.A. | N.A. | N.A. | |||||||||||||||||
Total additions |
1,485 | 2,020 | 1,201 | 2,046 | 2,208 | N.A. | ||||||||||||||||||
Production |
1,486 | 1,485 | 1,578 | 1,598 | 1,539 | 1,537 | ||||||||||||||||||
Reserves replacement ratio, excluding sales (percent) |
134 | 110 | 132 | 129 | 129 | 127 | ||||||||||||||||||
Reserves replacement ratio, including sales (percent) |
133 | 103 | 101 | 122 | 112 | 114 | ||||||||||||||||||
Reserves replacement ratio, including sales and year-end price/cost effects (percent) |
N.A. | 136 | 76 | 128 | 143 | N.A. | ||||||||||||||||||
Reserves replacement ratio, including sales and average price/year-end cost effects (percent) |
100 | N.A. | N.A. | N.A. | N.A. | N.A. | ||||||||||||||||||
| See footnotes on page 72. | ||
 |
72 EXXON MOBIL CORPORATION • 2009 FINANCIAL & OPERATING REVIEW
| Crude Oil and Natural Gas Liquids | Bitumen | Synthetic Oil | ||||||||||||||||||||||||||||||||||||||
| Asia | ||||||||||||||||||||||||||||||||||||||||
| Canada/ | Pacific/ | Canada/ | Canada/ | |||||||||||||||||||||||||||||||||||||
| United | South | Middle | Russia/ | South | South | Liquids | ||||||||||||||||||||||||||||||||||
| States | America | Europe | Africa | East | Caspian | Total | America | America | Total | |||||||||||||||||||||||||||||||
Liquids (millions of barrels) |
||||||||||||||||||||||||||||||||||||||||
Revisions |
42 | 31 | 94 | 162 | 74 | (10 | ) | 393 | 247 | – | 640 | |||||||||||||||||||||||||||||
Improved recovery |
– | – | – | – | – | 15 | 15 | – | – | 15 | ||||||||||||||||||||||||||||||
Extensions/discoveries |
5 | – | – | 54 | 71 | 16 | 146 | – | – | 146 | ||||||||||||||||||||||||||||||
Purchases |
– | – | – | – | – | – | – | – | – | – | ||||||||||||||||||||||||||||||
Sales |
(1 | ) | – | (2 | ) | – | – | – | (3 | ) | – | – | (3 | ) | ||||||||||||||||||||||||||
Total additions before price/cost effects |
46 | 31 | 92 | 216 | 145 | 21 | 551 | 247 | – | 798 | ||||||||||||||||||||||||||||||
Remove 2008 price/cost effects |
105 | (8 | ) | 6 | (133 | ) | (105 | ) | (81 | ) | (216 | ) | 42 | – | (174 | ) | ||||||||||||||||||||||||
2009 price/cost effects |
(11 | ) | (3 | ) | (2 | ) | (63 | ) | (40 | ) | (14 | ) | (133 | ) | 43 | (19 | ) | (109 | ) | |||||||||||||||||||||
Total additions |
140 | 20 | 96 | 20 | – | (74 | ) | 202 | 332 | (19 | ) | 515 | ||||||||||||||||||||||||||||
Production |
139 | 30 | 139 | 250 | 178 | 66 | 802 | 44 | 24 | 870 | ||||||||||||||||||||||||||||||
Net change |
1 | (10 | ) | (43 | ) | (230 | ) | (178 | ) | (140 | ) | (600 | ) | 288 | (43 | ) | (355 | ) | ||||||||||||||||||||||
Reserves replacement ratio, excluding sales (percent) |
34 | 103 | 68 | 86 | 81 | 32 | 69 | 561 | – | 92 | ||||||||||||||||||||||||||||||
Reserves replacement ratio, including sales (percent) |
33 | 103 | 66 | 86 | 81 | 32 | 69 | 561 | – | 92 | ||||||||||||||||||||||||||||||
Reserves replacement ratio, including sales and
price/cost effects (percent) |
101 | 67 | 69 | 8 | – | (112 | ) | 25 | 755 | – | 59 | |||||||||||||||||||||||||||||
Natural Gas (billions of cubic feet) |
||||||||||||||||||||||||||||||||||||||||
Revisions |
(29 | ) | 161 | 263 | 45 | 833 | 8 | 1,281 | ||||||||||||||||||||||||||||||||
Improved recovery |
– | – | – | – | – | – | – | |||||||||||||||||||||||||||||||||
Extensions/discoveries |
294 | – | 18 | – | 5,507 | 11 | 5,830 | |||||||||||||||||||||||||||||||||
Purchases |
8 | – | – | – | – | – | 8 | |||||||||||||||||||||||||||||||||
Sales |
(10 | ) | (2 | ) | (1 | ) | – | – | – | (13 | ) | |||||||||||||||||||||||||||||
Total additions before price/cost effects |
263 | 159 | 280 | 45 | 6,340 | 19 | 7,106 | |||||||||||||||||||||||||||||||||
Remove 2008 price/cost effects |
957 | (7 | ) | (187 | ) | – | (993 | ) | (29 | ) | (259 | ) | ||||||||||||||||||||||||||||
2009 price/cost effects |
(736 | ) | 94 | 189 | – | (547 | ) | (23 | ) | (1,023 | ) | |||||||||||||||||||||||||||||
Total additions |
484 | 246 | 282 | 45 | 4,800 | (33 | ) | 5,824 | ||||||||||||||||||||||||||||||||
Production |
572 | 261 | 1,393 | 43 | 1,353 | 74 | 3,696 | |||||||||||||||||||||||||||||||||
Net change |
(88 | ) | (15 | ) | (1,111 | ) | 2 | 3,447 | (107 | ) | 2,128 | |||||||||||||||||||||||||||||
Reserves replacement ratio, excluding sales (percent) |
48 | 62 | 20 | 105 | 469 | 26 | 193 | |||||||||||||||||||||||||||||||||
Reserves replacement ratio, including sales (percent) |
46 | 61 | 20 | 105 | 469 | 26 | 192 | |||||||||||||||||||||||||||||||||
Reserves replacement ratio, including sales and
price/cost effects (percent) |
85 | 94 | 20 | 105 | 355 | (45 | ) | 158 | ||||||||||||||||||||||||||||||||
| (1) | The data shown above and on the preceding pages include reserves, production, and costs from non-consolidated interests and Canadian oil sands operations. |
| (2) | See Frequently Used Terms on pages 100 through 103. |
| (3) | The term “sales” includes the impact of expropriation of proved reserves in Venezuela (462 million oil-equivalent barrels) in 2007. |
| (4) | Calculation based on exploration and production costs divided by oil-equivalent reserves additions. All values exclude the impact of asset sales; i.e., reserves sold and proceeds received; and price/cost related effects. |
 |
EXXON MOBIL CORPORATION • 2009 FINANCIAL & OPERATING REVIEW 73
| Average | ||||||||||||||||||||||||
| 2009 | 2008 | 2007 | 2006 | 2005 | 2005-2009 | |||||||||||||||||||
Non-U.S. |
||||||||||||||||||||||||
E&P costs (millions of dollars) |
17,985 | 14,095 | 11,227 | 12,111 | 10,442 | 13,172 | ||||||||||||||||||
Liquids reserves additions |
375 | 1,933 | 368 | 1,417 | 794 | 977 | ||||||||||||||||||
Liquids production |
731 | 747 | 812 | 827 | 747 | 773 | ||||||||||||||||||
Gas reserves additions |
5,340 | 2,099 | 2,685 | 5,319 | 8,145 | 4,718 | ||||||||||||||||||
Gas production |
3,124 | 3,075 | 3,101 | 3,018 | 2,959 | 3,056 | ||||||||||||||||||
Oil-equivalent reserves additions, excluding sales |
1,894 | 1,604 | 1,281 | 2,172 | 1,918 | 1,774 | ||||||||||||||||||
Oil-equivalent reserves additions, including sales |
1,892 | 1,510 | 803 | 2,118 | 1,766 | 1,618 | ||||||||||||||||||
Oil-equivalent reserves additions, including sales and year-end price/cost effects |
N.A. | 2,283 | 815 | 2,303 | 2,151 | N.A. | ||||||||||||||||||
Oil-equivalent reserves additions, including sales and average price/year-end cost effects |
1,264 | N.A. | N.A. | N.A. | N.A. | N.A. | ||||||||||||||||||
Oil-equivalent production |
1,252 | 1,259 | 1,329 | 1,330 | 1,240 | 1,282 | ||||||||||||||||||
Reserves replacement ratio, excluding sales (percent) |
151 | 127 | 96 | 163 | 155 | 138 | ||||||||||||||||||
Reserves replacement ratio, including sales (percent) |
151 | 120 | 60 | 159 | 142 | 126 | ||||||||||||||||||
Reserves replacement ratio, including sales and year-end price/cost effects (percent) |
N.A. | 181 | 61 | 173 | 173 | N.A. | ||||||||||||||||||
Reserves replacement ratio, including sales and average price/year-end cost effects (percent) |
101 | N.A. | N.A. | N.A. | N.A. | N.A. | ||||||||||||||||||
Reserves replacement costs(4) (dollars per barrel) |
9.50 | 8.79 | 8.76 | 5.58 | 5.44 | 7.43 | ||||||||||||||||||
United States |
||||||||||||||||||||||||
E&P costs (millions of dollars) |
3,541 | 3,473 | 2,299 | 2,274 | 1,992 | 2,716 | ||||||||||||||||||
Liquids reserves additions |
140 | (122 | ) | 91 | (102 | ) | (299 | ) | (58 | ) | ||||||||||||||
Liquids production |
139 | 132 | 141 | 149 | 170 | 146 | ||||||||||||||||||
Gas reserves additions |
484 | (845 | ) | 1,767 | (930 | ) | 2,134 | 522 | ||||||||||||||||
Gas production |
572 | 562 | 649 | 718 | 775 | 655 | ||||||||||||||||||
Oil-equivalent reserves additions, excluding sales |
93 | 28 | 800 | (117 | ) | 73 | 175 | |||||||||||||||||
Oil-equivalent reserves additions, including sales |
90 | 22 | 788 | (167 | ) | (40 | ) | 138 | ||||||||||||||||
Oil-equivalent reserves additions, including sales and year-end price/cost effects |
N.A. | (263 | ) | 386 | (257 | ) | 57 | N.A. | ||||||||||||||||
Oil-equivalent reserves additions, including sales and average price/year-end cost effects |
221 | N.A. | N.A. | N.A. | N.A. | N.A. | ||||||||||||||||||
Oil-equivalent production |
234 | 226 | 249 | 268 | 299 | 255 | ||||||||||||||||||
Reserves replacement ratio, excluding sales (percent) |
40 | 12 | 321 | – | 24 | 69 | ||||||||||||||||||
Reserves replacement ratio, including sales (percent) |
38 | 10 | 316 | – | – | 54 | ||||||||||||||||||
Reserves replacement ratio, including sales and year-end price/cost effects (percent) |
N.A. | – | 155 | – | 19 | N.A. | ||||||||||||||||||
Reserves replacement ratio, including sales and average price/year-end cost effects (percent) |
94 | N.A. | N.A. | N.A. | N.A. | N.A. | ||||||||||||||||||
Reserves replacement costs(4) (dollars per barrel) |
38.08 | 124.04 | 2.87 | – | 27.29 | 15.48 | ||||||||||||||||||
Worldwide |
||||||||||||||||||||||||
E&P costs (millions of dollars) |
21,526 | 17,568 | 13,526 | 14,385 | 12,434 | 15,888 | ||||||||||||||||||
Liquids reserves additions |
515 | 1,811 | 459 | 1,315 | 495 | 919 | ||||||||||||||||||
Liquids production |
870 | 879 | 953 | 976 | 917 | 919 | ||||||||||||||||||
Gas reserves additions |
5,824 | 1,254 | 4,452 | 4,389 | 10,279 | 5,240 | ||||||||||||||||||
Gas production |
3,696 | 3,637 | 3,750 | 3,736 | 3,734 | 3,711 | ||||||||||||||||||
Oil-equivalent reserves additions, excluding sales |
1,987 | 1,632 | 2,081 | 2,055 | 1,991 | 1,949 | ||||||||||||||||||
Oil-equivalent reserves additions, including sales |
1,982 | 1,532 | 1,591 | 1,951 | 1,726 | 1,756 | ||||||||||||||||||
Oil-equivalent reserves additions, including sales
and year-end price/cost effects |
N.A. | 2,020 | 1,201 | 2,046 | 2,208 | N.A. | ||||||||||||||||||
Oil-equivalent reserves additions, including sales
and average price/year-end cost effects |
1,485 | N.A. | N.A. | N.A. | N.A. | N.A. | ||||||||||||||||||
Oil-equivalent production |
1,486 | 1,485 | 1,578 | 1,598 | 1,539 | 1,537 | ||||||||||||||||||
Reserves replacement ratio, excluding sales (percent) |
134 | 110 | 132 | 129 | 129 | 127 | ||||||||||||||||||
Reserves replacement ratio, including sales (percent) |
133 | 103 | 101 | 122 | 112 | 114 | ||||||||||||||||||
Reserves replacement ratio, including sales
and year-end price/cost effects (percent) |
N.A. | 136 | 76 | 128 | 143 | N.A. | ||||||||||||||||||
Reserves replacement ratio, including sales
and average price/year-end cost effects (percent) |
100 | N.A. | N.A. | N.A. | N.A. | N.A. | ||||||||||||||||||
Reserves replacement costs(4) (dollars per barrel) |
10.83 | 10.76 | 6.50 | 7.00 | 6.25 | 8.15 | ||||||||||||||||||
| See footnotes on page 72. | ||
 |
74 EXXON MOBIL CORPORATION • 2009 FINANCIAL & OPERATING REVIEW
| Total Revenues and Costs, Including Non-Consolidated Interests and Oil Sands | Revenues and Costs per Unit of Sales or Production(1) | |||||||||||||||||||||||||||||||||||||||||||
| Asia | ||||||||||||||||||||||||||||||||||||||||||||
| Canada/ | Pacific/ | Canada/ | ||||||||||||||||||||||||||||||||||||||||||
| United | South | Middle | Russia/ | United | South | Outside | ||||||||||||||||||||||||||||||||||||||
| States | America | Europe | Africa | East | Caspian | Total | States | America | Americas | Worldwide | ||||||||||||||||||||||||||||||||||
| 2009 | (millions of dollars) | (dollars per unit of sales) | ||||||||||||||||||||||||||||||||||||||||||
Revenue |
||||||||||||||||||||||||||||||||||||||||||||
Liquids |
7,573 | 5,135 | 7,739 | 14,868 | 10,839 | 3,413 | 49,567 | 54.02 | 51.88 | 58.53 | 57.04 | |||||||||||||||||||||||||||||||||
Natural gas |
1,442 | 748 | 9,080 | 12 | 4,490 | 88 | 15,860 | 3.10 | 3.19 | 5.09 | 4.69 | |||||||||||||||||||||||||||||||||
| (dollars per barrel of net oil-equivalent production) | ||||||||||||||||||||||||||||||||||||||||||||
Total revenue |
9,015 | 5,883 | 16,819 | 14,880 | 15,329 | 3,501 | 65,427 | 41.41 | 43.02 | 46.74 | 45.58 | |||||||||||||||||||||||||||||||||
Less costs: |
||||||||||||||||||||||||||||||||||||||||||||
Production costs
excluding taxes |
2,736 | 2,428 | 2,923 | 2,027 | 1,518 | 366 | 11,998 | 12.57 | 17.75 | 6.32 | 8.36 | |||||||||||||||||||||||||||||||||
Depreciation and depletion |
1,833 | 948 | 2,246 | 2,293 | 829 | 548 | 8,697 | 8.42 | 6.93 | 5.47 | 6.06 | |||||||||||||||||||||||||||||||||
Exploration expenses |
220 | 339 | 387 | 662 | 340 | 86 | 2,034 | 1.01 | 2.48 | 1.36 | 1.42 | |||||||||||||||||||||||||||||||||
Taxes other than income |
767 | 78 | 2,826 | 1,343 | 3,247 | 116 | 8,377 | 3.52 | 0.57 | 6.97 | 5.83 | |||||||||||||||||||||||||||||||||
Related income tax |
1,127 | 597 | 5,179 | 4,667 | 5,548 | 632 | 17,750 | 5.18 | 4.37 | 14.83 | 12.37 | |||||||||||||||||||||||||||||||||
Results of producing activities |
2,332 | 1,493 | 3,258 | 3,888 | 3,847 | 1,753 | 16,571 | 10.71 | 10.92 | 11.79 | 11.54 | |||||||||||||||||||||||||||||||||
Other earnings(2) |
565 | (605 | ) | 325 | 81 | 111 | (161 | ) | 316 | 2.60 | (4.43 | ) | 0.33 | 0.22 | ||||||||||||||||||||||||||||||
Total earnings, excluding
power and coal |
2,897 | 888 | 3,583 | 3,969 | 3,958 | 1,592 | 16,887 | 13.31 | 6.49 | 12.12 | 11.76 | |||||||||||||||||||||||||||||||||
Power and coal |
(4 | ) | – | – | – | 224 | – | 220 | ||||||||||||||||||||||||||||||||||||
Total earnings |
2,893 | 888 | 3,583 | 3,969 | 4,182 | 1,592 | 17,107 | |||||||||||||||||||||||||||||||||||||
| 2008 | (millions of dollars) | (dollars per unit of sales) | ||||||||||||||||||||||||||||||||||||||||||
Revenue |
||||||||||||||||||||||||||||||||||||||||||||
Liquids |
11,788 | 8,540 | 13,910 | 20,606 | 17,095 | 5,304 | 77,243 | 87.95 | 81.43 | 91.66 | 89.84 | |||||||||||||||||||||||||||||||||
Natural gas |
3,296 | 1,834 | 15,230 | 39 | 7,327 | 67 | 27,793 | 7.23 | 7.82 | 8.59 | 8.35 | |||||||||||||||||||||||||||||||||
| (dollars per barrel of net oil-equivalent production) | ||||||||||||||||||||||||||||||||||||||||||||
Total revenue |
15,084 | 10,374 | 29,140 | 20,645 | 24,422 | 5,371 | 105,036 | 71.73 | 71.23 | 73.74 | 73.19 | |||||||||||||||||||||||||||||||||
Less costs: |
||||||||||||||||||||||||||||||||||||||||||||
Production costs
excluding taxes |
2,675 | 2,625 | 3,051 | 1,603 | 1,267 | 457 | 11,678 | 12.72 | 18.03 | 5.91 | 8.14 | |||||||||||||||||||||||||||||||||
Depreciation and depletion |
1,427 | 1,043 | 2,662 | 2,471 | 906 | 504 | 9,013 | 6.79 | 7.16 | 6.06 | 6.28 | |||||||||||||||||||||||||||||||||
Exploration expenses |
189 | 251 | 183 | 439 | 341 | 60 | 1,463 | 0.90 | 1.72 | 0.95 | 1.02 | |||||||||||||||||||||||||||||||||
Taxes other than income |
2,021 | 81 | 4,248 | 1,815 | 6,017 | 105 | 14,287 | 9.61 | 0.55 | 11.29 | 9.95 | |||||||||||||||||||||||||||||||||
Related income tax |
3,191 | 1,813 | 11,979 | 8,119 | 9,926 | 1,164 | 36,192 | 15.17 | 12.45 | 28.90 | 25.22 | |||||||||||||||||||||||||||||||||
Results of producing activities |
5,581 | 4,561 | 7,017 | 6,198 | 5,965 | 3,081 | 32,403 | 26.54 | 31.32 | 20.63 | 22.58 | |||||||||||||||||||||||||||||||||
Other earnings(2) |
687 | (997 | ) | 2,860 | 212 | (4 | ) | (12 | ) | 2,746 | 3.27 | (6.85 | ) | 2.83 | 1.91 | |||||||||||||||||||||||||||||
Total earnings, excluding
power and coal |
6,268 | 3,564 | 9,877 | 6,410 | 5,961 | 3,069 | 35,149 | 29.81 | 24.47 | 23.46 | 24.49 | |||||||||||||||||||||||||||||||||
Power and coal |
(25 | ) | – | – | – | 278 | – | 253 | ||||||||||||||||||||||||||||||||||||
Total earnings |
6,243 | 3,564 | 9,877 | 6,410 | 6,239 | 3,069 | 35,402 | |||||||||||||||||||||||||||||||||||||
| (1) | The per-unit data are divided into two sections: (a) revenue per unit of sales from ExxonMobil’s own production; and, (b) operating costs and earnings per unit of net oil-equivalent production. Units for crude oil and natural gas liquids are barrels, while units for natural gas are thousands of cubic feet. The volumes of crude oil and natural gas liquids production and net natural gas production available for sale used in this calculation are shown on pages 66 and 67. The volumes of natural gas were converted to oil-equivalent barrels based on a conversion factor of 6 thousand cubic feet per barrel. |
| (2) | Includes earnings related to transportation operations, LNG liquefaction and transportation operations, sale of third-party purchases, technical services agreements, other nonoperating activities, and adjustments for minority interests. |
 |
EXXON MOBIL CORPORATION • 2009 FINANCIAL & OPERATING REVIEW 75
| Total Revenues and Costs, Including Non-Consolidated Interests and Oil Sands | Revenues and Costs per Unit of Sales or Production(1) | |||||||||||||||||||||||||||||||||||||||||||
| Asia | ||||||||||||||||||||||||||||||||||||||||||||
| Canada / | Pacific / | Canada / | ||||||||||||||||||||||||||||||||||||||||||
| United | South | Middle | Russia / | United | South | Outside | ||||||||||||||||||||||||||||||||||||||
| States | America | Europe | Africa | East | Caspian | Total | States | America | Americas | Worldwide | ||||||||||||||||||||||||||||||||||
| 2007 | (millions of dollars) | (dollars per unit of sales) | ||||||||||||||||||||||||||||||||||||||||||
Revenue |
||||||||||||||||||||||||||||||||||||||||||||
Liquids |
8,997 | 6,569 | 11,986 | 17,834 | 13,153 | 4,477 | 63,016 | 62.86 | 55.27 | 69.32 | 66.58 | |||||||||||||||||||||||||||||||||
Natural gas |
3,176 | 1,704 | 9,911 | 21 | 5,117 | 46 | 19,975 | 5.93 | 5.77 | 5.82 | 5.83 | |||||||||||||||||||||||||||||||||
| (dollars per barrel of net oil-equivalent production) | ||||||||||||||||||||||||||||||||||||||||||||
Total revenue |
12,173 | 8,273 | 21,897 | 17,855 | 18,270 | 4,523 | 82,991 | 52.42 | 49.40 | 55.55 | 54.40 | |||||||||||||||||||||||||||||||||
Less costs: |
||||||||||||||||||||||||||||||||||||||||||||
Production costs
excluding taxes |
2,275 | 2,206 | 3,243 | 1,180 | 1,046 | 383 | 10,333 | 9.80 | 13.17 | 5.20 | 6.77 | |||||||||||||||||||||||||||||||||
Depreciation and depletion |
1,493 | 1,256 | 2,657 | 2,101 | 861 | 540 | 8,908 | 6.43 | 7.50 | 5.47 | 5.85 | |||||||||||||||||||||||||||||||||
Exploration expenses |
282 | 273 | 170 | 470 | 226 | 81 | 1,502 | 1.21 | 1.63 | 0.84 | 0.98 | |||||||||||||||||||||||||||||||||
Taxes other than income |
1,347 | 126 | 2,528 | 1,599 | 4,045 | 86 | 9,731 | 5.80 | 0.75 | 7.33 | 6.38 | |||||||||||||||||||||||||||||||||
Related income tax |
2,429 | 1,190 | 8,190 | 7,263 | 7,437 | 1,034 | 27,543 | 10.46 | 7.11 | 21.25 | 18.05 | |||||||||||||||||||||||||||||||||
Results of producing activities |
4,347 | 3,222 | 5,109 | 5,242 | 4,655 | 2,399 | 24,974 | 18.72 | 19.24 | 15.46 | 16.37 | |||||||||||||||||||||||||||||||||
Other earnings(2) |
609 | (504 | ) | 944 | 277 | (48 | ) | 34 | 1,312 | 2.62 | (3.01 | ) | 1.07 | 0.86 | ||||||||||||||||||||||||||||||
Total earnings, excluding
power and coal |
4,956 | 2,718 | 6,053 | 5,519 | 4,607 | 2,433 | 26,286 | 21.34 | 16.23 | 16.53 | 17.23 | |||||||||||||||||||||||||||||||||
Power and coal |
(86 | ) | – | – | – | 297 | – | 211 | ||||||||||||||||||||||||||||||||||||
Total earnings |
4,870 | 2,718 | 6,053 | 5,519 | 4,904 | 2,433 | 26,497 | |||||||||||||||||||||||||||||||||||||
| 2006 | (millions of dollars) | (dollars per unit of sales) | ||||||||||||||||||||||||||||||||||||||||||
Revenue |
||||||||||||||||||||||||||||||||||||||||||||
Liquids |
8,417 | 6,405 | 11,069 | 17,253 | 11,027 | 2,569 | 56,740 | 55.63 | 50.42 | 60.90 | 58.70 | |||||||||||||||||||||||||||||||||
Natural gas |
3,689 | 1,984 | 11,333 | – | 4,225 | 38 | 21,269 | 6.22 | 5.81 | 6.31 | 6.24 | |||||||||||||||||||||||||||||||||
| (dollars per barrel of net oil-equivalent production) | ||||||||||||||||||||||||||||||||||||||||||||
Total revenue |
12,106 | 8,389 | 22,402 | 17,253 | 15,252 | 2,607 | 78,009 | 48.41 | 45.07 | 51.80 | 50.44 | |||||||||||||||||||||||||||||||||
Less costs: |
||||||||||||||||||||||||||||||||||||||||||||
Production costs
excluding taxes |
2,367 | 2,075 | 2,669 | 965 | 892 | 233 | 9,201 | 9.46 | 11.15 | 4.29 | 5.95 | |||||||||||||||||||||||||||||||||
Depreciation and depletion |
1,264 | 1,123 | 2,354 | 2,096 | 747 | 373 | 7,957 | 5.06 | 6.03 | 5.02 | 5.14 | |||||||||||||||||||||||||||||||||
Exploration expenses |
247 | 172 | 169 | 330 | 157 | 116 | 1,191 | 0.99 | 0.92 | 0.70 | 0.77 | |||||||||||||||||||||||||||||||||
Taxes other than income |
833 | 146 | 2,885 | 1,612 | 5,048 | 66 | 10,590 | 3.33 | 0.79 | 8.66 | 6.85 | |||||||||||||||||||||||||||||||||
Related income tax |
2,711 | 1,258 | 8,667 | 6,878 | 4,687 | 596 | 24,797 | 10.84 | 6.76 | 18.76 | 16.03 | |||||||||||||||||||||||||||||||||
Results of producing activities |
4,684 | 3,615 | 5,658 | 5,372 | 3,721 | 1,223 | 24,273 | 18.73 | 19.42 | 14.37 | 15.70 | |||||||||||||||||||||||||||||||||
Other earnings(2) |
503 | 112 | 891 | 122 | 39 | 3 | 1,670 | 2.01 | 0.60 | 0.95 | 1.08 | |||||||||||||||||||||||||||||||||
Total earnings, excluding
power and coal |
5,187 | 3,727 | 6,549 | 5,494 | 3,760 | 1,226 | 25,943 | 20.74 | 20.02 | 15.32 | 16.78 | |||||||||||||||||||||||||||||||||
Power and coal |
(19 | ) | – | – | – | 306 | – | 287 | ||||||||||||||||||||||||||||||||||||
Total earnings |
5,168 | 3,727 | 6,549 | 5,494 | 4,066 | 1,226 | 26,230 | |||||||||||||||||||||||||||||||||||||
| 2005 | (millions of dollars) | (dollars per unit of sales) | ||||||||||||||||||||||||||||||||||||||||||
Revenue |
||||||||||||||||||||||||||||||||||||||||||||
Liquids |
8,081 | 5,907 | 9,841 | 12,333 | 6,396 | 1,819 | 44,377 | 46.29 | 41.34 | 51.00 | 48.59 | |||||||||||||||||||||||||||||||||
Natural gas |
4,633 | 2,530 | 9,095 | – | 3,165 | 21 | 19,444 | 7.30 | 6.90 | 5.17 | 5.76 | |||||||||||||||||||||||||||||||||
| (dollars per barrel of net oil-equivalent production) | ||||||||||||||||||||||||||||||||||||||||||||
Total revenue |
12,714 | 8,437 | 18,936 | 12,333 | 9,561 | 1,840 | 63,821 | 45.41 | 41.08 | 42.74 | 43.02 | |||||||||||||||||||||||||||||||||
Less costs: |
||||||||||||||||||||||||||||||||||||||||||||
Production costs
excluding taxes |
1,786 | 1,887 | 2,461 | 840 | 624 | 209 | 7,807 | 6.38 | 9.19 | 4.14 | 5.26 | |||||||||||||||||||||||||||||||||
Depreciation and depletion |
1,291 | 1,095 | 2,362 | 1,319 | 716 | 199 | 6,982 | 4.61 | 5.33 | 4.60 | 4.71 | |||||||||||||||||||||||||||||||||
Exploration expenses |
158 | 150 | 77 | 310 | 122 | 164 | 981 | 0.56 | 0.73 | 0.67 | 0.66 | |||||||||||||||||||||||||||||||||
Taxes other than income |
761 | 64 | 2,113 | 1,158 | 2,501 | 57 | 6,654 | 2.72 | 0.31 | 5.84 | 4.49 | |||||||||||||||||||||||||||||||||
Related income tax |
3,138 | 1,815 | 7,130 | 5,143 | 2,596 | 411 | 20,233 | 11.21 | 8.84 | 15.31 | 13.64 | |||||||||||||||||||||||||||||||||
Results of producing activities |
5,580 | 3,426 | 4,793 | 3,563 | 3,002 | 800 | 21,164 | 19.93 | 16.68 | 12.18 | 14.26 | |||||||||||||||||||||||||||||||||
Other earnings(2) |
633 | (131 | ) | 2,101 | 166 | 6 | 109 | 2,884 | 2.26 | (0.64 | ) | 2.39 | 1.95 | |||||||||||||||||||||||||||||||
Total earnings, excluding
power and coal |
6,213 | 3,295 | 6,894 | 3,729 | 3,008 | 909 | 24,048 | 22.19 | 16.04 | 14.57 | 16.21 | |||||||||||||||||||||||||||||||||
Power and coal |
(13 | ) | – | – | – | 314 | – | 301 | ||||||||||||||||||||||||||||||||||||
Total earnings |
6,200 | 3,295 | 6,894 | 3,729 | 3,322 | 909 | 24,349 | |||||||||||||||||||||||||||||||||||||
| See footnotes on page 74. | ||
 |
| • | Maintain best-in-class operations, in all respects | |
| • | Provide quality, valued products and services to our customers | |
| • | Lead Industry In efficiency and effectiveness |
| • | Capitalize on integration with other ExxonMobil businesses | |
| • | Selectively Invest for resilient, advantaged returns | |
| • | Maximize value from leading-edge technologies |
 |
EXXON MOBIL CORPORATION • 2009 FINANCIAL & OPERATING REVIEW 77
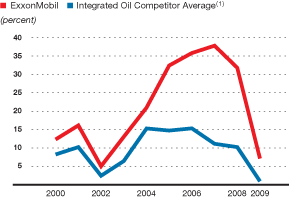
| DOWNSTREAM STATISTICAL RECAP | 2009 | 2008 | 2007 | 2006 | 2005 | |||||||||||||||
Earnings (millions of dollars) |
1,781 | 8,151 | 9,573 | 8,454 | 7,992 | |||||||||||||||
Refinery throughput (thousands of barrels per day) |
5,350 | 5,416 | 5,571 | 5,603 | 5,723 | |||||||||||||||
Petroleum product sales(1) (thousands of barrels per day) |
6,428 | 6,761 | 7,099 | 7,247 | 7,519 | |||||||||||||||
Average capital employed(2) (millions of dollars) |
25,099 | 25,627 | 25,314 | 23,628 | 24,680 | |||||||||||||||
Return on average capital employed(2) (percent) |
7.1 | 31.8 | 37.8 | 35.8 | 32.4 | |||||||||||||||
Capital expenditures (millions of dollars) |
3,196 | 3,529 | 3,303 | 2,729 | 2,495 | |||||||||||||||
| (1) | Petroleum product sales data are reported net of purchases/sales contracts with the same counterparty. |
| (2) | See Frequently Used Terms on pages 100 through 103. |
 |
78 EXXON MOBIL CORPORATION • 2009 FINANCIAL & OPERATING REVIEW
| Largest Global Refiner | ||
Refinery Interests |
37 | |
Distillation Capacity (barrels per day) |
6.3 million | |
Lube Basestock Capacity (barrels per day) |
143 thousand | |
Crude Oil and Product Tanker Interests (>1kDWT) |
11 | |
Major Petroleum Products Terminals |
186 | |
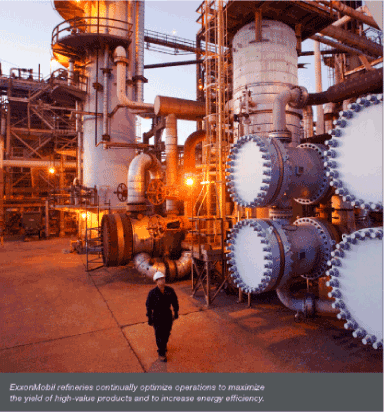
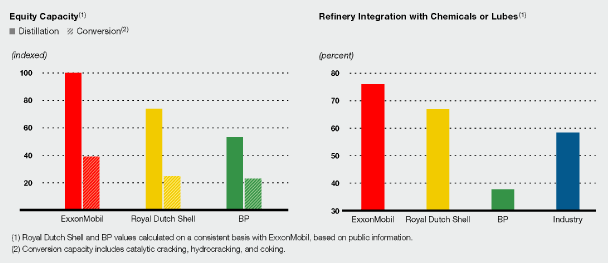
 |
EXXON MOBIL CORPORATION • 2009 FINANCIAL & OPERATING REVIEW 79
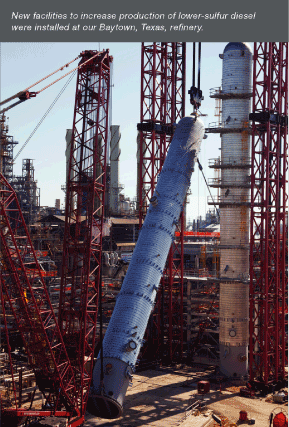
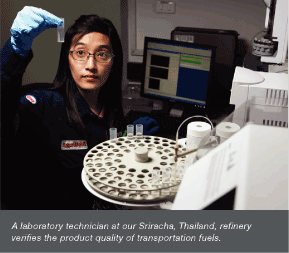
 |
80 EXXON MOBIL CORPORATION • 2009 FINANCIAL & OPERATING REVIEW
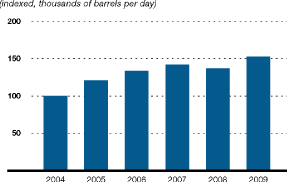
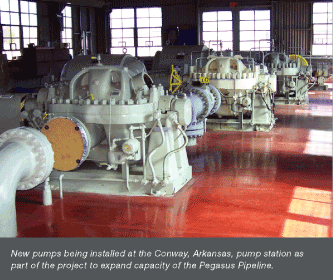
 |
EXXON MOBIL CORPORATION • 2009 FINANCIAL & OPERATING REVIEW 81
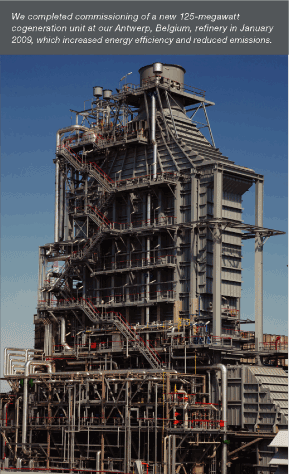
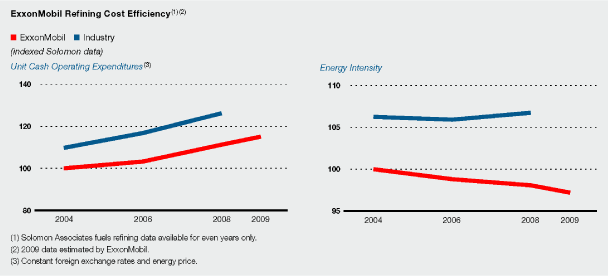
 |
82 EXXON MOBIL CORPORATION • 2009 FINANCIAL & OPERATING REVIEW
| Diverse Customer Base with Global Reach | ||||
Service Stations |
~ 28,000 | |||
Commercial Customers |
1 million | |||
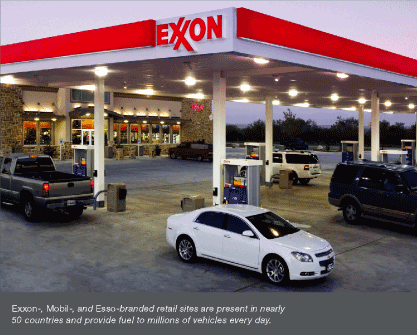
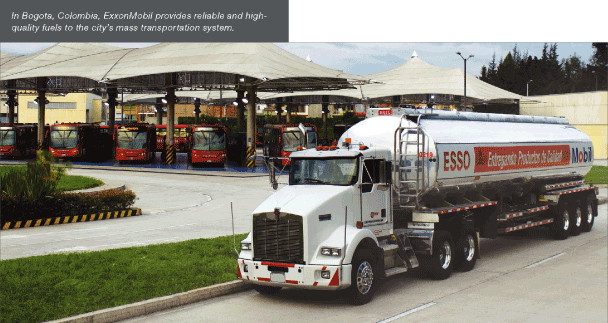
 |
EXXON MOBIL CORPORATION • 2009 FINANCIAL & OPERATING REVIEW 83
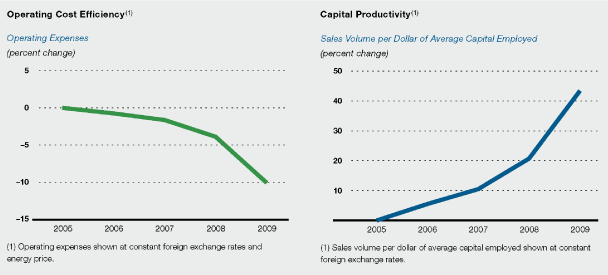
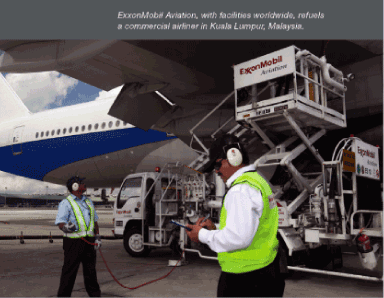
 |
84 EXXON MOBIL CORPORATION • 2009 FINANCIAL & OPERATING REVIEW
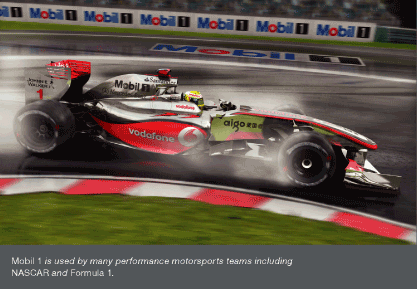
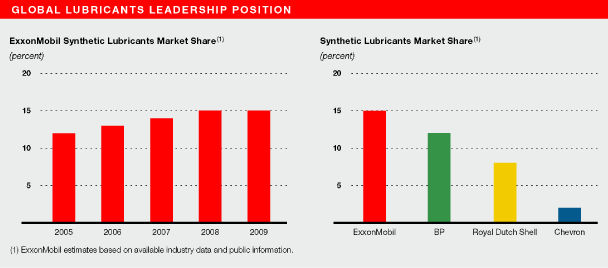
 |
EXXON MOBIL CORPORATION • 2009 FINANCIAL & OPERATING REVIEW 85
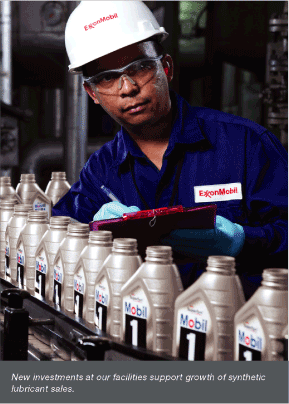

 |
86 EXXON MOBIL CORPORATION • 2009 FINANCIAL & OPERATING REVIEW
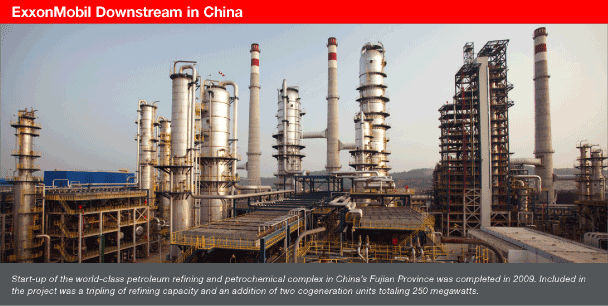
|
Refining
In 2009, ExxonMobil and our partners completed the new world-class Fujian Refining and
Petrochemical Complex. The joint venture, consisting of Sinopec, Fujian Province, Saudi Aramco, and
ExxonMobil, is China’s first fully integrated refining, petrochemical, and fuels marketing project
with foreign participation. Tripling Fujian’s existing refining capacity from 80 to 240 thousand
barrels per day, the refinery will primarily refine and process sour Arabian crude. Support
operations include a 300,000 tonne crude berth and a 250-megawatt cogeneration plant that will
provide more than 50 percent of the power needs in the complex. In addition, the grassroots
petrochemical complex features an 800-thousand-tonnes-per-year ethylene steam cracker, an
800-thousand-tonnes-per-year polyethylene unit, a 400-thousand-tonnes-per-year polypropylene unit,
and facilities to produce 700 thousand tonnes per year of paraxylene.
Fuels Marketing
A second joint venture, owned by Sinopec, ExxonMobil, and Saudi Aramco, is developing Fujian’s
fuels marketing infrastructure. This venture markets diesel and motor-gasoline produced by the
refinery through a network of distribution terminals and more than 750 service stations.
Lubricants and Specialties
Within our Lubricants and Specialties business, we manufacture, market, and sell finished
lubricants in China. We produce a full range of premium quality lubricants at two lube oil blend
plants and distribute our products using a network of key distributors. In 2009, we opened our
1000th Mobil 1 Lube Change Center. We continue to expand our network of these centers to serve a
rapidly growing base of car owners in China. ExxonMobil Lubricants & Specialties has a strategy to
invest in high-opportunity markets such as China.
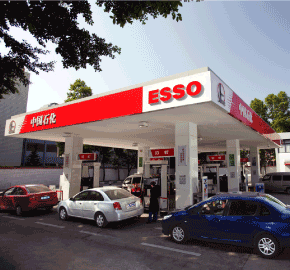
|
 |
EXXON MOBIL CORPORATION • 2009 FINANCIAL & OPERATING REVIEW 87
| 2009 | 2008 | 2007 | 2006 | 2005 | ||||||||||||||||
Refinery Throughput(2)
(thousands of barrels per day) |
||||||||||||||||||||
United States |
1,767 | 1,702 | 1,746 | 1,760 | 1,794 | |||||||||||||||
Canada |
413 | 446 | 442 | 442 | 466 | |||||||||||||||
Europe |
1,548 | 1,601 | 1,642 | 1,672 | 1,672 | |||||||||||||||
Japan |
556 | 563 | 618 | 649 | 691 | |||||||||||||||
Asia Pacific excluding Japan |
772 | 789 | 798 | 785 | 799 | |||||||||||||||
Middle East/Latin America/Other |
294 | 315 | 325 | 295 | 301 | |||||||||||||||
Total worldwide |
5,350 | 5,416 | 5,571 | 5,603 | 5,723 | |||||||||||||||
Average Refinery Capacity(3)
(thousands of barrels per day) |
||||||||||||||||||||
United States |
1,970 | 1,967 | 1,963 | 1,957 | 1,949 | |||||||||||||||
Canada |
502 | 502 | 502 | 502 | 502 | |||||||||||||||
Europe |
1,742 | 1,740 | 1,759 | 1,817 | 1,803 | |||||||||||||||
Japan |
680 | 702 | 769 | 769 | 769 | |||||||||||||||
Asia Pacific excluding Japan |
1,006 | 992 | 983 | 971 | 997 | |||||||||||||||
Middle East/Latin America/Other |
331 | 330 | 330 | 329 | 323 | |||||||||||||||
Total worldwide |
6,231 | 6,233 | 6,306 | 6,345 | 6,343 | |||||||||||||||
Utilization of Refining Capacity (percent) |
||||||||||||||||||||
United States |
90 | 87 | 89 | 90 | 92 | |||||||||||||||
Canada |
82 | 89 | 88 | 88 | 93 | |||||||||||||||
Europe |
89 | 92 | 93 | 92 | 93 | |||||||||||||||
Japan |
82 | 80 | 80 | 84 | 90 | |||||||||||||||
Asia Pacific excluding Japan |
77 | 80 | 81 | 81 | 80 | |||||||||||||||
Middle East/Latin America/Other |
89 | 95 | 98 | 90 | 93 | |||||||||||||||
Total worldwide |
86 | 87 | 88 | 88 | 90 | |||||||||||||||
| (1) | Excludes ExxonMobil’s interest in the Laffan Refinery in Qatar and ExxonMobil’s minor interests in certain small refineries. |
| (2) | Refinery throughput includes 100 percent of crude oil and feedstocks sent directly to atmospheric distillation units in operations of ExxonMobil and majority-owned subsidiaries. For companies owned 50 percent or less, throughput includes the greater of either crude and feedstocks processed for ExxonMobil or ExxonMobil’s equity interest in raw material inputs. |
| (3) | Refinery capacity is the stream-day capability to process inputs to atmospheric distillation units under normal operating conditions, less the impact of shutdowns for regular repair and maintenance activities, averaged over an extended period of time. These annual averages include partial-year impacts for capacity additions or deletions during the year. Any idle capacity that cannot be made operable in a month or less has been excluded. Capacity volumes include 100 percent of the capacity of refinery facilities managed by ExxonMobil or majority-owned subsidiaries. At facilities of companies owned 50 percent or less, the greater of either that portion of capacity normally available to ExxonMobil or ExxonMobil’s equity interest is included. |
| 2009 |
Location | |||
Import Facilities |
Campana, Argentina | |||
Distillate Hydrotreater Upgrade |
Strathcona, Canada | |||
Gasoil
Hydrotreater and Hydrocracker |
Fujian, China | |||
| 2010 (Anticipated) | Location | |||
Distillate Hydrotreater |
Antwerp, Belgium | |||
Distillate Hydrotreater |
Baton Rouge, Louisiana | |||
Distillate Hydrotreater |
Baytown, Texas | |||
 |
88 EXXON MOBIL CORPORATION • 2009 FINANCIAL & OPERATING REVIEW
| ExxonMobil | Capacity at 100% | ExxonMobil | |||||||||||||||||||||||||||||||||||
| Share | Atmospheric | Catalytic | Residuum | Interest | |||||||||||||||||||||||||||||||||
| (thousands of barrels per day) | KBD(2) | Distillation | Cracking | Hydrocracking | Conversion(3) | Lubricants(4) | % | ||||||||||||||||||||||||||||||
| United States | |||||||||||||||||||||||||||||||||||||
Torrance |
California | l | 150 | 150 | 83 | 21 | 52 | 0 | 100 | ||||||||||||||||||||||||||||
Joliet |
Illinois | l | 5 | 238 | 238 | 94 | 0 | 56 | 0 | 100 | |||||||||||||||||||||||||||
Baton Rouge |
Louisiana | n | l | 504 | 504 | 231 | 25 | 116 | 16 | 100 | |||||||||||||||||||||||||||
Chalmette |
Louisiana | l | 5 | 97 | 193 | 72 | 19 | 38 | 0 | 50 | |||||||||||||||||||||||||||
Billings |
Montana | l | 60 | 60 | 21 | 6 | 10 | 0 | 100 | ||||||||||||||||||||||||||||
Baytown |
Texas | n | l | 576 | 576 | 205 | 26 | 88 | 22 | 100 | |||||||||||||||||||||||||||
Beaumont |
Texas | n | l | 345 | 345 | 113 | 60 | 46 | 10 | 100 | |||||||||||||||||||||||||||
Total United States |
1,970 | 2,066 | 819 | 157 | 406 | 48 | |||||||||||||||||||||||||||||||
| Canada | |||||||||||||||||||||||||||||||||||||
Strathcona |
Alberta | 187 | 187 | 63 | 0 | 0 | 2 | 69.6 | |||||||||||||||||||||||||||||
Dartmouth |
Nova Scotia | 5 | 82 | 82 | 31 | 0 | 0 | 0 | 69.6 | ||||||||||||||||||||||||||||
Nanticoke |
Ontario | 5 | 112 | 112 | 48 | 0 | 0 | 0 | 69.6 | ||||||||||||||||||||||||||||
Sarnia |
Ontario | n | l | 121 | 121 | 30 | 18 | 25 | 6 | 69.6 | |||||||||||||||||||||||||||
Total Canada |
502 | 502 | 172 | 18 | 25 | 8 | |||||||||||||||||||||||||||||||
| Europe | |||||||||||||||||||||||||||||||||||||
Antwerp |
Belgium | n | l | 305 | 305 | 35 | 0 | 0 | 0 | 100 | |||||||||||||||||||||||||||
Dunkirk |
France | 0 | 0 | 0 | 0 | 0 | 6 | 60 | |||||||||||||||||||||||||||||
Fos-sur-Mer |
France | l | 5 | 119 | 119 | 31 | 0 | 0 | 0 | 82.9 | |||||||||||||||||||||||||||
Port-Jerome- |
|||||||||||||||||||||||||||||||||||||
Gravenchon |
France | n | l | 233 | 233 | 39 | 0 | 0 | 13 | 82.9 | |||||||||||||||||||||||||||
Karlsruhe |
Germany | l | 5 | 78 | 310 | 86 | 0 | 29 | 0 | 25 | |||||||||||||||||||||||||||
Augusta |
Italy | l | 5 | 198 | 198 | 50 | 0 | 0 | 14 | 100 | |||||||||||||||||||||||||||
Trecate |
Italy | l | 5 | 174 | 174 | 34 | 0 | 0 | 0 | 75.4 | |||||||||||||||||||||||||||
Rotterdam |
The Netherlands | n | l | 191 | 191 | 0 | 52 | 41 | 0 | 100 | |||||||||||||||||||||||||||
Slagen |
Norway | 116 | 116 | 0 | 0 | 32 | 0 | 100 | |||||||||||||||||||||||||||||
Fawley |
United Kingdom | n | l | 329 | 329 | 89 | 0 | 37 | 9 | 100 | |||||||||||||||||||||||||||
Total Europe |
1,743 | 1,975 | 364 | 52 | 139 | 42 | |||||||||||||||||||||||||||||||
| Japan | |||||||||||||||||||||||||||||||||||||
Chiba |
Japan | l | 86 | 172 | 33 | 39 | 0 | 0 | 50 | ||||||||||||||||||||||||||||
Kawasaki |
Japan | n | l | 296 | 296 | 87 | 23 | 0 | 0 | 50 | |||||||||||||||||||||||||||
Sakai |
Japan | l | 5 | 139 | 139 | 40 | 0 | 0 | 0 | 50 | |||||||||||||||||||||||||||
Wakayama |
Japan | l | 5 | 160 | 160 | 37 | 0 | 0 | 7 | 50 | |||||||||||||||||||||||||||
Total Japan |
681 | 767 | 197 | 62 | 0 | 7 | |||||||||||||||||||||||||||||||
| n | Integrated refinery and chemical complex | |
| l | Cogeneration capacity | |
| 5 | Refineries with some chemical production | |
| (1) | Capacity data is based on 100 percent of rated refinery process unit stream-day capacities under normal operating conditions, less the impact of shutdowns for regular repair and maintenance activities, averaged over an extended period of time. | |
| (2) | ExxonMobil share reflects 100 percent of atmospheric distillation capacity in operations of ExxonMobil and majority-owned subsidiaries. For companies owned 50 percent or less, ExxonMobil share is the greater of ExxonMobil’s equity interest or that portion of distillation capacity normally available to ExxonMobil. | |
| (3) | Includes thermal cracking, visbreaking, coking, and hydrorefining processes. | |
| (4) | Lubes capacity based on dewaxed oil production. | |
| (5) | Financial results incorporated into Upstream Qatar business. |

|
EXXON MOBIL CORPORATION • 2009 FINANCIAL & OPERATING REVIEW 89
| ExxonMobil | Capacity at 100% | ExxonMobil | ||||||||||||||||||||||||||||||||||
| Share | Atmospheric | Catalytic | Residuum | Interest | ||||||||||||||||||||||||||||||||
| (thousands of barrels per day) | KBD(1) | Distillation | Cracking | Hydrocracking | Conversion(3) | Lubricants(4) | % | |||||||||||||||||||||||||||||
| Asia Pacific excluding Japan | ||||||||||||||||||||||||||||||||||||
Altona |
Australia | 78 | 78 | 29 | 0 | 0 | 0 | 100 | ||||||||||||||||||||||||||||
Fujian |
China | n | l | 60 | 240 | 38 | 46 | 10 | 0 | 25 | ||||||||||||||||||||||||||
Port Dickson |
Malaysia | 86 | 86 | 0 | 0 | 0 | 0 | 65 | ||||||||||||||||||||||||||||
Whangarei |
New Zealand | 27 | 134 | 0 | 31 | 0 | 0 | 19.2 | ||||||||||||||||||||||||||||
Jurong/PAC |
Singapore | n | l | 605 | 605 | 0 | 36 | 106 | 38 | 100 | ||||||||||||||||||||||||||
Sriracha |
Thailand | n | l | 174 | 174 | 42 | 0 | 0 | 0 | 66 | ||||||||||||||||||||||||||
Total Asia Pacific excluding Japan |
1,030 | 1,317 | 109 | 113 | 116 | 38 | ||||||||||||||||||||||||||||||
| Middle East | ||||||||||||||||||||||||||||||||||||
Laffan(5) |
Qatar | 14 | 139 | 0 | 0 | 0 | 0 | 10 | ||||||||||||||||||||||||||||
Yanbu |
Saudi Arabia | 200 | 400 | 91 | 0 | 46 | 0 | 50 | ||||||||||||||||||||||||||||
Total Middle East |
214 | 539 | 91 | 0 | 46 | 0 | ||||||||||||||||||||||||||||||
| Latin America/Other | ||||||||||||||||||||||||||||||||||||
Campana |
Argentina | l | 5 | 87 | 87 | 27 | 0 | 24 | 0 | 100 | ||||||||||||||||||||||||||
Acajutla |
El Salvador | 22 | 22 | 0 | 0 | 0 | 0 | 65 | ||||||||||||||||||||||||||||
Martinique |
Martinique | 2 | 17 | 0 | 0 | 0 | 0 | 14.5 | ||||||||||||||||||||||||||||
Managua |
Nicaragua | 5 | 20 | 20 | 0 | 0 | 0 | 0 | 100 | |||||||||||||||||||||||||||
Total Latin America/Other |
131 | 146 | 27 | 0 | 24 | 0 | ||||||||||||||||||||||||||||||
| Total worldwide | 6,271 | 7,312 | 1,779 | 402 | 756 | 143 | ||||||||||||||||||||||||||||||
| n | Integrated refinery and chemical complex | |
| l | Cogeneration capacity | |
| 5 | Refineries with some chemical production | |
| (1) | Capacity data is based on 100 percent of rated refinery process unit stream-day capacities under normal operating conditions, less the impact of shutdowns for regular repair and maintenance activities, averaged over an extended period of time. | |
| (2) | ExxonMobil share reflects 100 percent of atmospheric distillation capacity in operations of ExxonMobil and majority-owned subsidiaries. For companies owned 50 percent or less, ExxonMobil share is the greater of ExxonMobil’s equity interest or that portion of distillation capacity normally available to ExxonMobil. | |
| (3) | Includes thermal cracking, visbreaking, coking, and hydrorefining processes. | |
| (4) | Lubes capacity based on dewaxed oil production. | |
| (5) | Financial results incorporated into Upstream Qatar business. |
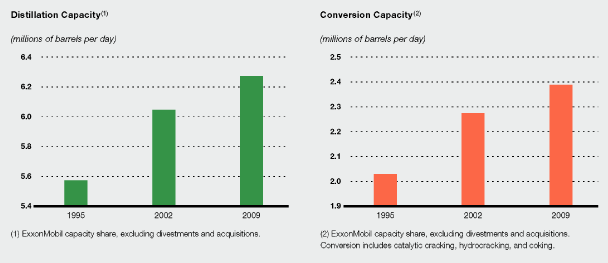
 |
90 EXXON MOBIL CORPORATION • 2009 FINANCIAL & OPERATING REVIEW
| (thousands of barrels per day) | 2009 | 2008 | 2007 | 2006 | 2005 | ||||||||||||||
United States |
|||||||||||||||||||
Motor gasoline, naphthas |
1,425 | 1,449 | 1,601 | 1,598 | 1,646 | ||||||||||||||
Heating oils, kerosene, diesel oils |
517 | 501 | 470 | 520 | 494 | ||||||||||||||
Aviation fuels |
207 | 224 | 235 | 236 | 259 | ||||||||||||||
Heavy fuels |
106 | 108 | 121 | 81 | 90 | ||||||||||||||
Lubricants, specialty, and other petroleum products |
268 | 258 | 290 | 294 | 333 | ||||||||||||||
Total United States |
2,523 | 2,540 | 2,717 | 2,729 | 2,822 | ||||||||||||||
Canada |
|||||||||||||||||||
Motor gasoline, naphthas |
199 | 203 | 207 | 204 | 209 | ||||||||||||||
Heating oils, kerosene, diesel oils |
119 | 131 | 139 | 143 | 145 | ||||||||||||||
Aviation fuels |
23 | 25 | 25 | 24 | 25 | ||||||||||||||
Heavy fuels |
27 | 30 | 33 | 32 | 37 | ||||||||||||||
Lubricants, specialty, and other petroleum products |
45 | 55 | 57 | 70 | 82 | ||||||||||||||
Total Canada |
413 | 444 | 461 | 473 | 498 | ||||||||||||||
Europe |
|||||||||||||||||||
Motor gasoline, naphthas |
409 | 409 | 414 | 427 | 424 | ||||||||||||||
Heating oils, kerosene, diesel oils |
710 | 730 | 723 | 738 | 734 | ||||||||||||||
Aviation fuels |
127 | 149 | 177 | 188 | 182 | ||||||||||||||
Heavy fuels |
175 | 183 | 220 | 202 | 204 | ||||||||||||||
Lubricants, specialty, and other petroleum products |
204 | 241 | 239 | 258 | 280 | ||||||||||||||
Total Europe |
1,625 | 1,712 | 1,773 | 1,813 | 1,824 | ||||||||||||||
Asia Pacific |
|||||||||||||||||||
Motor gasoline, naphthas |
379 | 378 | 403 | 409 | 421 | ||||||||||||||
Heating oils, kerosene, diesel oils |
455 | 467 | 477 | 493 | 535 | ||||||||||||||
Aviation fuels |
116 | 123 | 111 | 106 | 112 | ||||||||||||||
Heavy fuels |
234 | 238 | 276 | 288 | 285 | ||||||||||||||
Lubricants, specialty, and other petroleum products |
145 | 153 | 152 | 165 | 208 | ||||||||||||||
Total Asia Pacific |
1,329 | 1,359 | 1,419 | 1,461 | 1,561 | ||||||||||||||
Latin America |
|||||||||||||||||||
Motor gasoline, naphthas |
83 | 139 | 151 | 160 | 166 | ||||||||||||||
Heating oils, kerosene, diesel oils |
113 | 161 | 173 | 180 | 188 | ||||||||||||||
Aviation fuels |
28 | 45 | 48 | 48 | 47 | ||||||||||||||
Heavy fuels |
33 | 47 | 48 | 55 | 48 | ||||||||||||||
Lubricants, specialty, and other petroleum products |
22 | 27 | 27 | 26 | 24 | ||||||||||||||
Total Latin America |
279 | 419 | 447 | 469 | 473 | ||||||||||||||
Middle East/Africa |
|||||||||||||||||||
Motor gasoline, naphthas |
78 | 76 | 74 | 68 | 91 | ||||||||||||||
Heating oils, kerosene, diesel oils |
99 | 106 | 112 | 117 | 134 | ||||||||||||||
Aviation fuels |
35 | 41 | 45 | 49 | 51 | ||||||||||||||
Heavy fuels |
23 | 30 | 17 | 24 | 25 | ||||||||||||||
Lubricants, specialty, and other petroleum products |
24 | 34 | 34 | 44 | 40 | ||||||||||||||
Total Middle East/Africa |
259 | 287 | 282 | 302 | 341 | ||||||||||||||
Worldwide |
|||||||||||||||||||
Motor gasoline, naphthas |
2,573 | 2,654 | 2,850 | 2,866 | 2,957 | ||||||||||||||
Heating oils, kerosene, diesel oils |
2,013 | 2,096 | 2,094 | 2,191 | 2,230 | ||||||||||||||
Aviation fuels |
536 | 607 | 641 | 651 | 676 | ||||||||||||||
Heavy fuels |
598 | 636 | 715 | 682 | 689 | ||||||||||||||
Lubricants, specialty, and other petroleum products |
708 | 768 | 799 | 857 | 967 | ||||||||||||||
Total worldwide(2) |
6,428 | 6,761 | 7,099 | 7,247 | 7,519 | ||||||||||||||
| (1) | Petroleum product sales include 100 percent of the sales of ExxonMobil and majority-owned subsidiaries, and the ExxonMobil equity interest in sales by companies owned 50 percent or less. | |
| (2) | Net of purchases/sales contracts with the same counterparty. |
 |
EXXON MOBIL CORPORATION • 2009 FINANCIAL & OPERATING REVIEW 91
| (thousands of barrels per day) | 2009 | 2008 | 2007 | 2006 | 2005 | ||||||||||||||
Market and Supply Sales(1) |
|||||||||||||||||||
Market sales |
|||||||||||||||||||
Motor gasoline, naphthas |
1,795 | 1,926 | 2,077 | 2,133 | 2,186 | ||||||||||||||
Heating oils, kerosene, diesel oils |
1,255 | 1,372 | 1,448 | 1,544 | 1,618 | ||||||||||||||
Aviation fuels |
290 | 365 | 408 | 440 | 475 | ||||||||||||||
Heavy fuels |
289 | 329 | 383 | 396 | 387 | ||||||||||||||
Lubricants, specialty, and other petroleum products |
257 | 283 | 297 | 323 | 316 | ||||||||||||||
Total market sales |
3,886 | 4,275 | 4,613 | 4,836 | 4,982 | ||||||||||||||
Total supply sales |
2,542 | 2,486 | 2,486 | 2,411 | 2,537 | ||||||||||||||
Total market and supply sales(2) |
6,428 | 6,761 | 7,099 | 7,247 | 7,519 | ||||||||||||||
| (1) | Market sales are to retail site dealers, consumers (including government and military), jobbers, and small resellers. Supply sales are to large oil marketers, large unbranded resellers, and other oil companies. | |
| (2) | Net of purchases/sales contracts with the same counterparty. |
| (number of sites at year end) | 2009 | 2008 | 2007 | 2006 | 2005 | ||||||||||||||
United States |
|||||||||||||||||||
Owned/leased |
1,921 | 2,155 | 2,225 | 2,375 | 2,544 | ||||||||||||||
Distributors/resellers |
8,295 | 8,296 | 8,679 | 8,742 | 8,992 | ||||||||||||||
Total United States |
10,216 | 10,451 | 10,904 | 11,117 | 11,536 | ||||||||||||||
Canada |
|||||||||||||||||||
Owned/leased |
518 | 557 | 583 | 613 | 690 | ||||||||||||||
Distributors/resellers |
1,326 | 1,314 | 1,327 | 1,327 | 1,288 | ||||||||||||||
Total Canada |
1,844 | 1,871 | 1,910 | 1,940 | 1,978 | ||||||||||||||
Europe |
|||||||||||||||||||
Owned/leased |
4,153 | 4,131 | 4,249 | 4,508 | 4,569 | ||||||||||||||
Distributors/resellers |
2,674 | 2,796 | 2,843 | 2,886 | 3,022 | ||||||||||||||
Total Europe |
6,827 | 6,927 | 7,092 | 7,394 | 7,591 | ||||||||||||||
Asia Pacific |
|||||||||||||||||||
Owned/leased |
2,305 | 2,416 | 2,568 | 2,696 | 2,795 | ||||||||||||||
Distributors/resellers |
3,960 | 4,253 | 4,844 | 5,368 | 5,662 | ||||||||||||||
Total Asia Pacific |
6,265 | 6,669 | 7,412 | 8,064 | 8,457 | ||||||||||||||
Latin America |
|||||||||||||||||||
Owned/leased |
587 | 776 | 1,196 | 1,246 | 1,325 | ||||||||||||||
Distributors/resellers |
1,350 | 1,372 | 2,885 | 3,008 | 3,155 | ||||||||||||||
Total Latin America |
1,937 | 2,148 | 4,081 | 4,254 | 4,480 | ||||||||||||||
Middle East/Africa |
|||||||||||||||||||
Owned/leased |
481 | 481 | 625 | 713 | 933 | ||||||||||||||
Distributors/resellers |
150 | 127 | 362 | 366 | 457 | ||||||||||||||
Total Middle East/Africa |
631 | 608 | 987 | 1,079 | 1,390 | ||||||||||||||
Worldwide |
|||||||||||||||||||
Owned/leased |
9,965 | 10,516 | 11,446 | 12,151 | 12,856 | ||||||||||||||
Distributors/resellers |
17,755 | 18,158 | 20,940 | 21,697 | 22,576 | ||||||||||||||
Total worldwide |
27,720 | 28,674 | 32,386 | 33,848 | 35,432 | ||||||||||||||
 |
92
| • | Focus on businesses that capitalize on core competencies |
| • | Consistently deliver best-in-class performance |
| • | Build proprietary technology positions |
| • | Capture full benefits of integration across ExxonMobil operations |
| • | Selectively invest in advantaged projects |
 |
EXXON MOBIL CORPORATION • 2009 FINANCIAL & OPERATING REVIEW 93
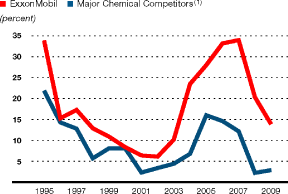
| (1) Includes the chemical segments of Royal Dutch Shell (through 2008), BP (through 2004), and Chevron, as well as Dow Chemical, the sole publicly traded chemical-only competitor with a significant portfolio overlap. Competitor values are estimated on a consistent basis with ExxonMobil, based on public information. | ||
| CHEMICAL STATISTICAL RECAP | 2009 | 2008 | 2007 | 2006 | 2005 | |||||||||||||||
Earnings (millions of dollars) |
2,309 | 2,957 | 4,563 | 4,382 | 3,943 | |||||||||||||||
Prime product sales(1) (thousands of tonnes) |
24,825 | 24,982 | 27,480 | 27,350 | 26,777 | |||||||||||||||
Average capital employed(2) (millions of dollars) |
16,560 | 14,525 | 13,430 | 13,183 | 14,064 | |||||||||||||||
Return on average capital employed(2) (percent) |
13.9 | 20.4 | 34.0 | 33.2 | 28.0 | |||||||||||||||
Capital expenditures (millions of dollars) |
3,148 | 2,819 | 1,782 | 756 | 654 | |||||||||||||||
| (1) | Prime product sales include ExxonMobil’s share of equity-company volumes and finished-product transfers to the Downstream. |
| (2) | See Frequently Used Terms on pages 100 through 103. |
 |
94 EXXON MOBIL CORPORATION • 2009 FINANCIAL & OPERATING REVIEW
Return on Capital Employed (10-year average) |
18 percent | |||
Businesses Ranked 1 or 2 by Market Position |
>90 percent | |||
Average Capital Employed (dollars) |
16.6 billion | |||
Prime Product Sales (tonnes) |
24.8 million | |||
Percent Integrated Capacity |
>90 percent | |||
| Businesses | Worldwide Rank | |||
| Based on Market Position | ||||
n Commodities |
||||
Benzene |
#1 | |||
Paraxylene |
#1 | |||
Olefins |
#2 | |||
Polyethylene |
#2 | |||
Polypropylene |
#5 | |||
n Specialties |
||||
Butyl Polymers |
#1 | |||
Fluids |
#1 | |||
Plasticizers/Oxo Alcohols |
#1 | |||
Synthetics |
#1 | |||
Oriented Polypropylene Films |
#1 | |||
Adhesive Polymers |
#1 | |||
Specialty Elastomers |
#1 | |||
Petroleum Additives |
#2 | |||
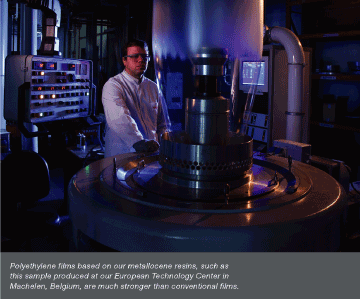
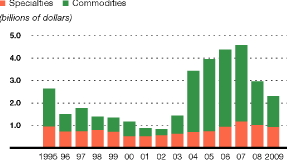
 |
EXXON MOBIL CORPORATION • 2009 FINANCIAL & OPERATING REVIEW 95
| • | Our steam-cracking energy efficiency index achieved best-ever performance in 2009; | |
| • | Our average polyethylene reactor capacity is about two-thirds larger than industry average, allowing us to capture unit cost savings; and, | |
| • | Our maintenance programs give us a competitive advantage in cost and reliability. |
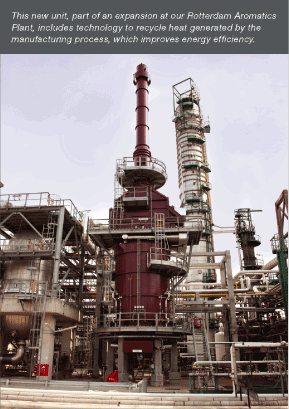
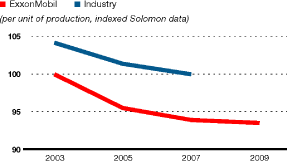
| • | Integrated sites optimize feedstock between the refinery, chemical steam cracker, and aromatics units on a day-by-day or even a cargo-by-cargo basis; | |
| • | Feedstock for our hydrocarbon fluids business comes almost exclusively from our refineries, upgrading the value of the molecules; | |
| • | Our steam crackers have industry-leading flexibility to process a wide range of feedstock which provides the integrated derivative units the lowest cost supply available; and, | |
| • | Common support organizations at our large integrated facilities deliver superior services at lower cost. |
 |
96 EXXON MOBIL CORPORATION • 2009 FINANCIAL & OPERATING REVIEW
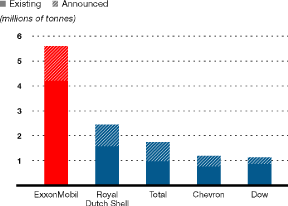
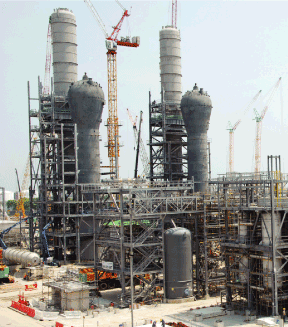
| Capacity Addition (tonnes per year) |
||||
Commodities |
||||
Ethylene |
1,000,000 | |||
Polyethylene |
1,300,000 | |||
Polypropylene |
500,000 | |||
Benzene |
340,000 | |||
Paraxylene |
80,000 | |||
Specialties |
||||
Oxo Alcohols |
125,000 | |||
Specialty Elastomers |
300,000 | |||

 |
EXXON MOBIL CORPORATION • 2009 FINANCIAL & OPERATING REVIEW 97
| • | 300 new steam-cracking feeds qualified around the world over the past several years |
| • | Proprietary technology creates flexibility to run advantaged feeds that conventional plants cannot process |
| • | Advanced tools optimize this flexibility to quickly respond to changes in feedstock quality, availability and cost |
| • | Integrated manufacturing sites upgrade intermediate streams to the highest value |
| • | Polyethylene reactor capacities averaging two-thirds larger than industry average deliver unit cost advantages |
| • | Advanced catalysts applied to our aromatics business expand capacity while consuming much less energy |
| • | Operations and maintenance programs driven by best practices create a cost and reliability advantage |
| • | Metallocene catalyst technology delivers superior products across multiple product families including Exceed and Enable polyethylenes, Vistamaxx specialty elastomers, polypropylene, adhesive polymers, and synthetic lubricants |
| • | Ultra-low aromatic Escaid and Exxsol fluids, based on proprietary technology, help meet increasingly stringent regulatory and environmental requirements for water treatment and oil drilling applications |
| • | Exxcore resins, our latest development in tire inner liners, allow tire weight reduction while improving air retention |
 Lower-Cost
Manufacturing Processes
  Premium Product Development
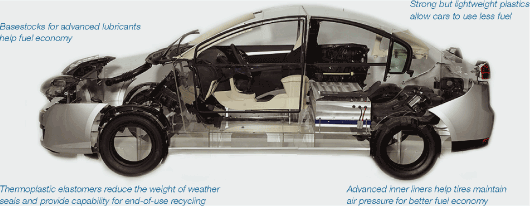
 |
98 EXXON MOBIL CORPORATION • 2009 FINANCIAL & OPERATING REVIEW
| (millions of tonnes per year) | Ethylene | Polyethylene | Polypropylene | Paraxylene | Additional Products | |||||||||||||||
North America |
||||||||||||||||||||
Baton Rouge, Louisiana |
1.0 | 1.3 | 0.4 | – | P B E A | F O | ||||||||||||||
Baytown, Texas |
2.2 | – | 0.8 | 0.6 | P B | F | ||||||||||||||
Beaumont, Texas |
0.8 | 1.0 | – | 0.3 | P | S | ||||||||||||||
Mont Belvieu, Texas |
– | 1.0 | – | – | ||||||||||||||||
Sarnia, Ontario |
0.3 | 0.5 | – | – | P | F O | ||||||||||||||
Europe |
||||||||||||||||||||
Antwerp, Belgium |
0.5 | 0.4 | – | – | P | F O | ||||||||||||||
Fawley, United Kingdom |
0.1 | – | – | – | P B | F O | ||||||||||||||
Fife, United Kingdom |
0.4 | – | – | – | ||||||||||||||||
Meerhout, Belgium |
– | 0.5 | – | – | ||||||||||||||||
Notre-Dame-de- Gravenchon, France |
0.4 | 0.4 | 0.3 | – | P B E A | O S Z | ||||||||||||||
Rotterdam, the Netherlands |
– | – | – | 0.7 | O | |||||||||||||||
Middle East |
||||||||||||||||||||
Al Jubail, Saudi Arabia |
0.6 | 0.6 | – | – | ||||||||||||||||
Yanbu, Saudi Arabia |
1.0 | 0.7 | 0.2 | – | P | |||||||||||||||
Asia Pacific |
||||||||||||||||||||
Fujian, China |
0.2 | 0.2 | 0.1 | 0.2 | P | |||||||||||||||
Kawasaki, Japan |
0.5 | 0.1 | – | – | P B A | F | ||||||||||||||
Singapore |
0.9 | 0.6 | 0.4 | 0.9 | P | F O Z | ||||||||||||||
Sriracha, Thailand |
– | – | – | 0.5 | F | |||||||||||||||
All other |
– | – | – | 0.6 | ||||||||||||||||
Total worldwide |
8.9 | 7.3 | 2.2 | 3.8 | ||||||||||||||||
P Propylene |
B Butyl | E Specialty Elastomers | A Adhesive Polymers | F Fluids | O Oxo Alcohols | S Synthetics | Z Petroleum Additives | |||||||||||||||||||||
| (1) | Based on size or breadth of product slate. |
| (2) | Capacity reflects 100 percent for operations of ExxonMobil and majority-owned subsidiaries. For companies owned 50 percent or less, capacity is ExxonMobil’s interest. |
| Location | Product | ||||
North America |
|||||
Bayway, New Jersey |
n 5 l u | ||||
Belleville, Ontario |
n 5 l u | ||||
Chalmette, Louisiana |
n 5 l u | ||||
Dartmouth, Nova Scotia |
n 5 l u | ||||
Edison, New Jersey |
n 5 l u | ||||
Joliet, Illinois |
n 5 l u | ||||
LaGrange, Georgia |
n 5 l u | ||||
Pensacola, Florida |
n 5 l u | ||||
Plaquemine, Louisiana |
n 5 l u | ||||
Shawnee, Oklahoma |
n 5 l u | ||||
Latin America |
|||||
Campana, Argentina |
n 5 l u | ||||
Managua, Nicaragua |
n 5 l u | ||||
Paulinia, Brazil |
n 5 l u | ||||
| Location | Product | |||
Europe |
||||
Augusta, Italy |
n 5 l u | |||
Berre, France |
n 5 l u | |||
Brindisi, Italy |
n 5 l u | |||
Cologne, Germany |
n 5 l u | |||
Fos-sur-Mer, France |
n 5 l u | |||
Geleen, the Netherlands |
n 5 l u | |||
Karlsruhe, Germany |
n 5 l u | |||
Kerkrade, the Netherlands |
n 5 l u | |||
Newport, United Kingdom |
n 5 l u | |||
Trecate, Italy |
n 5 l u | |||
Vado Ligure, Italy |
n 5 l u | |||
Virton, Belgium |
n 5 l u | |||
| Location | Product | |
Asia Pacific |
||
Adelaide, Australia(2) |
n 5 l u | |
Jinshan, China
|
n 5 l u | |
Kashima, Japan
|
n 5 l u | |
Nasu, Japan
|
n 5 l u | |
Panyu, China
|
n 5 l u | |
Sakai, Japan
|
n 5 l u | |
Wakayama, Japan
|
n 5 l u | |
| (1) | Includes joint-venture plants. | |
| (2) | Facility mothballed. |
 |
EXXON MOBIL CORPORATION • 2009 FINANCIAL & OPERATING REVIEW 99
| Includes ExxonMobil’s share of equity companies | 2009 | 2008 | 2007 | 2006 | 2005 | |||||||||||||||
Worldwide
Production Volumes (thousands of tonnes) |
||||||||||||||||||||
Ethylene |
7,381 | 7,540 | 8,155 | 7,878 | 7,930 | |||||||||||||||
Polyethylene |
6,120 | 6,088 | 6,693 | 6,275 | 6,213 | |||||||||||||||
Polypropylene |
1,864 | 1,897 | 1,897 | 1,815 | 1,680 | |||||||||||||||
Paraxylene |
2,758 | 2,472 | 2,995 | 3,038 | 2,785 | |||||||||||||||
| Prime Product Sales Volumes(1) by Region (thousands of tonnes) | ||||||||||||||||||||
Americas(2) |
10,665 | 10,628 | 12,034 | 11,907 | 11,523 | |||||||||||||||
Europe/Middle East/Africa |
6,433 | 6,635 | 7,463 | 7,497 | 7,310 | |||||||||||||||
Asia Pacific |
7,727 | 7,719 | 7,983 | 7,946 | 7,944 | |||||||||||||||
Total worldwide |
24,825 | 24,982 | 27,480 | 27,350 | 26,777 | |||||||||||||||
| Prime Product Sales Volumes(1) by Business (thousands of tonnes) | ||||||||||||||||||||
Less-cyclical specialty businesses |
5,183 | 5,618 | 6,237 | 6,228 | 6,083 | |||||||||||||||
Olefins/polyolefins/aromatics/other |
19,642 | 19,364 | 21,243 | 21,122 | 20,694 | |||||||||||||||
Total |
24,825 | 24,982 | 27,480 | 27,350 | 26,777 | |||||||||||||||
| (1) | Prime product sales include ExxonMobil’s share of equity-company volumes and finished product transfers to the Downstream. | |
| (2) | Includes North America and Latin America. |
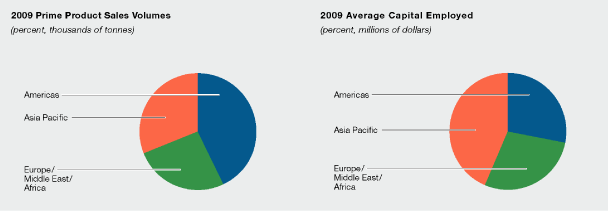
 |
100 EXXON MOBIL CORPORATION • 2009 FINANCIAL & OPERATING REVIEW
| (millions of dollars) | 2009 | 2008 | 2007 | 2006 | 2005 | |||||||||||||||
Reconciliation of Operating Costs |
||||||||||||||||||||
From ExxonMobil’s Consolidated Statement of Income |
||||||||||||||||||||
Total costs and other deductions |
275,809 | 393,962 | 333,073 | 309,182 | 310,449 | |||||||||||||||
Less: |
||||||||||||||||||||
Crude oil and product purchases |
152,806 | 249,454 | 199,498 | 182,546 | 185,219 | |||||||||||||||
Interest expense |
548 | 673 | 400 | 654 | 496 | |||||||||||||||
Sales-based taxes |
25,936 | 34,508 | 31,728 | 30,381 | 30,742 | |||||||||||||||
Other taxes and duties |
34,819 | 41,719 | 40,953 | 39,203 | 41,554 | |||||||||||||||
Subtotal |
61,700 | 67,608 | 60,494 | 56,398 | 52,438 | |||||||||||||||
ExxonMobil’s share of equity-company expenses |
6,670 | 7,204 | 5,619 | 4,947 | 4,520 | |||||||||||||||
Total operating costs |
68,370 | 74,812 | 66,113 | 61,345 | 56,958 | |||||||||||||||
| (millions of dollars) | 2009 | 2008 | 2007 | 2006 | 2005 | |||||||||||||||
Components of Operating Costs |
||||||||||||||||||||
From ExxonMobil’s Consolidated Statement of Income |
||||||||||||||||||||
Production and manufacturing expenses |
33,027 | 37,905 | 31,885 | 29,528 | 26,819 | |||||||||||||||
Selling, general, and administrative expenses |
14,735 | 15,873 | 14,890 | 14,273 | 14,402 | |||||||||||||||
Depreciation and depletion |
11,917 | 12,379 | 12,250 | 11,416 | 10,253 | |||||||||||||||
Exploration expenses, including dry holes |
2,021 | 1,451 | 1,469 | 1,181 | 964 | |||||||||||||||
Subtotal |
61,700 | 67,608 | 60,494 | 56,398 | 52,438 | |||||||||||||||
ExxonMobil’s share of equity-company expenses |
6,670 | 7,204 | 5,619 | 4,947 | 4,520 | |||||||||||||||
Total operating costs |
68,370 | 74,812 | 66,113 | 61,345 | 56,958 | |||||||||||||||
 |
EXXON MOBIL CORPORATION • 2009 FINANCIAL & OPERATING REVIEW 101
| (millions of dollars) | 2009 | 2008 | 2007 | 2006 | 2005 | |||||||||||||||
Business Uses: Asset and Liability Perspective |
||||||||||||||||||||
Total assets |
233,323 | 228,052 | 242,082 | 219,015 | 208,335 | |||||||||||||||
Less liabilities and noncontrolling interests |
||||||||||||||||||||
share of assets and liabilities |
||||||||||||||||||||
Total current liabilities excluding notes and loans payable |
(49,585 | ) | (46,700 | ) | (55,929 | ) | (47,115 | ) | (44,536 | ) | ||||||||||
Total long-term liabilities excluding long-term debt |
(58,741 | ) | (54,404 | ) | (50,543 | ) | (45,905 | ) | (41,095 | ) | ||||||||||
Noncontrolling interests share of assets and liabilities |
(5,642 | ) | (6,044 | ) | (5,332 | ) | (4,948 | ) | (4,863 | ) | ||||||||||
Add ExxonMobil share of debt-financed equity-company net assets |
5,043 | 4,798 | 3,386 | 2,808 | 3,450 | |||||||||||||||
Total capital employed |
124,398 | 125,702 | 133,664 | 123,855 | 121,291 | |||||||||||||||
Total Corporate Sources: Debt and Equity Perspective |
||||||||||||||||||||
Notes and loans payable |
2,476 | 2,400 | 2,383 | 1,702 | 1,771 | |||||||||||||||
Long-term debt |
7,129 | 7,025 | 7,183 | 6,645 | 6,220 | |||||||||||||||
ExxonMobil share of equity |
110,569 | 112,965 | 121,762 | 113,844 | 111,186 | |||||||||||||||
Less noncontrolling interests share of total debt |
(819 | ) | (1,486 | ) | (1,050 | ) | (1,144 | ) | (1,336 | ) | ||||||||||
Add ExxonMobil share of equity-company debt |
5,043 | 4,798 | 3,386 | 2,808 | 3,450 | |||||||||||||||
Total capital employed |
124,398 | 125,702 | 133,664 | 123,855 | 121,291 | |||||||||||||||
| (millions of dollars) | 2009 | 2008 | 2007 | 2006 | 2005 | |||||||||||||||
Return on Average Capital Employed |
||||||||||||||||||||
Net income attributable to ExxonMobil |
19,280 | 45,220 | 40,610 | 39,500 | 36,130 | |||||||||||||||
Financing costs (after tax) |
||||||||||||||||||||
Gross third-party debt |
(303 | ) | (343 | ) | (339 | ) | (264 | ) | (261 | ) | ||||||||||
ExxonMobil share of equity companies |
(285 | ) | (325 | ) | (204 | ) | (156 | ) | (144 | ) | ||||||||||
All other financing costs – net |
(483 | ) | 1,485 | 268 | 499 | (35 | ) | |||||||||||||
Total financing costs |
(1,071 | ) | 817 | (275 | ) | 79 | (440 | ) | ||||||||||||
Earnings excluding financing costs |
20,351 | 44,403 | 40,885 | 39,421 | 36,570 | |||||||||||||||
Average capital employed |
125,050 | 129,683 | 128,760 | 122,573 | 116,961 | |||||||||||||||
Return on average capital employed – corporate total |
16.3% | 34.2% | 31.8% | 32.2% | 31.3% | |||||||||||||||
 |
102 EXXON MOBIL CORPORATION • 2009 FINANCIAL & OPERATING REVIEW
| 2009 | 2008 | 2007 | 2006 | 2005 | ||||||||||||||||
Exploration portion of Upstream capital and
exploration expenditures (millions of dollars) |
3,718 | 2,871 | 1,909 | 2,044 | 1,693 | |||||||||||||||
Proved property acquisition costs (millions of dollars) |
676 | 61 | 37 | 234 | 174 | |||||||||||||||
Total exploration and proved property
acquisition costs (millions of dollars) |
4,394 | 2,932 | 1,946 | 2,278 | 1,867 | |||||||||||||||
Resource additions (millions of oil-equivalent barrels) |
2,860 | 2,230 | 2,010 | 4,270 | 4,365 | |||||||||||||||
Finding and resource-acquisition costs per
oil-equivalent barrel (dollars) |
1.54 | 1.32 | 0.97 | 0.53 | 0.43 | |||||||||||||||
| (billions of oil-equivalent barrels) | 2009 | 2008 | 2007 | 2006 | 2005 | |||||||||||||||
Basis |
||||||||||||||||||||
ExxonMobil |
23.3 | 22.8 | 22.7 | 22.7 | 22.4 | |||||||||||||||
SEC |
23.0 | 23.0 | 22.5 | 22.8 | 22.4 | |||||||||||||||
 |
EXXON MOBIL CORPORATION • 2009 FINANCIAL & OPERATING REVIEW 103
| (millions of dollars) | 2009 | 2008 | 2007 | 2006 | 2005 | |||||||||||||||
Costs incurred |
||||||||||||||||||||
Property acquisition costs |
1,285 | 663 | 194 | 597 | 453 | |||||||||||||||
Exploration costs |
3,111 | 2,272 | 1,762 | 1,685 | 1,420 | |||||||||||||||
Development costs |
17,130 | 14,633 | 11,570 | 12,103 | 10,561 | |||||||||||||||
Total costs incurred |
21,526 | 17,568 | 13,526 | 14,385 | 12,434 | |||||||||||||||
| (millions of dollars) | 2009 | 2008 | 2007 | 2006 | 2005 | |||||||||||||||
Proved oil-equivalent reserves additions |
||||||||||||||||||||
Revisions |
853 | 211 | 1,793 | 390 | 377 | |||||||||||||||
Improved recovery |
15 | 8 | 35 | 29 | 31 | |||||||||||||||
Extensions/discoveries |
1,118 | 1,413 | 251 | 881 | 1,461 | |||||||||||||||
Purchases |
1 | – | 2 | 755 | 122 | |||||||||||||||
Total oil-equivalent reserves additions |
1,987 | 1,632 | 2,081 | 2,055 | 1,991 | |||||||||||||||
Proved reserves replacement costs (dollars per barrel) |
10.83 | 10.76 | 6.50 | 7.00 | 6.25 | |||||||||||||||
| (millions of dollars) | 2009 | 2008 | 2007 | 2006 | 2005 | |||||||||||||||
Net cash provided by operating activities |
28,438 | 59,725 | 52,002 | 49,286 | 48,138 | |||||||||||||||
Sales of subsidiaries, investments and
property, plant and equipment |
1,545 | 5,985 | 4,204 | 3,080 | 6,036 | |||||||||||||||
Cash flow from operations and asset sales |
29,983 | 65,710 | 56,206 | 52,366 | 54,174 | |||||||||||||||
| (millions of dollars) | 2009 | 2008 | 2007 | 2006 | 2005 | |||||||||||||||
Dividends paid to ExxonMobil shareholders |
8,023 | 8,058 | 7,621 | 7,628 | 7,185 | |||||||||||||||
Cost of shares purchased to reduce shares outstanding |
18,000 | 32,000 | 28,000 | 25,000 | 16,000 | |||||||||||||||
Distributions to ExxonMobil shareholders |
26,023 | 40,058 | 35,621 | 32,628 | 23,185 | |||||||||||||||
Memo: Gross cost of shares purchased to offset
shares issued under benefit plans and programs |
1,703 | 3,734 | 3,822 | 4,558 | 2,221 | |||||||||||||||
 |
104 EXXON MOBIL CORPORATION • 2009 FINANCIAL & OPERATING REVIEW
Acreage |
32, 33, 68 | |||
Africa |
41, 42, 43, 45, 56-59 | |||
Asia Pacific |
38, 39, 41, 42, 45, 60-61, 79, 85, 86, 96 | |||
Balance Sheet |
27 | |||
Business strategies |
4-5, 30, 76, 92 | |||
Canada |
16, 17, 33, 38, 39, 41, 42-44, 49-51, 80 | |||
Capital and exploration
expenditures |
24-25, 101 | |||
Capital employed |
23, 101 | |||
Cash flow |
2, 5, 21, 29, 103 | |||
Cash Flow Statement |
29 | |||
Chemical capacity |
98 | |||
Chemical products |
94, 97 | |||
Chemical projects |
86, 96 | |||
Chemical results |
92-93 | |||
Chemical volumes |
99 | |||
Depreciation and depletion |
26, 74-75 | |||
Dividend and shareholder |
21 | |||
distributions |
||||
Downstream results |
76-77 | |||
Earnings |
2, 22, 74-75, 100 | |||
Earnings, oil and gas |
74-75 | |||
Earnings per barrel |
31, 37 | |||
Energy management |
81, 95 | |||
Energy Outlook |
10-13 | |||
Entitlement volumes |
35, 102 | |||
Europe |
33, 38, 39, 40, 41, 42, 43, 52-55, 91 | |||
Exploration captures |
33 | |||
Financial highlights |
2, 3 | |||
Finding and
resource-acquisition costs |
31, 34, 102 | |||
Frequently Used Terms |
100-103 | |||
Fuels Marketing |
82-83, 86 | |||
Fujian Joint Venture |
77, 86, 93 | |||
Heavy oil |
19, 34, 44, 50, 51, 80, 103 | |||
Income Statement |
28 | |||
Integration |
5, 31, 38, 76, 77, 78, 79, 83, 85, 92, 93, 95 | |||
Key financial ratios |
2 | |||
LNG |
12, 13, 34, 38, 39, 40, 42, 60-63 | |||
Lubricants and Specialties |
84-85, 86 | |||
Middle East |
38, 39-41, 60, 62-63, 96 | |||
Molecule Management |
18, 77, 80 | |||
National Content |
45 | |||
Natural gas and power markets |
38, 42 | |||
Operating costs |
26, 81, 100 | |||
Petroleum product sales |
77, 90-91 | |||
Price and spend impacts |
102 | |||
Project execution |
4, 36, 80 | |||
Production sharing contract |
33, 61, 65, 102 | |||
Production volumes |
31, 35, 37, 41, 66-67, 102 | |||
Property, plant and equipment |
26, 101, 103 | |||
Qatar |
38, 39, 41, 42, 62-63, 79, 96 | |||
Refinery utilization |
87 | |||
Refining and Supply |
78-81, 86 | |||
Refining capacity |
87-89 | |||
Reserves and resources |
31, 32, 34, 35, 36, 69-73, 102-103 | |||
Reserves replacement costs |
73, 103 | |||
Reserves replacement ratio |
31, 35, 70-73, 102 | |||
Retail sites |
82, 91 | |||
Return on average capital employed |
2, 23, 31, 77, 93, 101 | |||
Russia/Caspian |
39, 41, 42, 45, 64-65 | |||
Safety, Security, Health, and
Environment |
6-9 | |||
Share purchases |
21, 103 | |||
Shareholder return |
2, 21, 100 | |||
South America |
51 | |||
Technology |
9, 14-20 | |||
Unconventional gas |
34, 38, 43, 48, 51, 54 | |||
United States |
7, 16, 17, 33, 38, 44, 46-48, 79, 80, 82 | |||
Upstream development project summary |
39-41 | |||
Upstream production profile |
35, 41 | |||
Upstream results |
30-31 | |||
Wells, net drilled |
68 |
Data Tables |
||||
Corporate Financial Tables |
||||
Capital and Exploration Expenditures |
24-25 | |||
Capital Employed/ROCE |
23 | |||
Financial Statements |
27-29 | |||
Functional Earnings |
22 | |||
Business
Tables |
||||
Upstream |
66-75 | |||
Downstream |
87-91 | |||
Chemical |
98-99 |
 |
| General Information | ||
| Corporate Headquarters | ||
| Exxon Mobil Corporation | ||
| 5959 Las Colinas Boulevard | ||
| Irving, TX 75039-2298 | ||
| Additional copies may be | ||
| obtained by writing or phoning: | ||
| Phone: 972-444-1000 | ||
| Fax: 972-444-1505 | ||
| Shareholder Relations | ||
| Exxon Mobil Corporation | ||
| P.O. Box 140369 | ||
| Irving, TX 75014-0369 | ||
| Market Information | ||
| The New York Stock Exchange is the principal exchange | ||
| on which Exxon Mobil Corporation common stock | ||
| (symbol XOM) is traded. | ||
| Annual Meeting | ||
| The 2010 Annual Meeting of Shareholders will be held at | ||
| 9:00 a.m. Central Time on Wednesday, May 26, 2010, at: | ||
| The Morton H. Meyerson Symphony Center | ||
| 2301 Flora Street | ||
| Dallas, Texas 75201 | ||
| The meeting will be audiocast live on the Internet. | ||
| Instructions for listening to this audiocast will be | ||
| available on the Internet at exxonmobil.com | ||
| approximately one week prior to the event. | ||
 |
||
| EXXONMOBIL ON THE INTERNET | ||
| A quick, easy way to get information about ExxonMobil | ||
| ExxonMobil publications and important shareholder | ||
| information are available on the Internet at exxonmobil.com: | ||
| • Publications | ||
| • Stock Quote | ||
| • Dividend Information | ||
| • Contact Information | ||
| • Speeches | ||
| • News Releases | ||
| • Investor Presentations | ||
| • Corporate Governance |
 |