FALSE00000340882023Q3--12-31http://fasb.org/us-gaap/2023#OtherAssetsNoncurrent http://fasb.org/us-gaap/2023#ReceivablesNetCurrenthttp://fasb.org/us-gaap/2023#OtherAssetsNoncurrent http://fasb.org/us-gaap/2023#ReceivablesNetCurrenthttp://fasb.org/us-gaap/2023#AccountsPayableAndAccruedLiabilitiesCurrent http://fasb.org/us-gaap/2023#OtherLiabilitiesNoncurrenthttp://fasb.org/us-gaap/2023#AccountsPayableAndAccruedLiabilitiesCurrent http://fasb.org/us-gaap/2023#OtherLiabilitiesNoncurrent00000340882023-01-012023-09-300000034088us-gaap:CommonStockMember2023-01-012023-09-300000034088xom:ZeroPointOneFourTwoPercentNotesDue2024Member2023-01-012023-09-300000034088xom:ZeroPointFiveTwoFourPercentNotesDue2028Member2023-01-012023-09-300000034088xom:ZeroPointEightThreeFivePercentNotesDue2032Member2023-01-012023-09-300000034088xom:OnePointFourZeroEightPercentNotesDue2039Member2023-01-012023-09-3000000340882023-09-30xbrli:shares0000034088xom:SalesAndOtherOperatingRevenueMember2023-07-012023-09-30iso4217:USD0000034088xom:SalesAndOtherOperatingRevenueMember2022-07-012022-09-300000034088xom:SalesAndOtherOperatingRevenueMember2023-01-012023-09-300000034088xom:SalesAndOtherOperatingRevenueMember2022-01-012022-09-300000034088xom:IncomeFromEquityAffiliatesMember2023-07-012023-09-300000034088xom:IncomeFromEquityAffiliatesMember2022-07-012022-09-300000034088xom:IncomeFromEquityAffiliatesMember2023-01-012023-09-300000034088xom:IncomeFromEquityAffiliatesMember2022-01-012022-09-300000034088xom:OtherRevenueMember2023-07-012023-09-300000034088xom:OtherRevenueMember2022-07-012022-09-300000034088xom:OtherRevenueMember2023-01-012023-09-300000034088xom:OtherRevenueMember2022-01-012022-09-3000000340882023-07-012023-09-3000000340882022-07-012022-09-3000000340882022-01-012022-09-30iso4217:USDxbrli:shares00000340882022-12-310000034088us-gaap:RelatedPartyMember2023-09-300000034088us-gaap:RelatedPartyMember2022-12-310000034088us-gaap:NonrelatedPartyMember2023-09-300000034088us-gaap:NonrelatedPartyMember2022-12-3100000340882021-12-3100000340882022-09-300000034088us-gaap:CommonStockMember2022-06-300000034088us-gaap:RetainedEarningsMember2022-06-300000034088us-gaap:AccumulatedOtherComprehensiveIncomeMember2022-06-300000034088us-gaap:TreasuryStockCommonMember2022-06-300000034088us-gaap:ParentMember2022-06-300000034088us-gaap:NoncontrollingInterestMember2022-06-3000000340882022-06-300000034088us-gaap:CommonStockMember2022-07-012022-09-300000034088us-gaap:ParentMember2022-07-012022-09-300000034088us-gaap:NoncontrollingInterestMember2022-07-012022-09-300000034088us-gaap:RetainedEarningsMember2022-07-012022-09-300000034088us-gaap:AccumulatedOtherComprehensiveIncomeMember2022-07-012022-09-300000034088us-gaap:TreasuryStockCommonMember2022-07-012022-09-300000034088us-gaap:CommonStockMember2022-09-300000034088us-gaap:RetainedEarningsMember2022-09-300000034088us-gaap:AccumulatedOtherComprehensiveIncomeMember2022-09-300000034088us-gaap:TreasuryStockCommonMember2022-09-300000034088us-gaap:ParentMember2022-09-300000034088us-gaap:NoncontrollingInterestMember2022-09-300000034088us-gaap:CommonStockMember2023-06-300000034088us-gaap:RetainedEarningsMember2023-06-300000034088us-gaap:AccumulatedOtherComprehensiveIncomeMember2023-06-300000034088us-gaap:TreasuryStockCommonMember2023-06-300000034088us-gaap:ParentMember2023-06-300000034088us-gaap:NoncontrollingInterestMember2023-06-3000000340882023-06-300000034088us-gaap:CommonStockMember2023-07-012023-09-300000034088us-gaap:ParentMember2023-07-012023-09-300000034088us-gaap:NoncontrollingInterestMember2023-07-012023-09-300000034088us-gaap:RetainedEarningsMember2023-07-012023-09-300000034088us-gaap:AccumulatedOtherComprehensiveIncomeMember2023-07-012023-09-300000034088us-gaap:TreasuryStockCommonMember2023-07-012023-09-300000034088us-gaap:CommonStockMember2023-09-300000034088us-gaap:RetainedEarningsMember2023-09-300000034088us-gaap:AccumulatedOtherComprehensiveIncomeMember2023-09-300000034088us-gaap:TreasuryStockCommonMember2023-09-300000034088us-gaap:ParentMember2023-09-300000034088us-gaap:NoncontrollingInterestMember2023-09-300000034088us-gaap:CommonStockMember2021-12-310000034088us-gaap:RetainedEarningsMember2021-12-310000034088us-gaap:AccumulatedOtherComprehensiveIncomeMember2021-12-310000034088us-gaap:TreasuryStockCommonMember2021-12-310000034088us-gaap:ParentMember2021-12-310000034088us-gaap:NoncontrollingInterestMember2021-12-310000034088us-gaap:CommonStockMember2022-01-012022-09-300000034088us-gaap:ParentMember2022-01-012022-09-300000034088us-gaap:NoncontrollingInterestMember2022-01-012022-09-300000034088us-gaap:RetainedEarningsMember2022-01-012022-09-300000034088us-gaap:AccumulatedOtherComprehensiveIncomeMember2022-01-012022-09-300000034088us-gaap:TreasuryStockCommonMember2022-01-012022-09-300000034088us-gaap:CommonStockMember2022-12-310000034088us-gaap:RetainedEarningsMember2022-12-310000034088us-gaap:AccumulatedOtherComprehensiveIncomeMember2022-12-310000034088us-gaap:TreasuryStockCommonMember2022-12-310000034088us-gaap:ParentMember2022-12-310000034088us-gaap:NoncontrollingInterestMember2022-12-310000034088us-gaap:CommonStockMember2023-01-012023-09-300000034088us-gaap:ParentMember2023-01-012023-09-300000034088us-gaap:NoncontrollingInterestMember2023-01-012023-09-300000034088us-gaap:RetainedEarningsMember2023-01-012023-09-300000034088us-gaap:AccumulatedOtherComprehensiveIncomeMember2023-01-012023-09-300000034088us-gaap:TreasuryStockCommonMember2023-01-012023-09-300000034088xom:Sakhalin1Member2022-01-012022-12-3100000340882022-10-012022-12-31utr:Boe0000034088xom:DebtRelatedGuaranteesMemberxom:EquityCompanyObligationsMember2023-09-300000034088xom:OtherThirdPartyObligationsMemberxom:DebtRelatedGuaranteesMember2023-09-300000034088xom:DebtRelatedGuaranteesMember2023-09-300000034088xom:EquityCompanyObligationsMemberxom:OtherGuaranteesMember2023-09-300000034088xom:OtherThirdPartyObligationsMemberxom:OtherGuaranteesMember2023-09-300000034088xom:OtherGuaranteesMember2023-09-300000034088xom:EquityCompanyObligationsMember2023-09-300000034088xom:OtherThirdPartyObligationsMember2023-09-300000034088srt:ParentCompanyMember2021-12-310000034088srt:ParentCompanyMember2022-01-012022-09-300000034088srt:ParentCompanyMember2022-09-300000034088srt:ParentCompanyMember2022-12-310000034088srt:ParentCompanyMember2023-01-012023-09-300000034088srt:ParentCompanyMember2023-09-300000034088country:USus-gaap:PensionPlansDefinedBenefitMember2023-07-012023-09-300000034088country:USus-gaap:PensionPlansDefinedBenefitMember2022-07-012022-09-300000034088country:USus-gaap:PensionPlansDefinedBenefitMember2023-01-012023-09-300000034088country:USus-gaap:PensionPlansDefinedBenefitMember2022-01-012022-09-300000034088us-gaap:ForeignPlanMemberus-gaap:PensionPlansDefinedBenefitMember2023-07-012023-09-300000034088us-gaap:ForeignPlanMemberus-gaap:PensionPlansDefinedBenefitMember2022-07-012022-09-300000034088us-gaap:ForeignPlanMemberus-gaap:PensionPlansDefinedBenefitMember2023-01-012023-09-300000034088us-gaap:ForeignPlanMemberus-gaap:PensionPlansDefinedBenefitMember2022-01-012022-09-300000034088us-gaap:OtherPostretirementBenefitPlansDefinedBenefitMember2023-07-012023-09-300000034088us-gaap:OtherPostretirementBenefitPlansDefinedBenefitMember2022-07-012022-09-300000034088us-gaap:OtherPostretirementBenefitPlansDefinedBenefitMember2023-01-012023-09-300000034088us-gaap:OtherPostretirementBenefitPlansDefinedBenefitMember2022-01-012022-09-300000034088us-gaap:FairValueInputsLevel1Member2023-09-300000034088us-gaap:FairValueInputsLevel2Member2023-09-300000034088us-gaap:FairValueDisclosureItemAmountsDomain2023-09-300000034088xom:EffectOfCounterpartyNettingMember2023-09-300000034088xom:EffectOfCollateralNettingMember2023-09-300000034088us-gaap:CarryingReportedAmountFairValueDisclosureMember2023-09-300000034088us-gaap:FairValueInputsLevel3Member2023-09-300000034088xom:DifferenceInCarryingValueAndFairValueMember2023-09-300000034088us-gaap:FairValueInputsLevel1Member2022-12-310000034088us-gaap:FairValueInputsLevel2Member2022-12-310000034088us-gaap:FairValueDisclosureItemAmountsDomain2022-12-310000034088xom:EffectOfCounterpartyNettingMember2022-12-310000034088xom:EffectOfCollateralNettingMember2022-12-310000034088us-gaap:CarryingReportedAmountFairValueDisclosureMember2022-12-310000034088us-gaap:FairValueInputsLevel3Member2022-12-310000034088xom:DifferenceInCarryingValueAndFairValueMember2022-12-310000034088xom:LineOfCreditShortTermMember2023-09-300000034088xom:LineOfCreditLongTermMember2023-09-300000034088us-gaap:LongMembersrt:CrudeOilMember2023-01-012023-09-30utr:bbl0000034088us-gaap:LongMembersrt:CrudeOilMember2022-01-012022-12-310000034088us-gaap:ShortMemberxom:ProductsMember2023-01-012023-09-300000034088us-gaap:ShortMemberxom:ProductsMember2022-01-012022-12-310000034088xom:NaturalGasMemberus-gaap:ShortMember2023-01-012023-09-30utr:MMBTU0000034088xom:NaturalGasMemberus-gaap:ShortMember2022-01-012022-12-310000034088us-gaap:NotDesignatedAsHedgingInstrumentTradingMember2023-07-012023-09-300000034088us-gaap:NotDesignatedAsHedgingInstrumentTradingMember2022-07-012022-09-300000034088us-gaap:NotDesignatedAsHedgingInstrumentTradingMember2023-01-012023-09-300000034088us-gaap:NotDesignatedAsHedgingInstrumentTradingMember2022-01-012022-09-300000034088xom:UpstreamMembercountry:US2023-07-012023-09-300000034088xom:UpstreamMembercountry:US2022-07-012022-09-300000034088xom:UpstreamMembercountry:US2023-01-012023-09-300000034088xom:UpstreamMembercountry:US2022-01-012022-09-300000034088us-gaap:NonUsMemberxom:UpstreamMember2023-07-012023-09-300000034088us-gaap:NonUsMemberxom:UpstreamMember2022-07-012022-09-300000034088us-gaap:NonUsMemberxom:UpstreamMember2023-01-012023-09-300000034088us-gaap:NonUsMemberxom:UpstreamMember2022-01-012022-09-300000034088country:USxom:EnergyProductsMember2023-07-012023-09-300000034088country:USxom:EnergyProductsMember2022-07-012022-09-300000034088country:USxom:EnergyProductsMember2023-01-012023-09-300000034088country:USxom:EnergyProductsMember2022-01-012022-09-300000034088us-gaap:NonUsMemberxom:EnergyProductsMember2023-07-012023-09-300000034088us-gaap:NonUsMemberxom:EnergyProductsMember2022-07-012022-09-300000034088us-gaap:NonUsMemberxom:EnergyProductsMember2023-01-012023-09-300000034088us-gaap:NonUsMemberxom:EnergyProductsMember2022-01-012022-09-300000034088xom:ChemicalProductsMembercountry:US2023-07-012023-09-300000034088xom:ChemicalProductsMembercountry:US2022-07-012022-09-300000034088xom:ChemicalProductsMembercountry:US2023-01-012023-09-300000034088xom:ChemicalProductsMembercountry:US2022-01-012022-09-300000034088us-gaap:NonUsMemberxom:ChemicalProductsMember2023-07-012023-09-300000034088us-gaap:NonUsMemberxom:ChemicalProductsMember2022-07-012022-09-300000034088us-gaap:NonUsMemberxom:ChemicalProductsMember2023-01-012023-09-300000034088us-gaap:NonUsMemberxom:ChemicalProductsMember2022-01-012022-09-300000034088xom:SpecialtyProductsMembercountry:US2023-07-012023-09-300000034088xom:SpecialtyProductsMembercountry:US2022-07-012022-09-300000034088xom:SpecialtyProductsMembercountry:US2023-01-012023-09-300000034088xom:SpecialtyProductsMembercountry:US2022-01-012022-09-300000034088xom:SpecialtyProductsMemberus-gaap:NonUsMember2023-07-012023-09-300000034088xom:SpecialtyProductsMemberus-gaap:NonUsMember2022-07-012022-09-300000034088xom:SpecialtyProductsMemberus-gaap:NonUsMember2023-01-012023-09-300000034088xom:SpecialtyProductsMemberus-gaap:NonUsMember2022-01-012022-09-300000034088xom:CorporateAndFinancingMember2023-07-012023-09-300000034088xom:CorporateAndFinancingMember2022-07-012022-09-300000034088xom:CorporateAndFinancingMember2023-01-012023-09-300000034088xom:CorporateAndFinancingMember2022-01-012022-09-300000034088xom:SalesAndOtherOperatingRevenueMemberxom:UpstreamMembercountry:US2023-07-012023-09-300000034088xom:SalesAndOtherOperatingRevenueMemberxom:UpstreamMembercountry:US2022-07-012022-09-300000034088xom:SalesAndOtherOperatingRevenueMemberxom:UpstreamMembercountry:US2023-01-012023-09-300000034088xom:SalesAndOtherOperatingRevenueMemberxom:UpstreamMembercountry:US2022-01-012022-09-300000034088xom:SalesAndOtherOperatingRevenueMemberus-gaap:NonUsMemberxom:UpstreamMember2023-07-012023-09-300000034088xom:SalesAndOtherOperatingRevenueMemberus-gaap:NonUsMemberxom:UpstreamMember2022-07-012022-09-300000034088xom:SalesAndOtherOperatingRevenueMemberus-gaap:NonUsMemberxom:UpstreamMember2023-01-012023-09-300000034088xom:SalesAndOtherOperatingRevenueMemberus-gaap:NonUsMemberxom:UpstreamMember2022-01-012022-09-300000034088xom:SalesAndOtherOperatingRevenueMembercountry:USxom:EnergyProductsMember2023-07-012023-09-300000034088xom:SalesAndOtherOperatingRevenueMembercountry:USxom:EnergyProductsMember2022-07-012022-09-300000034088xom:SalesAndOtherOperatingRevenueMembercountry:USxom:EnergyProductsMember2023-01-012023-09-300000034088xom:SalesAndOtherOperatingRevenueMembercountry:USxom:EnergyProductsMember2022-01-012022-09-300000034088xom:SalesAndOtherOperatingRevenueMemberus-gaap:NonUsMemberxom:EnergyProductsMember2023-07-012023-09-300000034088xom:SalesAndOtherOperatingRevenueMemberus-gaap:NonUsMemberxom:EnergyProductsMember2022-07-012022-09-300000034088xom:SalesAndOtherOperatingRevenueMemberus-gaap:NonUsMemberxom:EnergyProductsMember2023-01-012023-09-300000034088xom:SalesAndOtherOperatingRevenueMemberus-gaap:NonUsMemberxom:EnergyProductsMember2022-01-012022-09-300000034088xom:SalesAndOtherOperatingRevenueMemberxom:ChemicalProductsMembercountry:US2023-07-012023-09-300000034088xom:SalesAndOtherOperatingRevenueMemberxom:ChemicalProductsMembercountry:US2022-07-012022-09-300000034088xom:SalesAndOtherOperatingRevenueMemberxom:ChemicalProductsMembercountry:US2023-01-012023-09-300000034088xom:SalesAndOtherOperatingRevenueMemberxom:ChemicalProductsMembercountry:US2022-01-012022-09-300000034088xom:SalesAndOtherOperatingRevenueMemberus-gaap:NonUsMemberxom:ChemicalProductsMember2023-07-012023-09-300000034088xom:SalesAndOtherOperatingRevenueMemberus-gaap:NonUsMemberxom:ChemicalProductsMember2022-07-012022-09-300000034088xom:SalesAndOtherOperatingRevenueMemberus-gaap:NonUsMemberxom:ChemicalProductsMember2023-01-012023-09-300000034088xom:SalesAndOtherOperatingRevenueMemberus-gaap:NonUsMemberxom:ChemicalProductsMember2022-01-012022-09-300000034088xom:SpecialtyProductsMemberxom:SalesAndOtherOperatingRevenueMembercountry:US2023-07-012023-09-300000034088xom:SpecialtyProductsMemberxom:SalesAndOtherOperatingRevenueMembercountry:US2022-07-012022-09-300000034088xom:SpecialtyProductsMemberxom:SalesAndOtherOperatingRevenueMembercountry:US2023-01-012023-09-300000034088xom:SpecialtyProductsMemberxom:SalesAndOtherOperatingRevenueMembercountry:US2022-01-012022-09-300000034088xom:SpecialtyProductsMemberxom:SalesAndOtherOperatingRevenueMemberus-gaap:NonUsMember2023-07-012023-09-300000034088xom:SpecialtyProductsMemberxom:SalesAndOtherOperatingRevenueMemberus-gaap:NonUsMember2022-07-012022-09-300000034088xom:SpecialtyProductsMemberxom:SalesAndOtherOperatingRevenueMemberus-gaap:NonUsMember2023-01-012023-09-300000034088xom:SpecialtyProductsMemberxom:SalesAndOtherOperatingRevenueMemberus-gaap:NonUsMember2022-01-012022-09-300000034088xom:CorporateAndFinancingMemberxom:SalesAndOtherOperatingRevenueMember2023-07-012023-09-300000034088xom:CorporateAndFinancingMemberxom:SalesAndOtherOperatingRevenueMember2022-07-012022-09-300000034088xom:CorporateAndFinancingMemberxom:SalesAndOtherOperatingRevenueMember2023-01-012023-09-300000034088xom:CorporateAndFinancingMemberxom:SalesAndOtherOperatingRevenueMember2022-01-012022-09-300000034088xom:UpstreamNonUSMemberxom:Sakhalin1Member2022-01-012022-03-310000034088xom:CorporateAndFinancingMemberxom:Sakhalin1Member2022-01-012022-03-310000034088xom:SalesAndOtherOperatingRevenueMembercountry:US2023-07-012023-09-300000034088xom:SalesAndOtherOperatingRevenueMembercountry:US2022-07-012022-09-300000034088xom:SalesAndOtherOperatingRevenueMembercountry:US2023-01-012023-09-300000034088xom:SalesAndOtherOperatingRevenueMembercountry:US2022-01-012022-09-300000034088xom:SalesAndOtherOperatingRevenueMemberus-gaap:NonUsMember2023-07-012023-09-300000034088xom:SalesAndOtherOperatingRevenueMemberus-gaap:NonUsMember2022-07-012022-09-300000034088xom:SalesAndOtherOperatingRevenueMemberus-gaap:NonUsMember2023-01-012023-09-300000034088xom:SalesAndOtherOperatingRevenueMemberus-gaap:NonUsMember2022-01-012022-09-300000034088xom:SalesAndOtherOperatingRevenueMembercountry:CA2023-07-012023-09-300000034088xom:SalesAndOtherOperatingRevenueMembercountry:CA2022-07-012022-09-300000034088xom:SalesAndOtherOperatingRevenueMembercountry:CA2023-01-012023-09-300000034088xom:SalesAndOtherOperatingRevenueMembercountry:CA2022-01-012022-09-300000034088country:GBxom:SalesAndOtherOperatingRevenueMember2023-07-012023-09-300000034088country:GBxom:SalesAndOtherOperatingRevenueMember2022-07-012022-09-300000034088country:GBxom:SalesAndOtherOperatingRevenueMember2023-01-012023-09-300000034088country:GBxom:SalesAndOtherOperatingRevenueMember2022-01-012022-09-300000034088country:SGxom:SalesAndOtherOperatingRevenueMember2023-07-012023-09-300000034088country:SGxom:SalesAndOtherOperatingRevenueMember2022-07-012022-09-300000034088country:SGxom:SalesAndOtherOperatingRevenueMember2023-01-012023-09-300000034088country:SGxom:SalesAndOtherOperatingRevenueMember2022-01-012022-09-300000034088country:FRxom:SalesAndOtherOperatingRevenueMember2023-07-012023-09-300000034088country:FRxom:SalesAndOtherOperatingRevenueMember2022-07-012022-09-300000034088country:FRxom:SalesAndOtherOperatingRevenueMember2023-01-012023-09-300000034088country:FRxom:SalesAndOtherOperatingRevenueMember2022-01-012022-09-300000034088xom:SalesAndOtherOperatingRevenueMembercountry:IT2023-07-012023-09-300000034088xom:SalesAndOtherOperatingRevenueMembercountry:IT2022-07-012022-09-300000034088xom:SalesAndOtherOperatingRevenueMembercountry:IT2023-01-012023-09-300000034088xom:SalesAndOtherOperatingRevenueMembercountry:IT2022-01-012022-09-300000034088country:BExom:SalesAndOtherOperatingRevenueMember2023-07-012023-09-300000034088country:BExom:SalesAndOtherOperatingRevenueMember2022-07-012022-09-300000034088country:BExom:SalesAndOtherOperatingRevenueMember2023-01-012023-09-300000034088country:BExom:SalesAndOtherOperatingRevenueMember2022-01-012022-09-300000034088xom:SalesAndOtherOperatingRevenueMembercountry:AU2023-07-012023-09-300000034088xom:SalesAndOtherOperatingRevenueMembercountry:AU2022-07-012022-09-300000034088xom:SalesAndOtherOperatingRevenueMembercountry:AU2023-01-012023-09-300000034088xom:SalesAndOtherOperatingRevenueMembercountry:AU2022-01-012022-09-300000034088us-gaap:DisposalGroupDisposedOfBySaleNotDiscontinuedOperationsMember2023-01-012023-09-300000034088us-gaap:DisposalGroupDisposedOfBySaleNotDiscontinuedOperationsMember2022-01-012022-12-310000034088us-gaap:DisposalGroupDisposedOfBySaleNotDiscontinuedOperationsMemberxom:SantaYnezUnitMember2022-11-012023-09-300000034088xom:DenburyIncMember2023-07-122023-07-12xbrli:pure0000034088srt:ScenarioForecastMemberxom:DenburyIncMember2023-10-012023-12-310000034088xom:DenburyIncMember2022-12-310000034088xom:DenburyIncMember2023-01-012023-06-300000034088xom:PioneerNaturalResourcesMergerMemberus-gaap:SubsequentEventMember2023-10-102023-10-100000034088xom:PioneerNaturalResourcesMergerMembersrt:ScenarioForecastMember2023-10-012023-12-310000034088xom:PioneerNaturalResourcesMergerMembersrt:ScenarioForecastMember2024-01-012024-06-300000034088xom:PioneerNaturalResourcesMergerMember2022-12-31utr:acre0000034088xom:PioneerNaturalResourcesMergerMember2023-04-012023-06-30
UNITED STATES
SECURITIES AND EXCHANGE COMMISSION
Washington, D.C. 20549
FORM 10-Q
☑ QUARTERLY REPORT PURSUANT TO SECTION 13 OR 15(d) OF
THE SECURITIES EXCHANGE ACT OF 1934
For the quarterly period ended September 30, 2023
or
☐ TRANSITION REPORT PURSUANT TO SECTION 13 OR 15(d) OF
THE SECURITIES EXCHANGE ACT OF 1934
For the transition period from __________to__________
Commission File Number 1-2256
Exxon Mobil Corporation
(Exact name of registrant as specified in its charter)
| | | | | | | | |
| New Jersey | | 13-5409005 |
| (State or other jurisdiction of incorporation or organization) | | (I.R.S. Employer Identification Number) |
22777 Springwoods Village Parkway, Spring, Texas 77389-1425
(Address of principal executive offices) (Zip Code)
(972) 940-6000
(Registrant's telephone number, including area code)
_______________________
Securities registered pursuant to Section 12(b) of the Act:
| | | | | | | | | | | | | | |
| Title of Each Class | | Trading Symbol | | Name of Each Exchange on Which Registered |
| Common Stock, without par value | | XOM | | New York Stock Exchange |
| 0.142% Notes due 2024 | | XOM24B | | New York Stock Exchange |
| 0.524% Notes due 2028 | | XOM28 | | New York Stock Exchange |
| 0.835% Notes due 2032 | | XOM32 | | New York Stock Exchange |
| 1.408% Notes due 2039 | | XOM39A | | New York Stock Exchange |
Indicate by check mark whether the registrant (1) has filed all reports required to be filed by Section 13 or 15(d) of the Securities Exchange Act of 1934 during the preceding 12 months (or for such shorter period that the registrant was required to file such reports), and (2) has been subject to such filing requirements for the past 90 days. Yes ☑ No ☐
Indicate by check mark whether the registrant has submitted electronically every Interactive Data File required to be submitted and posted pursuant to Rule 405 of Regulation S-T (§ 232.405 of this chapter) during the preceding 12 months (or for such shorter period that the registrant was required to submit and post such files). Yes ☑ No ☐
Indicate by check mark whether the registrant is a large accelerated filer, an accelerated filer, a non-accelerated filer, smaller reporting company, or an emerging growth company. See the definitions of "large accelerated filer," "accelerated filer," "smaller reporting company," and “emerging growth company” in Rule 12b-2 of the Exchange Act.
| | | | | | | | | | | |
| Large accelerated filer | ☑ | Accelerated filer | ☐ |
| | | |
| Non-accelerated filer | ☐ | Smaller reporting company | ☐ |
|
| | Emerging growth company | ☐ |
If an emerging growth company, indicate by check mark if the registrant has elected not to use the extended transition period for complying with any new or revised financial accounting standards provided pursuant to Section 13(a) of the Exchange Act. ☐
Indicate by check mark whether the registrant is a shell company (as defined in Rule 12b-2 of the Exchange Act). Yes ☐ No ☑
Indicate the number of shares outstanding of each of the issuer's classes of common stock, as of the latest practicable date.
| | | | | | | | |
| Class | | Outstanding as of September 30, 2023 |
| Common stock, without par value | | 3,962,917,886 |
EXXON MOBIL CORPORATION
FORM 10-Q
FOR THE QUARTERLY PERIOD ENDED SEPTEMBER 30, 2023
TABLE OF CONTENTS
| | | | | |
| PART I. FINANCIAL INFORMATION |
| | |
| Item 1. Financial Statements | |
| | |
Condensed Consolidated Statement of Income - Three and nine months ended September 30, 2023 and 2022 | |
| | |
Condensed Consolidated Statement of Comprehensive Income - Three and nine months ended September 30, 2023 and 2022 | |
| | |
Condensed Consolidated Balance Sheet - As of September 30, 2023 and December 31, 2022 | |
| | |
Condensed Consolidated Statement of Cash Flows - Nine months ended September 30, 2023 and 2022 | |
| | |
Condensed Consolidated Statement of Changes in Equity - Three months ended September 30, 2023 and 2022 | |
| |
Condensed Consolidated Statement of Changes in Equity - Nine months ended September 30, 2023 and 2022 | |
| |
| |
| | |
| Notes to Condensed Consolidated Financial Statements | |
| | |
| Item 2. Management's Discussion and Analysis of Financial Condition and Results of Operations | |
| | |
| Item 3. Quantitative and Qualitative Disclosures About Market Risk | |
| | |
| Item 4. Controls and Procedures | |
| | |
| | |
| PART II. OTHER INFORMATION |
| |
| Item 1. Legal Proceedings | |
| |
| |
| | |
Item 2. Unregistered Sales of Equity Securities and Use of Proceeds | |
| | |
| Item 5. Other Information | |
| |
Item 6. Exhibits | |
| | |
| Index to Exhibits | |
| | |
| Signature | |
| | |
PART I. FINANCIAL INFORMATION
| | | | | | | | | | | | | | |
| ITEM 1. FINANCIAL STATEMENTS | | |
| | | | | |
| |
| CONDENSED CONSOLIDATED STATEMENT OF INCOME |
| | | | | | | | | | | | | | | | | | | | |
(millions of dollars, unless noted) | | Three Months Ended
September 30, | | Nine Months Ended
September 30, |
| 2023 | 2022 | | 2023 | 2022 |
| Revenues and other income | | | | | | |
| Sales and other operating revenue | | 88,570 | | 106,512 | | | 253,009 | | 305,511 | |
| Income from equity affiliates | | 1,457 | | 4,632 | | | 5,220 | | 10,858 | |
| Other income | | 733 | | 926 | | | 2,009 | | 1,882 | |
| Total revenues and other income | | 90,760 | | 112,070 | | | 260,238 | | 318,251 | |
| Costs and other deductions | | | | | | |
| Crude oil and product purchases | | 53,076 | | 60,197 | | | 146,677 | | 178,198 | |
| Production and manufacturing expenses | | 8,696 | | 11,317 | | | 26,992 | | 32,244 | |
| Selling, general and administrative expenses | | 2,489 | | 2,324 | | | 7,328 | | 7,263 | |
| Depreciation and depletion (includes impairments) | | 4,415 | | 5,642 | | | 12,901 | | 18,976 | |
| Exploration expenses, including dry holes | | 338 | | 218 | | | 612 | | 677 | |
| Non-service pension and postretirement benefit expense | | 166 | | 154 | | | 497 | | 382 | |
| Interest expense | | 169 | | 209 | | | 577 | | 591 | |
| Other taxes and duties | | 7,712 | | 6,587 | | | 22,496 | | 21,009 | |
| Total costs and other deductions | | 77,061 | | 86,648 | | | 218,080 | | 259,340 | |
| Income (loss) before income taxes | | 13,699 | | 25,422 | | | 42,158 | | 58,911 | |
| Income tax expense (benefit) | | 4,353 | | 5,224 | | | 12,816 | | 14,389 | |
| Net income (loss) including noncontrolling interests | | 9,346 | | 20,198 | | | 29,342 | | 44,522 | |
| Net income (loss) attributable to noncontrolling interests | | 276 | | 538 | | | 962 | | 1,532 | |
| Net income (loss) attributable to ExxonMobil | | 9,070 | | 19,660 | | | 28,380 | | 42,990 | |
| | | | | | |
Earnings (loss) per common share (dollars) | | 2.25 | | 4.68 | | | 6.98 | | 10.17 | |
| | | | | | |
Earnings (loss) per common share - assuming dilution (dollars) | | 2.25 | | 4.68 | | | 6.98 | | 10.17 | |
| | | | | | |
| The information in the Notes to Condensed Consolidated Financial Statements is an integral part of these statements. |
| | | | | |
| |
| CONDENSED CONSOLIDATED STATEMENT OF COMPREHENSIVE INCOME |
| | | | | | | | | | | | | | | | | | | | | | |
| (millions of dollars) | | Three Months Ended
September 30, | | Nine Months Ended
September 30, |
| 2023 | | 2022 | | 2023 | | 2022 |
| Net income (loss) including noncontrolling interests | | 9,346 | | | 20,198 | | | 29,342 | | | 44,522 | |
| | | | | | | | |
| Other comprehensive income (net of income taxes) | | | | | | | | |
| Foreign exchange translation adjustment | | (933) | | | (3,361) | | | (246) | | | (5,157) | |
Adjustment for foreign exchange translation (gain)/loss
included in net income | | 549 | | | — | | | 549 | | | — | |
| Postretirement benefits reserves adjustment (excluding amortization) | | 11 | | | 108 | | | 47 | | | 368 | |
| Amortization and settlement of postretirement benefits reserves adjustment included in net periodic benefit costs | | 6 | | | 128 | | | 19 | | | 323 | |
| Total other comprehensive income (loss) | | (367) | | | (3,125) | | | 369 | | | (4,466) | |
| Comprehensive income (loss) including noncontrolling interests | | 8,979 | | | 17,073 | | | 29,711 | | | 40,056 | |
| Comprehensive income (loss) attributable to noncontrolling interests | | 340 | | | 199 | | | 1,149 | | | 1,105 | |
| Comprehensive income (loss) attributable to ExxonMobil | | 8,639 | | | 16,874 | | | 28,562 | | | 38,951 | |
| | | | | | | | |
| The information in the Notes to Condensed Consolidated Financial Statements is an integral part of these statements. |
| | | | | |
| |
| CONDENSED CONSOLIDATED BALANCE SHEET |
| | | | | | | | | | | | | | | |
(millions of dollars, unless noted) | | September 30, 2023 | | December 31, 2022 | | | |
| | | | | | | |
| ASSETS | | | | | | | |
| Current assets | | | | | | | |
| Cash and cash equivalents | | 32,944 | | | 29,640 | | | | |
| Cash and cash equivalents – restricted | | 29 | | | 25 | | | | |
| Notes and accounts receivable – net | | 41,814 | | | 41,749 | | | | |
| Inventories | | | | | | | |
| Crude oil, products and merchandise | | 20,052 | | | 20,434 | | | | |
| Materials and supplies | | 4,398 | | | 4,001 | | | | |
| Other current assets | | 1,905 | | | 1,782 | | | | |
| Total current assets | | 101,142 | | | 97,631 | | | | |
| Investments, advances and long-term receivables | | 48,066 | | | 49,793 | | | | |
| Property, plant and equipment – net | | 205,862 | | | 204,692 | | | | |
| Other assets, including intangibles – net | | 17,189 | | | 16,951 | | | | |
| Total Assets | | 372,259 | | | 369,067 | | | | |
| | | | | | | |
| LIABILITIES | | | | | | | |
| Current liabilities | | | | | | | |
| Notes and loans payable | | 4,743 | | | 634 | | | | |
| Accounts payable and accrued liabilities | | 62,257 | | | 63,197 | | | | |
| Income taxes payable | | 4,186 | | | 5,214 | | | | |
| Total current liabilities | | 71,186 | | | 69,045 | | | | |
| Long-term debt | | 36,510 | | | 40,559 | | | | |
| Postretirement benefits reserves | | 10,174 | | | 10,045 | | | | |
| Deferred income tax liabilities | | 23,912 | | | 22,874 | | | | |
| Long-term obligations to equity companies | | 2,076 | | | 2,338 | | | | |
| Other long-term obligations | | 20,868 | | | 21,733 | | | | |
| Total Liabilities | | 164,726 | | | 166,594 | | | | |
| | | | | | | |
| Commitments and contingencies (Note 3) | | | | | | | |
| | | | | | | |
| EQUITY | | | | | | | |
Common stock without par value (9,000 million shares authorized, 8,019 million shares issued) | | 16,165 | | | 15,752 | | | | |
| Earnings reinvested | | 450,138 | | | 432,860 | | | | |
| Accumulated other comprehensive income | | (13,088) | | | (13,270) | | | | |
Common stock held in treasury (4,056 million shares at September 30, 2023 and 3,937 million shares at December 31, 2022) | | (253,512) | | | (240,293) | | | | |
| ExxonMobil share of equity | | 199,703 | | | 195,049 | | | | |
| Noncontrolling interests | | 7,830 | | | 7,424 | | | | |
| Total Equity | | 207,533 | | | 202,473 | | | | |
| Total Liabilities and Equity | | 372,259 | | | 369,067 | | | | |
| | | | | | | |
| The information in the Notes to Condensed Consolidated Financial Statements is an integral part of these statements. | | | |
| | | | | |
| |
| CONDENSED CONSOLIDATED STATEMENT OF CASH FLOWS |
| | | | | | | | | | | |
| (millions of dollars) | | Nine Months Ended
September 30, |
| 2023 | 2022 |
| | | |
| CASH FLOWS FROM OPERATING ACTIVITIES | | | |
| Net income (loss) including noncontrolling interests | | 29,342 | | 44,522 | |
| Depreciation and depletion (includes impairments) | | 12,901 | | 18,976 | |
| | | |
| Changes in operational working capital, excluding cash and debt | | (2,064) | | 6 | |
| All other items – net | | 1,508 | | (4,328) | |
| Net cash provided by operating activities | | 41,687 | | 59,176 | |
| | | |
| CASH FLOWS FROM INVESTING ACTIVITIES | | | |
| Additions to property, plant and equipment | | (15,691) | | (12,624) | |
| Proceeds from asset sales and returns of investments | | 3,058 | | 3,914 | |
| Additional investments and advances | | (1,141) | | (915) | |
| Other investing activities including collection of advances | | 214 | | 238 | |
| Net cash used in investing activities | | (13,560) | | (9,387) | |
| | | |
| CASH FLOWS FROM FINANCING ACTIVITIES | | | |
Additions to long-term debt (1) | | 805 | | 55 | |
| Reductions in long-term debt | | (11) | | — | |
| | | |
Reductions in short-term debt | | (222) | | (3,895) | |
| Additions/(reductions) in debt with three months or less maturity | | (283) | | 1,638 | |
| Contingent consideration payments | | (68) | | (58) | |
| Cash dividends to ExxonMobil shareholders | | (11,102) | | (11,172) | |
| Cash dividends to noncontrolling interests | | (511) | | (191) | |
| Changes in noncontrolling interests | | (258) | | (1,074) | |
| Common stock acquired | | (13,092) | | (10,480) | |
| Net cash used in financing activities | | (24,742) | | (25,177) | |
| | | |
| Effects of exchange rate changes on cash | | (77) | | (950) | |
| Increase/(decrease) in cash and cash equivalents | | 3,308 | | 23,662 | |
| Cash and cash equivalents at beginning of period | | 29,665 | | 6,802 | |
| Cash and cash equivalents at end of period | | 32,973 | | 30,464 | |
| | | |
| SUPPLEMENTAL DISCLOSURES | | | |
| Income taxes paid | | 11,627 | | 10,172 | |
| Cash interest paid | | | |
| Included in cash flows from operating activities | | 578 | | 660 | |
| Capitalized, included in cash flows from investing activities | | 862 | | 605 | |
| Total cash interest paid | | 1,440 | | 1,265 | |
| | | |
| | | |
| Noncash right of use assets recorded in exchange for lease liabilities | | | |
| Operating leases | | 1,421 | | 1,648 | |
| Finance leases | | 438 | | 730 | |
| | | |
|
| | | |
|
| | | | | | | | | | | | | | |
(1) | Includes $568 million issued to facilitate the sale of an entity where the buyer assumed the debt upon closing; no longer on the Condensed Consolidated Balance Sheet at the end of the third quarter 2023. |
| | | | |
| The information in the Notes to Condensed Consolidated Financial Statements is an integral part of these statements. |
| | | | | |
| |
| CONDENSED CONSOLIDATED STATEMENT OF CHANGE IN EQUITY |
| | | | | | | | | | | | | | | | | | | | | | | | | | |
| | | ExxonMobil Share of Equity | | |
| | | | | | | | |
(millions of dollars, unless noted) | | Common Stock | Earnings Reinvested | Accumulated Other Comprehensive Income | Common Stock Held in Treasury | ExxonMobil Share of Equity | Non-controlling Interests | Total Equity |
| | | | | | | | |
| Balance as of June 30, 2022 | | 16,018 | | 407,902 | | (15,017) | | (231,587) | | 177,316 | | 7,192 | | 184,508 | |
| Amortization of stock-based awards | | 91 | | — | | — | | — | | 91 | | — | | 91 | |
| Other | | (3) | | — | | — | | — | | (3) | | (29) | | (32) | |
| Net income (loss) for the period | | — | | 19,660 | | — | | — | | 19,660 | | 538 | | 20,198 | |
| Dividends - common shares | | — | | (3,685) | | — | | — | | (3,685) | | (68) | | (3,753) | |
| Other comprehensive income (loss) | | — | | — | | (2,786) | | — | | (2,786) | | (339) | | (3,125) | |
| Acquisitions, at cost | | — | | — | | — | | (4,494) | | (4,494) | | (351) | | (4,845) | |
| Dispositions | | — | | — | | — | | 1 | | 1 | | — | | 1 | |
| Balance as of September 30, 2022 | | 16,106 | | 423,877 | | (17,803) | | (236,080) | | 186,100 | | 6,943 | | 193,043 | |
| | | | | | | | |
| Balance as of June 30, 2023 | | 16,029 | | 444,731 | | (12,657) | | (249,057) | | 199,046 | | 7,951 | | 206,997 | |
| Amortization of stock-based awards | | 138 | | — | | — | | — | | 138 | | — | | 138 | |
| Other | | (2) | | — | | — | | — | | (2) | | 59 | | 57 | |
| Net income (loss) for the period | | — | | 9,070 | | — | | — | | 9,070 | | 276 | | 9,346 | |
| Dividends - common shares | | — | | (3,663) | | — | | — | | (3,663) | | (218) | | (3,881) | |
| Other comprehensive income (loss) | | — | | — | | (431) | | — | | (431) | | 64 | | (367) | |
| Acquisitions, at cost | | — | | — | | — | | (4,456) | | (4,456) | | (302) | | (4,758) | |
| Dispositions | | — | | — | | — | | 1 | | 1 | | — | | 1 | |
| Balance as of September 30, 2023 | | 16,165 | | 450,138 | | (13,088) | | (253,512) | | 199,703 | | 7,830 | | 207,533 | |
| | | | | | | | | | | | | | | | | | | | | | | | | | |
| | | Three Months Ended September 30, 2023 | | Three Months Ended September 30, 2022 |
| | | | | | | | |
Common Stock Share Activity (millions of shares) | | Issued | Held in Treasury | Outstanding | | Issued | Held in Treasury | Outstanding |
| Balance as of June 30 | | 8,019 | | (4,016) | | 4,003 | | | 8,019 | | (3,851) | | 4,168 | |
| Acquisitions | | — | | (40) | | (40) | | | — | | (50) | | (50) | |
| Dispositions | | — | | — | | — | | | — | | — | | — | |
| Balance as of September 30 | | 8,019 | | (4,056) | | 3,963 | | | 8,019 | | (3,901) | | 4,118 | |
| | | | | | | | |
| The information in the Notes to Condensed Consolidated Financial Statements is an integral part of these statements. |
| | | | | |
| |
| CONDENSED CONSOLIDATED STATEMENT OF CHANGE IN EQUITY |
| | | | | | | | | | | | | | | | | | | | | | | | | | |
| | | ExxonMobil Share of Equity | | |
| | | | | | | | |
(millions of dollars, unless noted) | | Common Stock | Earnings Reinvested | Accumulated Other Comprehensive Income | Common Stock Held in Treasury | ExxonMobil Share of Equity | Non-controlling Interests | Total Equity |
| | | | | | | | |
| Balance as of December 31, 2021 | | 15,746 | | 392,059 | | (13,764) | | (225,464) | | 168,577 | | 7,106 | | 175,683 | |
| Amortization of stock-based awards | | 372 | | — | | — | | — | | 372 | | — | | 372 | |
| Other | | (12) | | — | | — | | — | | (12) | | (30) | | (42) | |
| Net income (loss) for the period | | — | | 42,990 | | — | | — | | 42,990 | | 1,532 | | 44,522 | |
| Dividends - common shares | | — | | (11,172) | | — | | — | | (11,172) | | (191) | | (11,363) | |
| | | | | | | | |
| Other comprehensive income (loss) | | — | | — | | (4,039) | | — | | (4,039) | | (427) | | (4,466) | |
| Acquisitions, at cost | | — | | — | | — | | (10,620) | | (10,620) | | (1,047) | | (11,667) | |
| Dispositions | | — | | — | | — | | 4 | | 4 | | — | | 4 | |
| Balance as of September 30, 2022 | | 16,106 | | 423,877 | | (17,803) | | (236,080) | | 186,100 | | 6,943 | | 193,043 | |
| | | | | | | | |
| Balance as of December 31, 2022 | | 15,752 | | 432,860 | | (13,270) | | (240,293) | | 195,049 | | 7,424 | | 202,473 | |
| Amortization of stock-based awards | | 426 | | — | | — | | — | | 426 | | — | | 426 | |
| Other | | (13) | | — | | — | | — | | (13) | | 70 | | 57 | |
| Net income (loss) for the period | | — | | 28,380 | | — | | — | | 28,380 | | 962 | | 29,342 | |
| Dividends - common shares | | — | | (11,102) | | — | | — | | (11,102) | | (511) | | (11,613) | |
| | | | | | | | |
| Other comprehensive income (loss) | | — | | — | | 182 | | — | | 182 | | 187 | | 369 | |
| Acquisitions, at cost | | — | | — | | — | | (13,224) | | (13,224) | | (302) | | (13,526) | |
| Dispositions | | — | | — | | — | | 5 | | 5 | | — | | 5 | |
| Balance as of September 30, 2023 | | 16,165 | | 450,138 | | (13,088) | | (253,512) | | 199,703 | | 7,830 | | 207,533 | |
| | | | | | | | | | | | | | | | | | | | | | | | | | |
| | | Nine Months Ended September 30, 2023 | | Nine Months Ended September 30, 2022 |
| | | | | | | | |
Common Stock Share Activity (millions of shares) | | Issued | Held in Treasury | Outstanding | | Issued | Held in Treasury | Outstanding |
| Balance as of December 31 | | 8,019 | | (3,937) | | 4,082 | | | 8,019 | | (3,780) | | 4,239 | |
| Acquisitions | | — | | (119) | | (119) | | | — | | (121) | | (121) | |
| Dispositions | | — | | — | | — | | | — | | — | | — | |
| Balance as of September 30 | | 8,019 | | (4,056) | | 3,963 | | | 8,019 | | (3,901) | | 4,118 | |
| | | | | | | | |
| The information in the Notes to Condensed Consolidated Financial Statements is an integral part of these statements. |
| | | | | |
| |
| NOTES TO CONDENSED CONSOLIDATED FINANCIAL STATEMENTS |
Note 1. Basis of Financial Statement Preparation
These unaudited condensed consolidated financial statements should be read in the context of the consolidated financial statements and notes thereto filed with the Securities and Exchange Commission in the Corporation's 2022 Annual Report on Form 10-K. In the opinion of the Corporation, the information furnished herein reflects all known accruals and adjustments necessary for a fair statement of the results for the periods reported herein. All such adjustments are of a normal recurring nature. Prior data has been reclassified in certain cases to conform to the current presentation basis.
The Corporation's exploration and production activities are accounted for under the "successful efforts" method.
Note 2. Russia
In response to Russia’s military action in Ukraine, the Corporation announced in early 2022 that it planned to discontinue operations on the Sakhalin-1 project (“Sakhalin”) and develop steps to exit the venture. In light of this, an impairment assessment was conducted, and management determined that the carrying value of the asset group was not recoverable. As a result, the Corporation’s first-quarter 2022 earnings included after-tax charges of $3.4 billion largely representing the full impairment of its operations related to Sakhalin. On a before-tax basis, the charges amounted to $4.6 billion, substantially all of which is reflected in the line captioned “Depreciation and depletion (includes impairments)” on the Condensed Consolidated Statement of Income. Effective October 14, 2022 the Russian government unilaterally terminated the Corporation’s interests in Sakhalin, transferring operations to a Russian operator. The Corporation’s fourth-quarter 2022 results included an after-tax benefit of $1.1 billion largely reflecting the impact of the expropriation on the company’s various obligations related to Sakhalin. The Corporation's exit from the project resulted in approximately 150 million oil-equivalent barrels no longer qualifying as proved reserves at year-end 2022.
Note 3. Litigation and Other Contingencies
Litigation
A variety of claims have been made against ExxonMobil and certain of its consolidated subsidiaries in a number of pending lawsuits. Management has regular litigation reviews, including updates from corporate and outside counsel, to assess the need for accounting recognition or disclosure of these contingencies. The Corporation accrues an undiscounted liability for those contingencies where the incurrence of a loss is probable and the amount can be reasonably estimated. If a range of amounts can be reasonably estimated and no amount within the range is a better estimate than any other amount, then the minimum of the range is accrued. The Corporation does not record liabilities when the likelihood that the liability has been incurred is probable but the amount cannot be reasonably estimated or when the liability is believed to be only reasonably possible or remote. For contingencies where an unfavorable outcome is reasonably possible and which are significant, the Corporation discloses the nature of the contingency and, where feasible, an estimate of the possible loss. For purposes of our contingency disclosures, “significant” includes material matters, as well as other matters which management believes should be disclosed.
State and local governments and other entities in various jurisdictions across the United States and its territories have filed a number of legal proceedings against several oil and gas companies, including ExxonMobil, requesting unprecedented legal and equitable relief for various alleged injuries purportedly connected to climate change. These lawsuits assert a variety of novel, untested claims under statutory and common law. Additional such lawsuits may be filed. We believe the legal and factual theories set forth in these proceedings are meritless and represent an inappropriate attempt to use the court system to usurp the proper role of policymakers in addressing the societal challenges of climate change.
Local governments in Louisiana have filed unprecedented legal proceedings against a number of oil and gas companies, including ExxonMobil, requesting compensation for the restoration of coastal marshes in the state. We believe the factual and legal theories set forth in these proceedings are meritless.
While the outcome of any litigation can be unpredictable, we believe the likelihood is remote that the ultimate outcomes of these lawsuits will have a material adverse effect on the Corporation’s operations, financial condition, or financial statements taken as a whole. We will continue to defend vigorously against these claims.
Other Contingencies
The Corporation and certain of its consolidated subsidiaries were contingently liable at September 30, 2023, for guarantees relating to notes, loans and performance under contracts. Where guarantees for environmental remediation and other similar matters do not include a stated cap, the amounts reflect management’s estimate of the maximum potential exposure. Where it is not possible to make a reasonable estimation of the maximum potential amount of future payments, future performance is expected to be either immaterial or have only a remote chance of occurrence. These guarantees are not reasonably likely to have a material effect on the Corporation’s financial condition, changes in financial condition, revenues or expenses, results of operations, liquidity, capital expenditures or capital resources.
| | | | | | | | | | | |
| | September 30, 2023 |
| | | |
| (millions of dollars) | Equity Company Obligations (1) | Other Third-Party Obligations | Total |
| Guarantees | | | |
| Debt-related | 1,188 | | 152 | | 1,340 | |
| Other | 706 | | 5,664 | | 6,370 | |
| Total | 1,894 | | 5,816 | | 7,710 | |
| | | |
(1) ExxonMobil share | | | |
The operations and earnings of the Corporation and its affiliates throughout the world have been, and may in the future be, affected from time to time in varying degree by political developments and laws and regulations, such as forced divestiture of assets; restrictions on production, imports and exports; price controls; tax increases and retroactive tax claims; expropriation of property; cancellation of contract rights; sanctions and environmental regulations. Both the likelihood of such occurrences and their overall effect upon the Corporation vary greatly from country to country and are not predictable.
Note 4. Other Comprehensive Income Information
| | | | | | | | | | | |
ExxonMobil Share of Accumulated Other Comprehensive Income (millions of dollars) | Cumulative Foreign Exchange Translation Adjustment | Postretirement Benefits Reserves Adjustment | Total |
| Balance as of December 31, 2021 | (11,499) | | (2,265) | | (13,764) | |
Current period change excluding amounts reclassified from accumulated other comprehensive income (1) | (4,680) | | 335 | | (4,345) | |
| Amounts reclassified from accumulated other comprehensive income | — | | 306 | | 306 | |
| Total change in accumulated other comprehensive income | (4,680) | | 641 | | (4,039) | |
| Balance as of September 30, 2022 | (16,179) | | (1,624) | | (17,803) | |
| | | |
| Balance as of December 31, 2022 | (14,591) | | 1,321 | | (13,270) | |
Current period change excluding amounts reclassified from accumulated other comprehensive income (1) | (241) | | 44 | | (197) | |
| Amounts reclassified from accumulated other comprehensive income | 367 | | 12 | | 379 | |
| Total change in accumulated other comprehensive income | 126 | | 56 | | 182 | |
| Balance as of September 30, 2023 | (14,465) | | 1,377 | | (13,088) | |
| | | |
(1) Cumulative Foreign Exchange Translation Adjustment includes net investment hedge gain/(loss) net of taxes of $25 million and $551 million in 2023 and 2022, respectively. |
| | | | | | | | | | | | | | | | | | | | | |
Amounts Reclassified Out of Accumulated Other Comprehensive Income - Before-tax Income/(Expense) (millions of dollars) | | Three Months Ended
September 30, | | Nine Months Ended
September 30, |
| 2023 | 2022 | | 2023 | | 2022 |
Foreign exchange translation gain/(loss) included in net income
(Statement of Income line: Other income) | | (549) | | — | | | (549) | | | — | |
| | | | | | | |
| Amortization and settlement of postretirement benefits reserves adjustment included in net periodic benefit costs | | | | | | | |
| (Statement of Income line: Non-service pension and postretirement benefit expense) | | (8) | | (163) | | | (22) | | | (415) | |
| | | | | | | | | | | | | | | | | | | | | |
Income Tax (Expense)/Credit For Components of Other Comprehensive Income (millions of dollars) | | Three Months Ended
September 30, | | Nine Months Ended
September 30, |
| 2023 | 2022 | | 2023 | | 2022 |
| | | | |
| Foreign exchange translation adjustment | | 83 | | (61) | | | 216 | | | (151) | |
| Postretirement benefits reserves adjustment (excluding amortization) | | (15) | | (82) | | | 16 | | | (205) | |
| Amortization and settlement of postretirement benefits reserves adjustment included in net periodic benefit costs | | (2) | | (35) | | | (3) | | | (92) | |
| Total | | 66 | | (178) | | | 229 | | | (448) | |
Note 5. Earnings Per Share
| | | | | | | | | | | | | | | | | | | | |
| Earnings per common share | | Three Months Ended
September 30, | | Nine Months Ended
September 30, |
| 2023 | 2022 | | 2023 | 2022 |
Net income (loss) attributable to ExxonMobil (millions of dollars) | | 9,070 | | 19,660 | | | 28,380 | | 42,990 | |
Weighted-average number of common shares outstanding (millions of shares) (1) | | 4,025 | | 4,185 | | | 4,064 | | 4,227 | |
Earnings (loss) per common share (dollars) (2) | | 2.25 | | 4.68 | | | 6.98 | | 10.17 | |
Dividends paid per common share (dollars) | | 0.91 | | 0.88 | | | 2.73 | | 2.64 | |
| | | | | | |
(1) Includes restricted shares not vested. |
(2) Earnings (loss) per common share and earnings (loss) per common share – assuming dilution are the same in each period shown. |
Note 6. Pension and Other Postretirement Benefits
| | | | | | | | | | | | | | | | | | | | |
| (millions of dollars) | | Three Months Ended
September 30, | | Nine Months Ended
September 30, |
| 2023 | 2022 | | 2023 | 2022 |
| Components of net benefit cost | | | | | | |
| Pension Benefits - U.S. | | | | | | |
| Service cost | | 111 | | 173 | | | 353 | | 529 | |
| Interest cost | | 169 | | 130 | | | 500 | | 388 | |
| Expected return on plan assets | | (133) | | (140) | | | (399) | | (420) | |
| Amortization of actuarial loss/(gain) | | 21 | | 39 | | | 63 | | 117 | |
| Amortization of prior service cost | | (8) | | (8) | | | (22) | | (22) | |
| Net pension enhancement and curtailment/settlement cost | | 8 | | 87 | | | 23 | | 177 | |
| Net benefit cost | | 168 | | 281 | | | 518 | | 769 | |
| | | | | | |
| Pension Benefits - Non-U.S. | | | | | | |
| Service cost | | 81 | | 138 | | | 244 | | 433 | |
| Interest cost | | 231 | | 149 | | | 697 | | 466 | |
| Expected return on plan assets | | (172) | | (198) | | | (518) | | (618) | |
| Amortization of actuarial loss/(gain) | | 15 | | 44 | | | 43 | | 138 | |
| Amortization of prior service cost | | 13 | | 10 | | | 38 | | 33 | |
| Net pension enhancement and curtailment/settlement cost | | — | | — | | | — | | (1) | |
| Net benefit cost | | 168 | | 143 | | | 504 | | 451 | |
| | | | | | |
| Other Postretirement Benefits | | | | | | |
| Service cost | | 20 | | 30 | | | 60 | | 108 | |
| Interest cost | | 67 | | 54 | | | 206 | | 162 | |
| Expected return on plan assets | | (4) | | (4) | | | (11) | | (11) | |
| Amortization of actuarial loss/(gain) | | (30) | | 1 | | | (91) | | 4 | |
| Amortization of prior service cost | | (11) | | (10) | | | (32) | | (31) | |
| Net benefit cost | | 42 | | 71 | | | 132 | | 232 | |
Note 7. Financial Instruments and Derivatives
The estimated fair value of financial instruments and derivatives at September 30, 2023 and December 31, 2022, and the related hierarchy level for the fair value measurement was as follows:
| | | | | | | | | | | | | | | | | | | | | | | | | | |
| | September 30, 2023 |
| | | | | | | | |
| | | | | | | | |
| | Fair Value | | | | |
| (millions of dollars) | Level 1 | Level 2 | Level 3 | Total Gross Assets
& Liabilities | Effect of
Counterparty Netting | Effect of
Collateral
Netting | Difference in Carrying Value and Fair Value | Net
Carrying
Value |
| Assets | | | | | | | | |
Derivative assets (1) | 7,459 | | 1,485 | | — | | 8,944 | | (8,279) | | (238) | | — | | 427 | |
| | | | | | | | |
Advances to/receivables from equity companies (2)(6) | — | | 2,456 | | 4,927 | | 7,383 | | — | | — | | 621 | | 8,004 | |
| | | | | | | | |
Other long-term financial assets (3) | 1,294 | | — | | 854 | | 2,148 | | — | | — | | 264 | | 2,412 | |
| | | | | | | | |
| Liabilities | | | | | | | | |
Derivative liabilities (4) | 7,354 | | 1,624 | | — | | 8,978 | | (8,279) | | (132) | | — | | 567 | |
Long-term debt (5) | 28,555 | | 1,164 | | 4 | | 29,723 | | — | | — | | 5,045 | | 34,768 | |
| | | | | | | | |
Long-term obligations to equity companies (6) | — | | — | | 2,163 | | 2,163 | | — | | — | | (87) | | 2,076 | |
| | | | | | | | |
Other long-term financial liabilities (7) | — | | — | | 665 | | 665 | | — | | — | | 50 | | 715 | |
| | | | | | | | | | | | | | | | | | | | | | | | | | | |
| | | December 31, 2022 |
| | | | | | | | | |
| | | | | | | | | |
| | | Fair Value | | | | |
| (millions of dollars) | | Level 1 | Level 2 | Level 3 | Total Gross Assets
& Liabilities | Effect of
Counterparty Netting | Effect of
Collateral
Netting | Difference in Carrying Value and Fair Value | Net
Carrying
Value |
| Assets | | | | | | | | | |
Derivative assets (1) | | 4,309 | | 3,455 | | — | | 7,764 | | (5,778) | | (969) | | — | | 1,017 | |
| | | | | | | | | |
Advances to/receivables from equity companies (2)(6) | | — | | 2,406 | | 4,958 | | 7,364 | | — | | — | | 685 | | 8,049 | |
| | | | | | | | | |
Other long-term financial assets (3) | | 1,208 | | — | | 1,413 | | 2,621 | | — | | — | | 346 | | 2,967 | |
| | | | | | | | | |
| Liabilities | | | | | | | | | |
Derivative liabilities (4) | | 3,417 | | 3,264 | | — | | 6,681 | | (5,778) | | (79) | | — | | 824 | |
Long-term debt (5) | | 33,112 | | 1,880 | | 6 | | 34,998 | | — | | — | | 4,173 | | 39,171 | |
| | | | | | | | | |
Long-term obligations to equity companies (6) | | — | | — | | 2,467 | | 2,467 | | — | | — | | (129) | | 2,338 | |
| | | | | | | | | |
Other long-term financial liabilities (7) | | — | | — | | 679 | | 679 | | — | | — | | 38 | | 717 | |
| | |
(1) Included in the Balance Sheet lines: Notes and accounts receivable - net and Other assets, including intangibles - net. |
(2) Included in the Balance Sheet line: Investments, advances and long-term receivables. |
(3) Included in the Balance Sheet lines: Investments, advances and long-term receivables and Other assets, including intangibles - net. |
(4) Included in the Balance Sheet lines: Accounts payable and accrued liabilities and Other long-term obligations. |
(5) Excluding finance lease obligations. |
(6) Advances to/receivables from equity companies and long-term obligations to equity companies are mainly designated as hierarchy level 3 inputs. The fair value is calculated by discounting the remaining obligations by a rate consistent with the credit quality and industry of the company. |
(7) Included in the Balance Sheet line: Other long-term obligations. Includes contingent consideration related to a prior year acquisition where fair value is based on expected drilling activities and discount rates. |
At September 30, 2023 and December 31, 2022, respectively, the Corporation had $834 million and $1,494 million of collateral under master netting arrangements not offset against the derivatives on the Condensed Consolidated Balance Sheet, primarily related to initial margin requirements.
The Corporation may use non-derivative financial instruments, such as its foreign currency-denominated debt, as hedges of its net investments in certain foreign subsidiaries. Under this method, the change in the carrying value of the financial instruments due to foreign exchange fluctuations is reported in accumulated other comprehensive income. As of September 30, 2023, the Corporation has designated $4.8 billion of its Euro-denominated debt and related accrued interest as a net investment hedge of its European business. The net investment hedge is deemed to be perfectly effective.
The Corporation had undrawn short-term committed lines of credit of $524 million and undrawn long-term committed lines of credit of $834 million as of third quarter 2023.
Derivative Instruments
The Corporation’s size, strong capital structure, geographic diversity, and the complementary nature of its business segments reduce the Corporation’s enterprise-wide risk from changes in commodity prices, currency rates and interest rates. In addition, the Corporation uses commodity-based contracts, including derivatives, to manage commodity price risk and to generate returns from trading. Commodity contracts held for trading purposes are presented in the Condensed Consolidated Statement of Income on a net basis in the line “Sales and other operating revenue" and in the Consolidated Statement of Cash Flows in “Cash Flows from Operating Activities”. The Corporation’s commodity derivatives are not accounted for under hedge accounting. At times, the Corporation also enters into currency and interest rate derivatives, none of which are material to the Corporation’s financial position as of September 30, 2023 and December 31, 2022, or results of operations for the periods ended September 30, 2023 and 2022.
Credit risk associated with the Corporation’s derivative position is mitigated by several factors, including the use of derivative clearing exchanges and the quality of and financial limits placed on derivative counterparties. The Corporation maintains a system of controls that includes the authorization, reporting, and monitoring of derivative activity.
The net notional long/(short) position of derivative instruments at September 30, 2023 and December 31, 2022, was as follows:
| | | | | | | | |
|
| | |
| (millions) | September 30, 2023 | December 31, 2022 |
| Crude oil (barrels) | 14 | | 4 | |
| Petroleum products (barrels) | (95) | | (52) | |
| Natural gas (MMBTUs) | (151) | | (64) | |
| | |
Realized and unrealized gains/(losses) on derivative instruments that were recognized in the Condensed Consolidated Statement of Income are included in the following lines on a before-tax basis:
| | | | | | | | | | | | | | | | | | | | |
| | | | | |
|
| | | | | | |
| (millions of dollars) | | Three Months Ended
September 30, | | Nine Months Ended
September 30, |
| 2023 | 2022 | | 2023 | 2022 |
| Sales and other operating revenue | | (1,049) | | 945 | | | (66) | | (3,003) | |
| Crude oil and product purchases | | 34 | | (56) | | | 14 | | (82) | |
| Total | | (1,015) | | 889 | | | (52) | | (3,085) | |
Note 8. Disclosures about Segments and Related Information
| | | | | | | | | | | | | | | | | | | | |
| (millions of dollars) | | Three Months Ended
September 30, | | Nine Months Ended
September 30, |
| 2023 | 2022 | | 2023 | 2022 |
| Earnings (Loss) After Income Tax | | | | | | |
| Upstream | | | | | | |
| United States | | 1,566 | | 3,110 | | | 4,118 | | 9,235 | |
Non-U.S. (1) | | 4,559 | | 9,309 | | | 13,041 | | 19,043 | |
| Energy Products | | | | | | |
| United States | | 1,356 | | 3,008 | | | 4,794 | | 6,152 | |
| Non-U.S. | | 1,086 | | 2,811 | | | 4,141 | | 4,744 | |
| Chemical Products | | | | | | |
| United States | | 338 | | 635 | | | 1,148 | | 2,030 | |
| Non-U.S. | | (89) | | 177 | | | 300 | | 1,263 | |
| Specialty Products | | | | | | |
| United States | | 326 | | 306 | | | 1,150 | | 784 | |
| Non-U.S. | | 293 | | 456 | | | 914 | | 871 | |
Corporate and Financing (1) | | (365) | | (152) | | | (1,226) | | (1,132) | |
| Corporate total | | 9,070 | | 19,660 | | | 28,380 | | 42,990 | |
| | | | | | |
| Sales and Other Operating Revenue | | | | | | |
| Upstream | | | | | | |
| United States | | 2,587 | | 4,163 | | | 7,030 | | 10,777 | |
| Non-U.S. | | 3,424 | | 8,770 | | | 12,550 | | 22,214 | |
| Energy Products | | | | | | |
| United States | | 27,251 | | 31,324 | | | 78,303 | | 90,650 | |
| Non-U.S. | | 45,295 | | 50,215 | | | 124,216 | | 144,734 | |
| Chemical Products | | | | | | |
| United States | | 1,924 | | 2,499 | | | 5,945 | | 8,773 | |
| Non-U.S. | | 3,557 | | 4,213 | | | 10,927 | | 13,207 | |
| Specialty Products | | | | | | |
| United States | | 1,503 | | 1,615 | | | 4,613 | | 4,659 | |
| Non-U.S. | | 2,998 | | 3,709 | | | 9,382 | | 10,478 | |
| Corporate and Financing | | 31 | | 4 | | | 43 | | 19 | |
| Corporate total | | 88,570 | | 106,512 | | | 253,009 | | 305,511 | |
| | | | | | |
| Intersegment Revenue | | | | | | |
| Upstream | | | | | | |
| United States | | 5,091 | | 6,536 | | | 15,091 | | 19,907 | |
| Non-U.S. | | 10,532 | | 11,723 | | | 28,343 | | 36,091 | |
| Energy Products | | | | | | |
| United States | | 6,724 | | 7,580 | | | 17,249 | | 22,777 | |
| Non-U.S. | | 7,286 | | 9,551 | | | 21,243 | | 29,161 | |
| Chemical Products | | | | | | |
| United States | | 2,231 | | 2,579 | | | 6,103 | | 6,904 | |
| Non-U.S. | | 976 | | 1,252 | | | 2,730 | | 4,359 | |
| Specialty Products | | | | | | |
| United States | | 594 | | 662 | | | 1,958 | | 1,934 | |
| Non-U.S. | | 142 | | 246 | | | 410 | | 665 | |
| Corporate and Financing | | 39 | | 59 | | | 167 | | 175 | |
| | | | | | |
(1) Results for first quarter 2022 include charges of $3.3 billion in non-U.S. Upstream and $0.1 billion in Corporate and Financing associated with the expropriation of the Corporation's interest in Sakhalin-1. |
|
| | | | | | | | | | | | | | | | | | | | |
| Geographic Sales and Other Operating Revenue | | | | | | |
| (millions of dollars) | | Three Months Ended
September 30, | | Nine Months Ended
September 30, |
| 2023 | 2022 | | 2023 | 2022 |
| United States | | 33,265 | | 39,601 | | | 95,891 | | 114,859 | |
| Non-U.S. | | 55,305 | | 66,911 | | | 157,118 | | 190,652 | |
| Total | | 88,570 | | 106,512 | | | 253,009 | | 305,511 | |
| | | | | | |
Significant Non-U.S. revenue sources include: (1) | | | | | | |
| Canada | | 8,314 | | 8,468 | | | 21,860 | | 25,105 | |
| United Kingdom | | 5,509 | | 8,845 | | | 17,762 | | 24,699 | |
| Singapore | | 3,880 | | 5,262 | | | 11,369 | | 14,358 | |
| France | | 4,017 | | 4,449 | | | 10,995 | | 14,071 | |
| Italy | | 2,923 | | 2,990 | | | 7,986 | | 8,888 | |
| Belgium | | 2,407 | | 2,755 | | | 7,467 | | 8,632 | |
| Australia | | 2,448 | | 2,936 | | | 7,269 | | 8,597 | |
| | | | | | |
(1) Revenue is determined by primary country of operations. Excludes certain sales and other operating revenues in non-U.S. operations where attribution to a specific country is not practicable. |
Revenue from Contracts with Customers
Sales and other operating revenue includes both revenue within the scope of ASC 606 and outside the scope of ASC 606. Trade receivables in Notes and accounts receivable – net reported on the Balance Sheet also includes both receivables within the scope of ASC 606 and those outside the scope of ASC 606. Revenue and receivables outside the scope of ASC 606 primarily relate to physically settled commodity contracts accounted for as derivatives. Contractual terms, credit quality, and type of customer are generally similar between those revenues and receivables within the scope of ASC 606 and those outside it.
| | | | | | | | | | | | | | | | | | | | | |
Sales and other operating revenue (millions of dollars) | | Three Months Ended
September 30, | | Nine Months Ended
September 30, |
| 2023 | 2022 | | 2023 | | 2022 |
| | | | | | | |
| Revenue from contracts with customers | | 68,533 | | 79,358 | | | 196,159 | | | 234,025 | |
| Revenue outside the scope of ASC 606 | | 20,037 | | 27,154 | | | 56,850 | | | 71,486 | |
| Total | | 88,570 | | 106,512 | | | 253,009 | | | 305,511 | |
Note 9. Divestment Activities
Through September 30, 2023, the Corporation realized proceeds of approximately $3.1 billion from its divestment activities in 2023 with negligible impact on net after-tax earnings. This included the sale of the Aera Energy joint venture, Esso Thailand Ltd., the Billings Refinery, certain unconventional assets in the United States, as well as other smaller divestments.
In 2022, the Corporation realized proceeds of approximately $5 billion and recognized net after-tax earnings of approximately $0.4 billion from its divestment activities. This included the sale of certain unproved assets in Romania and unconventional assets in Canada and the United States, as well as other smaller divestments.
In November 2022, the Corporation executed an agreement for the sale of the Santa Ynez Unit and associated assets in California. The agreement is subject to certain conditions precedent and government approvals and does not yet meet held-for-sale criteria under ASC 360. Should the conditions precedent be met and the potential transaction close, the Corporation would expect to recognize a loss of up to $2 billion.
In February 2022, the Corporation signed an agreement with Seplat Energy Offshore Limited for the sale of Mobil Producing Nigeria Unlimited. The agreement is subject to certain conditions precedent and government approvals. In mid-2022, a Nigerian court issued an order to halt transition activities and enter into arbitration with the Nigerian National Petroleum Company. The closing date and any loss on sale will depend on resolution of these matters.
Note 10. Denbury Acquisition
On July 13, 2023, the Corporation entered into an agreement to acquire Denbury Inc., a developer of carbon capture, utilization and storage solutions and enhanced oil recovery in exchange for ExxonMobil common stock. Based on the July 12 closing price for ExxonMobil shares, and at a fixed exchange rate of 0.84 per Denbury share, the transaction value was $4.9 billion. We expect that the number of shares issuable in connection with the transaction to be approximately 45 million. Denbury scheduled a shareholder vote for October 31, 2023, and assuming shareholder approval, the transaction is currently expected to close in early November. In addition to carbon capture and storage assets, the acquisition includes Gulf Coast and Rocky Mountain oil and natural gas operations which consist of proved reserves totaling over 200 million barrels of oil equivalent (as of December 31, 2022), with approximately 47 thousand oil-equivalent barrels per day of production for the first half of 2023.
Note 11. Pioneer Natural Resources Merger
On October 11, 2023, the Corporation entered into a merger agreement with Pioneer Natural Resources, an independent oil and gas exploration and production company, in exchange for ExxonMobil common stock. Based on the October 10 closing price for ExxonMobil shares, the fixed exchange rate of 2.3234 per Pioneer share, and Pioneer's outstanding net debt, the implied enterprise value of the transaction was approximately $65 billion. We expect that the number of shares issuable in connection with the transaction to be approximately 546 million. The transaction is currently expected to close in the first half of 2024, subject to regulatory approvals.
Pioneer holds over 850,000 net acres in the Midland Basin of West Texas, which consist of proved reserves totaling over 2.3 billion barrels of oil equivalent (as of December 31, 2022) and over 700 thousand oil-equivalent barrels per day of production for the three months ended June 30, 2023.
ITEM 2. MANAGEMENT'S DISCUSSION AND ANALYSIS OF FINANCIAL CONDITION AND RESULTS OF OPERATIONS
Overview
During the first quarter of 2023, the price of crude oil declined towards the average of the 10-year range (2010-2019), impacted by higher inventory levels, and remained relatively flat during the second quarter. In the third quarter, crude oil prices increased as a result of strong demand, tight inventory levels, and ongoing actions by OPEC+ oil producers to limit supply, which helped mitigate concerns over potential market impacts from a weakening global economy. While natural gas prices remained above the 10-year average they have declined significantly over the first nine months of the year with storage levels increasing above historical averages in the United States and Europe on higher supply and lower demand. During the first half of 2023, refining margins declined on easing supply concerns with stabilization of Russian supply. However, in the third quarter, strong demand for gasoline and distillate combined with low inventories pushed refining margins above the 10-year range. Chemical margins remained well below the 10-year range, as excess supply continued to outpace rising demand.
The Corporation’s results for the first nine months included after-tax charges of $0.2 billion related to additional European taxes imposed on the energy sector, mainly reflected in the line “Income tax expense (benefit).” The enactment of regulations in late 2022 by European Member States and other countries imposed mandatory taxes on certain companies active in the crude petroleum, coal, natural gas, and refinery sectors.
The Corporation tests assets or groups of assets for recoverability on an ongoing basis whenever events or changes in circumstances indicate that the carrying amounts may not be recoverable and has a robust process to monitor for indicators of potential impairment across its asset groups throughout the year. As part of its annual planning and budgeting process, the Corporation is currently assessing its portfolio to prioritize assets with the highest future value potential within its broad range of available opportunities while identifying potential asset divestment candidates. This effort includes an ongoing re-assessment of industry and regulatory factors, macroeconomic considerations, and the company’s project execution plans. Depending on the outcome of the planning process, including in particular significant future changes to the Corporation’s current development plans for its long-lived assets or increases in the likelihood of divestments, certain assets groups could be at risk for impairment. This planning process is expected to be completed with required review by the Board of Directors in the fourth quarter. If needed, assessments on an asset-level basis will be completed following this Board review.
Recent Mergers and Acquisitions
On July 13, 2023, the Corporation announced that it had entered into a definitive agreement to acquire Denbury Inc. The acquisition further accelerates the Corporation’s Low Carbon Solutions opportunities. See Note 10 of the Condensed Consolidated Financial Statements for additional information.
On October 11, 2023, the Corporation announced that it had entered into a definitive merger agreement with Pioneer Natural Resources. At close, ExxonMobil’s Permian production volume would more than double to 1.3 million barrels of oil equivalent per day, based on anticipated 2023 volumes. The transaction represents an opportunity to deliver leading capital efficiency and cost performance as well as increase production by combining Pioneer’s large-scale, contiguous, high-quality undeveloped Midland acreage with ExxonMobil’s Permian resource development approach. See Note 11 of the Condensed Consolidated Financial Statements for additional information.
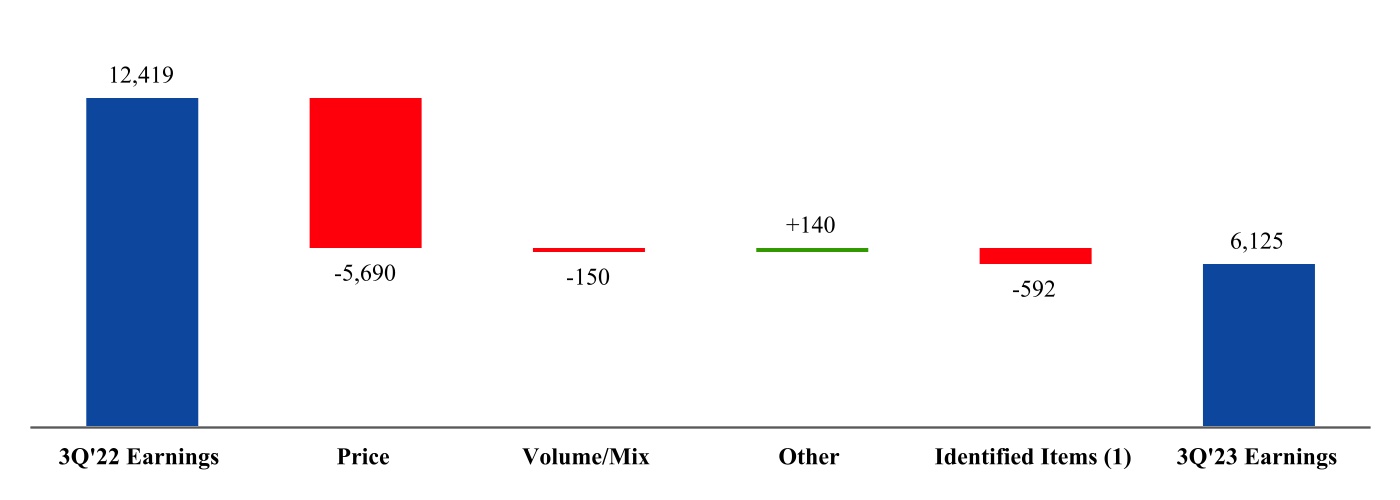
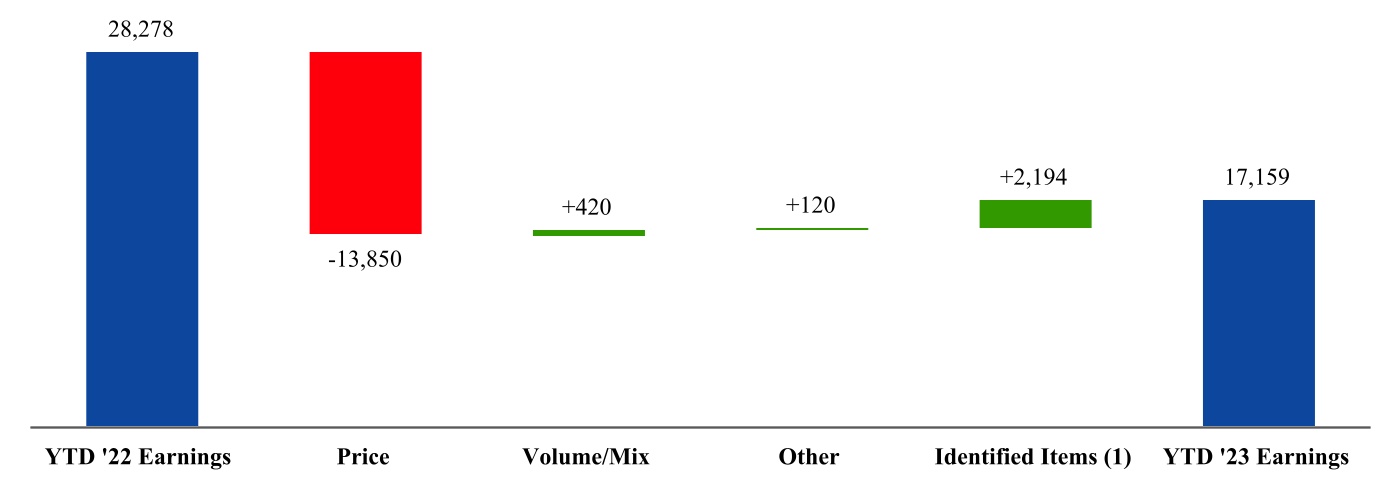
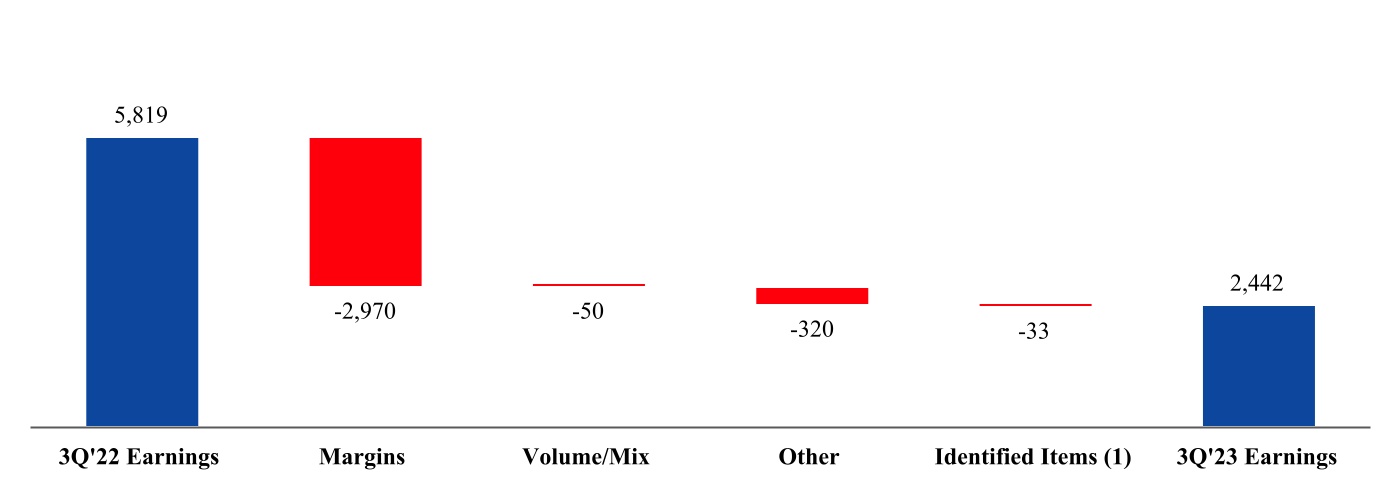
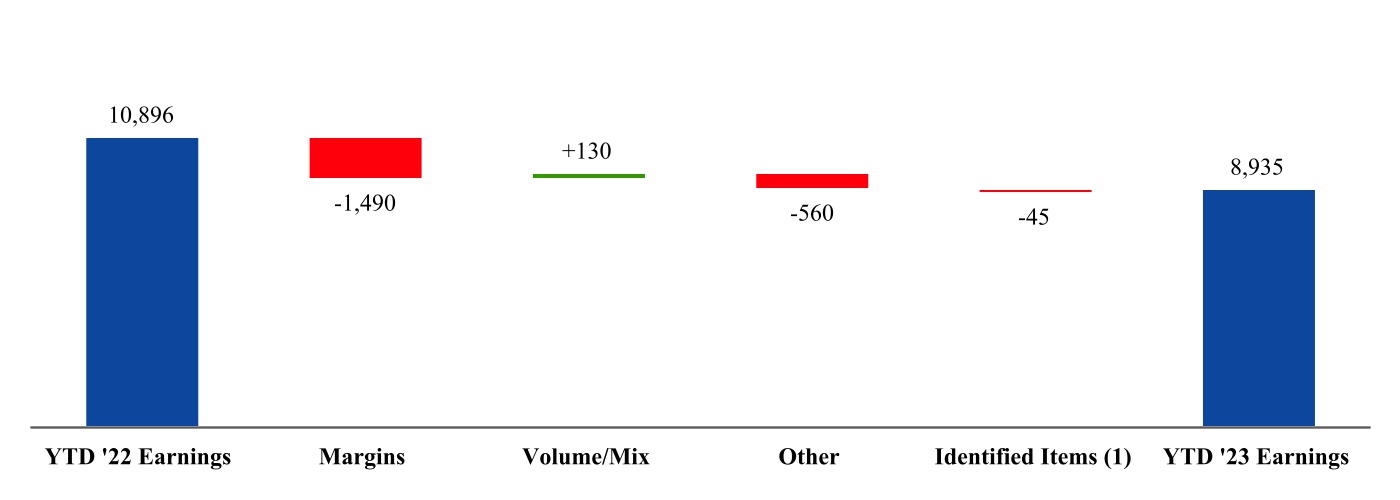
FUNCTIONAL EARNINGS SUMMARY
Earnings (loss) excluding Identified Items (non-GAAP) are earnings (loss) excluding individually significant non-operational events with, typically, an absolute corporate total earnings impact of at least $250 million in a given quarter. The earnings (loss) impact of an identified item for an individual segment may be less than $250 million when the item impacts several periods or several segments. Earnings (loss) excluding identified items does include non-operational earnings events or impacts that are generally below the $250 million threshold utilized for Identified Items. Management uses these figures to improve comparability of the underlying business across multiple periods by isolating and removing significant non-operational events from business results. The Corporation believes this view provides investors increased transparency into business results and trends and provides investors with a view of the business as seen through the eyes of management. Earnings (loss) excluding Identified Items is not meant to be viewed in isolation or as a substitute for net income (loss) attributable to ExxonMobil as prepared in accordance with U.S. GAAP.
| | | | | | | | | | | | | | | | | | | | | | | | | | | | | | | | | | | | | |
Three Months Ended
September 30, 2023 | Upstream | | Energy Products | | Chemical Products | Specialty Products | | | Corporate and Financing | | Total |
| (millions of dollars) | U.S. | Non-U.S. | | U.S. | Non-U.S. | | U.S. | Non-U.S. | U.S. | Non-U.S. | | | |
Earnings (loss) (U.S. GAAP) | 1,566 | | 4,559 | | | 1,356 | | 1,086 | | | 338 | | (89) | | 326 | | 293 | | | | (365) | | | 9,070 | |
| Identified Items | | | | | | | | | | | | | | | |
| | | | | | | | | | | | | | | |
| | | | | | | | | | | | | | | |
| | | | | | | | | | | | | | | |
| Tax-related items | — | | (14) | | | — | | (33) | | | — | | — | | — | | — | | | | — | | | (47) | |
| | | | | | | | | | | | | | | |
| | | | | | | | | | | | | | | |
| | | | | | | | | | | | | | | |
| | | | | | | | | | | | | | | |
Earnings (loss) excluding Identified Items (Non-GAAP) | 1,566 | | 4,573 | | | 1,356 | | 1,119 | | | 338 | | (89) | | 326 | | 293 | | | | (365) | | | 9,117 | |
| | | | | | | | | | | | | | | |
Three Months Ended
September 30, 2022 | Upstream | | Energy Products | | Chemical Products | Specialty Products | | | Corporate and Financing | | Total |
| (millions of dollars) | U.S. | Non-U.S. | | U.S. | Non-U.S. | | U.S. | Non-U.S. | U.S. | Non-U.S. | | | |
Earnings (loss) (U.S. GAAP) | 3,110 | | 9,309 | | | 3,008 | | 2,811 | | | 635 | | 177 | | 306 | | 456 | | | | (152) | | | 19,660 | |
| Identified Items | | | | | | | | | | | | | | | |
| Impairments | — | | (697) | | | — | | — | | | — | | — | | — | | — | | | | — | | | (697) | |
| Gain/(loss) on sale of assets | — | | 587 | | | — | | — | | | — | | — | | — | | — | | | | — | | | 587 | |
| | | | | | | | | | | | | | | |
| Tax-related items | — | | — | | | — | | — | | | — | | — | | — | | — | | | | 324 | | | 324 | |
| | | | | | | | | | | | | | | |
| | | | | | | | | | | | | | | |
| Other | — | | 688 | | | — | | — | | | — | | — | | — | | — | | | | 76 | | | 764 | |
| | | | | | | | | | | | | | | |
Earnings (loss) excluding Identified Items (Non-GAAP) | 3,110 | | 8,731 | | | 3,008 | | 2,811 | | | 635 | | 177 | | 306 | | 456 | | | | (552) | | | 18,682 | |
| | | | | | | | | | | | | | | |
Nine Months Ended
September 30, 2023 | Upstream | | Energy Products | | Chemical Products | Specialty Products | | | Corporate and Financing | | Total |
| (millions of dollars) | U.S. | Non-U.S. | | U.S. | Non-U.S. | | U.S. | Non-U.S. | U.S. | Non-U.S. | | | |
Earnings (loss) (U.S. GAAP) | 4,118 | | 13,041 | | | 4,794 | | 4,141 | | | 1,148 | | 300 | | 1,150 | | 914 | | | | (1,226) | | | 28,380 | |
| Identified Items | | | | | | | | | | | | | | | |
| | | | | | | | | | | | | | | |
| | | | | | | | | | | | | | | |
| | | | | | | | | | | | | | | |
| Tax-related items | — | | (184) | | | — | | (45) | | | — | | — | | — | | — | | | | — | | | (229) | |
| | | | | | | | | | | | | | | |
| | | | | | | | | | | | | | | |
| | | | | | | | | | | | | | | |
| | | | | | | | | | | | | | | |
Earnings (loss) excluding Identified Items (Non-GAAP) | 4,118 | | 13,225 | | | 4,794 | | 4,186 | | | 1,148 | | 300 | | 1,150 | | 914 | | | | (1,226) | | | 28,609 | |
| | | | | | | | | | | | | | | |
| | | | | | | | | | | | | | | |
Nine Months Ended
September 30, 2022 | Upstream | | Energy Products | | Chemical Products | Specialty Products | | | Corporate and Financing | | Total |
| (millions of dollars) | U.S. | Non-U.S. | | U.S. | Non-U.S. | | U.S. | Non-U.S. | U.S. | Non-U.S. | | | |
Earnings (loss) (U.S. GAAP) | 9,235 | | 19,043 | | | 6,152 | | 4,744 | | | 2,030 | | 1,263 | | 784 | | 871 | | | | (1,132) | | | 42,990 | |
| Identified Items | | | | | | | | | | | | | | | |
| Impairments | — | | (3,574) | | | — | | — | | | — | | — | | — | | — | | | | (98) | | | (3,672) | |
| Gain/(loss) on sale of assets | 299 | | 587 | | | — | | — | | | — | | — | | — | | — | | | | — | | | 886 | |
| | | | | | | | | | | | | | | |
| Tax-related items | — | | — | | | — | | — | | | — | | — | | — | | — | | | | 324 | | | 324 | |
| | | | | | | | | | | | | | | |
| | | | | | | | | | | | | | | |
| Other | — | | 310 | | | — | | — | | | — | | — | | — | | — | | | | 76 | | | 386 | |
| | | | | | | | | | | | | | | |
Earnings (loss) excluding Identified Items (Non-GAAP) | 8,936 | | 21,720 | | | 6,152 | | 4,744 | | | 2,030 | | 1,263 | | 784 | | 871 | | | | (1,434) | | | 45,066 | |
References in this discussion to Corporate earnings (loss) mean net income (loss) attributable to ExxonMobil (U.S. GAAP) from the Condensed Consolidated Statement of Income. Unless otherwise indicated, references to earnings (loss); Upstream, Energy Products, Chemical Products, Specialty Products, and Corporate and Financing earnings (loss); and earnings (loss) per share are ExxonMobil's share after excluding amounts attributable to noncontrolling interests.
Due to rounding, numbers presented may not add up precisely to the totals indicated.
REVIEW OF THIRD QUARTER 2023 RESULTS
ExxonMobil’s third-quarter 2023 earnings were $9.1 billion, or $2.25 per share assuming dilution, compared with earnings of $19.7 billion a year earlier. The decrease in earnings was driven by lower crude and natural gas prices, and declining industry refining and chemical margins. Capital and exploration expenditures were $6.0 billion, up $0.3 billion from third quarter 2022.
Earnings for the first nine months of 2023 were $28.4 billion, or $6.98 per diluted share, compared with $43.0 billion a year earlier. Capital and exploration expenditures were $18.6 billion, up $3.3 billion from 2022. The Corporation distributed $11.1 billion in dividends to shareholders and repurchased $13.1 billion of common stock.
UPSTREAM
| | | | | | | | | | | | | | | | | | | | |
| Upstream Financial Results | | | | | | |
| | | | | | |
| (millions of dollars) | | Three Months Ended
September 30, | | Nine Months Ended
September 30, |
| 2023 | 2022 | | 2023 | 2022 |
Earnings (loss) (U.S. GAAP) | | | | | | |
| United States | | 1,566 | | 3,110 | | | 4,118 | | 9,235 | |
| Non-U.S. | | 4,559 | | 9,309 | | | 13,041 | | 19,043 | |
| Total | | 6,125 | | 12,419 | | | 17,159 | | 28,278 | |
| | | | | | |
Identified Items (1) | | | | | | |
| United States | | — | | — | | | — | | 299 | |
| Non-U.S. | | (14) | | 578 | | | (184) | | (2,677) | |
| Total | | (14) | | 578 | | | (184) | | (2,378) | |
| | | | | | |
Earnings (loss) excluding Identified Items (1) (Non-GAAP) | | | | | | |
| United States | | 1,566 | | 3,110 | | | 4,118 | | 8,936 | |
| Non-U.S. | | 4,573 | | 8,731 | | | 13,225 | | 21,720 | |
| Total | | 6,139 | | 11,841 | | | 17,343 | | 30,656 | |
| | | | | | | | | | | | | | |
Upstream Third Quarter Earnings Factor Analysis | | |
| (millions of dollars) | | | | |
Price – Price impacts decreased earnings by $5,690 million, driven by a 59% decrease in average natural gas realizations and a 14% decrease in average crude realizations.
Volume/Mix – Lower volumes decreased earnings by $150 million, mainly driven by natural gas, partly offset by liquids growth in Guyana and the Permian.
Other – All other items increased earnings by $140 million.
Identified Items (1) – 3Q 2022 $578 million gain on the sale of Romania and XTO Energy Canada assets and one-time benefits from tax and other reserve adjustments, partly offset by impairments. 3Q 2023 $(14) million loss driven by additional European taxes.
(1) Refer to Functional Earnings Summary for definition of Identified Items and earnings (loss) excluding Identified Items.
| | | | | | | | | | | | | | |
| Upstream Year-to-Date Earnings Factor Analysis | | |
| (millions of dollars) | | | | |
Price – Price impacts decreased earnings by $13,850 million, driven by a 40% decrease in average natural gas realizations and a 24% decrease in average realizations for crude oil.
Volume/Mix – Favorable volume and mix effects increased earnings by $420 million, driven by higher production from our advantaged projects in Guyana and the Permian.
Other – All other items increased earnings by $120 million, largely due to the absence of divestment-related impairments.
Identified Items (1) – 2022 $(2,378) million loss as a result of the Russia expropriation, partly offset by gains on the sale of the U.S. Barnett Shale, Romania, and XTO Energy Canada assets and one-time benefits from tax and other reserve adjustments. 2023 $(184) million loss driven by additional European taxes.
(1) Refer to Functional Earnings Summary for definition of Identified Items and earnings (loss) excluding Identified Items.
| | | | | | | | | | | | | | | | | | | | | | |
| Upstream Operational Results | | | | | | | | |
| | | | | | | | |
| | Three Months Ended
September 30, | | Nine Months Ended
September 30, |
| | | 2023 | | 2022 | | 2023 | | 2022 |
Net production of crude oil, natural gas liquids, bitumen and synthetic oil (thousands of barrels daily) | | | | | | | | |
| United States | | 756 | | | 783 | | | 787 | | | 771 | |
| Canada/Other Americas | | 655 | | | 641 | | | 648 | | | 558 | |
| Europe | | 4 | | | 4 | | | 4 | | | 4 | |
| Africa | | 229 | | | 249 | | | 218 | | | 243 | |
| Asia | | 713 | | | 666 | | | 721 | | | 698 | |
| Australia/Oceania | | 40 | | | 46 | | | 37 | | | 44 | |
| Worldwide | | 2,397 | | | 2,389 | | | 2,415 | | | 2,318 | |
| | | | | | | | |
Net natural gas production available for sale (millions of cubic feet daily) | | | | | | | | |
| United States | | 2,271 | | | 2,351 | | | 2,328 | | | 2,607 | |
| Canada/Other Americas | | 94 | | | 158 | | | 96 | | | 175 | |
| Europe | | 368 | | | 541 | | | 429 | | | 711 | |
| Africa | | 129 | | | 70 | | | 116 | | | 65 | |
| Asia | | 3,528 | | | 3,304 | | | 3,491 | | | 3,321 | |
| Australia/Oceania | | 1,358 | | | 1,539 | | | 1,303 | | | 1,460 | |
| Worldwide | | 7,748 | | | 7,963 | | | 7,763 | | | 8,339 | |
| | | | | | | | |
| | | | | | | | | |
Oil-equivalent production (1) (thousands of oil-equivalent barrels daily) | | 3,688 | | | 3,716 | | | 3,709 | | | 3,708 | |
| | | | | | | | |
(1) Natural gas is converted to an oil-equivalent basis at six million cubic feet per one thousand barrels. |
| | | | | | | | | | | | | | | | |
| Upstream Additional Information | | | | | | |
| | | | | | |
| (thousands of barrels daily) | | | Three Months Ended
September 30 | | | Nine Months Ended
September 30 |
Volumes reconciliation (Oil-equivalent production) (1) | | | | | | |
| 2022 | | | 3,716 | | | 3,708 |
| Entitlements - Net Interest | | | (6) | | | (32) |
| Entitlements - Price / Spend / Other | | | 44 | | | 66 |
| Government Mandates | | | (36) | | | (28) |
| Divestments | | | (109) | | | (130) |
| Growth / Other | | | 79 | | | 125 |
| 2023 | | | 3,688 | | | 3,709 |
| | | | | | |
(1) Natural gas is converted to an oil-equivalent basis at six million cubic feet per one thousand barrels. |
| | | | | | | | | | | | | | |
3Q 2023 versus 3Q 2022 | 3.7 million oil-equivalent barrels per day in 3Q 2023 decreased 28 thousand oil-equivalent barrels per day from 3Q 2022. Excluding the impacts from entitlements, divestments, and higher government-mandated curtailments, net production grew by 79 thousand oil-equivalent barrels per day driven by Permian and Guyana. |
YTD 2023 versus YTD 2022 | 3.7 million oil-equivalent barrels per day in 2023 increased 1 thousand oil-equivalent barrels per day from 2022. Excluding the impacts from entitlements, Russia expropriation, divestments, and higher government-mandated curtailments, net production grew by 125 thousand oil-equivalent barrels per day driven by Permian and Guyana. |
Listed below are descriptions of ExxonMobil’s volumes reconciliation factors which are provided to facilitate understanding of the terms.
Entitlements - Net Interest are changes to ExxonMobil’s share of production volumes caused by non-operational changes to volume-determining factors. These factors consist of net interest changes specified in Production Sharing Contracts (PSCs), which typically occur when cumulative investment returns or production volumes achieve defined thresholds, changes in equity upon achieving pay-out in partner investment carry situations, equity redeterminations as specified in venture agreements, or as a result of the termination or expiry of a concession. Once a net interest change has occurred, it typically will not be reversed by subsequent events, such as lower crude oil prices.
Entitlements - Price, Spend and Other are changes to ExxonMobil’s share of production volumes resulting from temporary changes to non-operational volume-determining factors. These factors include changes in oil and gas prices or spending levels from one period to another. According to the terms of contractual arrangements or government royalty regimes, price or spending variability can increase or decrease royalty burdens and/or volumes attributable to ExxonMobil. For example, at higher prices, fewer barrels are required for ExxonMobil to recover its costs. These effects generally vary from period to period with field spending patterns or market prices for oil and natural gas. Such factors can also include other temporary changes in net interest as dictated by specific provisions in production agreements.
Government Mandates are changes to ExxonMobil's sustainable production levels as a result of production limits or sanctions imposed by governments.
Divestments are reductions in ExxonMobil’s production arising from commercial arrangements to fully or partially reduce equity in a field or asset in exchange for financial or other economic consideration.
Growth and Other comprise all other operational and non-operational factors not covered by the above definitions that may affect volumes attributable to ExxonMobil. Such factors include, but are not limited to, production enhancements from project and work program activities, acquisitions including additions from asset exchanges, downtime, market demand, natural field decline, and any fiscal or commercial terms that do not affect entitlements.
ENERGY PRODUCTS
| | | | | | | | | | | | | | | | | | | | | | |
| Energy Products Financial Results | | | | | | | | |
| | | | | | | | |
| (millions of dollars) | | Three Months Ended
September 30, | | Nine Months Ended
September 30, |
| 2023 | | 2022 | | 2023 | | 2022 |
Earnings (loss) (U.S. GAAP) | | | | | | | | |
| United States | | 1,356 | | | 3,008 | | | 4,794 | | | 6,152 | |
| Non-U.S. | | 1,086 | | | 2,811 | | | 4,141 | | | 4,744 | |
| Total | | 2,442 | | | 5,819 | | | 8,935 | | | 10,896 | |
| | | | | | | | |
Identified Items (1) | | | | | | | | |
| United States | | — | | | — | | | — | | | — | |
| Non-U.S. | | (33) | | | — | | | (45) | | | — | |
| Total | | (33) | | | — | | | (45) | | | — | |
| | | | | | | | |
Earnings (loss) excluding Identified Items (1) (Non-GAAP) | | | | | | | | |
| United States | | 1,356 | | | 3,008 | | | 4,794 | | | 6,152 | |
| Non-U.S. | | 1,119 | | | 2,811 | | | 4,186 | | | 4,744 | |
| Total | | 2,475 | | | 5,819 | | | 8,980 | | | 10,896 | |
| | | | | | | | |
| Due to rounding, numbers presented may not add up precisely to the totals indicated. | | | | |
| | | | | | | | | | | | | | |
Energy Products Third Quarter Earnings Factor Analysis | | |
| (millions of dollars) | | | | |
Margins – Weaker industry refining margins and trading-related impacts, including negative derivative mark-to-market effects and other timing effects that were largely non-cash, which were impacted by rising prices in the quarter compared to declining prices in the third quarter last year, decreased earnings by $2,970 million.
Volume/Mix – Volume and mix decreased earnings by $50 million, primarily driven by planned maintenance.
Other – All other items decreased earnings by $320 million, mainly related to unfavorable foreign exchange impacts and higher maintenance expenses.
Identified Items (1) – 3Q 2023 $(33) million loss related to additional European taxes.
(1) Refer to Functional Earnings Summary for definition of Identified Items and earnings (loss) excluding Identified Items.
| | | | | | | | | | | | | | |
| Energy Products Year-to-Date Earnings Factor Analysis | | |
| (millions of dollars) | | | | |
Margins – Weaker industry refining margins and unfavorable derivative mark-to-market impacts offset by favorable other timing effects, mostly of a non-cash nature, decreased earnings by $1,490 million.
Volume/Mix – Favorable volume and mix effects increased earnings by $130 million, mainly driven by start-up of the Beaumont refinery expansion, partially offset by higher scheduled maintenance.
Other – All other items decreased earnings by $560 million, primarily due to higher project and maintenance expenses.
Identified Items (1) – 2023 $(45) million loss from additional European taxes.
(1) Refer to Functional Earnings Summary for definition of Identified Items and earnings (loss) excluding Identified Items.
| | | | | | | | | | | | | | | | | | | | |
| Energy Products Operational Results | | | | | | |
| | | | | | |
| (thousands of barrels daily) | | Three Months Ended
September 30, | | Nine Months Ended
September 30, |
| 2023 | 2022 | | 2023 | 2022 |
| Refinery throughput | | | | | | |
| United States | | 1,868 | | 1,742 | | | 1,819 | | 1,705 | |
| Canada | | 415 | | 426 | | | 407 | | 413 | |
| Europe | | 1,251 | | 1,253 | | | 1,217 | | 1,204 | |
| Asia Pacific | | 517 | | 557 | | | 515 | | 542 | |
| Other | | 164 | | 187 | | | 171 | | 182 | |
| Worldwide | | 4,215 | | 4,165 | | | 4,129 | | 4,046 | |
| | | | | | |
Energy Products sales (2) | | | | | | |
| United States | | 2,626 | | 2,479 | | | 2,610 | | 2,399 | |
| Non-U.S. | | 2,925 | | 3,058 | | | 2,887 | | 2,922 | |
| Worldwide | | 5,551 | | 5,537 | | | 5,496 | | 5,321 | |
| | | | | | |
| Gasoline, naphthas | | 2,316 | | 2,335 | | | 2,299 | | 2,220 | |
| Heating oils, kerosene, diesel | | 1,834 | | 1,818 | | | 1,815 | | 1,766 | |
| Aviation fuels | | 358 | | 365 | | | 338 | | 335 | |
| Heavy fuels | | 229 | | 252 | | | 224 | | 243 | |
| Other energy products | | 814 | | 767 | | | 820 | | 758 | |
| | | | | | |
(2) Data reported net of purchases/sales contracts with the same counterparty. |
| Due to rounding, numbers presented may not add up precisely to the totals indicated. |
CHEMICAL PRODUCTS
| | | | | | | | | | | | | | | | | | | | | | |
| Chemical Products Financial Results | | | | | | | | |
| | | | | | | | |
| (millions of dollars) | | Three Months Ended
September 30, | | Nine Months Ended
September 30, |
| 2023 | | 2022 | | 2023 | | 2022 |
Earnings (loss) (U.S. GAAP) | | | | | | | | |
| United States | | 338 | | | 635 | | | 1,148 | | | 2,030 | |
| Non-U.S. | | (89) | | | 177 | | | 300 | | | 1,263 | |
| Total | | 249 | | | 812 | | | 1,448 | | | 3,293 | |
| | | | | | | | |
| | | | | | | | |
| | | | | | | | |
| | | | | | | | |
| | | | | | | | |
| | | | | | | | |
Earnings (loss) excluding Identified Items (1) (Non-GAAP) | | | | | | | | |
| United States | | 338 | | | 635 | | | 1,148 | | | 2,030 | |
| Non-U.S. | | (89) | | | 177 | | | 300 | | | 1,263 | |
| Total | | 249 | | | 812 | | | 1,448 | | | 3,293 | |
| | | | | | | | |
(1) Refer to Functional Earnings Summary for definition of Identified Items and earnings (loss) excluding Identified Items. |
| Due to rounding, numbers presented may not add up precisely to the totals indicated. |
| | | | | | | | | | | | | | |
Chemical Products Third Quarter Earnings Factor Analysis | | |
| (millions of dollars) | | | | |
Margins – Weaker industry margins decreased earnings by $480 million.
Volume/Mix – Improved volume and mix effects, primarily from the growth of performance chemicals, increased earnings by $140 million.
Other – All other items decreased earnings by $220 million, primarily due to the absence of favorable tax items.
| | | | | | | | | | | | | | |
| Chemical Products Year-to-Date Earnings Factor Analysis | | |
| (millions of dollars) | | | | |
Margins – Weaker industry margins decreased earnings by $1,060 million.
Volume/Mix – Lower sales decreased earnings by $370 million, reflecting softer demand.
Other – All other items decreased earnings by $420 million, primarily driven by higher project and planned maintenance expenses.
| | | | | | | | | | | | | | | | | | | | | | |
| Chemical Products Operational Results | | | | | | | | |
| | | | | | | | |
| (thousands of metric tons) | | Three Months Ended
September 30, | | Nine Months Ended
September 30, |
| 2023 | | 2022 | | 2023 | | 2022 |
Chemical Products sales (1) | | | | | | | | |
| United States | | 1,750 | | | 1,658 | | | 5,036 | | | 5,688 | |
| Non-U.S. | | 3,358 | | | 3,023 | | | 9,570 | | | 8,821 | |
| Worldwide | | 5,108 | | | 4,680 | | | 14,606 | | | 14,509 | |
| | | | | | | | |
(1) Data reported net of purchases/sales contracts with the same counterparty. |
SPECIALTY PRODUCTS
| | | | | | | | | | | | | | | | | | | | | | |
| Specialty Products Financial Results | | | | | | | | |
| | | | | | | | |
| (millions of dollars) | | Three Months Ended
September 30, | | Nine Months Ended
September 30, |
| 2023 | | 2022 | | 2023 | | 2022 |
Earnings (loss) (U.S. GAAP) | | | | | | | | |
| United States | | 326 | | | 306 | | | 1,150 | | | 784 | |
| Non-U.S. | | 293 | | | 456 | | | 914 | | | 871 | |
| Total | | 619 | | | 762 | | | 2,064 | | | 1,655 | |
| | | | | | | | |
| | | | | | | | |
| | | | | | | | |
| | | | | | | | |
| | | | | | | | |
| | | | | | | | |
Earnings (loss) excluding Identified Items (1) (Non-GAAP) | | | | | | | | |
| United States | | 326 | | | 306 | | | 1,150 | | | 784 | |
| Non-U.S. | | 293 | | | 456 | | | 914 | | | 871 | |
| Total | | 619 | | | 762 | | | 2,064 | | | 1,655 | |
| | | | | | | | |
(1) Refer to Functional Earnings Summary for definition of Identified Items and earnings (loss) excluding Identified Items. |
| | | | | | | | | | | | | | |
Specialty Products Third Quarter Earnings Factor Analysis | | |
| (millions of dollars) | | | | |
Margins – Weaker basestocks margins more than offset stronger finished lubes margins, decreasing earnings by $120 million.
Volume/Mix – Lower sales decreased earnings by $20 million.
| | | | | | | | | | | | | | |
| Specialty Products Year-to-Date Earnings Factor Analysis | | |
| (millions of dollars) | | | | |
Margins – Stronger finished lubes margins drove increased earnings of $620 million, primarily related to lower feed costs.
Volume/Mix – Lower specialty products sales decreased earnings by $130 million, reflecting weaker demand.
Other – All other items decreased earnings by $80 million, mainly unfavorable foreign exchange impacts.
| | | | | | | | | | | | | | | | | | | | | | |
| Specialty Products Operational Results | | | | | | | | |
| | | | | | | | |
| (thousands of metric tons) | | Three Months Ended
September 30, | | Nine Months Ended
September 30, |
| 2023 | | 2022 | | 2023 | | 2022 |
Specialty Products sales (1) | | | | | | | | |
| United States | | 498 | | | 483 | | | 1,489 | | | 1,594 | |
| Non-U.S. | | 1,414 | | | 1,434 | | | 4,268 | | | 4,430 | |
| Worldwide | | 1,912 | | | 1,917 | | | 5,758 | | | 6,024 | |
| | | | | | | | |
(1) Data reported net of purchases/sales contracts with the same counterparty. | | |
| Due to rounding, numbers presented may not add up precisely to the totals indicated. |
CORPORATE AND FINANCING
| | | | | | | | | | | | | | | | | | | | | | |
| Corporate and Financing Financial Results | | | | | | | | |
| | | | | | | | |
| (millions of dollars) | | Three Months Ended
September 30, | | Nine Months Ended
September 30, |
| 2023 | | 2022 | | 2023 | | 2022 |
| | | | | | | | |
| Earnings (loss) (U.S. GAAP) | | (365) | | | (152) | | | (1,226) | | | (1,132) | |
Identified Items (2) | | — | | | 400 | | | — | | | 302 | |
Earnings (loss) excluding Identified Items (2) (Non-GAAP) | | (365) | | | (552) | | | (1,226) | | | (1,434) | |
| | | | | | | | |
(2) Refer to Functional Earnings Summary for definition of Identified Items and earnings (loss) excluding Identified Items. |
Corporate and Financing expenses were $365 million for the third quarter of 2023, $213 million higher than the third quarter of 2022, primarily due to the absence of favorable tax items, partly offset by lower financing costs.
Corporate and Financing expenses were $1,226 million for the first nine months of 2023, $94 million higher than 2022, primarily due to the absence of favorable tax items, partly offset by lower financing costs.
LIQUIDITY AND CAPITAL RESOURCES
| | | | | | | | | | | | | | | | | | | | | | | |
| (millions of dollars) | | | Three Months Ended
September 30, | | Nine Months Ended
September 30, |
| | 2023 | | 2022 | | 2023 | | 2022 |
| Net cash provided by/(used in) | | | | | | | | | |
| Operating activities | | | | | | | 41,687 | | | 59,176 | |
| Investing activities | | | | | | | (13,560) | | | (9,387) | |
| Financing activities | | | | | | | (24,742) | | | (25,177) | |
| Effect of exchange rate changes | | | | | | | (77) | | | (950) | |
| Increase/(decrease) in cash and cash equivalents | | | | | | | 3,308 | | | 23,662 | |
| | | | | | | | | |
| Cash and cash equivalents (at end of period) | | | | | | | 32,973 | | | 30,464 | |
| | | | | | | | | |
| Cash flow from operations and asset sales | | | | | | | | | |
| Net cash provided by operating activities (U.S. GAAP) | | | 15,963 | | | 24,425 | | | 41,687 | | | 59,176 | |
| Proceeds associated with sales of subsidiaries, property, plant & equipment, and sales and returns of investments | | | 917 | | | 2,682 | | | 3,058 | | | 3,914 | |
Cash flow from operations and asset sales (Non-GAAP) | | | 16,880 | | | 27,107 | | | 44,745 | | | 63,090 | |
| | | | | | | | | |
| Because of the ongoing nature of our asset management and divestment program, we believe it is useful for investors to consider proceeds associated with asset sales together with cash provided by operating activities when evaluating cash available for investment in the business and financing activities, including shareholder distributions. |
Cash flow from operations and asset sales in the third quarter of 2023 was $16.9 billion, a decrease of $10.2 billion from the comparable 2022 period primarily reflecting lower earnings.
Cash provided by operating activities totaled $41.7 billion for the first nine months of 2023, $17.5 billion lower than 2022. Net income including noncontrolling interests was $29.3 billion, a decrease of $15.2 billion from the prior year period. The adjustment for the noncash provision of $12.9 billion for depreciation and depletion was down $6.1 billion from 2022. Changes in operational working capital were a reduction of $2.1 billion during the period. All other items net increased cash flows by $1.5 billion in 2023 versus a reduction of $4.3 billion in 2022. See the Condensed Consolidated Statement of Cash Flows for additional details.
Investing activities for the first nine months of 2023 used net cash of $13.6 billion, an increase of $4.2 billion compared to the prior year. Spending for additions to property, plant and equipment of $15.7 billion was $3.1 billion higher than 2022. Proceeds from asset sales were $3.1 billion, a decrease of $0.9 billion compared to the prior year. Net investments and advances increased $0.3 billion to $0.9 billion.
Net cash used in financing activities was $24.7 billion in the first nine months of 2023, including $13.1 billion for the purchase of 119.4 million shares of ExxonMobil stock, as part of the previously announced buyback program. This compares to net cash used in financing activities of $25.2 billion in the prior year. Total debt at the end of the third quarter of 2023 was $41.3 billion compared to $41.2 billion at year-end 2022. The Corporation's debt to total capital ratio was 16.6 percent at the end of the third quarter of 2023 compared to 16.9 percent at year-end 2022. The net debt to capital ratio was 3.8 percent at the end of the third quarter, an decrease of 1.6 percentage points from year-end 2022. The Corporation's capital allocation priorities are investing in competitively advantaged, high-return projects; maintaining a strong balance sheet; and sharing our success with our shareholders through more consistent share repurchases and a growing dividend. The Corporation distributed a total of $11.1 billion to shareholders in the first nine months of 2023 through dividends.
The Corporation has access to significant capacity of long-term and short-term liquidity. Internally generated funds are expected to cover the majority of financial requirements, supplemented by long-term and short-term debt. The Corporation had undrawn short-term committed lines of credit of $0.5 billion and undrawn long-term committed lines of credit of $0.8 billion as of third quarter 2023.
The Corporation, as part of its ongoing asset management program, continues to evaluate its mix of assets for potential upgrade. Because of the ongoing nature of this program, dispositions will continue to be made from time to time which will result in either gains or losses. Additionally, the Corporation continues to evaluate opportunities to enhance its business portfolio through acquisitions of assets or companies, and enters into such transactions from time to time. Key criteria for evaluating acquisitions include strategic fit, cost synergies, potential for future growth, and attractive current valuations. Acquisitions may be made with cash, shares of the Corporation’s common stock, or both.
Litigation and other contingencies are discussed in Note 3 to the unaudited condensed consolidated financial statements.
Contractual Obligations
The Corporation and its affiliates have numerous long-term sales and purchase commitments in their various business activities, all of which are expected to be fulfilled with no adverse consequences material to the Corporation’s operations or financial condition. Through the third quarter of 2023, the Corporation has entered into various long-term agreements with an estimated total obligation of approximately $6.9 billion. As of September 30, undiscounted commitments for leases not yet commenced totaled $4.1 billion for operating leases and $2.2 billion for finance leases.
TAXES
| | | | | | | | | | | | | | | | | | | | | | | |
| | | | | | | | | |
| | | | | | | | | |
| (millions of dollars) | | | Three Months Ended
September 30, | | Nine Months Ended
September 30, |
| | 2023 | | 2022 | | 2023 | | 2022 |
| Income taxes | | | 4,353 | | | 5,224 | | | 12,816 | | | 14,389 | |
| Effective income tax rate | | | 34 | % | | 29 | % | | 34 | % | | 31 | % |
Total other taxes and duties (1) | | | 8,460 | | | 7,473 | | | 24,883 | | | 23,701 | |
| Total | | | 12,813 | | | 12,697 | | | 37,699 | | | 38,090 | |
| | | | | | | | | |
(1) Includes “Other taxes and duties” plus taxes that are included in “Production and manufacturing expenses” and “Selling, general and administrative expenses”. |
Total taxes were $12.8 billion for the third quarter of 2023, an increase of $0.1 billion from 2022. Income tax expense was $4.4 billion compared to $5.2 billion in the prior year reflecting lower commodity prices. The effective income tax rate of 34 percent increased from the 29 percent rate in the prior year period due primarily to a change in mix of results in jurisdictions with varying tax rates. Total other taxes and duties increased by $1.0 billion to $8.5 billion.
Total taxes were $37.7 billion for the first nine months of 2023, a decrease of $0.4 billion from 2022. Income tax expense decreased by $1.6 billion to $12.8 billion reflecting lower commodity prices. The effective income tax rate of 34 percent was up compared to the prior year period due primarily to a change in mix of results in jurisdictions with varying tax rates. Total other taxes and duties increased by $1.2 billion to $24.9 billion.
CAPITAL AND EXPLORATION EXPENDITURES
| | | | | | | | | | | | | | | | | | | | | | |
| | | | | | | | |
| | | | | | | | |
| (millions of dollars) | | Three Months Ended
September 30, | | Nine Months Ended
September 30, |
| 2023 | | 2022 | | 2023 | | 2022 |
| Upstream (including exploration expenses) | | 4,801 | | | 4,081 | | | 13,991 | | | 11,587 | |
| Energy Products | | 647 | | | 590 | | | 2,063 | | | 1,662 | |
| Chemical Products | | 371 | | | 954 | | | 1,861 | | | 1,809 | |
| Specialty Products | | 111 | | | 87 | | | 305 | | | 166 | |
| Other | | 92 | | | 16 | | | 348 | | | 17 | |
| Total | | 6,022 | | | 5,728 | | | 18,568 | | | 15,241 | |
Capital and exploration expenditures in the third quarter of 2023 were $6.0 billion, up 5% from the third quarter of 2022.
Capital and exploration expenditures in the first nine months of 2023 were $18.6 billion, up 22% from the first nine months of 2022. The Corporation expects 2023 capital spending to finish the year at the top end of the guidance of $23 billion to $25 billion. Actual spending could vary depending on the progress of individual projects and property acquisitions.
IMPORTANT INFORMATION ABOUT THE PIONEER TRANSACTION AND DENBURY TRANSACTION AND WHERE TO FIND IT
In connection with the proposed transaction between Exxon Mobil Corporation (“ExxonMobil”) and Pioneer Natural Resources Company (“Pioneer”) (the “Pioneer Transaction”), ExxonMobil and Pioneer will file relevant materials with the Securities and Exchange Commission (the “SEC”), including a registration statement on Form S-4 filed by ExxonMobil that will include a proxy statement of Pioneer that also constitutes a prospectus of ExxonMobil. A definitive proxy statement/prospectus will be mailed to stockholders of Pioneer.
In connection with the proposed transaction between ExxonMobil and Denbury Inc. (“Denbury”) (the “Denbury Transaction”), ExxonMobil and Denbury have filed and will file relevant materials with the SEC. On August 29, 2023, ExxonMobil filed with the SEC a registration statement on Form S-4, as amended (No. 333-274252) to register the shares of ExxonMobil common stock to be issued in connection with the Denbury Transaction. The registration statement, which was declared effective by the SEC on September 29, 2023, includes a definitive proxy statement of Denbury that also constitutes a prospectus of ExxonMobil. Such definitive proxy statement/prospectus was mailed to the stockholders of Denbury on September 29, 2023.
This communication is not a substitute for the registration statement, proxy statement or prospectus or any other document that ExxonMobil, Pioneer or Denbury (as applicable) has filed or may file with the SEC in connection with the Pioneer Transaction or the Denbury Transaction (as applicable).
BEFORE MAKING ANY VOTING OR INVESTMENT DECISION, INVESTORS AND SECURITY HOLDERS OF EXXONMOBIL, PIONEER AND DENBURY ARE URGED TO READ THE APPLICABLE REGISTRATION STATEMENT, THE APPLICABLE PROXY STATEMENT/PROSPECTUS AND ANY OTHER RELEVANT DOCUMENTS THAT ARE FILED OR WILL BE FILED WITH THE SEC, AS WELL AS ANY AMENDMENTS OR SUPPLEMENTS TO THESE DOCUMENTS (AS APPLICABLE), CAREFULLY AND IN THEIR ENTIRETY WHEN THEY BECOME AVAILABLE BECAUSE THEY CONTAIN OR WILL CONTAIN IMPORTANT INFORMATION ABOUT THE PIONEER TRANSACTION OR THE DENBURY TRANSACTION (AS APPLICABLE) AND RELATED MATTERS.
Investors and security holders may obtain free copies of the applicable registration statement and the proxy statement/prospectus (in the case of the Pioneer Transaction, when they become available), as well as other filings containing important information about ExxonMobil, Pioneer or Denbury, without charge at the SEC’s Internet website (http://www.sec.gov). Copies of the documents filed with the SEC by ExxonMobil are and will be available free of charge under the tab “SEC Filings” on the “Investors” page of ExxonMobil’s internet website at www.exxonmobil.com or by contacting ExxonMobil’s Investor Relations Department at investor.relations@exxonmobil.com. Copies of the documents filed with the SEC by Pioneer are and will be available free of charge on Pioneer’s internet website at https://investors.pxd.com/investors/financials/sec-filings/. Copies of the documents filed with the SEC by Denbury are and will be available free of charge on Denbury’s internet website at https://investors.denbury.com/investors/financial-information/sec-filings/ or by directing a request to Denbury Inc., ATTN: Investor Relations, 5851 Legacy Circle, Suite 1200, Plano, TX 75024, Tel. No. (972) 673-2000 or by contacting Denbury’s Investor Relations Department at IR@denbury.com. The information included on, or accessible through, ExxonMobil’s, Pioneer’s or Denbury’s website is not incorporated by reference into this communication.
Participants in the Solicitation
ExxonMobil, Pioneer, Denbury, their respective directors and certain of their respective executive officers may be deemed to be participants in the solicitation of proxies in respect of the Pioneer Transaction or the Denbury Transaction (as applicable). Information about the directors and executive officers of Pioneer is set forth in its proxy statement for its 2023 annual meeting of stockholders, which was filed with the SEC on April 13, 2023, in its Form 10-K for the year ended December 31, 2022, which was filed with the SEC on February 23, 2023, in its Form 8-K filed on May 30, 2023, in its Form 8-K filed on April 26, 2023 and in its Form 8-K filed on February 13, 2023. Information about the directors and executive officers of Denbury is set forth in its proxy statement for its 2023 annual meeting of stockholders, which was filed with the SEC on April 18, 2023, and in its Form 10-K for the year ended December 31, 2022, which was filed with the SEC on February 23, 2023. Information about the directors and executive officers of ExxonMobil is set forth in its proxy statement for its 2023 annual meeting of stockholders, which was filed with the SEC on April 13, 2023, in its Form 10-K for the year ended December 31, 2022, which was filed with the SEC on February 22, 2023, in its Form 8-K filed on June 6, 2023 and in its Form 8-K filed on February 24, 2023. Additional information regarding the participants in the proxy solicitations and a description of their direct or indirect interests, by security holdings or otherwise, is (or, in the case of the Pioneer Transaction, will be) contained in the applicable proxy statement/prospectus and will be contained in other relevant materials filed with the SEC when they become available.
No Offer or Solicitation
This communication is for informational purposes and is not intended to, and shall not, constitute an offer to sell or the solicitation of an offer to buy any securities or a solicitation of any vote or approval, nor shall there be any offer, solicitation or sale of securities in any jurisdiction in which such offer, solicitation or sale would be unlawful prior to registration or qualification under the securities laws of any such jurisdiction. No offering of securities shall be made except by means of a prospectus meeting the requirements of Section 10 of the U.S. Securities Act of 1933, as amended.
FORWARD-LOOKING STATEMENTS
Statements related to outlooks; projections; descriptions of strategic, operating, and financial plans and objectives; statements of future ambitions and plans; and other statements of future events or conditions in this report, are forward-looking statements. Similarly, discussion of future carbon capture, transportation and storage, as well as biofuel, hydrogen, and other plans to reduce emissions of ExxonMobil, its affiliates or companies it is seeking to acquire, are dependent on future market factors, such as continued technological progress, policy support and timely rule-making and permitting, and represent forward-looking statements. Actual future results, including financial and operating performance; total capital expenditures and mix, including allocations of capital to low carbon solutions; structural earnings improvement and structural cost reductions and efficiency gains, including the ability to offset inflationary pressure; plans to reduce future emissions and emissions intensity; ambitions to reach Scope 1 and Scope 2 net zero from operated assets by 2050, plans to reach net zero Scope 1 and 2 emissions in Upstream Permian Basin unconventional operated assets by 2030, eliminating routine flaring in-line with World Bank Zero Routine Flaring, reaching near-zero methane emissions from its operations, meeting ExxonMobil’s emission reduction goals and plans, divestment and start-up plans, and associated project plans as well as technology efforts, timing and outcome of projects related to the capture, transportation and storage of CO2, including completion of the Denbury acquisition and produced biofuels; changes in law, taxes, or regulation including environmental and tax regulations, trade sanctions, and timely granting of governmental permits and certifications; timing and outcome of hydrogen projects; cash flow, dividends and shareholder returns, including the timing and amounts of share repurchases; future debt levels and credit ratings; business and project plans, timing, costs, capacities and returns; and resource recoveries and production rates could differ materially due to a number of factors. These include global or regional changes in the supply and demand for oil, natural gas, petrochemicals, and feedstocks and other market factors, economic conditions, and seasonal fluctuations that impact prices and differentials for our products; government policies supporting lower carbon investment opportunities such as the U.S. Inflation Reduction Act or policies limiting the attractiveness of future investment such as the additional European taxes on the energy sector; variable impacts of trading activities on our margins and results each quarter; actions of competitors and commercial counterparties; the outcome of commercial negotiations, including final agreed terms and conditions; the ability to access debt markets; the ultimate impacts of public health crises, including the effects of government responses on people and economies; reservoir performance, including variability and timing factors applicable to unconventional resources; the level and outcome of exploration projects and decisions to invest in future reserves; timely completion of development and other construction projects; final management approval of future projects and any changes in the scope, terms, or costs of such projects as approved; government regulation of our growth opportunities; war, civil unrest, attacks against the company or industry, and other political or security disturbances; expropriations, seizure, or capacity, insurance or shipping limitations by foreign governments or laws; opportunities for potential acquisitions, investments or divestments and satisfaction of applicable conditions to closing, including timely regulatory approvals; the capture of efficiencies within and between business lines and the ability to maintain near-term cost reductions as ongoing efficiencies; unforeseen technical or operating difficulties and unplanned maintenance; the development and competitiveness of alternative energy and emission reduction technologies; the results of research programs and the ability to bring new technologies to commercial scale on a cost-competitive basis; and other factors discussed under Item 1A. Risk Factors of ExxonMobil’s 2022 Form 10-K.
Actions needed to advance ExxonMobil’s 2030 greenhouse gas emission-reductions plans are incorporated into its medium-term business plans, which are updated annually. The reference case for planning beyond 2030 is based on the Company’s Energy Outlook research and publication. The Outlook is reflective of the existing global policy environment. The Energy Outlook does not attempt to project the degree of required future policy and technology advancement and deployment for the world, or ExxonMobil, to meet net zero by 2050. As future policies and technology advancements emerge, they will be incorporated into the Outlook, and the Company’s business plans will be updated accordingly.
Forward-looking and other statements regarding environmental and other sustainability efforts and aspirations are not an indication that these statements are material to investors or requiring disclosure in our filing with the SEC. In addition, historical, current, and forward-looking environmental and other sustainability-related statements may be based on standards for measuring progress that are still developing, internal controls and processes that continue to evolve, and assumptions that are subject to change in the future, including future rule-making. The report is provided under consistent SEC disclosure requirements and should not be misinterpreted as applying to any other disclosure standards.
The term “project” as used in this report can refer to a variety of different activities and does not necessarily have the same meaning as in any government payment transparency reports.
ITEM 3. QUANTITATIVE AND QUALITATIVE DISCLOSURES ABOUT MARKET RISK
Information about market risks for the nine months ended September 30, 2023, does not differ materially from that discussed under Item 7A of the registrant's Annual Report on Form 10-K for 2022.
ITEM 4. CONTROLS AND PROCEDURES
As indicated in the certifications in Exhibit 31 of this report, the Corporation’s Chief Executive Officer, Chief Financial Officer and Principal Accounting Officer have evaluated the Corporation’s disclosure controls and procedures as of September 30, 2023. Based on that evaluation, these officers have concluded that the Corporation’s disclosure controls and procedures are effective in ensuring that information required to be disclosed by the Corporation in the reports that it files or submits under the Securities Exchange Act of 1934, as amended, is accumulated and communicated to them in a manner that allows for timely decisions regarding required disclosures and are effective in ensuring that such information is recorded, processed, summarized and reported within the time periods specified in the Securities and Exchange Commission’s rules and forms. There were no changes during the Corporation’s last fiscal quarter that materially affected, or are reasonably likely to materially affect, the Corporation’s internal control over financial reporting.
PART II. OTHER INFORMATION
ITEM 1. LEGAL PROCEEDINGS
ExxonMobil has elected to use a $1 million threshold for disclosing environmental proceedings.
On July 20, 2023, XTO Energy Inc. (XTO) received a letter setting forth a potential settlement of previously issued notices of violation from the U.S. Environmental Protection Agency (EPA) regarding certain facilities in Texas and New Mexico owned or operated by XTO. The EPA alleged unauthorized emission events from these facilities in violation of the Clean Air Act. The EPA is seeking an amount in excess of $1 million to resolve the matter, and XTO is in settlement discussions with the EPA.
As reported in the Corporation’s Form 10-Q for the third quarter of 2020, the State of Texas filed suit against ExxonMobil Oil Corporation (EMOC) on August 19, 2020, seeking penalties and injunctive relief in connection with alleged unauthorized emissions events at EMOC’s Beaumont Refinery in Texas from 2017 to 2020. The suit, captioned State of Texas v. ExxonMobil Oil Corporation, was filed in the 98th Judicial District Court of Travis County, Texas (the “98th Judicial District Court”). In October 2022, the State amended its petition to seek additional penalties for additional alleged violations and for an aggregate demand in excess of $1 million. In September 2023, the State of Texas and EMOC agreed to settle the alleged violations upon payment of $1.6 million to the State of Texas (the “Proposed Settlement”). Once the Proposed Settlement is published in the Federal Register, it will be open to public comment for 30 days before the 98th Judicial District Court may approve it.
Refer to the relevant portions of Note 3 of this Quarterly Report on Form 10-Q for further information on legal proceedings.
ITEM 2. UNREGISTERED SALES OF EQUITY SECURITIES AND USE OF PROCEEDS
| | | | | | | | | | | | | | | | | | |
Issuer Purchases of Equity Securities for Quarter Ended September 30, 2023 |
| | | | | | | | |
| | Total Number of Shares Purchased (1) | | Average Price Paid per Share (2) | | Total Number of Shares Purchased as Part of Publicly Announced Plans or Programs (3) | | Approximate Dollar Value of Shares that May Yet Be Purchased Under the Program
(Billions of dollars) |
| July 2023 | | 13,412,202 | | $104.37 | | 13,412,138 | | $24.9 |
| August 2023 | | 14,830,204 | | $108.63 | | 14,830,192 | | $23.3 |
| September 2023 | | 12,033,445 | | $116.41 | | 12,033,445 | | $21.9 |
| Total | | 40,275,851 | | | | 40,275,775 | | |
| | | | | | | | |
(1) Includes shares withheld from participants in the company's incentive program for personal income taxes. |
(2) Excludes 1% excise tax on stock repurchases of $44M. |
(3) In its 2022 Corporate Plan Update released December 8, 2022, the Corporation stated that the company expanded its share repurchase program to up to $50 billion through 2024, including $15 billion of repurchases in 2022. Purchases were made under terms intended to qualify for exemption under Rules 10b-18 and 10b5-1. As required by securities law restrictions, no repurchases will take place during proxy solicitation and voting periods for transactions involving the issuance of ExxonMobil shares. For the Denbury transaction this period took place during October 2023. For the Pioneer transaction, the Corporation expects this period to occur sometime during the first half of 2024. |
|
During the third quarter, the Corporation did not issue or sell any unregistered equity securities.
ITEM 5. OTHER INFORMATION
During the three months ended September 30, 2023, none of the Company’s directors or officers adopted or terminated a “Rule 10b5-1 trading arrangement” or “non-Rule 10b5-1 trading arrangement,” as each term is defined in Item 408(a) of Regulation S-K.
ITEM 6. EXHIBITS
See Index to Exhibits of this report.
INDEX TO EXHIBITS
| | | | | | | | |
| Exhibit | | Description |
| | | |
| | Agreement and Plan of Merger, dated as of October 10, 2023 among Exxon Mobil Corporation, SPQR, LLC and Pioneer Natural Resources Company (incorporated by reference to Exhibit 2.1 to the Registrant’s Report on Form 8-K of October 11, 2023). |
| | Aircraft Time Share Agreement dated as of August 29, 2023, between Exxon Mobil Corporation and Darren W. Woods. |
| | Certification (pursuant to Securities Exchange Act Rule 13a-14(a)) by Chief Executive Officer. |
| | Certification (pursuant to Securities Exchange Act Rule 13a-14(a)) by Chief Financial Officer. |
| | Certification (pursuant to Securities Exchange Act Rule 13a-14(a)) by Principal Accounting Officer. |
| | Section 1350 Certification (pursuant to Sarbanes-Oxley Section 906) by Chief Executive Officer. |
| | Section 1350 Certification (pursuant to Sarbanes-Oxley Section 906) by Chief Financial Officer. |
| | Section 1350 Certification (pursuant to Sarbanes-Oxley Section 906) by Principal Accounting Officer. |
| 101 | | Interactive Data Files (formatted as Inline XBRL). |
| 104 | | Cover Page Interactive Data File (formatted as Inline XBRL and contained in Exhibit 101). |
| | |
* Schedules and exhibits have been omitted pursuant to Item 601(a)(5) of Regulation S-K. A copy of any omitted schedule or exhibit will be furnished supplementally to the SEC upon request.
|
SIGNATURE
Pursuant to the requirements of the Securities Exchange Act of 1934, the Registrant has duly caused this report to be signed on its behalf by the undersigned, thereunto duly authorized.
| | | | | | | | |
| | EXXON MOBIL CORPORATION |
Date: October 31, 2023 | By: | /s/ LEN M. FOX |
| | | Len M. Fox |
| | | Vice President, Controller and |
| | | Principal Accounting Officer |