FALSE00000340882022Q3--12-3100000340882022-01-012022-09-300000034088us-gaap:CommonStockMember2022-01-012022-09-300000034088xom:ZeroPointOneFourTwoPercentNotesDue2024Member2022-01-012022-09-300000034088xom:ZeroPointFiveTwoFourPercentNotesDue2028Member2022-01-012022-09-300000034088xom:ZeroPointEightThreeFivePercentNotesDue2032Member2022-01-012022-09-300000034088xom:OnePointFourZeroEightPercentNotesDue2039Member2022-01-012022-09-3000000340882022-09-30xbrli:shares00000340882022-07-012022-09-30iso4217:USD00000340882021-07-012021-09-3000000340882021-01-012021-09-30iso4217:USDxbrli:shares00000340882021-12-3100000340882020-12-3100000340882021-09-300000034088us-gaap:CommonStockMember2021-06-300000034088us-gaap:RetainedEarningsMember2021-06-300000034088us-gaap:AccumulatedOtherComprehensiveIncomeMember2021-06-300000034088us-gaap:TreasuryStockMember2021-06-300000034088us-gaap:ParentMember2021-06-300000034088us-gaap:NoncontrollingInterestMember2021-06-3000000340882021-06-300000034088us-gaap:CommonStockMember2021-07-012021-09-300000034088us-gaap:ParentMember2021-07-012021-09-300000034088us-gaap:NoncontrollingInterestMember2021-07-012021-09-300000034088us-gaap:RetainedEarningsMember2021-07-012021-09-300000034088us-gaap:AccumulatedOtherComprehensiveIncomeMember2021-07-012021-09-300000034088us-gaap:TreasuryStockMember2021-07-012021-09-300000034088us-gaap:CommonStockMember2021-09-300000034088us-gaap:RetainedEarningsMember2021-09-300000034088us-gaap:AccumulatedOtherComprehensiveIncomeMember2021-09-300000034088us-gaap:TreasuryStockMember2021-09-300000034088us-gaap:ParentMember2021-09-300000034088us-gaap:NoncontrollingInterestMember2021-09-300000034088us-gaap:CommonStockMember2022-06-300000034088us-gaap:RetainedEarningsMember2022-06-300000034088us-gaap:AccumulatedOtherComprehensiveIncomeMember2022-06-300000034088us-gaap:TreasuryStockMember2022-06-300000034088us-gaap:ParentMember2022-06-300000034088us-gaap:NoncontrollingInterestMember2022-06-3000000340882022-06-300000034088us-gaap:CommonStockMember2022-07-012022-09-300000034088us-gaap:ParentMember2022-07-012022-09-300000034088us-gaap:NoncontrollingInterestMember2022-07-012022-09-300000034088us-gaap:RetainedEarningsMember2022-07-012022-09-300000034088us-gaap:AccumulatedOtherComprehensiveIncomeMember2022-07-012022-09-300000034088us-gaap:TreasuryStockMember2022-07-012022-09-300000034088us-gaap:CommonStockMember2022-09-300000034088us-gaap:RetainedEarningsMember2022-09-300000034088us-gaap:AccumulatedOtherComprehensiveIncomeMember2022-09-300000034088us-gaap:TreasuryStockMember2022-09-300000034088us-gaap:ParentMember2022-09-300000034088us-gaap:NoncontrollingInterestMember2022-09-300000034088us-gaap:CommonStockMember2020-12-310000034088us-gaap:RetainedEarningsMember2020-12-310000034088us-gaap:AccumulatedOtherComprehensiveIncomeMember2020-12-310000034088us-gaap:TreasuryStockMember2020-12-310000034088us-gaap:ParentMember2020-12-310000034088us-gaap:NoncontrollingInterestMember2020-12-310000034088us-gaap:CommonStockMember2021-01-012021-09-300000034088us-gaap:ParentMember2021-01-012021-09-300000034088us-gaap:NoncontrollingInterestMember2021-01-012021-09-300000034088us-gaap:RetainedEarningsMember2021-01-012021-09-300000034088us-gaap:AccumulatedOtherComprehensiveIncomeMember2021-01-012021-09-300000034088us-gaap:TreasuryStockMember2021-01-012021-09-300000034088us-gaap:CommonStockMember2021-12-310000034088us-gaap:RetainedEarningsMember2021-12-310000034088us-gaap:AccumulatedOtherComprehensiveIncomeMember2021-12-310000034088us-gaap:TreasuryStockMember2021-12-310000034088us-gaap:ParentMember2021-12-310000034088us-gaap:NoncontrollingInterestMember2021-12-310000034088us-gaap:CommonStockMember2022-01-012022-09-300000034088us-gaap:ParentMember2022-01-012022-09-300000034088us-gaap:NoncontrollingInterestMember2022-01-012022-09-300000034088us-gaap:RetainedEarningsMember2022-01-012022-09-300000034088us-gaap:AccumulatedOtherComprehensiveIncomeMember2022-01-012022-09-300000034088us-gaap:TreasuryStockMember2022-01-012022-09-300000034088xom:Sakhalin1Member2022-01-012022-09-30utr:Boexbrli:pure0000034088xom:ExxonMobilCorporationMember2021-12-310000034088xom:DebtRelatedGuaranteesMemberxom:EquityCompanyObligationsMember2022-09-300000034088xom:OtherThirdPartyObligationsMemberxom:DebtRelatedGuaranteesMember2022-09-300000034088xom:DebtRelatedGuaranteesMember2022-09-300000034088xom:OtherGuaranteesMemberxom:EquityCompanyObligationsMember2022-09-300000034088xom:OtherThirdPartyObligationsMemberxom:OtherGuaranteesMember2022-09-300000034088xom:OtherGuaranteesMember2022-09-300000034088xom:EquityCompanyObligationsMember2022-09-300000034088xom:OtherThirdPartyObligationsMember2022-09-300000034088xom:OperatingLeaseMember2022-09-300000034088xom:FinanceLeaseMember2022-09-300000034088srt:ParentCompanyMember2020-12-310000034088srt:ParentCompanyMember2021-01-012021-09-300000034088srt:ParentCompanyMember2021-09-300000034088srt:ParentCompanyMember2021-12-310000034088srt:ParentCompanyMember2022-01-012022-09-300000034088srt:ParentCompanyMember2022-09-300000034088country:USus-gaap:PensionPlansDefinedBenefitMember2022-07-012022-09-300000034088country:USus-gaap:PensionPlansDefinedBenefitMember2021-07-012021-09-300000034088country:USus-gaap:PensionPlansDefinedBenefitMember2022-01-012022-09-300000034088country:USus-gaap:PensionPlansDefinedBenefitMember2021-01-012021-09-300000034088us-gaap:ForeignPlanMemberus-gaap:PensionPlansDefinedBenefitMember2022-07-012022-09-300000034088us-gaap:ForeignPlanMemberus-gaap:PensionPlansDefinedBenefitMember2021-07-012021-09-300000034088us-gaap:ForeignPlanMemberus-gaap:PensionPlansDefinedBenefitMember2022-01-012022-09-300000034088us-gaap:ForeignPlanMemberus-gaap:PensionPlansDefinedBenefitMember2021-01-012021-09-300000034088us-gaap:OtherPostretirementBenefitPlansDefinedBenefitMember2022-07-012022-09-300000034088us-gaap:OtherPostretirementBenefitPlansDefinedBenefitMember2021-07-012021-09-300000034088us-gaap:OtherPostretirementBenefitPlansDefinedBenefitMember2022-01-012022-09-300000034088us-gaap:OtherPostretirementBenefitPlansDefinedBenefitMember2021-01-012021-09-300000034088us-gaap:FairValueInputsLevel1Member2022-09-300000034088us-gaap:FairValueInputsLevel2Member2022-09-300000034088us-gaap:FairValueDisclosureItemAmountsDomain2022-09-300000034088xom:EffectOfCounterpartyNettingMember2022-09-300000034088xom:EffectOfCollateralNettingMember2022-09-300000034088us-gaap:CarryingReportedAmountFairValueDisclosureMember2022-09-300000034088us-gaap:FairValueInputsLevel3Member2022-09-300000034088xom:DifferenceInCarryingValueAndFairValueMember2022-09-300000034088us-gaap:FairValueInputsLevel1Member2021-12-310000034088us-gaap:FairValueInputsLevel2Member2021-12-310000034088us-gaap:FairValueDisclosureItemAmountsDomain2021-12-310000034088xom:EffectOfCounterpartyNettingMember2021-12-310000034088xom:EffectOfCollateralNettingMember2021-12-310000034088us-gaap:CarryingReportedAmountFairValueDisclosureMember2021-12-310000034088us-gaap:FairValueInputsLevel3Member2021-12-310000034088xom:DifferenceInCarryingValueAndFairValueMember2021-12-310000034088xom:LineOfCreditShortTermMember2022-09-300000034088xom:LineOfCreditLongTermMember2022-09-300000034088xom:LineOfCreditShortTermMember2022-07-012022-09-300000034088us-gaap:ShortMembersrt:CrudeOilMember2022-01-012022-09-30utr:bbl0000034088us-gaap:LongMembersrt:CrudeOilMember2021-01-012021-12-310000034088us-gaap:ShortMemberxom:ProductsMember2022-01-012022-09-300000034088us-gaap:ShortMemberxom:ProductsMember2021-01-012021-12-310000034088us-gaap:ShortMemberxom:NaturalGasMember2022-01-012022-09-30utr:MMBTU0000034088us-gaap:ShortMemberxom:NaturalGasMember2021-01-012021-12-310000034088us-gaap:NotDesignatedAsHedgingInstrumentTradingMember2022-07-012022-09-300000034088us-gaap:NotDesignatedAsHedgingInstrumentTradingMember2021-07-012021-09-300000034088us-gaap:NotDesignatedAsHedgingInstrumentTradingMember2022-01-012022-09-300000034088us-gaap:NotDesignatedAsHedgingInstrumentTradingMember2021-01-012021-09-30xom:segment0000034088xom:UpstreamUnitedStatesMember2022-07-012022-09-300000034088xom:UpstreamUnitedStatesMember2021-07-012021-09-300000034088xom:UpstreamUnitedStatesMember2022-01-012022-09-300000034088xom:UpstreamUnitedStatesMember2021-01-012021-09-300000034088xom:UpstreamNonUsMember2022-07-012022-09-300000034088xom:UpstreamNonUsMember2021-07-012021-09-300000034088xom:UpstreamNonUsMember2022-01-012022-09-300000034088xom:UpstreamNonUsMember2021-01-012021-09-300000034088xom:EnergyProductsUnitedStatesMember2022-07-012022-09-300000034088xom:EnergyProductsUnitedStatesMember2021-07-012021-09-300000034088xom:EnergyProductsUnitedStatesMember2022-01-012022-09-300000034088xom:EnergyProductsUnitedStatesMember2021-01-012021-09-300000034088xom:EnergyProductsNonUSMember2022-07-012022-09-300000034088xom:EnergyProductsNonUSMember2021-07-012021-09-300000034088xom:EnergyProductsNonUSMember2022-01-012022-09-300000034088xom:EnergyProductsNonUSMember2021-01-012021-09-300000034088xom:ChemicalProductsUnitedStatesMember2022-07-012022-09-300000034088xom:ChemicalProductsUnitedStatesMember2021-07-012021-09-300000034088xom:ChemicalProductsUnitedStatesMember2022-01-012022-09-300000034088xom:ChemicalProductsUnitedStatesMember2021-01-012021-09-300000034088xom:ChemicalProductsNonUSMember2022-07-012022-09-300000034088xom:ChemicalProductsNonUSMember2021-07-012021-09-300000034088xom:ChemicalProductsNonUSMember2022-01-012022-09-300000034088xom:ChemicalProductsNonUSMember2021-01-012021-09-300000034088xom:SpecialtyProductsUnitedStatesMember2022-07-012022-09-300000034088xom:SpecialtyProductsUnitedStatesMember2021-07-012021-09-300000034088xom:SpecialtyProductsUnitedStatesMember2022-01-012022-09-300000034088xom:SpecialtyProductsUnitedStatesMember2021-01-012021-09-300000034088xom:SpecialtyProductsNonUSMember2022-07-012022-09-300000034088xom:SpecialtyProductsNonUSMember2021-07-012021-09-300000034088xom:SpecialtyProductsNonUSMember2022-01-012022-09-300000034088xom:SpecialtyProductsNonUSMember2021-01-012021-09-300000034088xom:CorporateAndFinancingMember2022-07-012022-09-300000034088xom:CorporateAndFinancingMember2021-07-012021-09-300000034088xom:CorporateAndFinancingMember2022-01-012022-09-300000034088xom:CorporateAndFinancingMember2021-01-012021-09-300000034088country:US2022-07-012022-09-300000034088country:US2021-07-012021-09-300000034088country:US2022-01-012022-09-300000034088country:US2021-01-012021-09-300000034088us-gaap:NonUsMember2022-07-012022-09-300000034088us-gaap:NonUsMember2021-07-012021-09-300000034088us-gaap:NonUsMember2022-01-012022-09-300000034088us-gaap:NonUsMember2021-01-012021-09-300000034088country:CA2022-07-012022-09-300000034088country:CA2021-07-012021-09-300000034088country:CA2022-01-012022-09-300000034088country:CA2021-01-012021-09-300000034088country:GB2022-07-012022-09-300000034088country:GB2021-07-012021-09-300000034088country:GB2022-01-012022-09-300000034088country:GB2021-01-012021-09-300000034088country:SG2022-07-012022-09-300000034088country:SG2021-07-012021-09-300000034088country:SG2022-01-012022-09-300000034088country:SG2021-01-012021-09-300000034088country:FR2022-07-012022-09-300000034088country:FR2021-07-012021-09-300000034088country:FR2022-01-012022-09-300000034088country:FR2021-01-012021-09-300000034088country:IT2022-07-012022-09-300000034088country:IT2021-07-012021-09-300000034088country:IT2022-01-012022-09-300000034088country:IT2021-01-012021-09-300000034088country:BE2022-07-012022-09-300000034088country:BE2021-07-012021-09-300000034088country:BE2022-01-012022-09-300000034088country:BE2021-01-012021-09-300000034088country:AU2022-07-012022-09-300000034088country:AU2021-07-012021-09-300000034088country:AU2022-01-012022-09-300000034088country:AU2021-01-012021-09-300000034088xom:UpstreamAssetsInRomaniaAndCanadaMemberus-gaap:ScenarioPlanMemberus-gaap:DisposalGroupDisposedOfBySaleNotDiscontinuedOperationsMember2022-01-012022-09-300000034088us-gaap:ScenarioPlanMemberus-gaap:DisposalGroupDisposedOfBySaleNotDiscontinuedOperationsMemberxom:SantaYnezUnitMemberus-gaap:SubsequentEventMember2022-10-012023-12-31
UNITED STATES
SECURITIES AND EXCHANGE COMMISSION
Washington, D.C. 20549
FORM 10-Q
☑ QUARTERLY REPORT PURSUANT TO SECTION 13 OR 15(d) OF
THE SECURITIES EXCHANGE ACT OF 1934
For the quarterly period ended September 30, 2022
or
☐ TRANSITION REPORT PURSUANT TO SECTION 13 OR 15(d) OF
THE SECURITIES EXCHANGE ACT OF 1934
For the transition period from __________to__________
Commission File Number 1-2256
Exxon Mobil Corporation
(Exact name of registrant as specified in its charter)
| | | | | | | | |
| New Jersey | | 13-5409005 |
| (State or other jurisdiction of incorporation or organization) | | (I.R.S. Employer Identification Number) |
5959 Las Colinas Boulevard, Irving, Texas 75039-2298
(Address of principal executive offices) (Zip Code)
(972) 940-6000
(Registrant's telephone number, including area code)
_______________________
Securities registered pursuant to Section 12(b) of the Act:
| | | | | | | | | | | | | | |
| Title of Each Class | | Trading Symbol | | Name of Each Exchange on Which Registered |
| Common Stock, without par value | | XOM | | New York Stock Exchange |
| 0.142% Notes due 2024 | | XOM24B | | New York Stock Exchange |
| 0.524% Notes due 2028 | | XOM28 | | New York Stock Exchange |
| 0.835% Notes due 2032 | | XOM32 | | New York Stock Exchange |
| 1.408% Notes due 2039 | | XOM39A | | New York Stock Exchange |
Indicate by check mark whether the registrant (1) has filed all reports required to be filed by Section 13 or 15(d) of the Securities Exchange Act of 1934 during the preceding 12 months (or for such shorter period that the registrant was required to file such reports), and (2) has been subject to such filing requirements for the past 90 days. Yes ☑ No ☐
Indicate by check mark whether the registrant has submitted electronically every Interactive Data File required to be submitted and posted pursuant to Rule 405 of Regulation S-T (§ 232.405 of this chapter) during the preceding 12 months (or for such shorter period that the registrant was required to submit and post such files). Yes ☑ No ☐
Indicate by check mark whether the registrant is a large accelerated filer, an accelerated filer, a non-accelerated filer, smaller reporting company, or an emerging growth company. See the definitions of "large accelerated filer," "accelerated filer," "smaller reporting company," and “emerging growth company” in Rule 12b-2 of the Exchange Act.
| | | | | | | | | | | |
| Large accelerated filer | ☑ | Accelerated filer | ☐ |
| | | |
| Non-accelerated filer | ☐ | Smaller reporting company | ☐ |
|
| | Emerging growth company | ☐ |
If an emerging growth company, indicate by check mark if the registrant has elected not to use the extended transition period for complying with any new or revised financial accounting standards provided pursuant to Section 13(a) of the Exchange Act. ☐
Indicate by check mark whether the registrant is a shell company (as defined in Rule 12b-2 of the Exchange Act). Yes ☐ No ☑
Indicate the number of shares outstanding of each of the issuer's classes of common stock, as of the latest practicable date.
| | | | | | | | |
| Class | | Outstanding as of September 30, 2022 |
| Common stock, without par value | | 4,118,293,421 |
EXXON MOBIL CORPORATION
FORM 10-Q
FOR THE QUARTERLY PERIOD ENDED SEPTEMBER 30, 2022
TABLE OF CONTENTS
| | | | | |
| PART I. FINANCIAL INFORMATION |
| | |
| Item 1. Financial Statements | |
| | |
Condensed Consolidated Statement of Income - Three and nine months ended September 30, 2022 and 2021 | 3 | |
| | |
Condensed Consolidated Statement of Comprehensive Income - Three and nine months ended September 30, 2022 and 2021 | 4 | |
| | |
Condensed Consolidated Balance Sheet - As of September 30, 2022 and December 31, 2021 | 5 | |
| | |
Condensed Consolidated Statement of Cash Flows - Nine months ended September 30, 2022 and 2021 | 6 | |
| | |
Condensed Consolidated Statement of Changes in Equity - Three months ended September 30, 2022 and 2021 | 7 | |
| |
Condensed Consolidated Statement of Changes in Equity - Nine months ended September 30, 2022 and 2021 | 8 | |
| |
| |
| | |
| Notes to Condensed Consolidated Financial Statements | 9 | |
| | |
| Item 2. Management's Discussion and Analysis of Financial Condition and Results of Operations | 18 | |
| | |
| Item 3. Quantitative and Qualitative Disclosures About Market Risk | 34 | |
| | |
| Item 4. Controls and Procedures | 34 | |
| | |
| | |
| PART II. OTHER INFORMATION |
| |
| Item 1. Legal Proceedings | 35 | |
| |
| |
| | |
Item 2. Unregistered Sales of Equity Securities and Use of Proceeds | 36 | |
| | |
Item 6. Exhibits | 36 | |
| | |
| Index to Exhibits | 37 | |
| | |
| Signature | 38 | |
| | |
PART I. FINANCIAL INFORMATION
| | | | | | | | | | | | | | |
| ITEM 1. FINANCIAL STATEMENTS | | |
| | | | | |
| |
| CONDENSED CONSOLIDATED STATEMENT OF INCOME |
| | | | | | | | | | | | | | | | | | | | | |
(millions of dollars, unless noted) | | Three Months Ended
September 30, | | | Nine Months Ended
September 30, |
| 2022 | 2021 | | | 2022 | 2021 |
| Revenues and other income | | | | | | | |
| Sales and other operating revenue | | 106,512 | | 71,892 | | | | 305,511 | | 195,387 | |
| Income from equity affiliates | | 4,632 | | 1,670 | | | | 10,858 | | 4,579 | |
| Other income | | 926 | | 224 | | | | 1,882 | | 709 | |
| Total revenues and other income | | 112,070 | | 73,786 | | | | 318,251 | | 200,675 | |
| Costs and other deductions | | | | | | | |
| Crude oil and product purchases | | 60,197 | | 39,745 | | | | 178,198 | | 109,675 | |
| Production and manufacturing expenses | | 11,317 | | 8,719 | | | | 32,244 | | 25,252 | |
| Selling, general and administrative expenses | | 2,324 | | 2,287 | | | | 7,263 | | 7,060 | |
| Depreciation and depletion (including impairments) | | 5,642 | | 4,990 | | | | 18,976 | | 14,946 | |
Exploration expenses, including dry holes (1) | | 218 | | 190 | | | | 677 | | 530 | |
| Non-service pension and postretirement benefit expense | | 154 | | 146 | | | | 382 | | 686 | |
| Interest expense | | 209 | | 214 | | | | 591 | | 726 | |
| Other taxes and duties | | 6,587 | | 7,889 | | | | 21,009 | | 22,295 | |
| Total costs and other deductions | | 86,648 | | 64,180 | | | | 259,340 | | 181,170 | |
| Income (loss) before income taxes | | 25,422 | | 9,606 | | | | 58,911 | | 19,505 | |
| Income taxes | | 5,224 | | 2,664 | | | | 14,389 | | 4,986 | |
| Net income (loss) including noncontrolling interests | | 20,198 | | 6,942 | | | | 44,522 | | 14,519 | |
| Net income (loss) attributable to noncontrolling interests | | 538 | | 192 | | | | 1,532 | | 349 | |
| Net income (loss) attributable to ExxonMobil | | 19,660 | | 6,750 | | | | 42,990 | | 14,170 | |
| | | | | | | |
Earnings (loss) per common share (dollars) | | 4.68 | | 1.57 | | | | 10.17 | | 3.31 | |
| | | | | | | |
Earnings (loss) per common share - assuming dilution (dollars) | | 4.68 | | 1.57 | | | | 10.17 | | 3.31 | |
| | | | | | | |
| | | | | | | | | | | | | | |
| (1) | Includes $74 million related to the write-off of exploratory well costs in 2022 that were previously capitalized for greater than one year at December 31, 2021. |
| | | | |
| The information in the Notes to Condensed Consolidated Financial Statements is an integral part of these statements. |
| | | | | |
| |
| CONDENSED CONSOLIDATED STATEMENT OF COMPREHENSIVE INCOME |
| | | | | | | | | | | | | | | | | | | | | | |
| (millions of dollars) | | Three Months Ended
September 30, | | Nine Months Ended
September 30, |
| 2022 | | 2021 | | 2022 | | 2021 |
| Net income (loss) including noncontrolling interests | | 20,198 | | | 6,942 | | | 44,522 | | | 14,519 | |
| | | | | | | | |
| Other comprehensive income (loss) (net of income taxes) | | | | | | | | |
| Foreign exchange translation adjustment | | (3,361) | | | (1,625) | | | (5,157) | | | (1,053) | |
| | | | | | | | |
| Postretirement benefits reserves adjustment (excluding amortization) | | 108 | | | 184 | | | 368 | | | 305 | |
| Amortization and settlement of postretirement benefits reserves adjustment included in net periodic benefit costs | | 128 | | | 196 | | | 323 | | | 789 | |
| Total other comprehensive income (loss) | | (3,125) | | | (1,245) | | | (4,466) | | | 41 | |
| Comprehensive income (loss) including noncontrolling interests | | 17,073 | | | 5,697 | | | 40,056 | | | 14,560 | |
| Comprehensive income (loss) attributable to noncontrolling interests | | 199 | | | 57 | | | 1,105 | | | 381 | |
| Comprehensive income (loss) attributable to ExxonMobil | | 16,874 | | | 5,640 | | | 38,951 | | | 14,179 | |
| | | | | | | | |
| The information in the Notes to Condensed Consolidated Financial Statements is an integral part of these statements. |
| | | | | |
| |
| CONDENSED CONSOLIDATED BALANCE SHEET |
| | | | | | | | | | | | | | |
(millions of dollars, unless noted) | | September 30, 2022 | December 31, 2021 | | | |
| | | | | | |
| ASSETS | | | | | | |
| Current assets | | | | | | |
| Cash and cash equivalents | | 30,407 | | 6,802 | | | | |
| Cash and cash equivalents – restricted | | 57 | | — | | | | |
| Notes and accounts receivable – net | | 42,411 | | 32,383 | | | | |
| Inventories | | | | | | |
| Crude oil, products and merchandise | | 20,078 | | 14,519 | | | | |
| Materials and supplies | | 4,018 | | 4,261 | | | | |
| Other current assets | | 2,318 | | 1,189 | | | | |
| Total current assets | | 99,289 | | 59,154 | | | | |
| Investments, advances and long-term receivables | | 50,235 | | 45,195 | | | | |
| Property, plant and equipment – net | | 203,102 | | 216,552 | | | | |
| Other assets, including intangibles – net | | 17,526 | | 18,022 | | | | |
| Total Assets | | 370,152 | | 338,923 | | | | |
| | | | | | |
| LIABILITIES | | | | | | |
| Current liabilities | | | | | | |
| Notes and loans payable | | 6,182 | | 4,276 | | | | |
| Accounts payable and accrued liabilities | | 62,550 | | 50,766 | | | | |
| Income taxes payable | | 5,325 | | 1,601 | | | | |
| Total current liabilities | | 74,057 | | 56,643 | | | | |
| Long-term debt | | 39,246 | | 43,428 | | | | |
| Postretirement benefits reserves | | 16,799 | | 18,430 | | | | |
| Deferred income tax liabilities | | 21,274 | | 20,165 | | | | |
| Long-term obligations to equity companies | | 2,647 | | 2,857 | | | | |
| Other long-term obligations | | 23,086 | | 21,717 | | | | |
| Total Liabilities | | 177,109 | | 163,240 | | | | |
| | | | | | |
| Commitments and contingencies (Note 3) | | | | | | |
| | | | | | |
| EQUITY | | | | | | |
| Common stock without par value | | | | | | |
(9,000 million shares authorized, 8,019 million shares issued) | | 16,106 | | 15,746 | | | | |
| Earnings reinvested | | 423,877 | | 392,059 | | | | |
| Accumulated other comprehensive income | | (17,803) | | (13,764) | | | | |
| Common stock held in treasury | | | | | | |
(3,901 million shares at September 30, 2022 and 3,780 million shares at December 31, 2021) | | (236,080) | | (225,464) | | | | |
| ExxonMobil share of equity | | 186,100 | | 168,577 | | | | |
| Noncontrolling interests | | 6,943 | | 7,106 | | | | |
| Total Equity | | 193,043 | | 175,683 | | | | |
| Total Liabilities and Equity | | 370,152 | | 338,923 | | | | |
| | | | | | |
| The information in the Notes to Condensed Consolidated Financial Statements is an integral part of these statements. | | | |
| | | | | |
| |
| CONDENSED CONSOLIDATED STATEMENT OF CASH FLOW |
| | | | | | | | | | | |
| (millions of dollars) | | Nine Months Ended September 30, |
| 2022 | 2021 |
| | | |
| CASH FLOW FROM OPERATING ACTIVITIES | | | |
| Net income (loss) including noncontrolling interests | | 44,522 | | 14,519 | |
| Depreciation and depletion (including impairments) | | 18,976 | | 14,946 | |
| | | |
| Changes in operational working capital, excluding cash and debt | | 6 | | 2,232 | |
| All other items – net | | (4,328) | | (692) | |
| Net cash provided by operating activities | | 59,176 | | 31,005 | |
| | | |
| CASH FLOW FROM INVESTING ACTIVITIES | | | |
| Additions to property, plant and equipment | | (12,624) | | (7,987) | |
| Proceeds from asset sales and returns of investments | | 3,914 | | 575 | |
| Additional investments and advances | | (915) | | (1,055) | |
| Other investing activities including collection of advances | | 238 | | 342 | |
| Net cash used in investing activities | | (9,387) | | (8,125) | |
| | | |
| CASH FLOW FROM FINANCING ACTIVITIES | | | |
| Additions to long-term debt | | 55 | | 46 | |
| Reductions in long-term debt | | — | | (4) | |
Additions to short-term debt | | — | | 12,197 | |
Reductions in short-term debt | | (3,895) | | (24,066) | |
| Additions/(reductions) in debt with three months or less maturity | | 1,638 | | 997 | |
| Contingent consideration payments | | (58) | | (28) | |
| Cash dividends to ExxonMobil shareholders | | (11,172) | | (11,161) | |
| Cash dividends to noncontrolling interests | | (191) | | (166) | |
| Changes in noncontrolling interests | | (1,074) | | (278) | |
| Common stock acquired | | (10,480) | | (1) | |
| Net cash used in financing activities | | (25,177) | | (22,464) | |
| | | |
| Effects of exchange rate changes on cash | | (950) | | (12) | |
| Increase/(decrease) in cash and cash equivalents | | 23,662 | | 404 | |
| Cash and cash equivalents at beginning of period | | 6,802 | | 4,364 | |
| Cash and cash equivalents at end of period | | 30,464 | | 4,768 | |
| | | |
| SUPPLEMENTAL DISCLOSURES | | | |
| Income taxes paid | | 10,172 | | 3,516 | |
| Cash interest paid | | | |
| Included in cash flows from operating activities | | 660 | | 818 | |
| Capitalized, included in cash flows from investing activities | | 605 | | 478 | |
| Total cash interest paid | | 1,265 | | 1,296 | |
| | | |
| | | |
| Noncash right of use assets recorded in exchange for lease liabilities | | | |
| Operating leases | | 1,648 | | 804 | |
| Finance leases | | 730 | | 168 | |
| | | |
| The information in the Notes to Condensed Consolidated Financial Statements is an integral part of these statements. |
| | | | | |
| |
| CONDENSED CONSOLIDATED STATEMENT OF CHANGE IN EQUITY |
| | | | | | | | | | | | | | | | | | | | | | | | | | |
| | | ExxonMobil Share of Equity | | |
| | | | | | | | |
(millions of dollars, unless noted) | | Common Stock | Earnings Reinvested | Accumulated Other Comprehensive Income | Common Stock Held in Treasury | ExxonMobil Share of Equity | Non-controlling Interests | Total Equity |
| | | | | | | | |
| Balance as of June 30, 2021 | | 16,006 | | 383,922 | | (15,586) | | (225,771) | | 158,571 | | 6,985 | | 165,556 | |
| Amortization of stock-based awards | | 99 | | — | | — | | — | | 99 | | — | | 99 | |
| Other | | (1) | | — | | — | | — | | (1) | | 4 | | 3 | |
| Net income (loss) for the period | | — | | 6,750 | | — | | — | | 6,750 | | 192 | | 6,942 | |
| Dividends - common shares | | — | | (3,720) | | — | | — | | (3,720) | | (54) | | (3,774) | |
| Other comprehensive income (loss) | | — | | — | | (1,110) | | — | | (1,110) | | (135) | | (1,245) | |
| Acquisitions, at cost | | — | | — | | — | | — | | — | | (75) | | (75) | |
| Dispositions | | — | | — | | — | | — | | — | | — | | — | |
| Balance as of September 30, 2021 | | 16,104 | | 386,952 | | (16,696) | | (225,771) | | 160,589 | | 6,917 | | 167,506 | |
| | | | | | | | |
| Balance as of June 30, 2022 | | 16,018 | | 407,902 | | (15,017) | | (231,587) | | 177,316 | | 7,192 | | 184,508 | |
| Amortization of stock-based awards | | 91 | | — | | — | | — | | 91 | | — | | 91 | |
| Other | | (3) | | — | | — | | — | | (3) | | (29) | | (32) | |
| Net income (loss) for the period | | — | | 19,660 | | — | | — | | 19,660 | | 538 | | 20,198 | |
| Dividends - common shares | | — | | (3,685) | | — | | — | | (3,685) | | (68) | | (3,753) | |
| Other comprehensive income (loss) | | — | | — | | (2,786) | | — | | (2,786) | | (339) | | (3,125) | |
| Acquisitions, at cost | | — | | — | | — | | (4,494) | | (4,494) | | (351) | | (4,845) | |
| Dispositions | | — | | — | | — | | 1 | | 1 | | — | | 1 | |
| Balance as of September 30, 2022 | | 16,106 | | 423,877 | | (17,803) | | (236,080) | | 186,100 | | 6,943 | | 193,043 | |
| | | | | | | | | | | | | | | | | | | | | | | | | | |
| | | Three Months Ended September 30, 2022 | | Three Months Ended September 30, 2021 |
| | | | | | | | |
Common Stock Share Activity (millions of shares) | | Issued | Held in Treasury | Outstanding | | Issued | Held in Treasury | Outstanding |
| Balance as of June 30 | | 8,019 | | (3,851) | | 4,168 | | | 8,019 | | (3,785) | | 4,234 | |
| Acquisitions | | — | | (50) | | (50) | | | — | | — | | — | |
| Dispositions | | — | | — | | — | | | — | | — | | — | |
| Balance as of September 30 | | 8,019 | | (3,901) | | 4,118 | | | 8,019 | | (3,785) | | 4,234 | |
| | | | | | | | |
| The information in the Notes to Condensed Consolidated Financial Statements is an integral part of these statements. |
| | | | | |
| |
| CONDENSED CONSOLIDATED STATEMENT OF CHANGE IN EQUITY |
| | | | | | | | | | | | | | | | | | | | | | | | | | |
| | | ExxonMobil Share of Equity | | |
| | | | | | | | |
(millions of dollars, unless noted) | | Common Stock | Earnings Reinvested | Accumulated Other Comprehensive Income | Common Stock Held in Treasury | ExxonMobil Share of Equity | Non-controlling Interests | Total Equity |
| | | | | | | | |
| Balance as of December 31, 2020 | | 15,688 | | 383,943 | | (16,705) | | (225,776) | | 157,150 | | 6,980 | | 164,130 | |
| Amortization of stock-based awards | | 427 | | — | | — | | — | | 427 | | — | | 427 | |
| Other | | (11) | | — | | — | | — | | (11) | | 90 | | 79 | |
| Net income (loss) for the period | | — | | 14,170 | | — | | — | | 14,170 | | 349 | | 14,519 | |
| Dividends - common shares | | — | | (11,161) | | — | | — | | (11,161) | | (166) | | (11,327) | |
| | | | | | | | |
| Other comprehensive income (loss) | | — | | — | | 9 | | — | | 9 | | 32 | | 41 | |
| Acquisitions, at cost | | — | | — | | — | | (1) | | (1) | | (368) | | (369) | |
| Dispositions | | — | | — | | — | | 6 | | 6 | | — | | 6 | |
| Balance as of September 30, 2021 | | 16,104 | | 386,952 | | (16,696) | | (225,771) | | 160,589 | | 6,917 | | 167,506 | |
| | | | | | | | |
| Balance as of December 31, 2021 | | 15,746 | | 392,059 | | (13,764) | | (225,464) | | 168,577 | | 7,106 | | 175,683 | |
| Amortization of stock-based awards | | 372 | | — | | — | | — | | 372 | | — | | 372 | |
| Other | | (12) | | — | | — | | — | | (12) | | (30) | | (42) | |
| Net income (loss) for the period | | — | | 42,990 | | — | | — | | 42,990 | | 1,532 | | 44,522 | |
| Dividends - common shares | | — | | (11,172) | | — | | — | | (11,172) | | (191) | | (11,363) | |
| | | | | | | | |
| Other comprehensive income (loss) | | — | | — | | (4,039) | | — | | (4,039) | | (427) | | (4,466) | |
| Acquisitions, at cost | | — | | — | | — | | (10,620) | | (10,620) | | (1,047) | | (11,667) | |
| Dispositions | | — | | — | | — | | 4 | | 4 | | — | | 4 | |
| Balance as of September 30, 2022 | | 16,106 | | 423,877 | | (17,803) | | (236,080) | | 186,100 | | 6,943 | | 193,043 | |
| | | | | | | | | | | | | | | | | | | | | | | | | | |
| | | Nine Months Ended September 30, 2022 | | Nine Months Ended September 30, 2021 |
| | | | | | | | |
Common Stock Share Activity (millions of shares) | | Issued | Held in Treasury | Outstanding | | Issued | Held in Treasury | Outstanding |
| Balance as of December 31 | | 8,019 | | (3,780) | | 4,239 | | | 8,019 | | (3,786) | | 4,233 | |
| Acquisitions | | — | | (121) | | (121) | | | — | | — | | — | |
| Dispositions | | — | | — | | — | | | — | | 1 | | 1 | |
| Balance as of September 30 | | 8,019 | | (3,901) | | 4,118 | | | 8,019 | | (3,785) | | 4,234 | |
| | | | | | | | |
| The information in the Notes to Condensed Consolidated Financial Statements is an integral part of these statements. |
| | | | | |
| |
| NOTES TO CONDENSED CONSOLIDATED FINANCIAL STATEMENTS |
Note 1. Basis of Financial Statement Preparation
These unaudited condensed consolidated financial statements should be read in the context of the consolidated financial statements and notes thereto filed with the Securities and Exchange Commission in the Corporation's 2021 Annual Report on Form 10-K. In the opinion of the Corporation, the information furnished herein reflects all known accruals and adjustments necessary for a fair statement of the results for the periods reported herein. All such adjustments are of a normal recurring nature. Prior data has been reclassified in certain cases to conform to the current presentation basis.
The Corporation's exploration and production activities are accounted for under the "successful efforts" method.
Note 2. Russia
In response to Russia’s military action in Ukraine, the Corporation announced in early 2022 that it planned to discontinue operations on the Sakhalin-1 project (“Sakhalin”) and develop steps to exit the venture. In light of this, an impairment assessment was conducted, and management determined that the carrying value of the asset group was not recoverable. As a result, the Corporation’s first quarter earnings included after-tax charges of $3.4 billion largely representing the full impairment of its operations related to Sakhalin. On a before-tax basis, the charges amounted to $4.6 billion, substantially all of which is reflected in the line captioned “Depreciation and depletion (including impairments)” on the Condensed Consolidated Statement of Income. Effective October 14, the Russian government unilaterally terminated the Corporation’s interests in Sakhalin-1, and the project has been transferred to a Russian operator. The Corporation's exit from the project results in quantities estimated at 150 million oil-equivalent barrels no longer qualifying as proved reserves, which represents less than one percent of the Corporation's 18.5 billion oil-equivalent barrels of proved reserves at year-end 2021.
Note 3. Litigation and Other Contingencies
Litigation
A variety of claims have been made against ExxonMobil and certain of its consolidated subsidiaries in a number of pending lawsuits. Management has regular litigation reviews, including updates from corporate and outside counsel, to assess the need for accounting recognition or disclosure of these contingencies. The Corporation accrues an undiscounted liability for those contingencies where the incurrence of a loss is probable and the amount can be reasonably estimated. If a range of amounts can be reasonably estimated and no amount within the range is a better estimate than any other amount, then the minimum of the range is accrued. The Corporation does not record liabilities when the likelihood that the liability has been incurred is probable but the amount cannot be reasonably estimated or when the liability is believed to be only reasonably possible or remote. For contingencies where an unfavorable outcome is reasonably possible and which are significant, the Corporation discloses the nature of the contingency and, where feasible, an estimate of the possible loss. For purposes of our contingency disclosures, “significant” includes material matters, as well as other matters which management believes should be disclosed. ExxonMobil will continue to defend itself vigorously in these matters. Based on a consideration of all relevant facts and circumstances, the Corporation does not believe the ultimate outcome of any currently pending lawsuit against ExxonMobil will have a material adverse effect upon the Corporation's operations, financial condition, or financial statements taken as a whole.
Other Contingencies
The Corporation and certain of its consolidated subsidiaries were contingently liable at September 30, 2022, for guarantees relating to notes, loans and performance under contracts. Where guarantees for environmental remediation and other similar matters do not include a stated cap, the amounts reflect management’s estimate of the maximum potential exposure. These guarantees are not reasonably likely to have a material effect on the Corporation’s financial condition, changes in financial condition, revenues or expenses, results of operations, liquidity, capital expenditures or capital resources.
| | | | | | | | | | | |
| | September 30, 2022 |
| | | |
| (millions of dollars) | Equity Company Obligations (1) | Other Third-Party Obligations | Total |
| Guarantees | | | |
| Debt-related | 1,239 | | 154 | | 1,393 | |
| Other | 727 | | 5,032 | | 5,759 | |
| Total | 1,966 | | 5,186 | | 7,152 | |
| | | |
| (1) ExxonMobil share | | | |
Additionally, the Corporation and its affiliates have numerous long-term sales and purchase commitments in their various business activities, all of which are expected to be fulfilled with no adverse consequences material to the Corporation’s operations or financial condition. In the third quarter, the Corporation entered into a long-term purchase agreement with minimum annual payments of approximately $0.4 billion from 2025 through 2045. As of September 30, undiscounted commitments for leases not yet commenced totaled $2.5 billion for operating leases and $4.3 billion for finance leases.
The operations and earnings of the Corporation and its affiliates throughout the world have been, and may in the future be, affected from time to time in varying degree by political developments and laws and regulations, such as forced divestiture of assets; restrictions on production, imports and exports; price controls; tax increases and retroactive tax claims; expropriation of property; cancellation of contract rights; sanctions and environmental regulations. Both the likelihood of such occurrences and their overall effect upon the Corporation vary greatly from country to country and are not predictable.
Note 4. Other Comprehensive Income Information
| | | | | | | | | | | |
ExxonMobil Share of Accumulated Other Comprehensive Income (millions of dollars) | Cumulative Foreign Exchange Translation Adjustment | Postretirement Benefits
Reserves Adjustment | Total |
| Balance as of December 31, 2020 | (10,614) | | (6,091) | | (16,705) | |
Current period change excluding amounts reclassified from accumulated other comprehensive income (1) | (1,041) | | 289 | | (752) | |
| Amounts reclassified from accumulated other comprehensive income | — | | 761 | | 761 | |
| Total change in accumulated other comprehensive income | (1,041) | | 1,050 | | 9 | |
| Balance as of September 30, 2021 | (11,655) | | (5,041) | | (16,696) | |
| | | |
| Balance as of December 31, 2021 | (11,499) | | (2,265) | | (13,764) | |
Current period change excluding amounts reclassified from accumulated other comprehensive income (1) | (4,680) | | 335 | | (4,345) | |
| Amounts reclassified from accumulated other comprehensive income | — | | 306 | | 306 | |
| Total change in accumulated other comprehensive income | (4,680) | | 641 | | (4,039) | |
| Balance as of September 30, 2022 | (16,179) | | (1,624) | | (17,803) | |
| | | |
(1) Cumulative Foreign Exchange Translation Adjustment includes net investment hedge gain/(loss) net of taxes of $551 million and $240 million in 2022 and 2021, respectively. |
| | | | | | | | | | | | | | | | | | | | | |
Amounts Reclassified Out of Accumulated Other Comprehensive Income - Before-tax Income/(Expense) (millions of dollars) | | Three Months Ended
September 30, | | Nine Months Ended
September 30, |
| 2022 | 2021 | | 2022 | | 2021 |
| | | | | | | |
| Amortization and settlement of postretirement benefits reserves adjustment included in net periodic benefit costs | | | | | | | |
| (Statement of Income line: Non-service pension and postretirement benefit expense) | | (163) | | (256) | | | (415) | | | (1,020) | |
| | | | | | | | | | | | | | | | | | | | | |
Income Tax (Expense)/Credit For Components of Other Comprehensive Income (millions of dollars) | | Three Months Ended
September 30, | | Nine Months Ended
September 30, |
| 2022 | 2021 | | 2022 | | 2021 |
| | | | |
Foreign exchange translation adjustment | | (61) | | (26) | | | (151) | | | (60) | |
| Postretirement benefits reserves adjustment (excluding amortization) | | (82) | | (76) | | | (205) | | | (109) | |
| Amortization and settlement of postretirement benefits reserves adjustment included in net periodic benefit costs | | (35) | | (60) | | | (92) | | | (231) | |
| Total | | (178) | | (162) | | | (448) | | | (400) | |
Note 5. Earnings Per Share
| | | | | | | | | | | | | | | | | | | | | |
| | | Three Months Ended
September 30, | | Nine Months Ended
September 30, |
| 2022 | 2021 | | 2022 | | 2021 |
| Earnings per common share | | | | | | | |
Net income (loss) attributable to ExxonMobil (millions of dollars) | | 19,660 | | 6,750 | | | 42,990 | | | 14,170 | |
Weighted average number of common shares outstanding (millions of shares) | | 4,185 | | 4,276 | | | 4,227 | | | 4,275 | |
Earnings (loss) per common share (dollars) (1) | | 4.68 | | 1.57 | | | 10.17 | | | 3.31 | |
Dividends paid per common share (dollars) | | 0.88 | | 0.87 | | | 2.64 | | | 2.61 | |
| | | | | | | |
| (1) The calculation of earnings (loss) per common share and earnings (loss) per common share – assuming dilution are the same in each period shown. |
Note 6. Pension and Other Postretirement Benefits
| | | | | | | | | | | | | | | | | | | | | |
| (millions of dollars) | | Three Months Ended
September 30, | | Nine Months Ended
September 30, |
| 2022 | 2021 | | 2022 | | 2021 |
| Components of net benefit cost | | | | | | | |
| Pension Benefits - U.S. | | | | | | | |
| Service cost | | 173 | | 228 | | | 529 | | | 661 | |
| Interest cost | | 130 | | 139 | | | 388 | | | 418 | |
| Expected return on plan assets | | (140) | | (181) | | | (420) | | | (542) | |
| Amortization of actuarial loss/(gain) | | 39 | | 62 | | | 117 | | | 184 | |
| Amortization of prior service cost | | (8) | | (5) | | | (22) | | | (17) | |
| Net pension enhancement and curtailment/settlement cost | | 87 | | 75 | | | 177 | | | 468 | |
| Net benefit cost | | 281 | | 318 | | | 769 | | | 1,172 | |
| | | | | | | |
| Pension Benefits - Non-U.S. | | | | | | | |
| Service cost | | 138 | | 194 | | | 433 | | | 587 | |
| Interest cost | | 149 | | 131 | | | 466 | | | 396 | |
| Expected return on plan assets | | (198) | | (256) | | | (618) | | | (777) | |
| Amortization of actuarial loss/(gain) | | 44 | | 104 | | | 138 | | | 319 | |
| Amortization of prior service cost | | 10 | | 14 | | | 33 | | | 43 | |
| Net pension enhancement and curtailment/settlement cost | | — | | 4 | | | (1) | | | 16 | |
| Net benefit cost | | 143 | | 191 | | | 451 | | | 584 | |
| | | | | | | |
| Other Postretirement Benefits | | | | | | | |
| Service cost | | 30 | | 44 | | | 108 | | | 139 | |
| Interest cost | | 54 | | 55 | | | 162 | | | 166 | |
| Expected return on plan assets | | (4) | | (5) | | | (11) | | | (14) | |
| Amortization of actuarial loss/(gain) | | 1 | | 19 | | | 4 | | | 57 | |
| Amortization of prior service cost | | (10) | | (10) | | | (31) | | | (31) | |
| Net benefit cost | | 71 | | 103 | | | 232 | | | 317 | |
Note 7. Financial Instruments and Derivatives
The estimated fair value of financial instruments and derivatives at September 30, 2022 and December 31, 2021, and the related hierarchy level for the fair value measurement was as follows:
| | | | | | | | | | | | | | | | | | | | | | | | | | |
| | September 30, 2022 |
| | | | | | | | |
| | | | | | | | |
| | Fair Value | | | | |
| (millions of dollars) | Level 1 | Level 2 | Level 3 | Total Gross Assets
& Liabilities | Effect of
Counterparty Netting | Effect of
Collateral
Netting | Difference in Carrying Value and Fair Value | Net
Carrying
Value |
| Assets | | | | | | | | |
Derivative assets (1) | 5,972 | | 4,379 | | — | | 10,351 | | (8,398) | | (519) | | — | | 1,434 | |
| | | | | | | | |
Advances to/receivables from equity companies (2)(6) | — | | 2,374 | | 5,325 | | 7,699 | | — | | — | | 734 | | 8,433 | |
| | | | | | | | |
Other long-term financial assets (3) | 1,185 | | — | | 1,329 | | 2,514 | | — | | — | | 313 | | 2,827 | |
| | | | | | | | |
| Liabilities | | | | | | | | |
Derivative liabilities (4) | 5,638 | | 5,112 | | — | | 10,750 | | (8,398) | | (185) | | — | | 2,167 | |
Long-term debt (5) | 32,236 | | 90 | | 6 | | 32,332 | | — | | — | | 4,638 | | 36,970 | |
| | | | | | | | |
Long-term obligations to equity companies (6) | — | | — | | 2,711 | | 2,711 | | — | | — | | (64) | | 2,647 | |
| | | | | | | | |
Other long-term financial liabilities (7) | — | | — | | 773 | | 773 | | — | | — | | 56 | | 829 | |
| | | | | | | | | | | | | | | | | | | | | | | | | | | |
| | | December 31, 2021 |
| | | | | | | | | |
| | | | | | | | | |
| | | Fair Value | | | | |
| (millions of dollars) | | Level 1 | Level 2 | Level 3 | Total Gross Assets
& Liabilities | Effect of
Counterparty Netting | Effect of
Collateral
Netting | Difference in Carrying Value and Fair Value | Net
Carrying
Value |
| Assets | | | | | | | | | |
Derivative assets (1) | | 1,422 | | 1,523 | | — | | 2,945 | | (1,930) | | (28) | | — | | 987 | |
| | | | | | | | | |
Advances to/receivables from equity companies (2)(6) | | — | | 3,076 | | 5,373 | | 8,449 | | — | | — | | (123) | | 8,326 | |
| | | | | | | | | |
Other long-term financial assets (3) | | 1,134 | | — | | 1,058 | | 2,192 | | — | | — | | 181 | | 2,373 | |
| | | | | | | | | |
| Liabilities | | | | | | | | | |
Derivative liabilities (4) | | 1,701 | | 2,594 | | — | | 4,295 | | (1,930) | | (306) | | — | | 2,059 | |
Long-term debt (5) | | 44,454 | | 88 | | 3 | | 44,545 | | — | | — | | (2,878) | | 41,667 | |
| | | | | | | | | |
Long-term obligations to equity companies (6) | | — | | — | | 3,084 | | 3,084 | | — | | — | | (227) | | 2,857 | |
| | | | | | | | | |
Other long-term financial liabilities (7) | | — | | — | | 902 | | 902 | | — | | — | | 58 | | 960 | |
| | | | | |
| (1) | Included in the Balance Sheet lines: Notes and accounts receivable - net and Other assets, including intangibles - net |
| (2) | Included in the Balance Sheet line: Investments, advances and long-term receivables |
| (3) | Included in the Balance Sheet lines: Investments, advances and long-term receivables and Other assets, including intangibles - net |
| (4) | Included in the Balance Sheet lines: Accounts payable and accrued liabilities and Other long-term obligations |
| (5) | Excluding finance lease obligations |
| (6) | Advances to/receivables from equity companies and long-term obligations to equity companies are mainly designated as hierarchy level 3 inputs. The fair value is calculated by discounting the remaining obligations by a rate consistent with the credit quality and industry of the company. |
| (7) | Included in the Balance Sheet line: Other long-term obligations. Includes contingent consideration related to a prior year acquisition where fair value is based on expected drilling activities and discount rates. |
At September 30, 2022 and December 31, 2021, respectively, the Corporation had $1,826 million and $641 million of collateral under master netting arrangements not offset against the derivatives on the Consolidated Balance Sheet, primarily related to initial margin requirements.
The Corporation may use non-derivative financial instruments, such as its foreign currency-denominated debt, as hedges of its net investments in certain foreign subsidiaries. Under this method, the change in the carrying value of the financial instruments due to foreign exchange fluctuations is reported in accumulated other comprehensive income. As of September 30, 2022, the Corporation has designated $4.4 billion of its Euro-denominated long-term debt and related accrued interest as a net investment hedge of its European business. The net investment hedge is deemed to be perfectly effective.
The Corporation had undrawn short-term committed lines of credit of $549 million and undrawn long-term committed lines of credit of $351 million as of third quarter 2022. Undrawn short-term committed lines of credit amounting to $10 billion expired in the third quarter of 2022.
Derivative Instruments
The Corporation’s size, strong capital structure, geographic diversity and the complementary nature of its business segments reduce the Corporation’s enterprise-wide risk from changes in commodity prices, currency rates and interest rates. In addition, the Corporation uses commodity-based contracts, including derivatives, to manage commodity price risk and to generate returns from trading. Commodity contracts held for trading purposes are presented in the Condensed Consolidated Statement of Income on a net basis in the line “Sales and other operating revenue". The Corporation’s commodity derivatives are not accounted for under hedge accounting. At times, the Corporation also enters into currency and interest rate derivatives, none of which are material to the Corporation’s financial position as of September 30, 2022 and December 31, 2021, or results of operations for the periods ended September 30, 2022 and 2021.
Credit risk associated with the Corporation’s derivative position is mitigated by several factors, including the use of derivative clearing exchanges and the quality of and financial limits placed on derivative counterparties. The Corporation maintains a system of controls that includes the authorization, reporting and monitoring of derivative activity.
The net notional long/(short) position of derivative instruments at September 30, 2022 and December 31, 2021, was as follows:
| | | | | | | | |
|
| | |
| (millions) | September 30, 2022 | December 31, 2021 |
| Crude oil (barrels) | (15) | | 82 | |
| Petroleum products (barrels) | (22) | | (48) | |
| Natural gas (MMBTUs) | (120) | | (115) | |
| | |
Realized and unrealized gains/(losses) on derivative instruments that were recognized in the Condensed Consolidated Statement of Income are included in the following lines on a before-tax basis:
| | | | | | | | | | | | | | | | | | | | |
| | | | | |
|
| | | | | | |
| (millions of dollars) | | Three Months Ended
September 30, | | Nine Months Ended
September 30, |
| 2022 | 2021 | | 2022 | 2021 |
| Sales and other operating revenue | | 945 | | (1,596) | | | (3,003) | | (3,196) | |
| Crude oil and product purchases | | (56) | | (34) | | | (82) | | (53) | |
| Total | | 889 | | (1,630) | | | (3,085) | | (3,249) | |
Note 8. Disclosures about Segments and Related Information
Effective April 1, 2022, the Corporation streamlined its business structure by combining the Chemical and Downstream businesses into a single business, Product Solutions. Product Solutions consists of three operating segments:
•Energy Products: Fuels, aromatics, and catalysts and licensing
•Chemical Products: Olefins, polyethylene, polypropylene, and intermediates
•Specialty Products: Finished lubricants, basestocks and waxes, synthetics, and elastomers and resins
Information disclosed in this note has been recast for the new segmentation.
| | | | | | | | | | | | | | | | | | | | |
| (millions of dollars) | | Three Months Ended
September 30, | | Nine Months Ended
September 30, |
| 2022 | 2021 | | 2022 | 2021 |
| Earnings (Loss) After Income Tax | | | | | | |
| Upstream | | | | | | |
| United States | | 3,110 | | 869 | | | 9,235 | | 1,895 | |
| Non-U.S. | | 9,309 | | 3,082 | | | 19,043 | | 7,795 | |
| Energy Products | | | | | | |
| United States | | 3,008 | | 479 | | | 6,152 | | (31) | |
| Non-U.S. | | 2,811 | | 50 | | | 4,744 | | (1,217) | |
| Chemical Products | | | | | | |
| United States | | 635 | | 1,121 | | | 2,030 | | 2,923 | |
| Non-U.S. | | 177 | | 907 | | | 1,263 | | 2,695 | |
| Specialty Products | | | | | | |
| United States | | 306 | | 247 | | | 784 | | 689 | |
| Non-U.S. | | 456 | | 592 | | | 871 | | 1,454 | |
| Corporate and Financing | | (152) | | (596) | | | (1,132) | | (2,033) | |
| Corporate total | | 19,660 | | 6,750 | | | 42,990 | | 14,170 | |
| | | | | | |
| Sales and Other Operating Revenue | | | | | | |
| Upstream | | | | | | |
| United States | | 4,163 | | 2,072 | | | 10,777 | | 5,683 | |
| Non-U.S. | | 8,770 | | 2,295 | | | 22,214 | | 9,181 | |
| Energy Products | | | | | | |
| United States | | 31,324 | | 20,988 | | | 90,650 | | 55,292 | |
| Non-U.S. | | 50,215 | | 34,305 | | | 144,734 | | 91,120 | |
| Chemical Products | | | | | | |
| United States | | 2,499 | | 3,474 | | | 8,773 | | 9,007 | |
| Non-U.S. | | 4,213 | | 4,215 | | | 13,207 | | 12,200 | |
| Specialty Products | | | | | | |
| United States | | 1,615 | | 1,227 | | | 4,659 | | 3,606 | |
| Non-U.S. | | 3,709 | | 3,309 | | | 10,478 | | 9,382 | |
| Corporate and Financing | | 4 | | 7 | | | 19 | | (84) | |
Corporate total (1) | | 106,512 | | 71,892 | | | 305,511 | | 195,387 | |
| | | | | | |
| Intersegment Revenue | | | | | | |
| Upstream | | | | | | |
| United States | | 6,536 | | 4,374 | | | 19,907 | | 11,524 | |
| Non-U.S. | | 11,723 | | 9,371 | | | 36,091 | | 23,935 | |
| Energy Products | | | | | | |
| United States | | 7,580 | | 4,132 | | | 22,777 | | 11,395 | |
| Non-U.S. | | 9,551 | | 6,787 | | | 29,161 | | 16,872 | |
| Chemical Products | | | | | | |
| United States | | 2,579 | | 1,479 | | | 6,904 | | 4,285 | |
| Non-U.S. | | 1,252 | | 1,098 | | | 4,359 | | 2,849 | |
| Specialty Products | | | | | | |
| United States | | 662 | | 578 | | | 1,934 | | 1,658 | |
| Non-U.S. | | 246 | | 212 | | | 665 | | 532 | |
| Corporate and Financing | | 59 | | 57 | | | 175 | | 166 | |
| | | | | | |
(1) See footnote on the next page. |
| | | | | | | | | | | | | | | | | | | | |
| Geographic Sales and Other Operating Revenue | | | | | | |
| (millions of dollars) | | Three Months Ended
September 30, | | Nine Months Ended
September 30, |
| 2022 | 2021 | | 2022 | 2021 |
| United States | | 39,601 | | 27,761 | | | 114,859 | | 73,588 | |
| Non-U.S. | | 66,911 | | 44,131 | | | 190,652 | | 121,799 | |
Total (1) | | 106,512 | | 71,892 | | | 305,511 | | 195,387 | |
| | | | | | |
Significant Non-U.S. revenue sources include: (2) | | | | | | |
| Canada | | 8,468 | | 5,837 | | | 25,105 | | 15,378 | |
| United Kingdom | | 8,845 | | 3,379 | | | 24,699 | | 10,137 | |
| Singapore | | 5,262 | | 3,678 | | | 14,358 | | 10,628 | |
| France | | 4,449 | | 3,513 | | | 14,071 | | 9,541 | |
| Italy | | 2,990 | | 2,808 | | | 8,888 | | 7,139 | |
| Belgium | | 2,755 | | 2,409 | | | 8,632 | | 6,590 | |
| Australia | | 2,936 | | 1,751 | | | 8,597 | | 5,499 | |
| | | | | | |
(1) Includes approximately 25% and 16% related to revenue outside the scope of ASC 606 "Revenue from Contracts with Customers" for the three months ended September 30, 2022 and September 30, 2021, respectively, and 23% and 16% for the nine months ended September 30, 2022 and September 30, 2021, respectively. Trade receivables in Notes and accounts receivable – net reported on the Balance Sheet include both receivables within the scope of ASC 606 and those outside the scope of ASC 606. Revenue and receivables outside the scope of ASC 606 primarily relate to physically settled commodity contracts accounted for as derivatives. Credit quality and type of customer are generally similar between those revenues and receivables within the scope of ASC 606 and those outside it. |
(2) Revenue is determined by primary country of operations. Excludes certain sales and other operating revenues in Non-U.S. operations where attribution to a specific country is not practicable. |
Note 9. Divestment Activities
In the third quarter, the Corporation sold certain Upstream unproved assets in Romania and Upstream unconventional assets in Alberta, Canada, which resulted in total gains on sales of approximately $600 million which are largely included in "Other income" in the Condensed Consolidated Statement of Income.
In August 2022, the Corporation executed an agreement for the sale of Upstream unconventional shale interests in the Arkoma basin (United States) to Flywheel, LLC. The transaction is anticipated to close in the fourth quarter.
In August 2022, the Corporation executed an agreement for the sale of Mobil California Exploration and Producing Asset Company (United States), consisting of ExxonMobil's interest in the Aera Energy Joint Venture, to Green Gate Resources E, LLC. The transaction is anticipated to close in the fourth quarter.
In February 2022, the Corporation signed an agreement with Seplat Energy Offshore Limited for the sale of Mobil Producing Nigeria Unlimited. The agreement is subject to certain conditions precedent and government approvals. In early July, a Nigerian court issued an order to halt transition activities and enter into arbitration with the Nigerian National Petroleum Company. The closing date and any loss on sale will depend on resolution of these matters.
After the end of the third quarter, the Corporation signed an agreement for the sale of the Santa Ynez Unit and associated assets in California. The agreement is subject to certain conditions precedent and government approvals and does not yet meet held-for-sale criteria under ASC 360. The transaction would be expected to close in 2023. The Corporation expects to recognize a loss of up to $2 billion on the potential transaction.
ITEM 2. MANAGEMENT'S DISCUSSION AND ANALYSIS OF FINANCIAL CONDITION AND RESULTS OF OPERATIONS
Overview
During the COVID-19 pandemic, industry investment to maintain and increase production capacity was restrained to preserve capital, resulting in underinvestment and supply tightness as demand for petroleum and petrochemical products recovered. In addition, industry rationalization of refining assets resulted in more than 3 million barrels per day of capacity being taken offline. Across late 2021 and the first half of 2022, this dynamic, along with supply chain constraints, and a continuation of demand recovery led to a steady increase in oil and natural gas prices and refining margins. In the first half of 2022, tightness in the oil and natural gas markets was further exacerbated by Russia’s invasion of Ukraine and subsequent sanctions imposed upon business and other activities in Russia. The price of Brent crude oil and certain regional natural gas indicators increased to levels not seen for several years, and both natural gas realizations and industry refining margins improved to levels well above the 10-year range. In the third quarter, crude prices moved back within the upper-end of the 10-year range as higher supply slightly exceeded demand. Natural gas prices rose to record levels in the third quarter, reflecting concerns in Europe about the withdrawal of Russian supply as well as efforts to build inventory ahead of winter. While natural gas prices recently moderated, they remain well above the 10-year historical range. In the U.S., prices increased by about 15% driven by higher summer cooling demand and inventory concerns. Refining margins remained well above the 10-year range due to inflated diesel crack spreads resulting from expensive natural gas and high demand for diesel. Higher refinery runs and flat demand for gasoline in the U.S. resulted in refining margins declining from the second quarter. In contrast, global chemical margins fell below the bottom of the 10-year range reflecting weakening global demand. Margins in North America and Europe have softened with regional pricing moving closer to global parity as demand and logistics constraints relaxed. Asia Pacific remained in bottom-of-cycle conditions as COVID-19 restrictions continue to suppress demand in China. Commodity and product prices are expected to remain volatile given the current global economic uncertainty and geopolitical events affecting supply and demand.
Russia-Ukraine Conflict
In response to Russia’s military action in Ukraine, the Corporation announced in early 2022 that it planned to discontinue operations on the Sakhalin-1 project (“Sakhalin”) and develop steps to exit the venture. The Corporation’s first quarter results included after-tax charges of $3.4 billion largely representing the impairment of its operations related to Sakhalin (see Note 2 to Condensed Consolidated Financial Statements). While the Corporation’s affiliate was in force majeure due to the unprecedented impact of global sanctions, it continued to make concerted attempts to engage in good-faith discussions with the Russian government and all Sakhalin-1 partners. The Corporation remained focused on safety of people, protection of the environment, and integrity of operations. Effective October 14, with two decrees the Russian government unilaterally terminated the Corporation’s interests in Sakhalin-1, and the project has been transferred to a Russian operator. While the recent decrees violate the Corporation’s rights in Russia established by the production sharing agreement, and interrupted the exit process the Corporation was working, it did not prevent the safe winding down of operations.
The Corporation’s exit from the venture is expected to result in no future hydrocarbon sales and minimal cash flow impacts for the Corporation’s account in the fourth quarter. For reference, excluding the impact of impairments and other charges, year-to-date after-tax earnings related to the Corporation’s interest in Sakhalin through the end of the third quarter of 2022 were approximately $0.2 billion, and combined oil and gas production was approximately 34 thousand oil-equivalent barrels per day. The Corporation's exit from the project results in quantities estimated at 150 million oil-equivalent barrels no longer qualifying as proved reserves, which represents less than one percent of the Corporation's 18.5 billion oil-equivalent barrels of proved reserves at year-end 2021. The Corporation is complying with all applicable laws and sanctions.
The Corporation holds a 25% interest in Tengizchevroil, LLP (TCO), which operates the Tengiz and Korolev oil fields in Kazakhstan, and holds a 16.8% working interest in the Kashagan field in Kazakhstan. Oil production from those operations is exported through the Caspian Pipeline Consortium (CPC), in which the Corporation holds a 7.5% interest. CPC traverses parts of Kazakhstan and Russia to tanker-loading facilities on the Russian coast of the Black Sea. In the event that Russia takes countermeasures in response to existing sanctions related to its military actions in Ukraine, it is possible that the transportation of Kazakhstan oil through the CPC pipeline could be disrupted, curtailed, temporarily suspended, or otherwise restricted. In such a case, the Corporation could experience a loss of cash flows of uncertain duration. For reference, year-to-date after-tax earnings related to the Corporation’s interests in Kazakhstan through the end of the third quarter 2022 were approximately $2.0 billion, and its share of combined oil and gas production was approximately 240 thousand oil-equivalent barrels per day.
European Union Solidarity Contribution
On October 6, European Union (“EU”) Member States formally adopted a European Union Council Regulation for a new tax described as an emergency intervention to address high energy prices. This regulation imposes a mandatory tax on certain companies active in the crude petroleum, coal, natural gas and refinery sectors. The regulation requires Member States to levy a minimum 33% tax on in-scope companies’ 2022 and/or 2023 “surplus profits”, defined in the regulation as taxable profits exceeding 120% of the annual average during the 2018-2021 period. EU Member States are required to implement the tax, or an equivalent national measure, by December 31, 2022. Depending on the national measures to be adopted by the EU Member States, and the financial years for which these measures would be applicable, the Corporation’s liability, based on currently available public information, could be in excess of $2 billion through the end of 2023. The actual impact and timing of recognition in the financial statements will depend on the specific provisions of the EU Member States’ measures.
ExxonMobil Product Solutions Reorganization
Effective April 1, 2022, the Corporation streamlined its business structure by combining the Chemical and Downstream businesses into a single business, Product Solutions. The new business is focused on growing high-value products, improving competitiveness and leading in sustainability. Product Solutions consists of three operating segments:
•Energy Products: Fuels, aromatics, and catalysts and licensing
•Chemical Products: Olefins, polyethylene, polypropylene, and intermediates
•Specialty Products: Finished lubricants, basestocks and waxes, synthetics, and elastomers and resins
Further information on financial performance related to the new segments is disclosed in Management's Discussion and Analysis and Note 8 to the Condensed Consolidated Financial Statements.
FUNCTIONAL EARNINGS SUMMARY
Earnings (loss) excluding Identified Items, are earnings (loss) excluding individually significant non-operational events with an absolute corporate total earnings impact of at least $250 million in a given quarter. The earnings (loss) impact of an Identified Item for an individual segment in a given quarter may be less than $250 million when the item impacts several segments or several periods. Management uses these figures to improve comparability of the underlying business across multiple periods by isolating and removing significant non-operational events from business results. The Corporation believes this view provides investors increased transparency into business results and trends and provides investors with a view of the business as seen through the eyes of management. Earnings (loss) excluding Identified Items is not meant to be viewed in isolation or as a substitute for net income (loss) attributable to ExxonMobil as prepared in accordance with U.S. GAAP.
| | | | | | | | | | | | | | | | | | | | | | | | | | | | | | | | | | | | | |
Three Months Ended
September 30, 2022 | Upstream | | Energy Products | | Chemical Products | Specialty Products | | | Corporate and Financing | | Total |
| (millions of dollars) | U.S. | Non-U.S. | | U.S. | Non-U.S. | | U.S. | Non-U.S. | U.S. | Non-U.S. | | | |
| Earnings (loss) (U.S. GAAP) | 3,110 | | 9,309 | | | 3,008 | | 2,811 | | | 635 | | 177 | | 306 | | 456 | | | | (152) | | | 19,660 | |
| Identified Items | | | | | | | | | | | | | | | |
| Impairments | — | | (697) | | | — | | — | | | — | | — | | — | | — | | | | — | | | (697) | |
| Gain/(loss) on sale of assets | — | | 587 | | | — | | — | | | — | | — | | — | | — | | | | — | | | 587 | |
| | | | | | | | | | | | | | | |
| Tax-related items | — | | — | | | — | | — | | | — | | — | | — | | — | | | | 324 | | | 324 | |
| | | | | | | | | | | | | | | |
| | | | | | | | | | | | | | | |
| Other | — | | 688 | | | — | | — | | | — | | — | | — | | — | | | | 76 | | | 764 | |
| | | | | | | | | | | | | | | |
| Earnings (loss) excluding Identified Items | 3,110 | | 8,731 | | | 3,008 | | 2,811 | | | 635 | | 177 | | 306 | | 456 | | | | (552) | | | 18,682 | |
| | | | | | | | | | | | | | | |
Three Months Ended
September 30, 2021 | Upstream | | Energy Products | | Chemical Products | Specialty Products | | | Corporate and Financing | | Total |
| (millions of dollars) | U.S. | Non-U.S. | | U.S. | Non-U.S. | | U.S. | Non-U.S. | U.S. | Non-U.S. | | | |
| Earnings (loss) (U.S. GAAP) | 869 | | 3,082 | | | 479 | | 50 | | | 1,121 | | 907 | | 247 | | 592 | | | | (596) | | | 6,750 | |
| Identified Items | | | | | | | | | | | | | | | |
| | | | | | | | | | | | | | | |
| | | | | | | | | | | | | | | |
| | | | | | | | | | | | | | | |
| | | | | | | | | | | | | | | |
| Severance charges | — | | — | | | — | | — | | | — | | — | | — | | — | | | | (5) | | | (5) | |
| | | | | | | | | | | | | | | |
| | | | | | | | | | | | | | | |
| | | | | | | | | | | | | | | |
| Earnings (loss) excluding Identified Items | 869 | | 3,082 | | | 479 | | 50 | | | 1,121 | | 907 | | 247 | | 592 | | | | (591) | | | 6,755 | |
| | | | | | | | | | | | | | | |
| | | | | | | | | | | | | | | | | | | | | | | | | | | | | | | | | | | | | |
Nine Months Ended
September 30, 2022 | Upstream | | Energy Products | | Chemical Products | Specialty Products | | | Corporate and Financing | | Total |
| (millions of dollars) | U.S. | Non-U.S. | | U.S. | Non-U.S. | | U.S. | Non-U.S. | U.S. | Non-U.S. | | | |
| Earnings (loss) (U.S. GAAP) | 9,235 | | 19,043 | | | 6,152 | | 4,744 | | | 2,030 | | 1,263 | | 784 | | 871 | | | | (1,132) | | | 42,990 | |
| Identified Items | | | | | | | | | | | | | | | |
| Impairments | — | | (3,574) | | | — | | — | | | — | | — | | — | | — | | | | (98) | | | (3,672) | |
| Gain/(loss) on sale of assets | 299 | | 587 | | | — | | — | | | — | | — | | — | | — | | | | — | | | 886 | |
| | | | | | | | | | | | | | | |
| Tax-related items | — | | — | | | — | | — | | | — | | — | | — | | — | | | | 324 | | | 324 | |
| | | | | | | | | | | | | | | |
| | | | | | | | | | | | | | | |
| Other | — | | 310 | | | — | | — | | | — | | — | | — | | — | | | | 76 | | | 386 | |
| | | | | | | | | | | | | | | |
| Earnings (loss) excluding Identified Items | 8,936 | | 21,720 | | | 6,152 | | 4,744 | | | 2,030 | | 1,263 | | 784 | | 871 | | | | (1,434) | | | 45,066 | |
| | | | | | | | | | | | | | | |
| | | | | | | | | | | | | | | |
Nine Months Ended
September 30, 2021 | Upstream | | Energy Products | | Chemical Products | Specialty Products | | | Corporate and Financing | | Total |
| (millions of dollars) | U.S. | Non-U.S. | | U.S. | Non-U.S. | | U.S. | Non-U.S. | U.S. | Non-U.S. | | | |
| Earnings (loss) (U.S. GAAP) | 1,895 | | 7,795 | | | (31) | | (1,217) | | | 2,923 | | 2,695 | | 689 | | 1,454 | | | | (2,033) | | | 14,170 | |
| Identified Items | | | | | | | | | | | | | | | |
| | | | | | | | | | | | | | | |
| | | | | | | | | | | | | | | |
| | | | | | | | | | | | | | | |
| | | | | | | | | | | | | | | |
| Severance charges | — | | — | | | — | | — | | | — | | — | | — | | — | | | | (48) | | | (48) | |
| | | | | | | | | | | | | | | |
| | | | | | | | | | | | | | | |
| | | | | | | | | | | | | | | |
| Earnings (loss) excluding Identified Items | 1,895 | | 7,795 | | | (31) | | (1,217) | | | 2,923 | | 2,695 | | 689 | | 1,454 | | | | (1,985) | | | 14,218 | |
References in this discussion to Corporate earnings (loss) mean net income (loss) attributable to ExxonMobil (U.S. GAAP) from the Condensed Consolidated Statement of Income. Unless otherwise indicated, references to earnings (loss); Upstream, Energy Products, Chemical Products, Specialty Products, and Corporate and Financing segment earnings (loss); and earnings (loss) per share are ExxonMobil's share after excluding amounts attributable to noncontrolling interests.
Due to rounding, numbers presented may not add up precisely to the totals indicated.
REVIEW OF THIRD QUARTER 2022 RESULTS
ExxonMobil’s third quarter 2022 earnings were $19.7 billion, or $4.68 per diluted share, compared with earnings of $6.8 billion a year earlier. The increase in earnings was driven by higher Upstream realizations and Energy Products margins as well as increased volume and improved mix. Capital and exploration expenditures were $5.7 billion, up $1.9 billion from third quarter 2021.
Earnings for the first nine months of 2022 were $43.0 billion, or $10.17 per diluted share, compared with $14.2 billion a year earlier. Capital and exploration expenditures were $15.2 billion, up $4.5 billion from 2021. The Corporation distributed $11.2 billion in dividends to shareholders and repurchased $10.5 billion of common stock.
UPSTREAM
| | | | | | | | | | | | | | | | | | | | |
| Upstream Financial Results | | | | | | |
| | | | | | |
| (millions of dollars) | | Three Months Ended
September 30, | | Nine Months Ended
September 30, |
| 2022 | 2021 | | 2022 | 2021 |
| Earnings (loss) (U.S. GAAP) | | | | | | |
| United States | | 3,110 | | 869 | | | 9,235 | | 1,895 | |
| Non-U.S. | | 9,309 | | 3,082 | | | 19,043 | | 7,795 | |
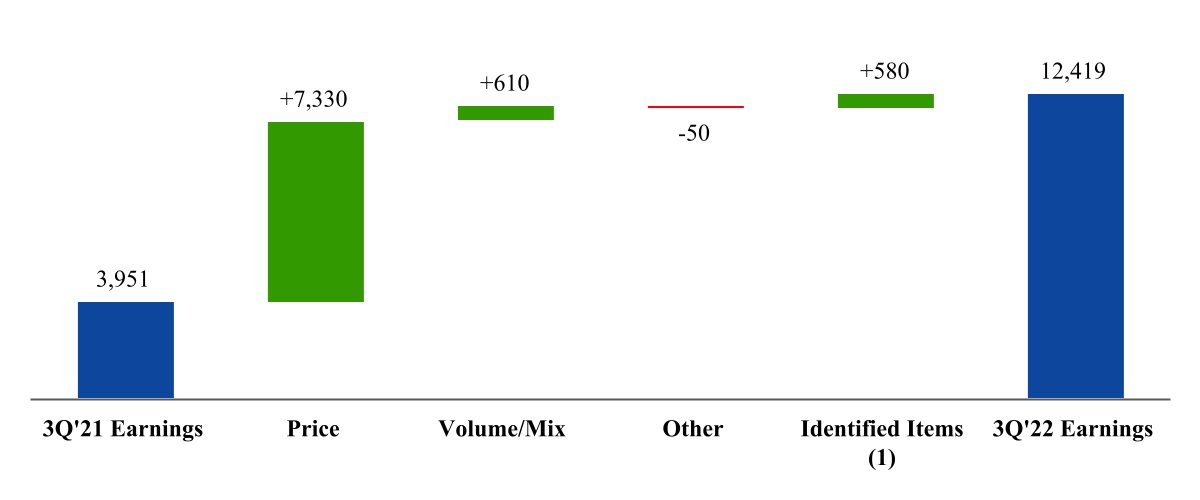
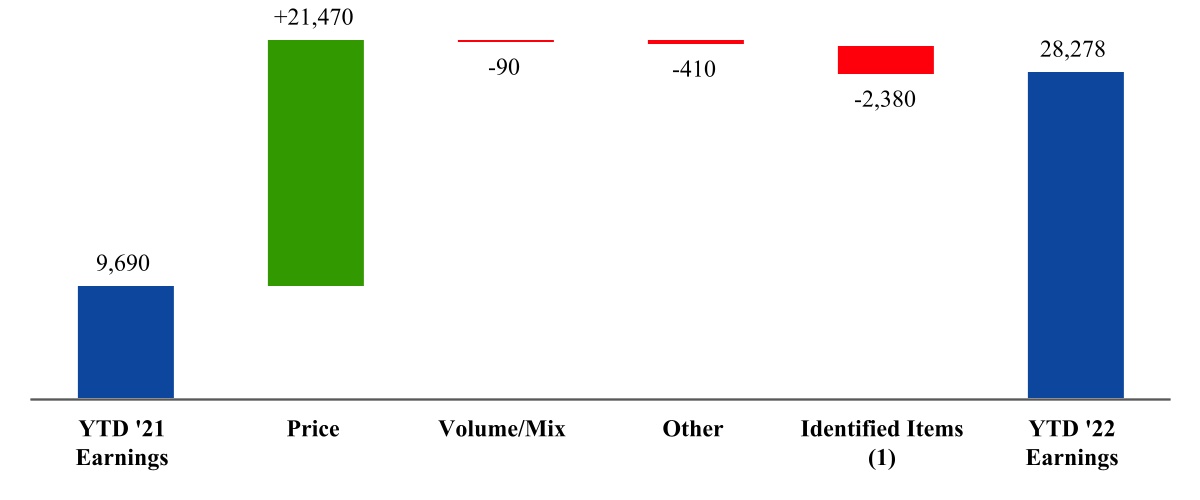
| Total | | 12,419 | | 3,951 | | | 28,278 | | 9,690 | |
| | | | | | |
Identified Items (1) | | | | | | |
| United States | | — | | — | | | 299 | | — | |
| Non-U.S. | | 578 | | — | | | (2,677) | | — | |
| Total | | 578 | | — | | | (2,378) | | — | |
| | | | | | |
Earnings (loss) excluding Identified Items (1) | | | | | | |
| United States | | 3,110 | | 869 | | | 8,936 | | 1,895 | |
| Non-U.S. | | 8,731 | | 3,082 | | | 21,720 | | 7,795 | |
| Total | | 11,841 | | 3,951 | | | 30,656 | | 9,690 | |
| | | | | | | | | | | | | | |
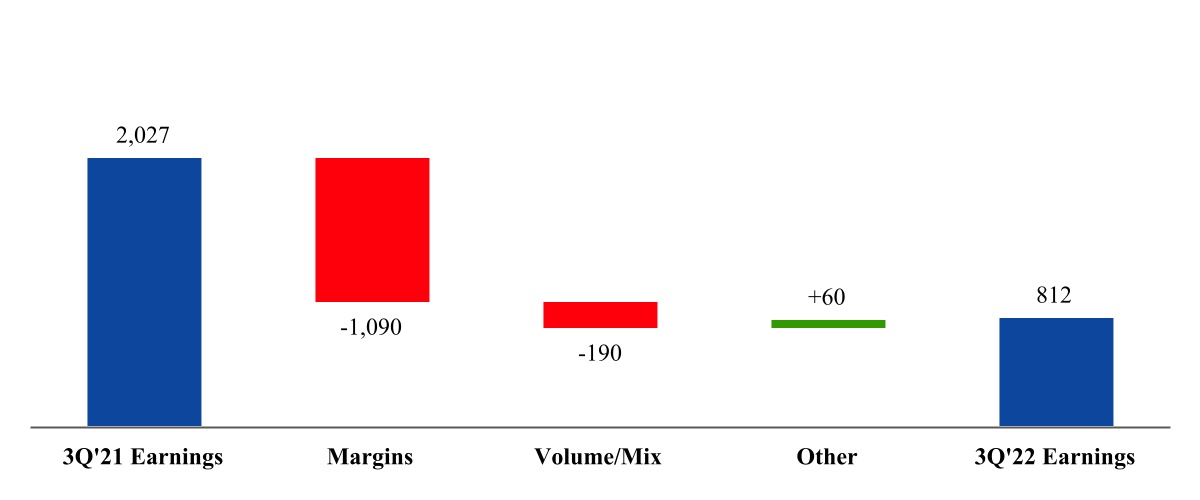
Upstream Third Quarter Earnings Factor Analysis | | |
| (millions of dollars) | | | | |
Price – Higher realizations increased earnings by $7,330 million as average natural gas realizations increased 172%, while realizations for crude oil increased 39%.
Volume/Mix – Higher volumes increased earnings by $610 million, reflecting growth in Guyana and Permian and eased curtailments, partly offset by planned and unplanned downtime and divestments.
Other – All other items decreased earnings by $50 million.
Identified Items (1) – 3Q 2022 $580 million gain on the sale of Romania and XTO Energy Canada assets and one-time benefits from tax and other reserve adjustments, partly offset by impairments.
(1) Refer to Functional Earnings Summary for definition of Identified Items and earnings (loss) excluding Identified Items.
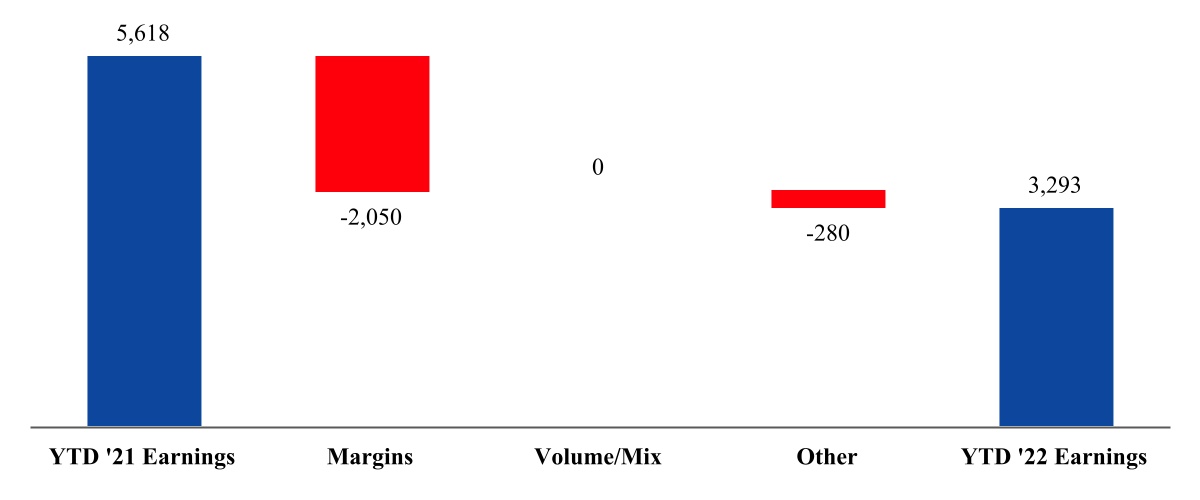
| | | | | | | | | | | | | | |
| Upstream Year-to-Date Earnings Factor Analysis | | |
| (millions of dollars) | | | | |
Price – Higher realizations increased earnings by $21,470 million as average realizations for crude oil increased 58% and natural gas realizations increased 167%.
Volume/Mix – Unfavorable volume and mix effects decreased earnings by $90 million, as growth in Guyana and Permian and eased curtailments nearly offset the impacts from the reduced Groningen gas production limit in Netherlands, Russia curtailments, higher downtime including the effects of weather in the first quarter, and lower entitlements due to higher prices.
Other – All other items decreased earnings by $410 million largely due to divestment-related impairments and the absence of prior year one-time tax impacts.
Identified Items (1) – 2022 $(2,380) million loss mainly driven by the first quarter impairment of the Russia Sakhalin-1 project, partly offset by gains on the sale of the U.S. Barnett Shale, Romania, and XTO Energy Canada assets and one-time benefits from tax and other reserve adjustments.
(1) Refer to Functional Earnings Summary for definition of Identified Items and earnings (loss) excluding Identified Items.
| | | | | | | | | | | | | | | | |
| Upstream Operational Results | | | | | | |
| | | | | | |
| (thousands of barrels daily) | | | Three Months Ended
September 30, 2022 | | | Nine Months Ended
September 30, 2022 |
Volumes reconciliation (Oil-equivalent production) (1) | | | | | | |
| 2021 | | | 3,665 | | | 3,677 |
| Entitlements - Net Interest | | | (27) | | | (28) |
| Entitlements - Price / Spend / Other | | | (52) | | | (53) |
| Government Mandates | | | 85 | | | 97 |
| Divestments | | | (75) | | | (58) |
| Growth / Demand / Other | | | 120 | | | 73 |
| 2022 | | | 3,716 | | | 3,708 |
| | | | | | |
(1)Natural gas is converted to an oil-equivalent basis at six million cubic feet per one thousand barrels. |
3Q 2022 versus 3Q 2021 - 3.7 million oil-equivalent barrels per day in 3Q 2022 increased 51 thousand oil-equivalent barrels per day from 3Q 2021 reflecting growth in Guyana and Permian, and easing government-mandated curtailments, partly offset by divestments and lower entitlements due to higher prices.
YTD 2022 versus YTD 2021 - 2022 year-to-date production of 3.7 million oil-equivalent barrels per day increased 31 thousand oil-equivalent barrels per day from year-to-date 2021 reflecting growth in Permian and Guyana and easing government-mandated curtailments, partly offset by divestments, lower entitlements due to higher prices, and higher downtime including the effects of weather in the first quarter of 2022.
Definitions
Listed below are descriptions of ExxonMobil’s volumes reconciliation factors which are provided to facilitate understanding of the terms.
Entitlements - Net Interest are changes to ExxonMobil’s share of production volumes caused by non-operational changes to volume-determining factors. These factors consist of net interest changes specified in Production Sharing Contracts (PSCs) which typically occur when cumulative investment returns or production volumes achieve defined thresholds, changes in equity upon achieving pay-out in partner investment carry situations, equity redeterminations as specified in venture agreements, or as a result of the termination or expiry of a concession. Once a net interest change has occurred, it typically will not be reversed by subsequent events, such as lower crude oil prices.
Entitlements - Price, Spend and Other are changes to ExxonMobil’s share of production volumes resulting from temporary changes to non-operational volume-determining factors. These factors include changes in oil and gas prices or spending levels from one period to another. According to the terms of contractual arrangements or government royalty regimes, price or spending variability can increase or decrease royalty burdens and/or volumes attributable to ExxonMobil. For example, at higher prices, fewer barrels are required for ExxonMobil to recover its costs. These effects generally vary from period to period with field spending patterns or market prices for oil and natural gas. Such factors can also include other temporary changes in net interest as dictated by specific provisions in production agreements.
Government Mandates are changes to ExxonMobil's sustainable production levels as a result of temporary non-operational production limits or sanctions imposed by governments, generally upon a country, sector, type or method of production.
Divestments are reductions in ExxonMobil’s production arising from commercial arrangements to fully or partially reduce equity in a field or asset in exchange for financial or other economic consideration.
Growth, Demand and Other comprise all other operational and non-operational factors not covered by the above definitions that may affect volumes attributable to ExxonMobil. Such factors include, but are not limited to, production enhancements from project and work program activities, acquisitions including additions from asset exchanges, downtime, market demand, natural field decline, and any fiscal or commercial terms that do not affect entitlements.
| | | | | | | | | | | | | | | | | | | | | | |
| | Three Months Ended
September 30, | | Nine Months Ended
September 30, |
| | | 2022 | | 2021 | | 2022 | | 2021 |
Net production of crude oil, natural gas liquids, bitumen and synthetic oil (thousands of barrels daily) | | | | | | | | |
| United States | | 783 | | | 758 | | | 771 | | | 704 | |
| Canada/Other Americas | | 641 | | | 569 | | | 558 | | | 557 | |
| Europe | | 4 | | | 21 | | | 4 | | | 24 | |
| Africa | | 249 | | | 248 | | | 243 | | | 252 | |
| Asia | | 666 | | | 668 | | | 698 | | | 676 | |
| Australia/Oceania | | 46 | | | 49 | | | 44 | | | 44 | |
| Worldwide | | 2,389 | | | 2,313 | | | 2,318 | | | 2,257 | |
| | | | | | | | |
Net natural gas production available for sale (millions of cubic feet daily) | | | | | | | | |
| United States | | 2,351 | | | 2,701 | | | 2,607 | | | 2,757 | |
| Canada/Other Americas | | 158 | | | 184 | | | 175 | | | 197 | |
| Europe | | 541 | | | 343 | | | 711 | | | 796 | |
| Africa | | 70 | | | 53 | | | 65 | | | 41 | |
| Asia | | 3,304 | | | 3,365 | | | 3,321 | | | 3,465 | |
| Australia/Oceania | | 1,539 | | | 1,464 | | | 1,460 | | | 1,266 | |
| Worldwide | | 7,963 | | | 8,110 | | | 8,339 | | | 8,522 | |
| | | | | | | | |
| | | | | | | | | |
Oil-equivalent production (1) (thousands of oil-equivalent barrels daily) | | 3,716 | | | 3,665 | | | 3,708 | | | 3,677 | |
| | | | | | | | |
| (1) Natural gas is converted to an oil-equivalent basis at six million cubic feet per one thousand barrels. |
ENERGY PRODUCTS
| | | | | | | | | | | | | | | | | | | | | | |
| Energy Products Financial Results | | | | | | | | |
| | | | | | | | |
| (millions of dollars) | | Three Months Ended
September 30, | | Nine Months Ended
September 30, |
| 2022 | | 2021 | | 2022 | | 2021 |
| Earnings (loss) (U.S. GAAP) | | | | | | | | |
| United States | | 3,008 | | | 479 | | | 6,152 | | | (31) | |
| Non-U.S. | | 2,811 | | | 50 | | | 4,744 | | | (1,217) | |
| Total | | 5,819 | | | 529 | | | 10,896 | | | (1,248) | |
| | | | | | | | |
| | | | | | | | |
| | | | | | | | |
| | | | | | | | |
| | | | | | | | |
| | | | | | | | |
Earnings (loss) excluding Identified Items (1) | | | | | | | | |
| United States | | 3,008 | | | 479 | | | 6,152 | | | (31) | |
| Non-U.S. | | 2,811 | | | 50 | | | 4,744 | | | (1,217) | |
| Total | | 5,819 | | | 529 | | | 10,896 | | | (1,248) | |
| | | | | | | | |
| (1) Refer to Functional Earnings Summary for definition of Identified Items and earnings (loss) excluding Identified Items. |
| | | | | | | | | | | | | | |
Energy Products Third Quarter Earnings Factor Analysis | | |
| (millions of dollars) | | | | |
Margins – Higher margins increased earnings by $5,050 million due to improved industry refining margins and positive derivative mark-to-market effects.
Volume/Mix – Favorable volume and mix effects increased earnings by $390 million, driven by increased throughput on strong reliability, improved product yields and lower turnaround activity.
Other – All other items decreased earnings by $150 million.
| | | | | | | | | | | | | | |
| Energy Products Year-to-Date Earnings Factor Analysis | | |
| (millions of dollars) | | | | |
Margins – Higher margins increased earnings by $10,870 million, driven by stronger industry refining margins and favorable derivative mark-to-market effects.
Volume/Mix – Favorable volume and mix effects increased earnings by $1,090 million, mainly as a result of strong reliability and lower scheduled maintenance.
Other – All other items increased earnings by $180 million, primarily due to the absence of terminal conversion impacts in the prior year.
| | | | | | | | | | | | | | | | | | | | |
| Energy Products Operational Results | | | | | | |
| | | | | | |
| (thousands of barrels daily) | | Three Months Ended
September 30, | | Nine Months Ended
September 30, |
| 2022 | 2021 | | 2022 | 2021 |
| Refinery throughput | | | | | | |
| United States | | 1,742 | | 1,684 | | | 1,705 | | 1,583 | |
| Canada | | 426 | | 404 | | | 413 | | 367 | |
| Europe | | 1,253 | | 1,215 | | | 1,204 | | 1,197 | |
| Asia Pacific | | 557 | | 585 | | | 542 | | 579 | |
| Other | | 187 | | 163 | | | 182 | | 162 | |
| Worldwide | | 4,165 | | 4,051 | | | 4,046 | | 3,888 | |
| | | | | | |
Energy Products sales (1) | | | | | | |
| United States | | 2,479 | | 2,361 | | | 2,399 | | 2,223 | |
| Non-U.S. | | 3,058 | | 2,941 | | | 2,922 | | 2,825 | |
| Worldwide | | 5,537 | | 5,302 | | | 5,321 | | 5,049 | |
| | | | | | |
| Gasoline, naphthas | | 2,335 | | 2,191 | | | 2,220 | | 2,102 | |
| Heating oils, kerosene, diesel | | 1,818 | | 1,796 | | | 1,766 | | 1,731 | |
| Aviation fuels | | 365 | | 228 | | | 335 | | 204 | |
| Heavy fuels | | 252 | | 276 | | | 243 | | 269 | |
| Other energy products | | 767 | | 811 | | | 758 | | 742 | |
| | | | | | |
(1) Data reported net of purchases/sales contracts with the same counterparty. | |
CHEMICAL PRODUCTS
| | | | | | | | | | | | | | | | | | | | | | |
| Chemical Products Financial Results | | | | | | | | |
| | | | | | | | |
| (millions of dollars) | | Three Months Ended
September 30, | | Nine Months Ended
September 30, |
| 2022 | | 2021 | | 2022 | | 2021 |
| Earnings (loss) (U.S. GAAP) | | | | | | | | |
| United States | | 635 | | | 1,121 | | | 2,030 | | | 2,923 | |
| Non-U.S. | | 177 | | | 907 | | | 1,263 | | | 2,695 | |
| Total | | 812 | | | 2,027 | | | 3,293 | | | 5,618 | |
| | | | | | | | |
| | | | | | | | |
| | | | | | | | |
| | | | | | | | |
| | | | | | | | |
| | | | | | | | |
Earnings (loss) excluding Identified Items (1) | | | | | | | | |
| United States | | 635 | | | 1,121 | | | 2,030 | | | 2,923 | |
| Non-U.S. | | 177 | | | 907 | | | 1,263 | | | 2,695 | |
| Total | | 812 | | | 2,027 | | | 3,293 | | | 5,618 | |
| | | | | | | | |
| (1) Refer to Functional Earnings Summary for definition of Identified Items and earnings (loss) excluding Identified Items. |
| | | | | | | | | | | | | | |
Chemical Products Third Quarter Earnings Factor Analysis | | |
| (millions of dollars) | | | | |
Margins – Lower margins decreased earnings by $1,090 million, reflecting lower prices and higher feed and energy costs.
Volume/Mix – Lower volumes decreased earnings by $190 million, reflecting softening market conditions.
Other – All other items increased earnings by $60 million, driven by lower expenses and net favorable one-time items, partly offset by unfavorable foreign exchange effects.
| | | | | | | | | | | | | | |
| Chemical Products Year-to-Date Earnings Factor Analysis | | |
| (millions of dollars) | | | | |
Margins – Lower margins decreased earnings by $2,050 million, reflecting higher feed and energy costs.
Volume/Mix – Flat.
Other – All other items decreased earnings by $280 million, primarily driven by higher project and planned maintenance expenses, and unfavorable foreign exchange effects.
| | | | | | | | | | | | | | | | | | | | | | |
| Chemical Products Operational Results | | | | | | | | |
| | | | | | | | |
| (thousands of metric tons) | | Three Months Ended
September 30, | | Nine Months Ended
September 30, |
| 2022 | | 2021 | | 2022 | | 2021 |
Chemical Products sales (1) | | | | | | | | |
| United States | | 1,658 | | | 1,807 | | | 5,688 | | | 5,210 | |
| Non-U.S. | | 3,023 | | | 3,007 | | | 8,821 | | | 9,100 | |
| Worldwide | | 4,680 | | | 4,814 | | | 14,509 | | | 14,309 | |
| | | | | | | | |
(1) Data reported net of purchases/sales contracts with the same counterparty. |
SPECIALTY PRODUCTS
| | | | | | | | | | | | | | | | | | | | | | |
| Specialty Products Financial Results | | | | | | | | |
| | | | | | | | |
| (millions of dollars) | | Three Months Ended
September 30, | | Nine Months Ended
September 30, |
| 2022 | | 2021 | | 2022 | | 2021 |
| Earnings (loss) (U.S. GAAP) | | | | | | | | |
| United States | | 306 | | | 247 | | | 784 | | | 689 | |
| Non-U.S. | | 456 | | | 592 | | | 871 | | | 1,454 | |
| Total | | 762 | | | 839 | | | 1,655 | | | 2,143 | |
| | | | | | | | |
| | | | | | | | |
| | | | | | | | |
| | | | | | | | |
| | | | | | | | |
| | | | | | | | |
Earnings (loss) excluding Identified Items (1) | | | | | | | | |
| United States | | 306 | | | 247 | | | 784 | | | 689 | |
| Non-U.S. | | 456 | | | 592 | | | 871 | | | 1,454 | |
| Total | | 762 | | | 839 | | | 1,655 | | | 2,143 | |
| | | | | | | | |
| (1) Refer to Functional Earnings Summary for definition of Identified Items and earnings (loss) excluding Identified Items. |
| | | | | | | | | | | | | | |
Specialty Products Third Quarter Earnings Factor Analysis | | |
| (millions of dollars) | | | | |
Margins – Lower margins decreased earnings by $60 million, primarily related to higher feed and energy expenses.
Volume/Mix – Favorable volume mix effects increased earnings by $20 million, mainly from higher finished lubes sales.
Other – All other items decreased earnings by $40 million.
| | | | | | | | | | | | | | |
| Specialty Products Year-to-Date Earnings Factor Analysis | | |
| (millions of dollars) | | | | |
Margins – Lower margins decreased earnings by $570 million, primarily related to lower industry basestock margins as a result of increased feed costs and energy prices.
Volume/Mix – Higher volume and favorable mix effects increased earnings by $110 million.
Other – All other items decreased earnings by $30 million.
| | | | | | | | | | | | | | | | | | | | | | |
| Specialty Products Operational Results | | | | | | | | |
| | | | | | | | |
| (thousands of metric tons) | | Three Months Ended
September 30, | | Nine Months Ended
September 30, |
| 2022 | | 2021 | | 2022 | | 2021 |
Specialty Products sales (1) | | | | | | | | |
| United States | | 483 | | | 471 | | | 1,594 | | | 1,476 | |
| Non-U.S. | | 1,434 | | | 1,424 | | | 4,430 | | | 4,356 | |
| Worldwide | | 1,917 | | | 1,896 | | | 6,024 | | | 5,832 | |
| | | | | | | | |
| (1) Data reported net of purchases/sales contracts with the same counterparty. | | |
CORPORATE AND FINANCING
| | | | | | | | | | | | | | | | | | | | | | |
| Corporate and Financing Financial Results | | | | | | | | |
| | | | | | | | |
| (millions of dollars) | | Three Months Ended
September 30, | | Nine Months Ended
September 30, |
| 2022 | | 2021 | | 2022 | | 2021 |
| | | | | | | | |
| Earnings (loss) (U.S. GAAP) | | (152) | | | (596) | | | (1,132) | | | (2,033) | |
Identified Items (1) | | 400 | | | (5) | | | 302 | | | (48) | |
Earnings (loss) excluding Identified Items (1) | | (552) | | | (591) | | | (1,434) | | | (1,985) | |
| | | | | | | | |
| (1) Refer to Functional Earnings Summary for definition of Identified Items and earnings (loss) excluding Identified Items. |
Corporate and Financing expenses were $152 million for the third quarter of 2022, $444 million lower than the third quarter of 2021, reflecting favorable one-time tax impacts.
Corporate and Financing expenses were $1,132 million for the first nine months of 2022, $901 million lower than 2021, primarily due to favorable one-time tax impacts, lower pension-related expenses and lower financing costs.
LIQUIDITY AND CAPITAL RESOURCES
| | | | | | | | | | | | | | | | | | |
| (millions of dollars) | | Three Months Ended
September 30, | | Nine Months Ended
September 30, |
| 2022 | | 2021 | | 2022 | | 2021 |
| Net cash provided by/(used in) | | | | | | | | |
| Operating activities | | | | | | 59,176 | | | 31,005 | |
| Investing activities | | | | | | (9,387) | | | (8,125) | |
| Financing activities | | | | | | (25,177) | | | (22,464) | |
| Effect of exchange rate changes | | | | | | (950) | | | (12) | |
| Increase/(decrease) in cash and cash equivalents | | | | | | 23,662 | | | 404 | |
| | | | | | | | |
| Cash and cash equivalents (at end of period) | | | | | | 30,464 | | | 4,768 | |
| | | | | | | | |
| Cash flow from operations and asset sales | | | | | | | | |
| Net cash provided by operating activities (U.S. GAAP) | | 24,425 | | | 12,091 | | | 59,176 | | | 31,005 | |
| Proceeds associated with sales of subsidiaries, property, plant & equipment, and sales and returns of investments | | 2,682 | | | 18 | | | 3,914 | | | 575 | |
| Cash flow from operations and asset sales | | 27,107 | | | 12,109 | | | 63,090 | | | 31,580 | |
| | | | | | | | |
| Because of the ongoing nature of our asset management and divestment program, we believe it is useful for investors to consider proceeds associated with asset sales together with cash provided by operating activities when evaluating cash available for investment in the business and financing activities, including shareholder distributions. |
Cash flow from operations and asset sales in the third quarter of 2022 was $27.1 billion, an increase of $15.0 billion from the comparable 2021 period primarily reflecting higher earnings.
Cash provided by operating activities totaled $59.2 billion for the first nine months of 2022, $28.2 billion higher than 2021. Net income including noncontrolling interests was $44.5 billion, an increase of $30.0 billion from the prior year period. The adjustment for the noncash provision of $19.0 billion for depreciation and depletion was up $4.0 billion from 2021. Changes in operational working capital were immaterial, compared to a contribution of $2.2 billion in the prior year period. All other items net decreased cash flows by $4.3 billion in 2022 versus a reduction of $0.7 billion in 2021. See the Condensed Consolidated Statement of Cash Flows for additional details.
Investing activities for the first nine months of 2022 used net cash of $9.4 billion, an increase of $1.3 billion compared to the prior year. Spending for additions to property, plant and equipment of $12.6 billion was $4.6 billion higher than 2021. Proceeds from asset sales were $3.9 billion, which included the recent sale of our Romania Upstream affiliate as well as the sale of XTO Energy Canada. Net investments and advances were essentially flat with prior year.
Net cash used in financing activities was $25.2 billion in the first nine months of 2022, including $10.5 billion for the purchase of 120.4 million shares of ExxonMobil stock, as part of the previously announced buyback program. This compares to net cash used in financing activities of $22.5 billion in the prior year, reflecting net debt repayments of $10.8 billion during the first nine months of 2021. Total debt at the end of the third quarter of 2022 was $45.4 billion compared to $47.7 billion at year-end 2021. The Corporation's debt to total capital ratio was 19.0 percent at the end of the third quarter of 2022 compared to 21.4 percent at year-end 2021. The net debt to capital ratio was 7.2 percent at the end of the third quarter, a decrease of 11.7 percentage points from year-end 2021. The Corporation's capital allocation priorities continue to be investing in advantaged projects, strengthening the balance sheet and paying a reliable dividend.
The Corporation has access to significant capacity of long-term and short-term liquidity. In addition to cash balances, commercial paper continues to provide short-term liquidity, and is reflected in "Notes and loans payable" on the Consolidated Balance Sheet. Cash and cash equivalents was $30.5 billion at the end of the third quarter of 2022. The Corporation had undrawn short-term committed lines of credit of $0.5 billion and undrawn long-term committed lines of credit of $0.4 billion as of third quarter 2022.
The Corporation distributed a total of $11.2 billion to shareholders in the first nine months of 2022 through dividends.
The Corporation, as part of its ongoing asset management program, continues to evaluate its mix of assets for potential upgrade. Because of the ongoing nature of this program, dispositions will continue to be made from time to time which will result in either gains or losses. Additionally, the Corporation continues to evaluate opportunities to enhance its business portfolio through acquisitions of assets or companies, and enters into such transactions from time to time. Key criteria for evaluating acquisitions include potential for future growth and attractive current valuations. Acquisitions may be made with cash, shares of the Corporation’s common stock, or both.
Litigation, other contingencies, and contractual obligations are discussed in Note 3 to the unaudited condensed consolidated financial statements.
TAXES
| | | | | | | | | | | | | | | | | | |
| | | | | | | | |
| | | | | | | | |
| (millions of dollars) | | Three Months Ended
September 30, | | Nine Months Ended
September 30, |
| 2022 | | 2021 | | 2022 | | 2021 |
| Income taxes | | 5,224 | | | 2,664 | | | 14,389 | | | 4,986 | |
| Effective income tax rate | | 29 | % | | 33 | % | | 31 | % | | 32 | % |
Total other taxes and duties (1) | | 7,473 | | | 8,572 | | | 23,701 | | | 24,296 | |
| Total | | 12,697 | | | 11,236 | | | 38,090 | | | 29,282 | |
| | | | | | | | |
(1) Includes “Other taxes and duties” plus taxes that are included in “Production and manufacturing expenses” and “Selling, general and administrative expenses”. |
Total taxes were $12.7 billion for the third quarter of 2022, an increase of $1.5 billion from 2021. Income tax expense was $5.2 billion compared to $2.7 billion in the prior year reflecting higher commodity prices. The effective income tax rate of 29 percent compared to 33 percent in the prior year period primarily due to a change in mix of results in jurisdictions with varying tax rates. Total other taxes and duties decreased by $1.1 billion to $7.5 billion.
Total taxes were $38.1 billion for the first nine months of 2022, an increase of $8.8 billion from 2021. Income tax expense increased by $9.4 billion to $14.4 billion reflecting higher commodity prices. The effective income tax rate of 31 percent compared to 32 percent in the prior year period. Total other taxes and duties decreased by $0.6 billion to $23.7 billion.
In the United States, the Corporation has various ongoing U.S. federal income tax positions at issue with the Internal Revenue Service (IRS) for tax years beginning in 2006. The Corporation filed a refund suit for tax years 2006-2009 in U.S. federal district court (District Court) with respect to the positions at issue for those years. On February 24, 2020, the Corporation received an adverse ruling on this suit. The IRS has asserted penalties associated with several of those positions. The Corporation has not recognized the penalties as an expense because the Corporation does not expect the penalties to be sustained under applicable law. On January 13, 2021, the District Court ruled that no penalties apply to the Corporation's positions in this suit. The Corporation and the government have appealed the District Court's rulings to the U.S. Court of Appeals for the Fifth Circuit (Fifth Circuit). On August 3, 2022, the Fifth Circuit ruled adversely to the Corporation on its positions, but confirmed that no penalties apply. On September 30, 2022, the Fifth Circuit denied the Corporation’s request that the Fifth Circuit reconsider its opinion on one position. The Corporation and the government now have the right to request that the U.S. Supreme Court review the Fifth Circuit’s decision.
On March 4, 2022, the Corporation also filed a refund suit for tax years 2010-2011 in District Court with respect to the positions at issue for those years. The Corporation has not recognized asserted penalties for 2010-2011 as an expense because the Corporation does not expect the penalties to be sustained under applicable law. Unfavorable resolution of all positions at issue with the IRS would not have a material adverse effect on the Corporation’s operations or financial condition.
CAPITAL AND EXPLORATION EXPENDITURES
| | | | | | | | | | | | | | | | | | |
| | | | | | | | |
| | | | | | | | |
| (millions of dollars) | | Three Months Ended
September 30, | | Nine Months Ended
September 30, |
| 2022 | | 2021 | | 2022 | | 2021 |
| Upstream (including exploration expenses) | | 4,081 | | | 2,839 | | | 11,587 | | | 8,013 | |
| Energy Products | | 590 | | | 434 | | | 1,662 | | | 1,312 | |
| Chemical Products | | 954 | | | 534 | | | 1,809 | | | 1,345 | |
| Specialty Products | | 87 | | | 43 | | | 166 | | | 115 | |
| Other | | 16 | | | 1 | | | 17 | | | 2 | |
| Total | | 5,728 | | | 3,851 | | | 15,241 | | | 10,787 | |
Capital and exploration expenditures in the third quarter of 2022 were $5.7 billion, up 49 percent from the third quarter of 2021.
Capital and exploration expenditures in the first nine months of 2022 were $15.2 billion, up 41 percent from the first nine months of 2021. The Corporation plans to invest in the range of $21 billion to $24 billion in 2022. Actual spending could vary depending on the progress of individual projects and property acquisitions.
FORWARD-LOOKING STATEMENTS
Statements related to outlooks; projections; descriptions of strategic, operating, and financial plans and objectives; statements of future ambitions and plans; and other statements of future events or conditions, are forward-looking statements. Similarly, discussion of future carbon capture, biofuel and hydrogen plans to drive towards net zero emissions are dependent on future market factors, such as continued technological progress and policy support, and represent forward-looking statements. Actual future results, including financial and operating performance; total capital expenditures and mix, including allocations of capital to low carbon solutions; cost reductions and efficiency gains, including the ability to offset inflationary pressure; plans to reduce future emissions and emissions intensity; timing and outcome of projects to capture and store CO2, and produced biofuels; timing and outcome of hydrogen projects; cash flow, dividends and shareholder returns, including the timing and amounts of share repurchases; the ultimate outcome of contingencies and other estimates of future costs or savings; future debt levels and credit ratings; business and project plans, timing, costs, capacities and returns; and resource recoveries and production rates could differ materially due to a number of factors. These include global or regional changes in the supply and demand for oil, natural gas, petrochemicals, and feedstocks and other market conditions that impact prices and differentials for our products; government policies supporting lower carbon investment opportunities such as the U.S. Inflation Reduction Act or policies limiting the attractiveness of future investment such as the European Solidarity Tax; variable impacts of trading activities on our margins and results each quarter; actions of competitors and commercial counterparties; the outcome of commercial negotiations, including final agreed terms and conditions; the ability to access debt markets; the ultimate impacts of COVID-19, including effects of government responses on people and economies; reservoir performance, including variability and timing factors applicable to unconventional resources; the outcome of exploration projects and decisions to invest in future reserves; timely completion of development and other construction projects; final management approval of future projects and any changes in the scope, terms, or costs of such projects as approved; changes in law, taxes, or regulation including environmental regulations, trade sanctions, and timely granting of governmental permits and certifications; government policies and support and market demand for low carbon technologies; war, and other political or security disturbances; expropriations, seizure, or capacity, insurance or shipping limitations by foreign governments or laws; opportunities for potential investments or divestments and satisfaction of applicable conditions to closing, including regulatory approvals; the capture of efficiencies within and between business lines and the ability to maintain near-term cost reductions as ongoing efficiencies; unforeseen technical or operating difficulties and unplanned maintenance; the development and competitiveness of alternative energy and emission reduction technologies; the results of research programs and the ability to bring new technologies to commercial scale on a cost-competitive basis; and other factors discussed under Item 1A. Risk Factors of ExxonMobil’s 2021 Form 10-K.
Forward-looking and other statements regarding our environmental, social and other sustainability efforts and aspirations are not an indication that these statements are necessarily material to investors or requiring disclosure in our filing with the SEC. In addition, historical, current, and forward-looking environmental, social and sustainability-related statements may be based on standards for measuring progress that are still developing, internal controls and processes that continue to evolve, and assumptions that are subject to change in the future, including future rule-making.
The term “project” as used in this report can refer to a variety of different activities and does not necessarily have the same meaning as in any government payment transparency reports.
ITEM 3. QUANTITATIVE AND QUALITATIVE DISCLOSURES ABOUT MARKET RISK
Information about market risks for the nine months ended September 30, 2022, does not differ materially from that discussed under Item 7A of the registrant's Annual Report on Form 10-K for 2021.
ITEM 4. CONTROLS AND PROCEDURES
As indicated in the certifications in Exhibit 31 of this report, the Corporation’s Chief Executive Officer, Chief Financial Officer and Principal Accounting Officer have evaluated the Corporation’s disclosure controls and procedures as of September 30, 2022. Based on that evaluation, these officers have concluded that the Corporation’s disclosure controls and procedures are effective in ensuring that information required to be disclosed by the Corporation in the reports that it files or submits under the Securities Exchange Act of 1934, as amended, is accumulated and communicated to them in a manner that allows for timely decisions regarding required disclosures and are effective in ensuring that such information is recorded, processed, summarized and reported within the time periods specified in the Securities and Exchange Commission’s rules and forms. There were no changes during the Corporation’s last fiscal quarter that materially affected, or are reasonably likely to materially affect, the Corporation’s internal control over financial reporting.
PART II. OTHER INFORMATION
ITEM 1. LEGAL PROCEEDINGS
ExxonMobil has elected to use a $1 million threshold for disclosing environmental proceedings.
As reported in the Corporation’s Form 10-Q for the first quarter of 2021, ExxonMobil appealed to the U.S. Court of Appeals for the Fifth Circuit a judgment of the United States District Court for the Southern District of Texas entered on April 26, 2017, in a citizen suit captioned Environment Texas Citizen Lobby, Inc. et al. v. Exxon Mobil Corporation. The U.S. District Court had awarded approximately $20 million in civil penalties, payable to the United States Treasury. The suit, originally filed in December 2010, related to alleged violations by ExxonMobil of air operating permits, the Texas State Implementation Plan and the Clean Air Act at the Baytown Refinery in Texas, and claims related to alleged delay in the implementation of certain environmental improvement projects. On July 29, 2020, the Fifth Circuit vacated the U.S. District Court’s penalty award and remanded the case back to the District Court for further proceedings. On March 2, 2021, the U.S. District Court awarded $14.25 million in civil penalties, payable to the United States Treasury. ExxonMobil filed its appeal of the judgment in the U.S. Court of Appeals for the Fifth Circuit on April 12, 2021. On August 30, 2022, the Fifth Circuit affirmed the U.S. District Court’s revised penalty award of $14.25 million. On October 13, 2022, ExxonMobil filed a motion for rehearing en banc.
As reported in the Corporation’s Form 10-Q for the first quarter of 2022, on February 22, 2022, the Oil Conservation Division of the New Mexico Department of Energy, Minerals and Natural Resources (the “Department”) announced that it issued notices of violation and cumulative associated administrative civil penalties of $2.25 million to XTO Permian Operating, LLC (“XTO”) alleging XTO failed to comply with certain operational and reporting requirements relating to four salt water disposal wells. Effective August 15, 2022, XTO and the Department settled the notices of violation and additional self-reported potential violations for an administrative civil penalty of $1.77 million.
As reported in the Corporation’s Form 10-Q for the third quarter of 2020, the State of Texas filed a lawsuit against ExxonMobil Oil Corporation (EMOC) on August 19, 2020, seeking penalties and injunctive relief in connection with alleged unauthorized emissions events at EMOC’s Beaumont Refinery in Texas from 2017 to 2020. The lawsuit, captioned State of Texas v. ExxonMobil Oil Corporation, was filed in the 98th Judicial District Court of Travis County, Texas. At the time of the previous report, the State had not quantified the amount of the penalty sought. In October 2022, the State amended its petition to seek additional penalties for additional alleged violations and for an aggregate demand in excess of $1 million.
On January 3, 2022, the State of Texas, acting by and through its Attorney General, on behalf of the Texas Commission on Environmental Quality, (“State”), filed a lawsuit against the Corporation (captioned State of Texas v. Exxon Mobil Corporation) in Travis County, 126th Judicial District Court for alleged violations of the Texas Clean Air Act, ExxonMobil’s permits and promulgated regulations. The original complaint alleged that from December 21-23, 2021, a pipeline containing vaporized naphtha at the Baytown Refinery leaked, and that a spark in the course of repairs caused an explosion. In August 2022, the State amended its petition to seek additional penalties for additional alleged permit and regulatory violations in connection with unrelated subsequent emission events at the refinery, for an aggregate amount in excess of $1 million.
Refer to the relevant portions of Note 3 of this Quarterly Report on Form 10-Q for further information on legal proceedings.
ITEM 2. UNREGISTERED SALES OF EQUITY SECURITIES AND USE OF PROCEEDS
| | | | | | | | | | | | | | | | | | |
Issuer Purchase of Equity Securities for Quarter Ended September 30, 2022 |
| | | | | | | | |
| Period | | Total Number of Shares Purchased(1) | | Average Price Paid per Share(2) | | Total Number of Shares Purchased as Part of Publicly Announced Plans or Programs (3) | | Approximate Dollar Value of Shares that May Yet Be Purchased Under the Program
(Billions of dollars) |
| July 2022 | | 16,157,299 | | $86.97 | | 16,157,219 | | $22.5 |
| August 2022 | | 17,193,196 | | $93.80 | | 17,193,188 | | $20.9 |
| September 2022 | | 16,006,749 | | $92.18 | | 16,006,703 | | $19.4 |
| Total | | 49,357,244 | | $91.04 | | 49,357,110 | | |
| | | | | | | | |
| (1) Includes shares withheld from participants in the company's incentive program for personal income taxes. |
| (2) The full-year average price paid per share is $88.08. |
| (3) In its earnings release dated April 29, 2022, the Corporation stated that the company increased its share repurchase program from up to $10 billion to a total of up to $30 billion through 2023. Purchases in the third quarter of 2022 were made under terms intended to qualify for exemption under Rules 10b-18 and 10b5-1. |
During the third quarter, the Corporation did not issue or sell any unregistered equity securities.
ITEM 6. EXHIBITS
See Index to Exhibits of this report.
INDEX TO EXHIBITS
| | | | | | | | |
| Exhibit | | Description |
| | | |
| | By-Laws, as amended effective October 25, 2022 (incorporated by reference to Exhibit 3(ii) to the Registrant’s Report on Form 8-K of October 31, 2022). |
| | |
| | |
| | |
| | |
| | Certification (pursuant to Securities Exchange Act Rule 13a-14(a)) by Chief Executive Officer. |
| | Certification (pursuant to Securities Exchange Act Rule 13a-14(a)) by Chief Financial Officer. |
| | Certification (pursuant to Securities Exchange Act Rule 13a-14(a)) by Principal Accounting Officer. |
| | Section 1350 Certification (pursuant to Sarbanes-Oxley Section 906) by Chief Executive Officer. |
| | Section 1350 Certification (pursuant to Sarbanes-Oxley Section 906) by Chief Financial Officer. |
| | Section 1350 Certification (pursuant to Sarbanes-Oxley Section 906) by Principal Accounting Officer. |
| 101 | | Interactive Data Files (formatted as Inline XBRL). |
| 104 | | Cover Page Interactive Data File (formatted as Inline XBRL and contained in Exhibit 101). |
SIGNATURE
Pursuant to the requirements of the Securities Exchange Act of 1934, the Registrant has duly caused this report to be signed on its behalf by the undersigned, thereunto duly authorized.
| | | | | | | | |
| | EXXON MOBIL CORPORATION |
Date: November 2, 2022 | By: | /s/ LEN M. FOX |
| | | Len M. Fox |
| | | Vice President, Controller and |
| | | Principal Accounting Officer |